 Bo Lu
Bo Lu Shiyuan Fan3
 Yu Chen
- 1College of Architecture and Urban Planning, Hunan City University, Yiyang, China
- 2Key Laboratory of Urban Planning Information Technology of Hunan Provincial Universities, Yiyang, China
- 3College of Architecture and Urban Planning, Tongji University, Shanghai, China
- 4College of Civil Engineering, Tongji University, Shanghai, China
- 5Shanghai Construction Engineering Survey and Design Management Center, Shanghai, China
- 6Shanghai Shentong Metro Group Co. Ltd., Shanghai, China
- 7Key Laboratory of Digital Urban and Rural Spatial Planning of Hunan Province, Yiyang, China
Introduction: Understanding how the built environment influences older adults’ mobility is vital for inclusive transport planning in aging, high-density cities. This study explores the determinants of metro travel patterns among older adults in Shanghai.
Methods: This study employed large-scale metro smart card data from Shanghai and applied a Geographically Weighted Random Forest model with SHAP interpretability. Older adults’ travel chains were reconstructed to identify destination stations. Nonlinear and interaction effects were analyzed, and clustering was used to classify stations by population density and ridership.
Results: Functional facilities, particularly shopping, living services, and government institutions, were the strongest drivers of metro use. In contrast, traditional density measures such as intersection density and floor area ratio showed limited impact due to saturation effects in highly developed urban areas. Nonlinear analysis revealed threshold effects, with moderate provision of facilities and green spaces preferred over excessive density. Interaction analysis demonstrated synergistic or suppressive effects between POI diversity and intersection density. Clustering further identified distinct station types, highlighting spatial heterogeneity in built environment influences.
Conclusion: Integrating GWRF with SHAP provides robust insights into spatially varying and nonlinear effects on older adults’ metro travel. Findings highlight the primacy of functional facilities over density measures and the importance of threshold and interaction effects. These results offer evidence to guide age-friendly and targeted transport policies in rapidly urbanizing contexts.
1 Introduction
The World Health Organization projects that by 2050, the global population aged 60 and above will surpass 2.1 billion, accounting for approximately 22% of the world’s population (WHO, 2024). Older adults often encounter challenges such as declining physical and cognitive abilities and limited financial resources, which amplify mobility barriers in complex urban environments (Clarke and Gallagher, 2013). This demographic transformation represents systemic challenges to urban systems, particularly in rapidly urbanizing cities undergoing continuous renewal. Traditional services like transportation, housing, and healthcare must enhance their adaptability and inclusivity to address these evolving needs.
High-density cities, characterized by compact spatial layouts and integrated multifunctional public service systems, provide residents with convenient and efficient access to urban amenities (Kesarovski and Hernandez, 2023). Among these services, metro systems serve as the backbone of urban travel, offering fast, reliable, and relatively low-cost public transportation. For older adults, metro networks not only extend travel ranges but also promote social engagement, thereby enhancing overall quality of life and wellbeing (Diao et al., 2024). In response to the growing travel demands of aging populations, many metropolitan areas have implemented policy initiatives to improve transit accessibility for seniors. For example, Shanghai’s “Baotong Card,” (Government PNA, 2017) allows individuals aged 70 and above to ride the metro free of charge after a nominal insurance payment. Similarly, Seoul and other major South Korean cities provide complimentary metro services for those aged 65 and older (Haan, 2024). These measures reflect a proactive shift toward more inclusive and age-friendly public transportation systems.
The widespread use of smart cards has enabled researchers to analyze large-scale travel data, revealing distinctive trip patterns among older adults, such as shorter trip distances, a preference for off-peak travel, and an emphasis on pedestrian safety and station accessibility (Shi et al., 2022). Grounded in the socio-ecological model (Cerin et al., 2017) and the “5D” framework (density, diversity, design, destination accessibility, and distance) (Ewing and Cervero, 2010; Chen et al., 2022), key built environment (BE) factors, such as land-use mix, service accessibility, pedestrian infrastructure, connectivity, safety, and aesthetics, significantly influence older adults’ travel behavior (Cerin et al., 2017; Cheng et al., 2021). Research indicates that high-density environments and areas with concentrated commercial facilities generally encourage metro use among older adults, though overcrowding or spatial complexity may reduce travel willingness through nonlinear effects (Shi et al., 2022; Yang et al., 2024). These findings offer valuable insights into the dynamics of older adult’s metro travel within dense urban environments.
However, several limitations persist in the existing studies. First, most studies have concentrated on the BE factor’s impact on walking or physical activity among older adults, with relatively little attention to metro travel, a mode involving longer distances and more complex travel chains. In particular, the potential interaction effects of the BE in high-density urban settings remain insufficiently explored. Second, prior research typically relies on aggregate indicators such as older adults’ ridership at the station level or average trip duration, lacking individual-level travel chain data to accurately identify both origins and destinations. This limitation hinders a comprehensive understanding of actual travel patterns and needs among older adults. Lastly, from a methodological perspective, many studies adopt traditional linear regression or global models, which are insufficient for capturing the nonlinear relationships and spatial heterogeneity that may characterize the influence of BE factors on older adults’ metro travel in dense urban environments.
This study addresses these limitations by leveraging Shanghai’s metro smart card data to construct older adults’ travel chains and identify typical origin–destination patterns. An advanced spatially informed machine learning model is employed to examine BE effects from both global and local perspectives. The research questions are: WHO (2024) How can older adults’ travel patterns in high-density cities be accurately identified using smart card-based travel chains? (Clarke and Gallagher, 2013) What are the nonlinear and interaction effects of BE factors surrounding metro stations on older adults’ metro travel in high-density urban contexts? (Kesarovski and Hernandez, 2023) How do the effects of various BE factors differ across development environments with varying urban density?
This study aims to uncover the complex mechanisms through which the BE shapes older adults’ metro travel behavior, enriching the methodological and theoretical frameworks for aging mobility research from a transit-oriented perspective. The findings also provide methodological tools and empirical evidence to support the development of inclusive, equitable, and health-oriented age-friendly urban transportation systems.
The remainder of this paper is organized as follows: Section 2 reviews relevant literature; Section 3 introduces the data and methodology; Section 4 presents the research results; Section 5 offers a detailed discussion, policy implications, and conclusion.
2 Literature review
2.1 Travel chain analysis of older adults’ metro travel characteristics
Compared to traditional methods such as surveys and field audits, smart card data offers a highly efficient, high-frequency, and large-scale method of capturing users’ travel trajectories. By extracting key travel attributes, constructing travel chains, and applying appropriate origin–destination (OD) inference algorithms, researchers can reveal periodic travel patterns of specific user groups. This approach enables a more accurate reflection of behavioral characteristics and underlying travel motivations, making it a powerful tool for analyzing collective travel structures and behavioral regularities (Agard et al., 2006; Lei et al., 2020).
Existing studies typically employ rule-based inference or probabilistic models to reconstruct complete OD chains, frequently in conjunction with techniques such as Markov models, clustering analysis, and frequency domain analysis to identify users’ regular behaviors and stable activity nodes (Agard et al., 2006). For instance, Li et al. (2021) developed a deep spatiotemporal modeling framework incorporating Fourier transform to infer passengers’ age distribution and residential areas.
Research has shown that older adults’ metro travel is characterized by relatively short distances, multipurpose trips, and low travel frequency, with a strong preference for off-peak periods (Shi et al., 2022; Peng et al., 2024). These patterns are closely related to the older adults’ daily routines, physical conditions, and sensitivity to comfort in the transit environment. In recent years, few scholars have integrated BE features, spatiotemporal attributes, and transit facility distribution into correlation analyses to reveal the spatial mechanisms underlying travel differences among older adults. For example, Huang et al. (2024) used Kunming metro smart card data to construct individual activity spaces and found that older adult riders had more spatially concentrated activity zones compared to other groups.
In terms of travel chain structures, older adult riders tend to exhibit relatively simple OD patterns, most commonly a binary loop of “origin–destination–origin.” In contrast, younger and middle-aged populations are more likely to engage in multi-loop or multi-node travel chains (Huang et al., 2024; Schmöcker et al., 2010). For instance, Wei et al. (2024) constructed travel networks based on Beijing bus smart card data and found that older adults demonstrated more spatially confined activity spaces, lower network connectivity, and weaker interaction intensity compared to younger users.
Although prior studies have provided preliminary insights into the travel chain structures of the older adults, most methodologies still rely on rule-based matching or fixed time thresholds. Systematic efforts to infer older adult riders’ travel destinations and behavioral motivations based on smart card data remain limited. Therefore, developing OD inference and behavioral modeling methods tailored to older adult riders from a travel chain perspective can offer deeper understanding of the linkages between metro travel behavior and surrounding BE.
2.2 Built environment influences on metro travel among older adults
The relationship between the BE and older adults’ active travel, physical health and mental wellbeing has been extensively studied in urban planning, public health, and transportation engineering (Clarke and Gallagher, 2013; Cerin et al., 2017). Studies have shown that the built environment has a greater influence on older adults’ active travel behavior compared to younger adults (Cheng et al., 2019).
Building on the socio-ecological model, Cervero and Kockelman (1997) proposed the “3D” framework: density, diversity, and design to analyze BE influences on travel behavior. This was later extended to include destination accessibility and distance to transit, forming the “5D” model (Ewing and Cervero, 2010; Chen et al., 2022), and further refined to the “5D + S” model with spatial access (Kang, 2018). These frameworks are widely applied to study how BE attributes, such as development density, land-use mix, accessibility, design quality, and transit connectivity, shape travel behavior, particularly among older adults. Research consistently shows that these factors influence older adults’ travel decisions by enhancing perceived convenience, safety, and environmental quality (Cerin et al., 2017; Cheng et al., 2021). Some studies have introduced the public facilities index measured through POI (Point of Interest) diversity to evaluate how service availability affects travel behavior. Findings suggest that travel frequency among older adults is positively associated with the quantity and diversity of POIs in a given area, especially those related to daily living services and cultural amenities (Shi et al., 2021).
In recent years, machine learning methods, such as decision trees and gradient boosting have gained prominence in travel behavior studies due to their strong capacity for modeling complex nonlinear relationships (Guo et al., 2023; Yang et al., 2024). However, these methods are often noted as “black box” models, lacking interpretability regarding internal decision mechanisms. To address this, researchers have introduced model-agnostic interpretability tools such as SHAP (SHapley Additive exPlanations) and LIME (Local Interpretable Model-Agnostic Explanations), which provide global or local explanations of feature contributions to model predictions.
Evidence from high-density urban contexts suggests that BE factors can significantly enhance metro use among older adults, but these effects often exhibit nonlinear threshold characteristics. For example, Yang et al. (2022) found that BE factors, such as density and land-use mix, exhibit nonlinear effects on older adults’ metro travel, with stronger influences in medium- to high-density areas. Similarly, Gong et al. (2016) found that older adults’ access to urban green spaces in Hong Kong exhibits nonlinear threshold effects, with usage and health benefits declining when green space fragmentation and dispersion exceed specific thresholds.
While global models provide useful insights into variable importance and overall patterns, the urban BE is inherently spatially heterogeneous due to uneven resource allocation and functional zoning. Consequently, the same variable may exert different influences depending on local context. For instance, Guo et al. (2023) reported varying thresholds and response gradients for variables such as road density and transit accessibility between inner and outer Xiamen, with sociodemographic factors further moderating these effects. Yang et al. (2022) found that subcenter distance and floor area ratio had a positive effect on older adults’ ridership, while station opening hours and betweenness centrality exerted negative impacts. However, most studies to date have not adequately accounted for spatial heterogeneity, limiting our understanding of spatially nuanced mechanisms underlying older adults’ travel behavior.
Building on these insights, this study integrates a modified Geographically Weighted Random Forest (GWRF) model (Nduwayezu et al., 2023), which combines the spatial heterogeneity modeling of Geographically Weighted Regression (GWR) with the nonlinear capabilities of Random Forests. GWRF generates localized random forest sub-models for each geographic point, capturing spatial variations in variable effects. Coupled with SHAP explanations (Lundberg, 2017), it enables location-specific rankings of variable importance and analysis of nonlinear interactions, offering a spatially targeted lens on how the BE influences older adults’ metro travel in high-density cities.
3 Materials and methods
3.1 Study area
This study focuses on Shanghai (31.2304° N, 121.4737° E) as the study area (Figure 1). Shanghai exemplifies a high-density global metropolis, featuring the world’s most extensive metro network with 20 lines spanning approximately 896 km and an average daily ridership exceeding 10 million (Xin, 2023). Meanwhile, the city’s aging trend is accelerating; as of 2024, the population aged 70 and above reached over 3 million, representing 19.56% of the total population (Affairs SMOftE, 2025). We selected 320 metro stations in the central urban area and their surrounding buffers as spatial analysis units. Following previous studies (Yang et al., 2024; Liu et al., 2025), an 800 m buffer radius was adopted to define the study scope around each station. To more accurately represent the spatial influence of individual stations and reduce the overlap common in conventional buffer analyses, we employed Voronoi tessellation to construct non-overlapping service areas (Wang and Shi, 2017)
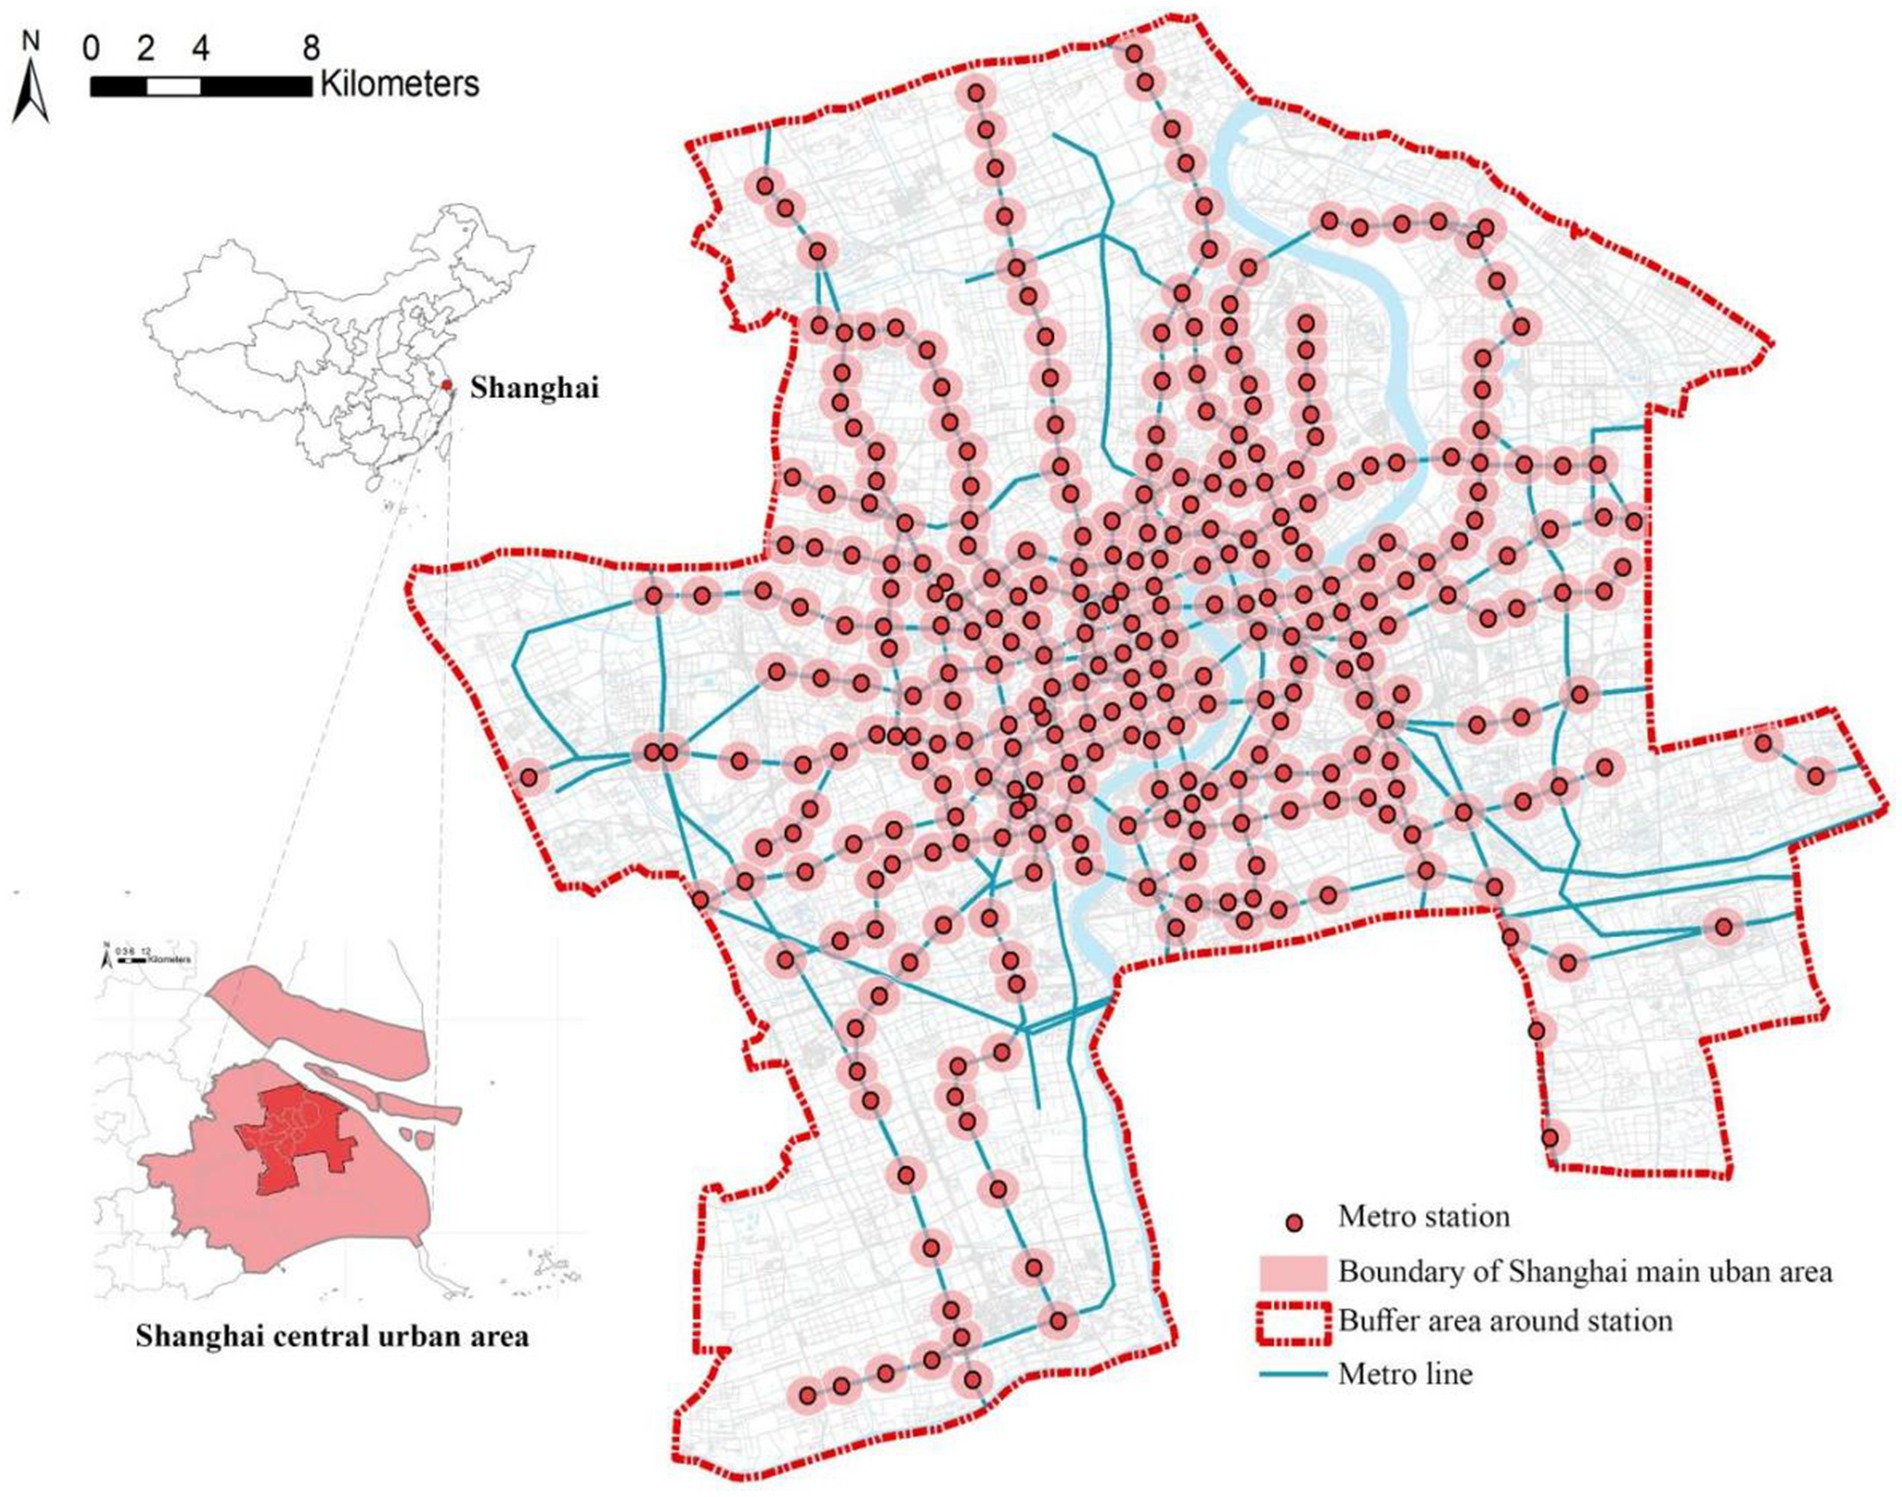
Figure 1. Study area.
3.2 Datasets
The data used in this study were obtained from the Shanghai Metro system and consist of 1,346,976 smart card transaction records made by individuals aged 70 and above between January, 1st 2023 and August, 31st 2024. These records, collected via the “Baotong Card” system, are fully anonymized and include only the entry and exit station codes, timestamps, and encrypted user identifiers. No personally identifiable information is included, ensuring full compliance with privacy regulations and data protection standards.
Following the 5D framework of the BE (Ewing and Cervero, 2010; Chen et al., 2022), we constructed an initial evaluation model. To minimize multicollinearity among the input variables, we calculated the variance inflation factor (VIF) and Pearson correlation coefficients. Variables with VIF values greater than 5 or correlation coefficients exceeding 0.75 were excluded. In total, 20 BE indicators were retained, grouped as follows: Density indicators: road density (RD), intersection density (ID), floor area ratio (FAR); Diversity indicators: POI diversity index (PDI), land-use diversity index (LDI); Design indicators: road connectivity (RC), normalized difference vegetation index (NDVI); Distance/accessibility indicators: distance to the nearest park (DIST_P), average distance to metro stations (DIST_M), distance to city center (DIST_C); Destination indicators: Government service facilities (POI_Gov), shopping service facilities (POI_Sho), living service facilities (POI_Liv), cultural and educational service facilities (POI_Cul), recreational and leisure service facilities (POI_Rec), and medical and healthcare service facilities (POI_Med).
Metro station locations and route data were obtained from the official Shanghai Metro service platform.1 BE factors, including urban roads, green spaces, water bodies, building footprints, land use types, and elevation—were sourced from the Resource and Environment Science Data Center of China,2 Open Street Map,3 and the Shanghai Municipal Open Data Platform.4 POI data for public service facilities were collected using a web crawler developed for Amap.5 Population density data were retrieved from the WorldPop Project,6 while housing price data came from the Anjuke online real estate platform.7 NDVI data at 30-meter resolution were derived from Sentinel-2 satellite imagery, accessed through the Google Earth Engine platform.8 All spatial data were cleaned and clipped using ArcGIS. BE factors were extracted from the 800 m buffer zone around each metro station via spatial overlay and statistical summarization. All data sources were time-matched to the 2023–2024 period to ensure consistency with the smart card travel records.
The Shannon diversity index was used to measure the degree of land use and POI diversity within a given area. The calculation formula is as follows:
where represents the proportion of each type within the total sample. Road connectivity was assessed by first constructing a road network using Python’s networkx package, followed by calculating the degree (i.e., the number of connecting edges) of each node in the network. The formula is as follows:
where denotes the number of roads connected to node i. The minimum distance to the nearest park was calculated using Dijkstra’s algorithm, which determines the shortest walking distance from the center point of a spatial grid cell to the nearest park based on the road network:
where represents the shortest path from the grid centroid to the closest park, capturing network-based accessibility. Betweenness centrality reflects the extent to which a metro station acts as an intermediary along the shortest paths between all other pairs of stations. The formula is given as:
where denotes the set of all stations, are any pair of distinct stations in the network, is the total number of shortest paths between and , and is the number of stations that pass shortest paths (Table 1).

Table 1. Descriptive statistics of variables.
The DIST_M reflects the pedestrian access to metro stations. Within each buffer, we generated a regular 100 m lattice of points, and randomly down-sampled to a maximum of 50 points per buffer. Each sampled point and the station centroid were snapped to the nearest node of the pedestrian road-network graph, which was built from the city road centerlines, with edge weights defined by segment lengths. The shortest path length between each sampled point and the corresponding station was then calculated using Dijkstra’s algorithm (Equation 3), which identifies the minimum cumulative distance across connected nodes. Finally, Dist_M for each station was defined as the average shortest-path distance across all valid sampled points within its buffer.
Given that the collected POI dataset contains 24 major type categories and 228 mid type categories, a systematic filtering procedure was developed to identify POI categories most relevant to older adults’ metro travel while minimizing multicollinearity. First, Pearson correlation coefficients were computed between each mid type POI categories and the independent variable DR for older adults. Only POI variables with an absolute correlation coefficient |r| > 0.25 and a p-value < 0.05 were retained as candidates.
Next, a correlation matrix was constructed to identify highly collinear pairs with |r| > 0.75. Based on the frequency and cumulative strength of correlations, a prioritization rule was applied to propose deletion of redundant variables, retaining only those with lower collinearity and stronger relevance. After this step, hierarchical clustering was performed on the filtered POIs to reconstruct them into six major type POI categories. Within each group, variable combinations were enumerated to form representative POI sets for subsequent modeling.
3.3 Methodological framework
The analytical framework of this study consists of three primary stages. First, using user travel data, including logical rules, we identified the origin stations (typically near the user’s home) and destination stations (near potential activity locations). In parallel, BE data were organized and a multi-dimensional set of indicator variables was constructed. Second, we employed a Geographically Weighted Random Forest (GWRF) model to analyze the passenger volume at potential destination stations. This stage involved defining the global modeling strategy, detailing the specific implementation steps, evaluating model performance, and applying SHAP (SHapley Additive exPlanations) to rank the importance of explanatory variables. Additionally, we examined the nonlinear response patterns and interaction effects of key variables. Finally, clustering and local model analysis were conducted on typical stations representing varying density contexts to explore how BE characteristics influence older adults’ metro travel behavior across different density zones in high-density cities. The analytical workflow is illustrated in Figure 2.
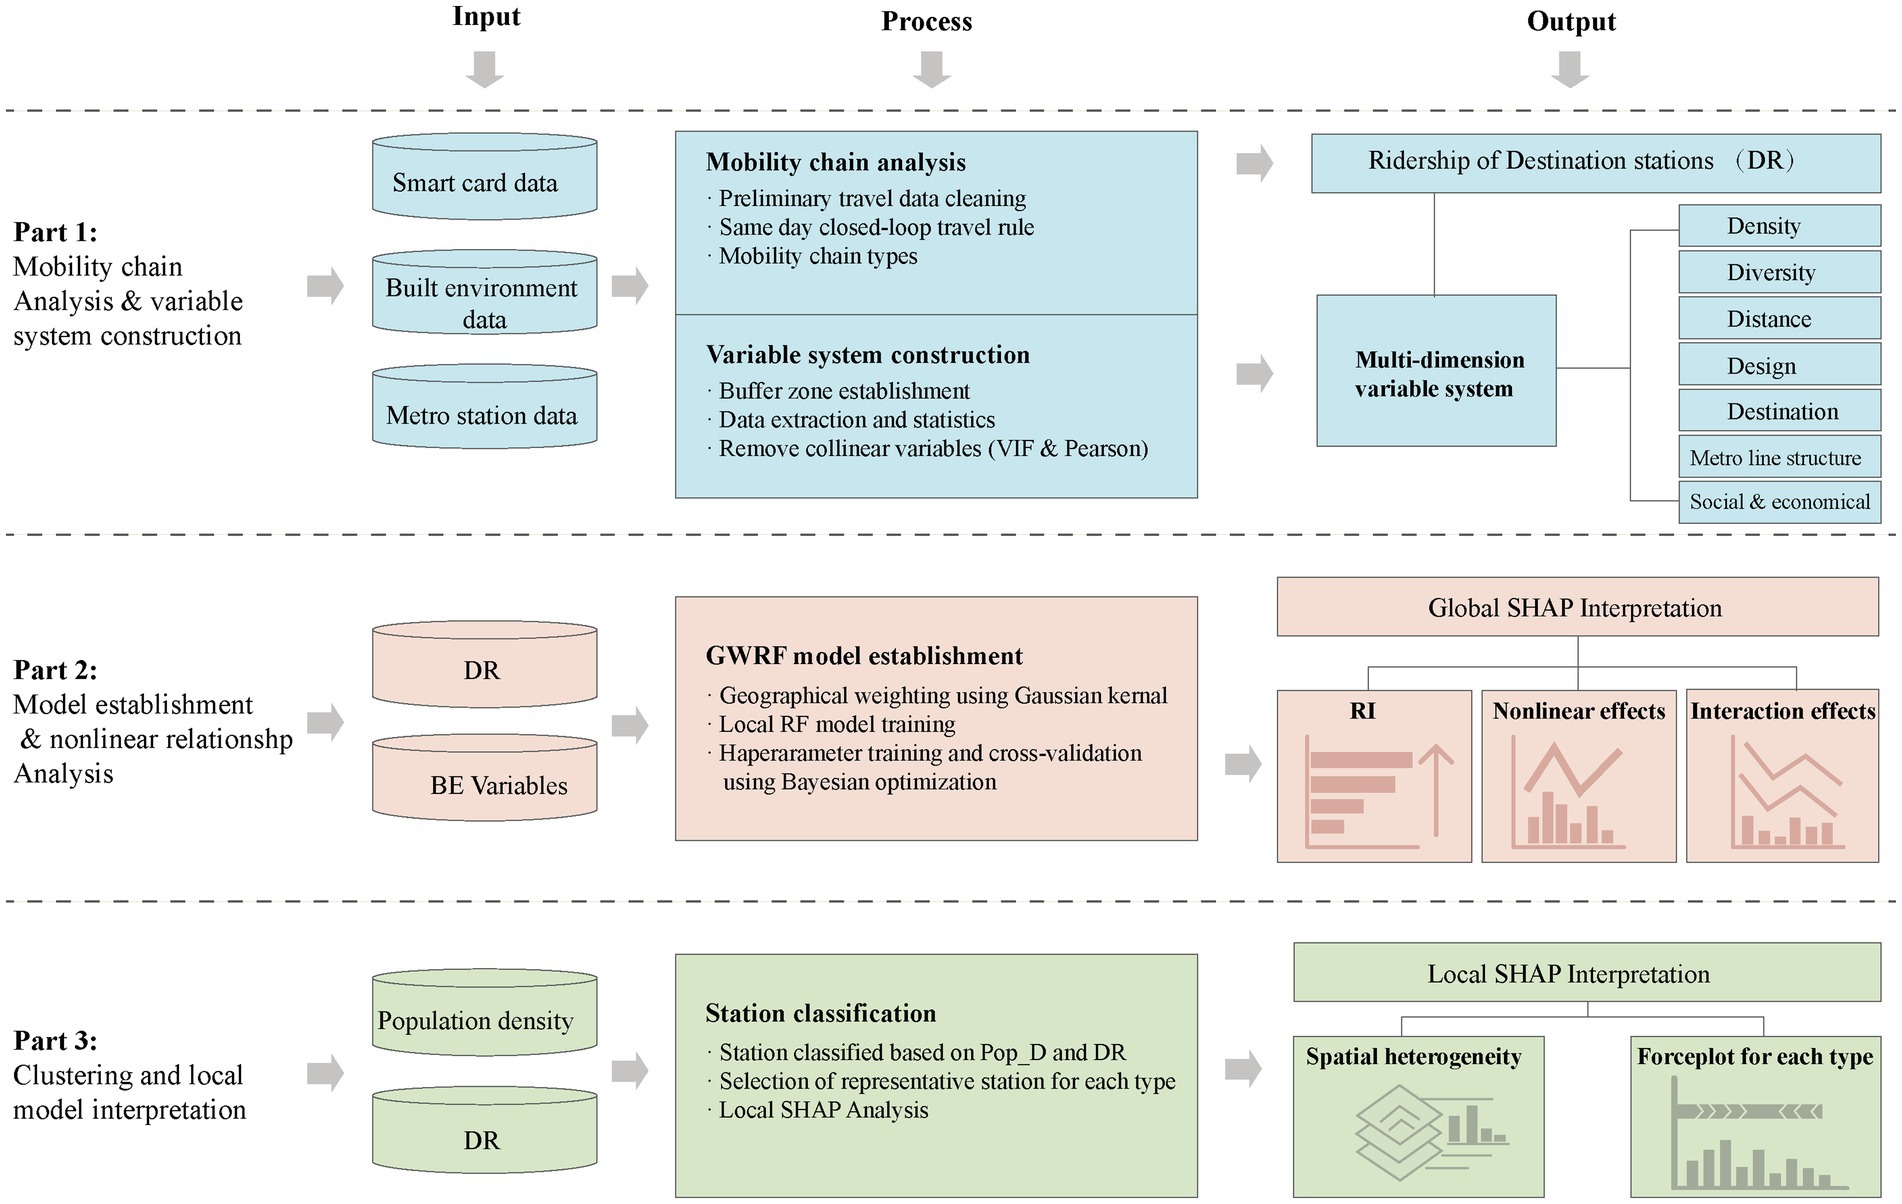
Figure 2. Methodological framework.
3.4 Identification of destination stations
To ensure the validity and reliability of the dataset, we performed a series of data cleansing steps (Figure 3). First, we ran a preliminary screening step to exclude trips with missing information, identical entry and exit stations, or travel durations shorter than 5 min or longer than 120 min. Second, we removed two types of extreme users: extreme low-frequency users (fewer than 10 trips or travel intervals exceeding 6 months); and extreme high-frequency users (more than 2,000 trips). The former group reflects incidental travel behavior, while the latter suggests atypical usage patterns such like shared or institutional card usage. After these procedures, the final dataset comprised 1,297,400 trips from 3,487 valid users.
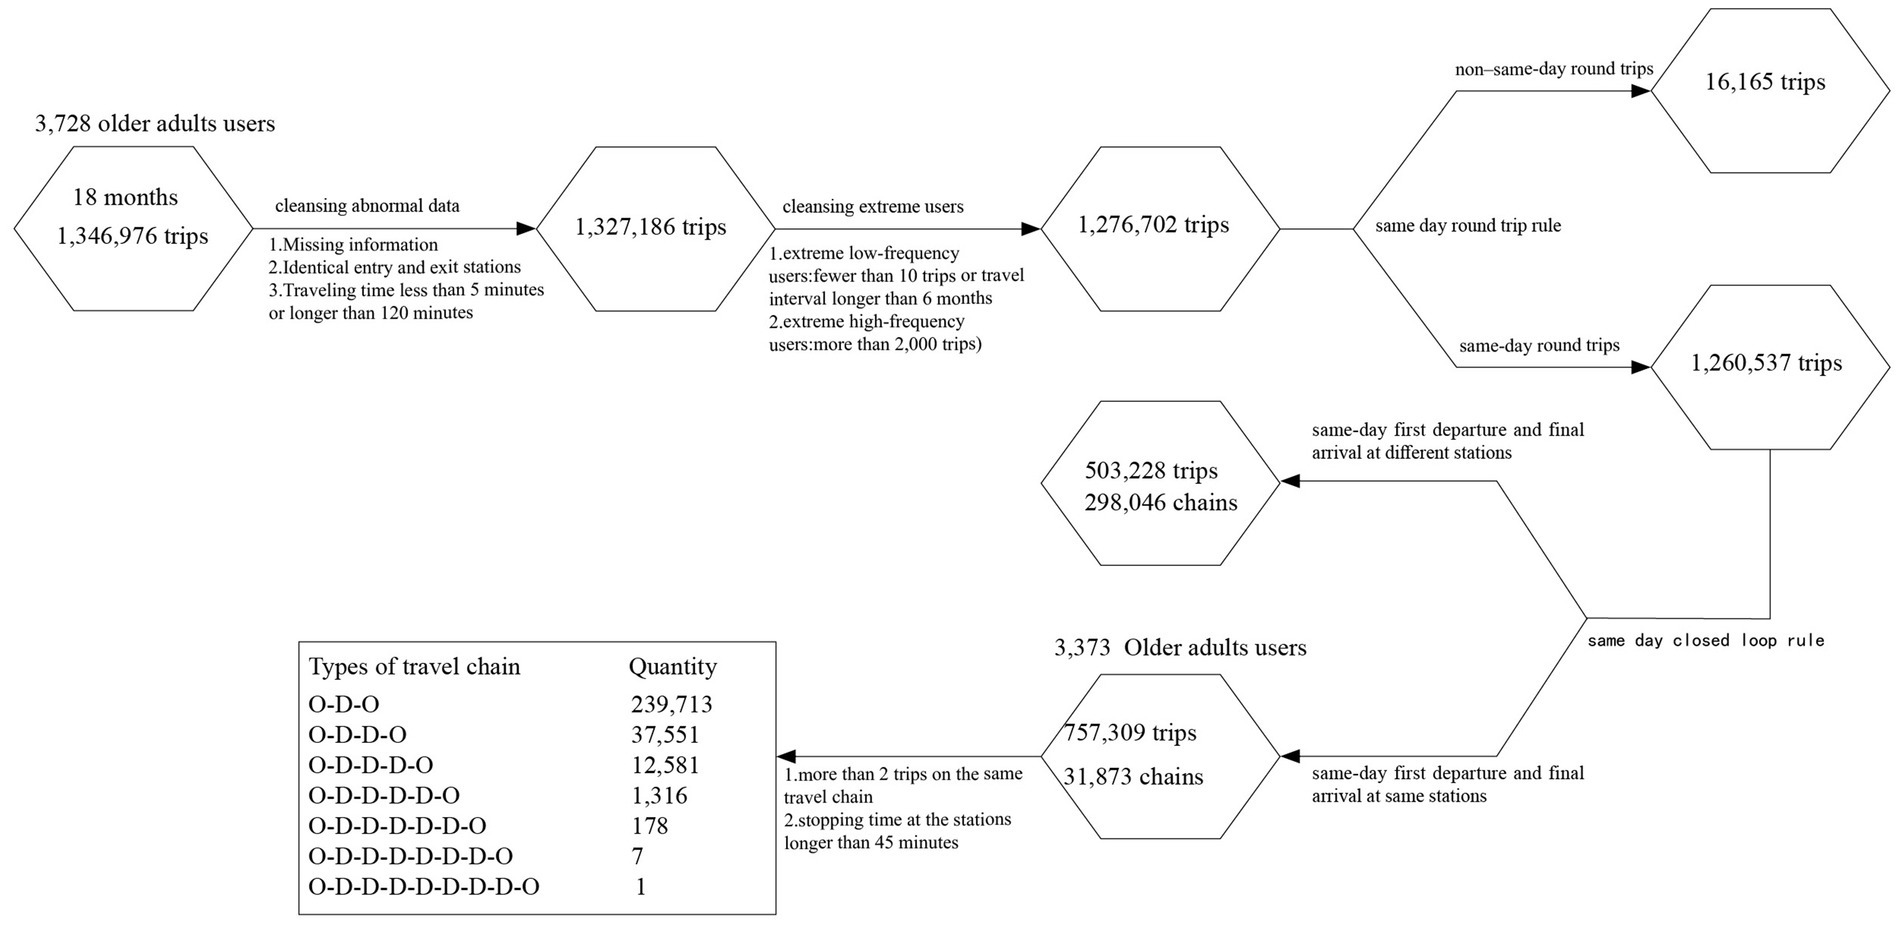
Figure 3. Data cleansing steps and statistics of types of travel chain.
To differentiate origin from destination stations, we applied a same-day closed-loop trip rule to the filtered metro travel dataset. Specifically, we first identified records where a user’s travel formed a closed loop within a single day, requiring that the initial departure and final return stations were identical. For each user, daily travel records were then chronologically ordered and linked into a continuous travel chain. The first and last stations of each closed-loop chain were designated as origin stations (O). Previous studies used 60 min as a threshold for recognizing destinations for general population (Huang et al., 2024; Zhou et al., 2017). Compared with general population, the older adults typically engage in shorter trips with smaller activity radii and slower walking, we adopted a 45-min dwell-time threshold to define activity destinations (D). The threshold of 45 min is long enough to exclude transfers, waiting, or incidental stops, but sufficiently sensitive to capture actual activity destinations among older adults. To further compare and assess the robustness of the model, we also tested a 30-min threshold. The sensitivity analysis showed that 91.1% of travel chains remained unchanged, and the number of destinations increased by only 8.3%, indicating that the 45-min threshold is a conservative yet stable criterion for destination identification.
The statistical results of travel chain patterns indicate that metro travel among older adults is predominantly characterized by a simple “Origin–Destination–Origin” (O-D-O) single-chain structure, accounting for over 80% of all trips. This confirms that most older adults’ individuals engage in daily travel with a single, purpose-driven activity. The next most common patterns are simplified multi-point or short-return chains such as “O-D-D-O” and “O-D-D-D-O,” reflecting that some older adults undertake multi-destination trips via the metro. More complex multi-purpose chains are significantly less frequent, and long-chain structures are extremely rare, suggesting that older adults’ travel activities are generally constrained in both spatial extent and frequency, with relatively focused trip purposes. These findings indicate that older adults primarily engage in regular, purpose-specific daily activities with simple travel structures, demonstrating strong regularity in their metro travel behavior.
3.5 Model construction
To effectively address spatial heterogeneity and enhance local interpretability, this study adopts a Geographically Weighted Random Forest (GWRF) model for regression analysis. GWRF is a localized regression technique that allows model parameters to vary across geographic locations (Georganos et al., 2021). Random Forest, initially developed by Leo Breiman, is an ensemble learning method that constructs multiple decision trees from bootstrapped samples and random feature subsets, aggregating pred.
The core innovation of GWRF lies in embedding the spatial weighting approach of Geographically Weighted Regression (GWR) into the Random Forest framework. In this process, a spatial weight is assigned to each sample point, prioritizing the influence of geographically nearby observations through a Gaussian kernel distance decay function. The bandwidth of this kernel is adaptively determined by the distance to the k-th nearest neighbor, which allows local sample sizes to vary flexibly according to spatial density (Georganos et al., 2021). To ensure sufficient support in sparse areas, a minimum of 30 neighbors was required for constructing each local sub-model. Specifically, GWRF begins with a global Random Forest as a reference, then develops localized Random Forest sub-models for each geographic location based on these spatially weighted samples.
To further improve interpretability, the GWRF framework is integrated with the SHAP algorithm. Rooted in cooperative game theory, SHAP quantifies the marginal contribution of each feature to a model’s prediction, offering both global and local insights into model behavior (Lundberg, 2017). In this study, SHAP values are derived for each localized GWRF model, providing a detailed understanding of how built environment variables shape older adults’ metro travel patterns across different spatial contexts.
To implement this approach, we first calculate the Haversine distance between the target prediction point and all other sample points using their geographic coordinates (latitude and longitude), defining the neighborhood set for local model construction (Equation 5).
where R is the Earth’s radius, , are the latitudes of stations and , and are their corresponding longitudes. The Haversine formula was applied to calculate the spherical distance between stations. Based on these distances, the k nearest neighbors were selected to form the local sample subset for each station. Subsequently, a Gaussian kernel weighting function is applied to calculate the spatial weight matrix for each station based on its neighborhood sample set (Equation 6):
Where b is the kernel bandwidth parameter, which determines the degree of contribution each neighboring point makes to the prediction at the target location. Subsequently, for each station, a local random forest model is fitted using the neighboring sample set as the training data, incorporating the Gaussian weights to emphasize the spatial proximity in the model training (Equation 7):
Where denotes the locally trained random forest model at location i, represents the feature vectors of the neighboring sample points within the spatial neighborhood , and indicates the corresponding target variable values. Finally, the SHAP is applied to each local model to interpret variable contributions, computing SHAP values for each feature. By averaging the SHAP values across all sample points, the global relative importance of each variable is obtained (Equation 8):
Where, denotes the global relative importance of the th variable, is the total number of samples, represents the total number of variables, and is the SHAP contribution value of the th variable in the th sample.
4 Results
4.1 Spatiotemporal characteristics of older adults’ metro travel
The analysis examined older adults’ metro travel behaviors across four dimensions: travel distance, duration, departure time, and return time, also compared travel patterns between weekdays and weekends (Figure 4). Findings indicate that travel structures remain largely consistent across these two periods. Both travel distance and duration display right-skewed distributions, with 90% of trips spanning less than 20 kilometers and lasting no more than 40 min (Figures 4a,b). Temporal patterns further reveal that on weekdays, trips are more concentrated between 9 a.m. and 4 p.m., clearly avoiding peak commuting hours around 6–7 a.m. and 7–8 p.m., with two minor peaks in the early morning and evening (Figures 4c,d). In contrast, weekend travel is distributed more evenly across the day, reflecting slightly greater temporal flexibility. Notably, Shanghai’s “Baotong Card” policy, which offers free or discounted metro travel for residents aged 70 and above during off-peak hours, further promotes this behavior. This initiative reinforces older adults’ off-peak travel patterns, contributing to a more unbalanced temporal and spatial distribution of public transportation usage throughout the city. Overall, the essential travel patterns remain stable between weekdays and weekends for the older adults’ metro travel, which indicates that it is not necessary to separate the two periods in subsequent analyses.
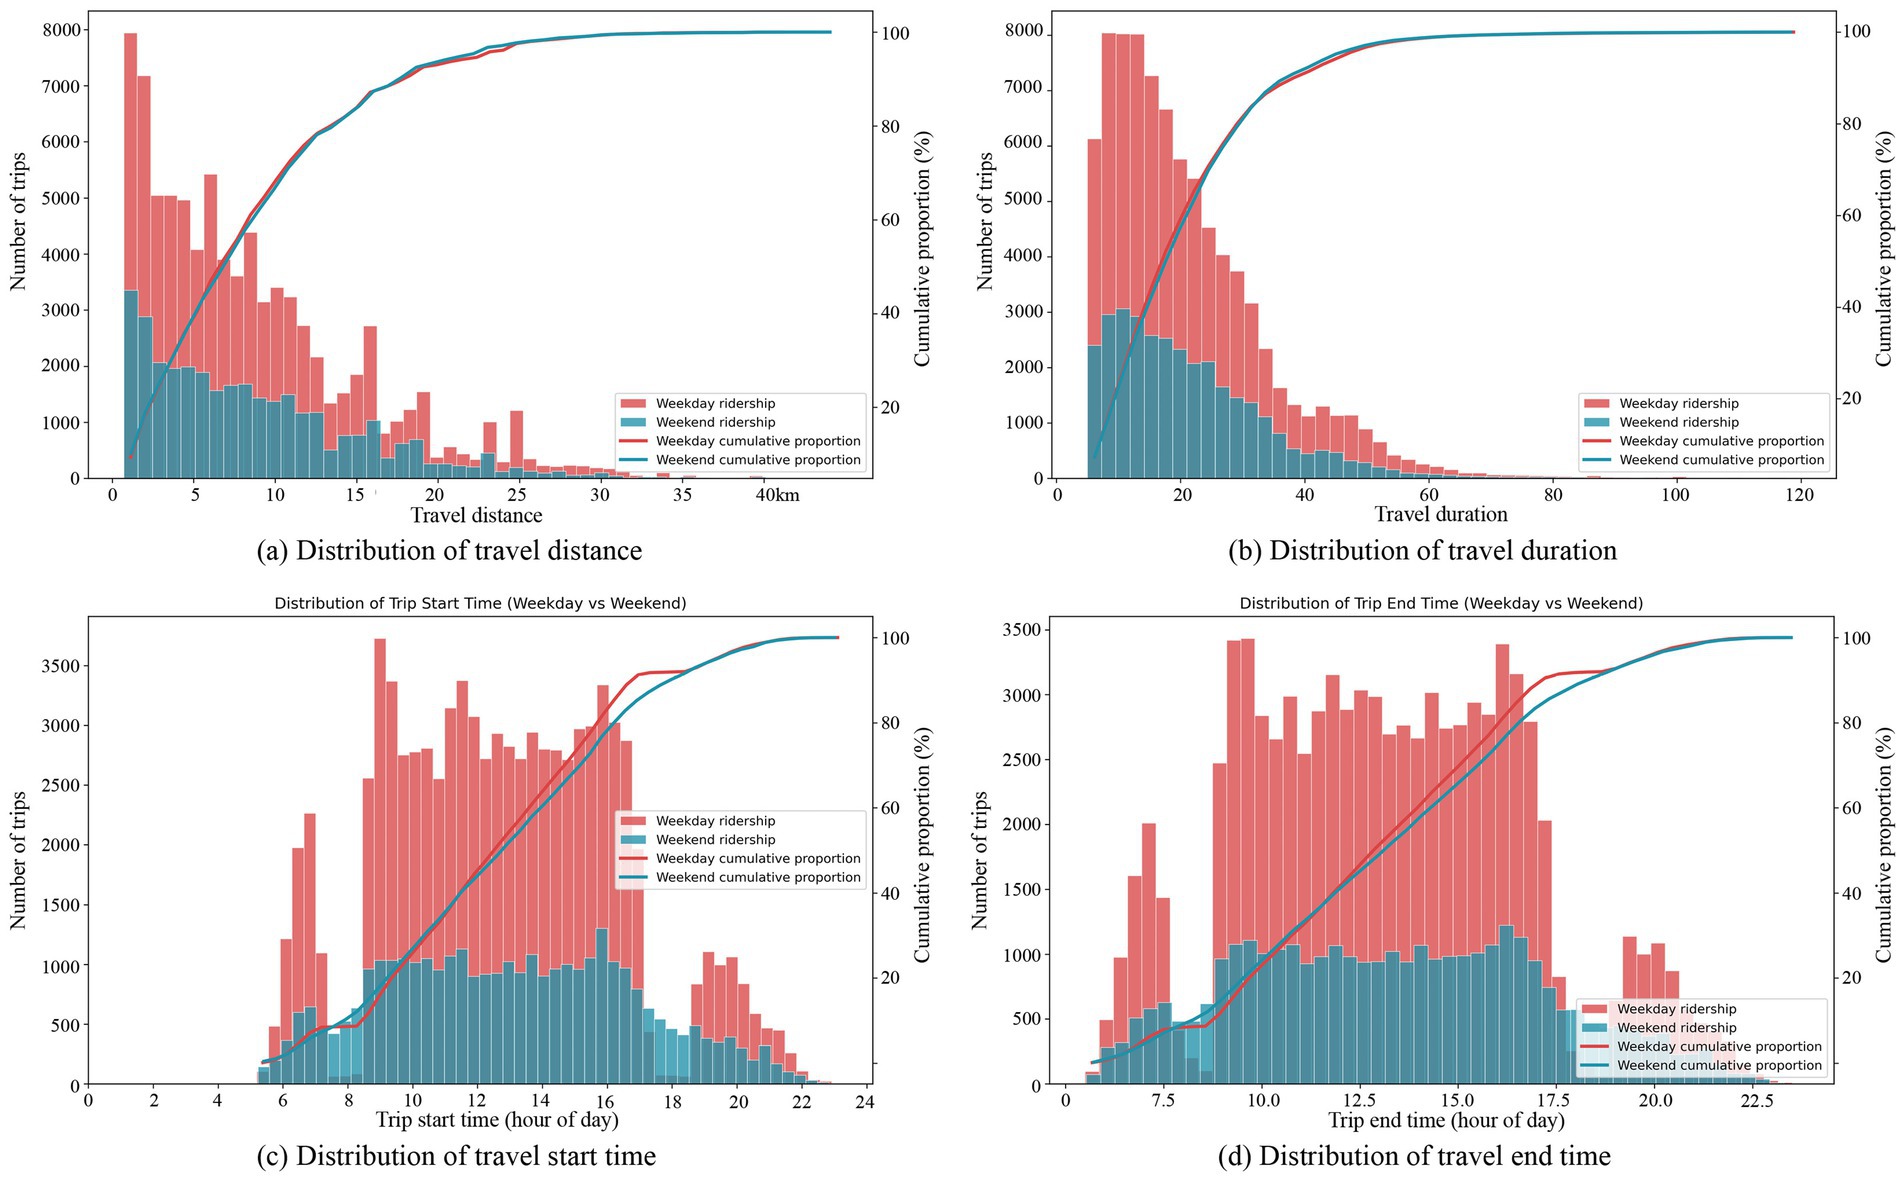
Figure 4. Distribution of trip duration and distance for older adult riders. (a) Distribution of travel distance, (b) Distribution of travel duration, (c) Distribution of travel start time, (d) Distribution of travel end time.
The histogram of DR reveals a distinctly right-skewed distribution, highlighting a highly uneven distribution of older adults’ metro passengers across stations, with a small subset experiencing exceptionally high volumes (Figure 5). The spatial distribution of DR (Figure 5a) displays a pronounced core–periphery structure, marked by intense activity in central zones and reduced volumes in peripheral areas. High ridership is predominantly concentrated in the urban core CBD areas along the west bank of the Huangpu River and the Lujiazui district on the east bank. Particularly, central hub stations such as People’s Square, East Nanjing Road, Xujiahui, and Shanghai Railway Station showcase the highest activity levels, closely aligning with the city’s major functional centers. Additionally, a few peripheral stations—such as Gucun Park, Songhong Road, Qibao, and Lianhua Road—also exhibit relatively high ridership volumes. Spatial hot spot analysis validates this clustering, with a global Moran’s I value of 0.3030 (p = 0.001), confirming statistically significant spatial autocorrelation in older adults’ metro travel patterns.
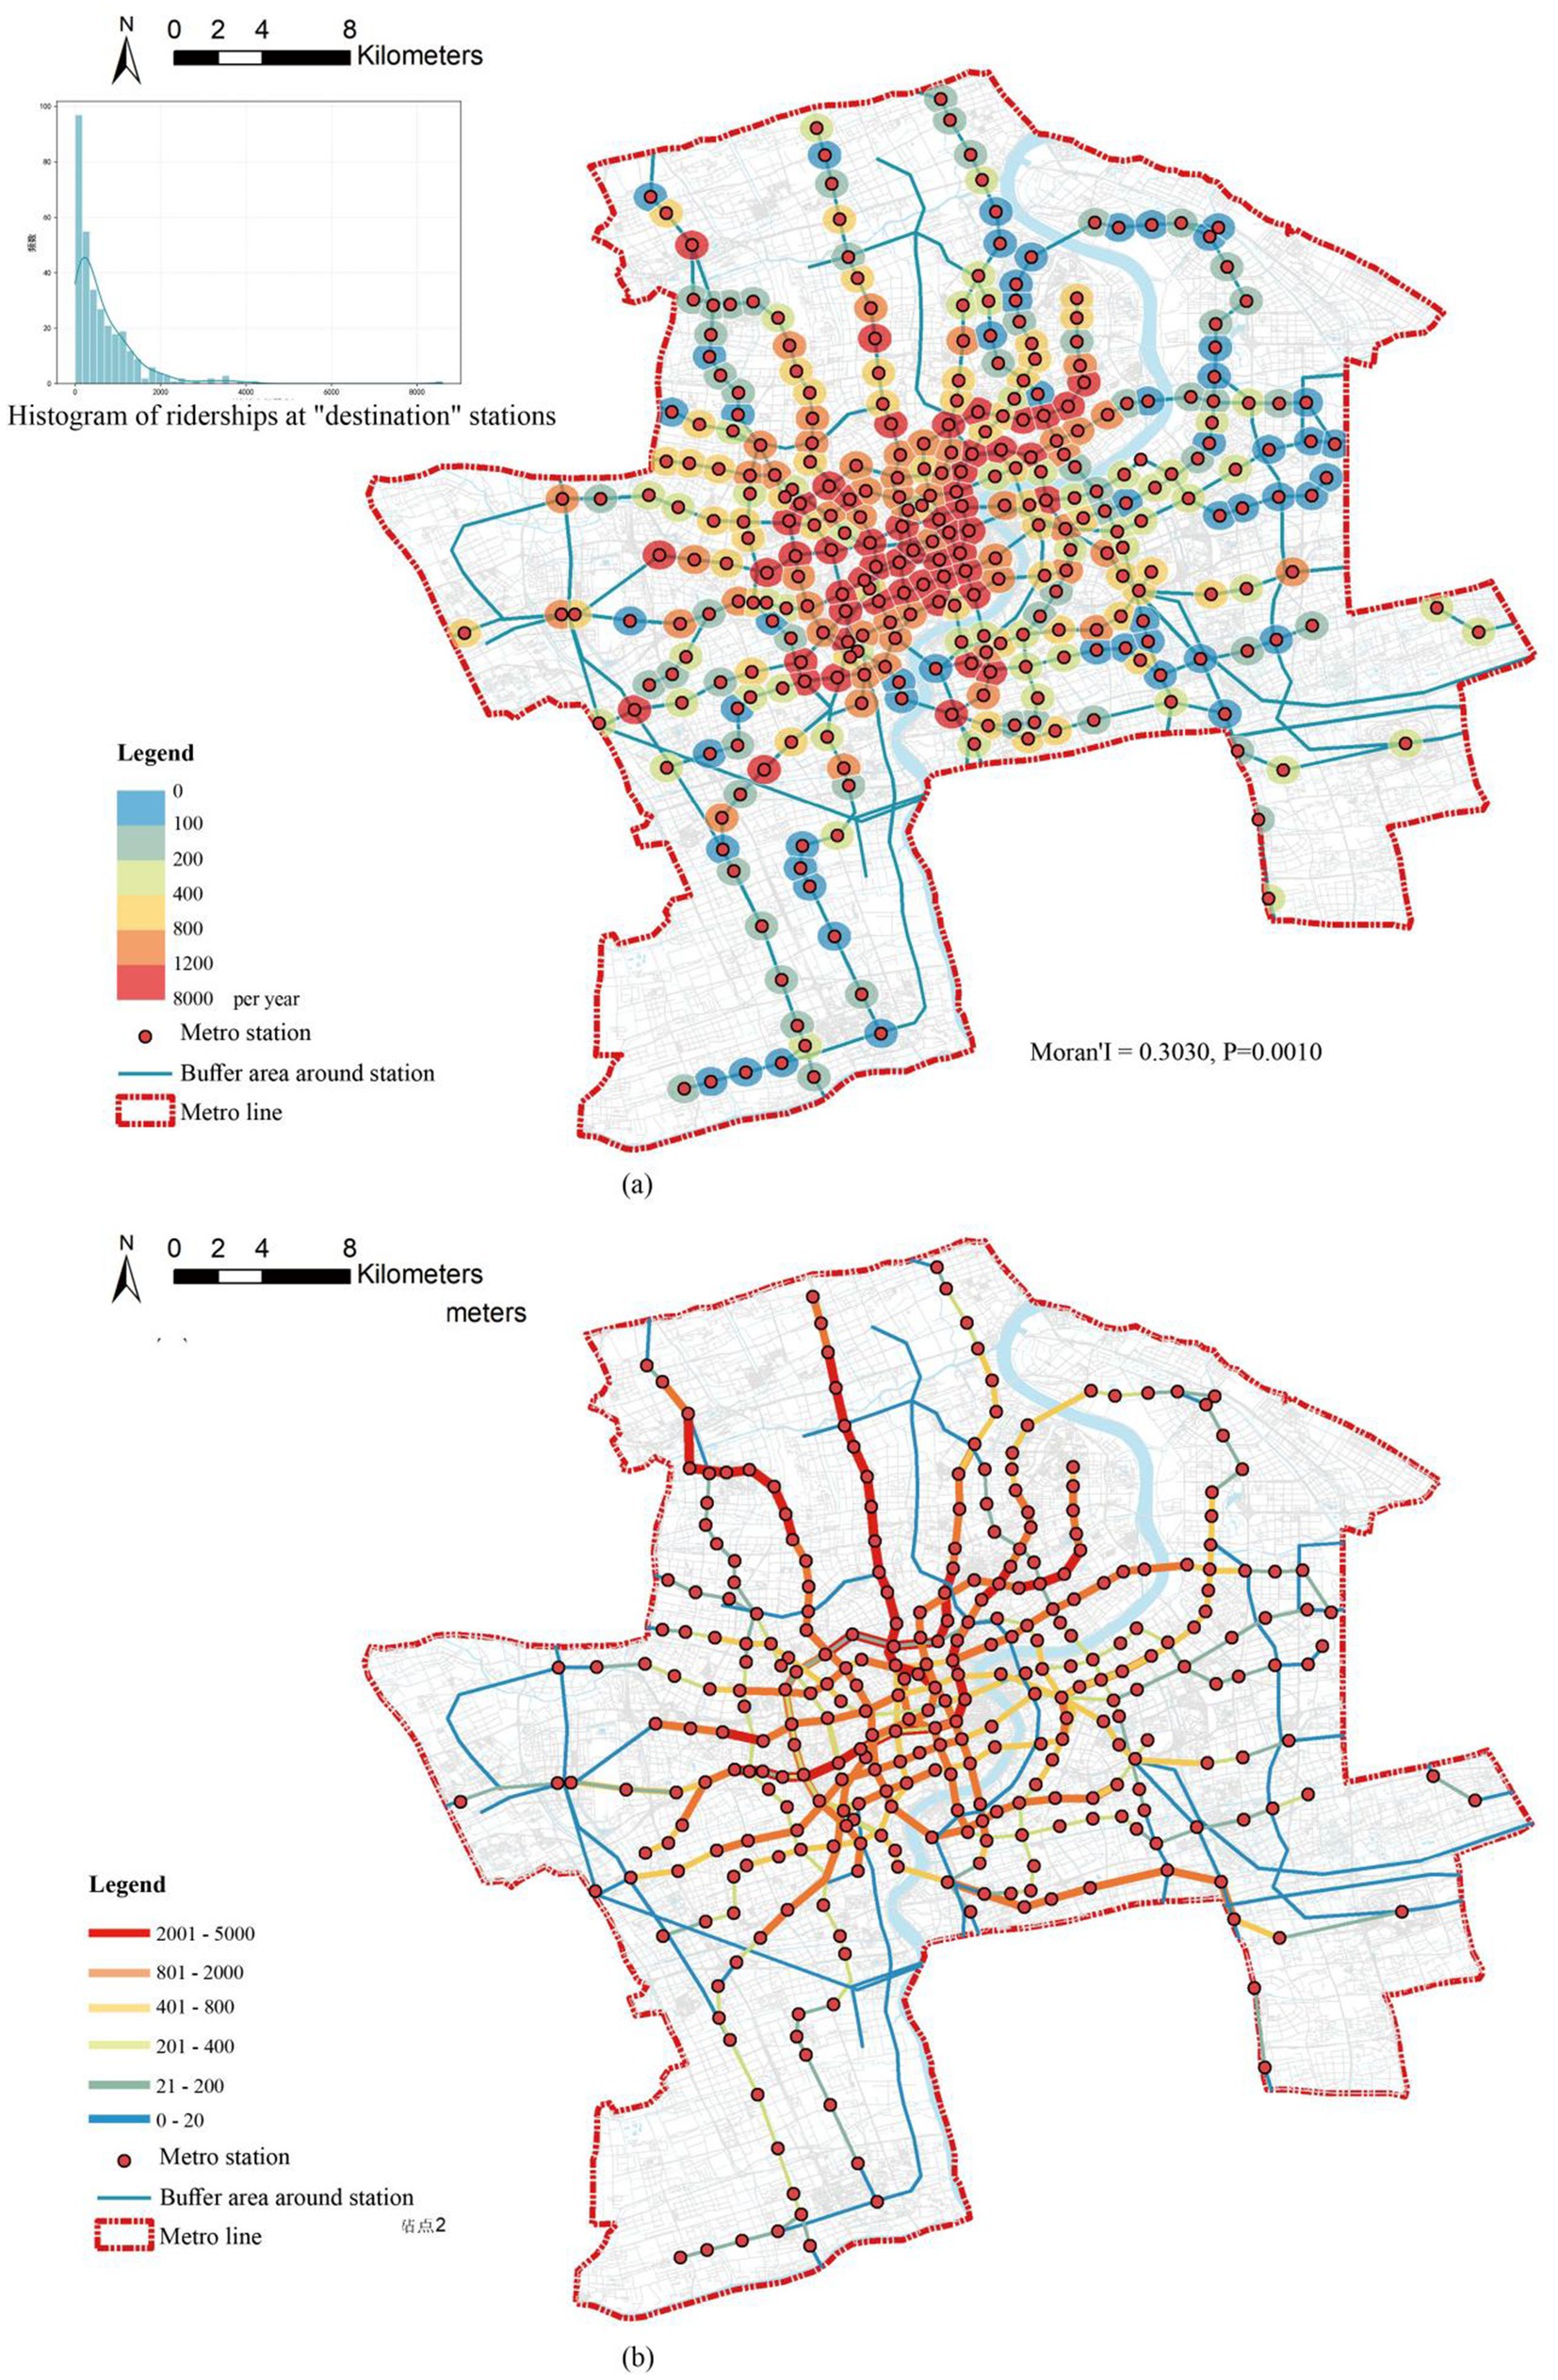
Figure 5. Heatmap of ridership distribution at older adults ‘destination stations and metro lines.
The OD heatmap (Figure 5b) further elucidates strong connections between peripheral residential areas and central urban core area, reflecting a clear “peripheral living—central activity” travel pattern. Central stations like People’s Square station, East Nanjing Road station, and Xujiahui station all demonstrate robust radiation effects and establish frequent travel links with secondary centers such as Wujiaochang station, Babaiban station, and Zhongshan Park station. Lines 1, 2, 8, 10, and 11 constitute the primary network of high-intensity metro corridors, facilitating both local and long-distance travel. Beyond the dense, high-mix transfer stations within the Inner Ring area, several outer-ring stations are also connected by these main lines, forming long-distance travel corridors. These patterns indicate that older adult riders are not confined to local travel; instead, they show a clear willingness to engage in cross-district activities, with metro infrastructure playing a crucial role in enabling their mobility. This also indicates the strong functional attraction of the central urban area for the older adult population.
4.2 Model performance
The Geographically Weighted Random Forest (GWRF) model, integrated with SHAP, was employed to evaluate the relative importance of built environment variables in shaping older adults’ metro travel behavior in high-density urban settings. To evaluate model performance, three benchmark models, ordinary least squares (OLS), Random Forest (RF), and XGBoost were constructed under consistent experimental conditions and compared against GWRF model (Figure 6). To mitigate the right-skewed distribution of the dependent variable and enhance model fit, we applied a logarithmic transformation to the DR data. Given the relatively small sample size (320 stations), all machine learning models were trained using Bayesian hyperparameter tuning (Guo et al., 2023) combined with a 5-fold cross-validation procedure to mitigate overfitting, with the number of Bayesian search iterations fixed at 30 per fold to balance computational efficiency and model accuracy. Key hyperparameters, such as the number of trees (n_estimators 200–500) and maximum tree depth (max_depth 5–20), were aligned across tree-based models, while additional regularization parameters were included to further suppress overfitting tendencies; full parameter details are provided in the Supplementary material.
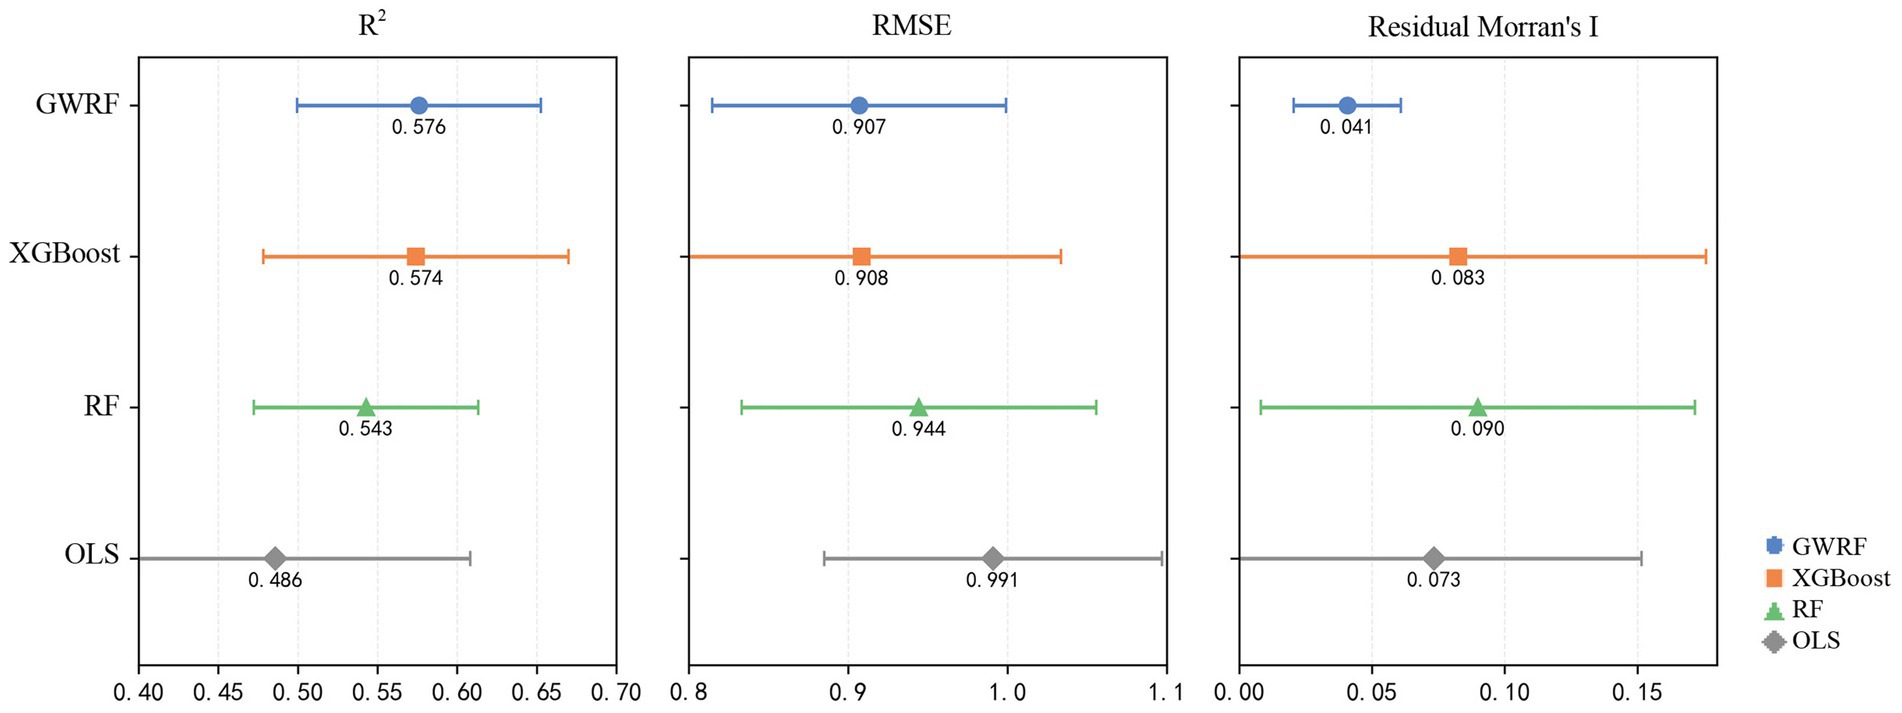
Figure 6. Comparison of model performance.
Model performance was evaluated using three complementary metrics: the coefficient of determination on the test set (R2), which quantifies the proportion of variance explained, ranging between 0 and 1, where higher values indicate better fit; the root mean squared error (RMSE), which reflects the magnitude of prediction errors, where lower values indicate greater accuracy; and Residual Moran’s I, which measures the extent of spatial autocorrelation persisting in model residuals, where values closer to zero represent weaker spatial dependence and thus superior performance. Each metric was reported as the mean across folds with corresponding standard deviations (mean ± SD). The inclusion of variability ranges reflects differences in performance across the cross-validation partitions, as each fold uses a distinct subset of stations, and thus captures the uncertainty and robustness of the model rather than a single deterministic score.
The results showed that the R2 (0.58 ± 0.09) and RMSE (0.91 ± 0.11) of the GWRF model outperformed those of the RF and OLS models and were comparable to those of the XGBoost model, which is consistent with findings reported in related studies (Yang et al., 2022; Chen et al., 2022). XGBoost surpasses the RF model due to its stronger regularization mechanisms and gradient boosting framework, which improve its ability to capture nonlinearities and reduce bias, thereby yielding good overall predictive performance (Xi et al., 2024). However, the residual Moran’s I of the GWRF model was notably lower than that of all other models, demonstrating its stronger ability to mitigate spatial autocorrelation in residuals. Moreover, the error bars for GWRF across all three metrics were narrower, suggesting greater stability and robustness of model performance across folds.
4.3 Feature importance
For interpretation, SHAP was applied across all local models to quantify variable contributions, with mean absolute SHAP values used to rank global importance and visualized via bar chart and summary plots (Figure 7).
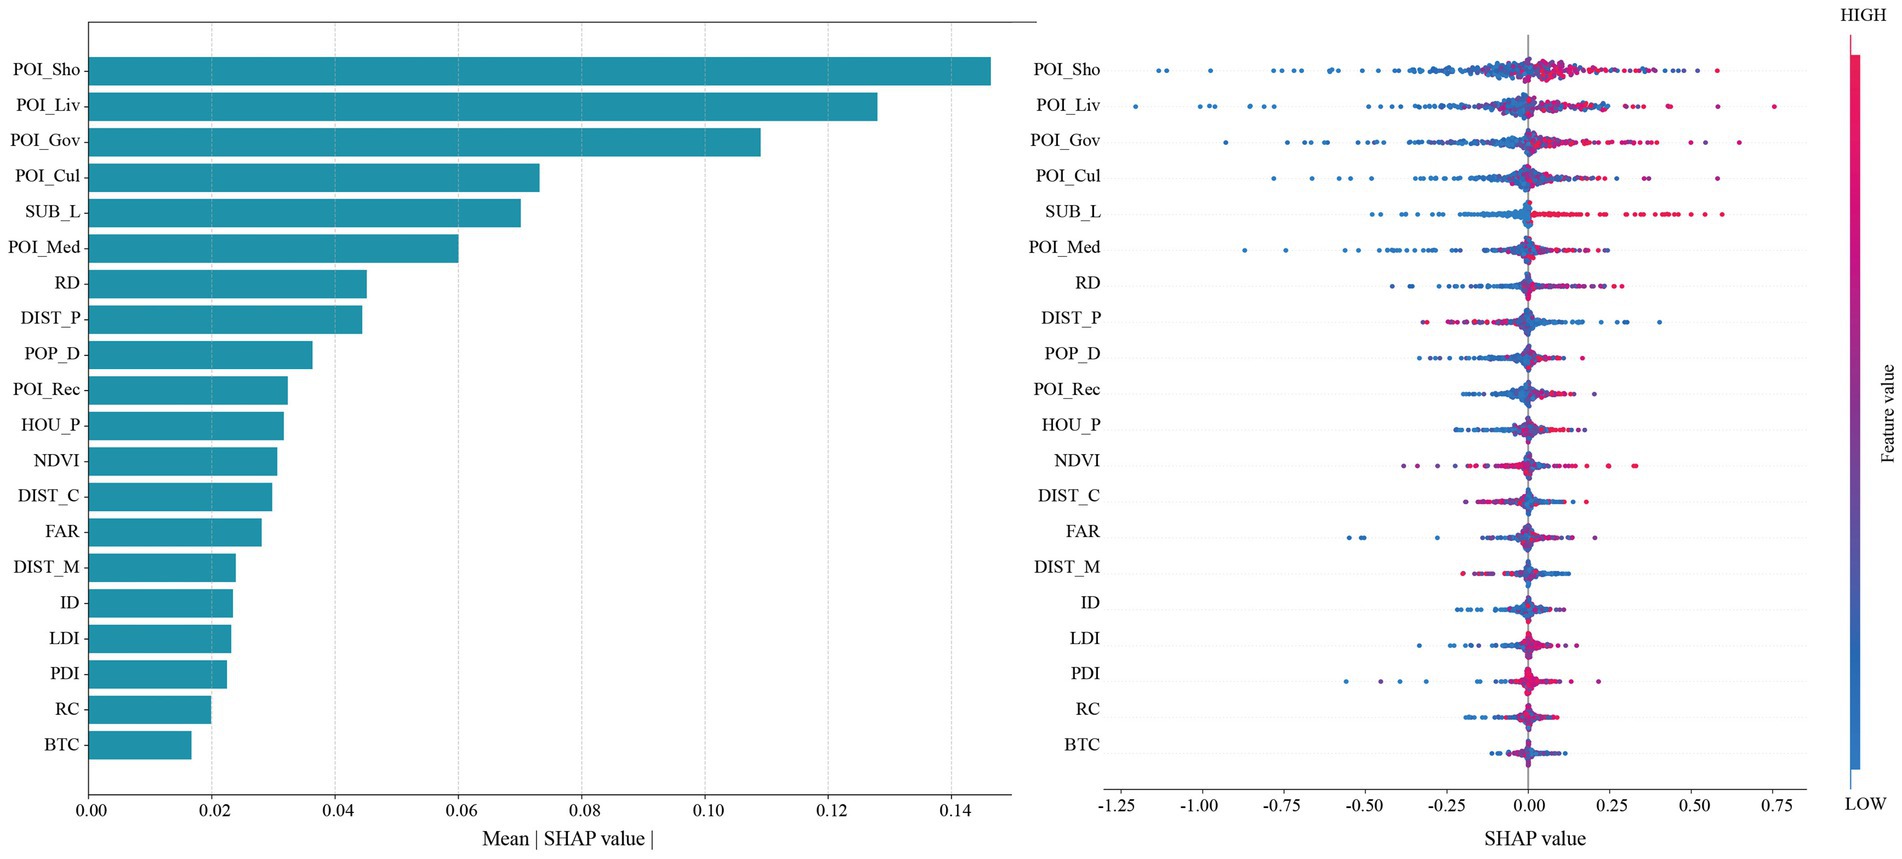
Figure 7. Feature importance and SHAP summary plot.
The results revealed that POI variables are key contributors to older adults’ metro travel. POI_Sho, POI_Liv, and POI_Gov ranked highest, each with mean SHAP values exceeding 0.10, underscoring alignment with older adults’ frequent, non-commute, short-distance, and multipurpose travel needs (Cerin et al., 2017; Zang et al., 2019). POI_Gov’s prominence highlights older adults’ reliance on administrative and social services (Hu et al., 2013). POI_Cul and POI_Med rank fourth and sixth, respectively, while POI_Rec facilities place 11th, reflecting diverse motivations including cultural engagement, medical visits, and leisure (Zhang et al., 2022). SHAP summary plots indicated predominantly positive effects for POI variables, suggesting they increase metro use likelihood.
SUB_L representing the number of connecting lines, ranked fifth, and showed a strong positive correlation with ridership. Align with previous studies, this implies that well-connected hubs with high centrality attract older adults, consistent with research on transfer convenience (Yang et al., 2022).
Distance variables DIST_P and DIST_C fell in mid-range, with mostly negative SHAP values, indicating reduced ridership as distances increased. This aligns with evidence that proximity to green spaces and urban cores promotes older adults’ mobility (Gan et al., 2019; Zhang et al., 2023).
The socio-economic variables POP_D and HOU_P also fell in the mid-range of importance, with non-linear SHAP distributions. Generally, high-density and high-price areas overlap with neighborhoods offering better public resources and transit accessibility, factors that still positively guide older adults’ travel decisions (Zang et al., 2019).
Notably, traditional density metrics showed lower importance in this high-density context. RD ranked only seventh, and ID and FAR ranked even lower. Diversity and design variables also ranked relatively low. This may be due to the diminishing marginal effects of such indicators in ultra-dense urban settings like Shanghai, where their explanatory power is limited compared to functional POI variables (Zhang et al., 2021). Additionally, their impacts may be masked by strong nonlinearities and interactions, diminishing standalone contributions.
4.4 Nonlinear effects of built environment factors
To further explore the nonlinear and threshold effects of built environment factors on older adults’ metro travel in high-density cities, this study visualized Local Dependency Plots (LDP) for the top 12 variables ranked by relative importance in the GWRF model. These plots illustrated marginal effect trends using scatter distributions and LOESS-fitted curves (Figure 8).
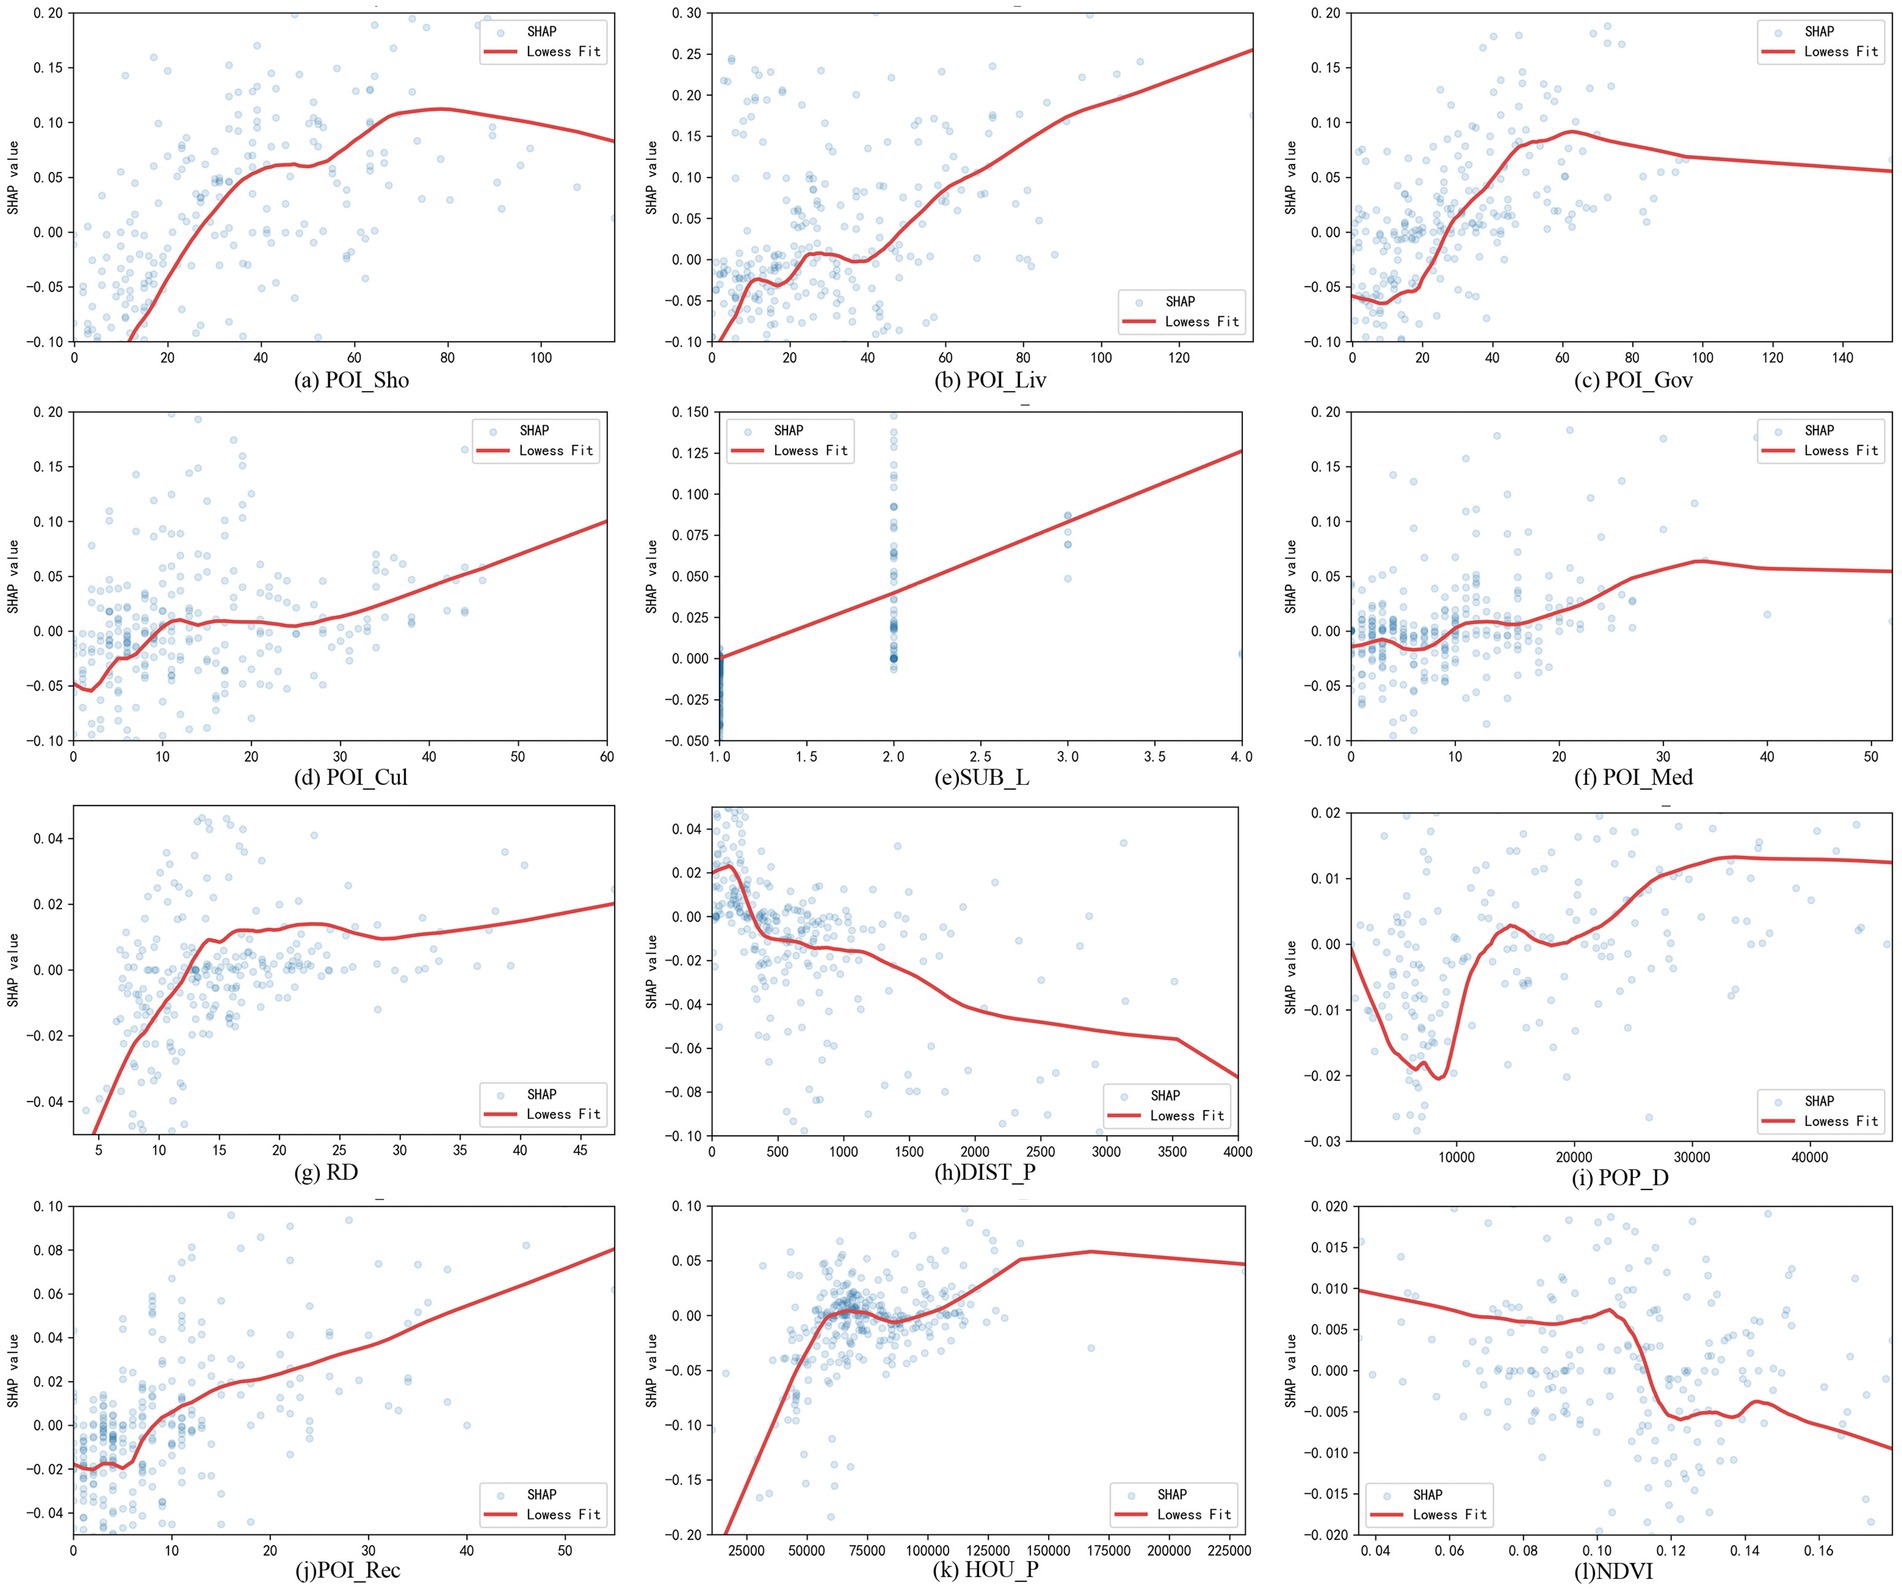
Figure 8. LDP of top 12 ranking variables. (a) POI_Sho, (b) POI_Liv, (c) POI_Gov, (d) POI_Cul, (e) SUB_L, (f) POI_Med, (g) RD, (h) DIST_P, (i) POP_D, (j) POI_Rec, (k) HOU_P; (l) NDVI.
Several POI-related functional facility variables exhibited similar nonlinear patterns: generally monotonically increasing trends with signs of diminishing marginal returns. Specifically, variables such as POI_Sho (Figure 8a), POI_Liv (Figure 8b), and POI_Gov (Figure 8c) shift from negative to positive influence when the number of facilities exceeded approximately 30, with the effect plateauing beyond 80. This suggested that a moderate quantity of such facilities is essential to attract older adult riders, while excessive density could lead to congestion and environmental complexity, ultimately reducing their attractiveness.
In contrast, POI_Cul (Figure 8d), POI_Med (Figure 8f), and POI_Rec (Figure 8j) displayed stable growth in SHAP values after reaching around 10 facilities, implying these less common but functionally distinctive POIs acted as strong attractors. Guo et al. (2023) found similar results in a study on older adults’ travel in Xiamen, where a moderate density of commercial and recreational POIs yielded the strongest positive effects.
For density variables, RD (Figure 8g) showed a rising SHAP trend up to 15 km/km2, after which the effect leveled off. This indicated that moderate road density enhanced connectivity to metro stations and destinations, improving accessibility for older adult travelers. However, beyond this threshold, the benefits plateaued, possibly due to road networks occupying land needed for other functions or creating navigation complexity and safety concerns (Wang et al., 2023; Yang et al., 2024).
Among accessibility-related variables, DIST_P (Figure 8h) showed a monotonically decreasing effect. When parks were located more than 300 meters from metro stations, the impact turned negative, suggesting a preference among older adult riders for destinations close to green spaces (Zhang et al., 2023; Wen et al., 2018). NDVI (Figure 8l) presented a inverted U-shaped pattern: positive effects were observed when NDVI was below 0.11, but higher values corresponded with negative impacts. This may reflect that in high-density cities like Shanghai, extreme greenness often indicated peripheral locations with poor service accessibility, whereas moderate greening enhanced comfort and encouraged metro use (Gong et al., 2016; Lu et al., 2025).
For socioeconomic variables, HOU_P (Figure 8m) generally exhibited an increasing trend. SHAP values turned positive when housing prices exceeded approximately 60,000 CNY/m2 and stabilized above 140,000 CNY/m2. While high housing prices may reflect better urban amenities and environments, excessively high prices could correlate with crowding, complexity, and increased perceived safety risks, potentially deterring older adult riders (Guo et al., 2023; Du et al., 2022).
POP_D (Figure 8i) showed a U-shaped relationship. When population density was below 15 thousands people/km2, the impact was mostly negative. As density increased, the effect became positive, possibly due to better service variety, walkable infrastructure, and richer social environments in denser neighborhoods. However, prior studies have indicated that once density exceeds 18 thousands people/km2, the marginal benefits may diminish or reverse (Zhang et al., 2021).
4.5 Interaction effects of built environment variables
Using the TreeExplainer module from the SHAP package in Python 3.9, we further examined the interaction effects among built environment variables. A comprehensive interaction effect matrix is provided in the Supplementary material, which allows us to identify pairs of variables with relatively stronger interactions as well as the general direction of these effects. In addition, a bar chart of the top 12 variables ranked by their interaction contributions is presented in Figure 9. The results show that interaction effects account for 55.71% of the total explanatory power, underscoring the substantial non-linear and synergistic relationships among the variables in the model.
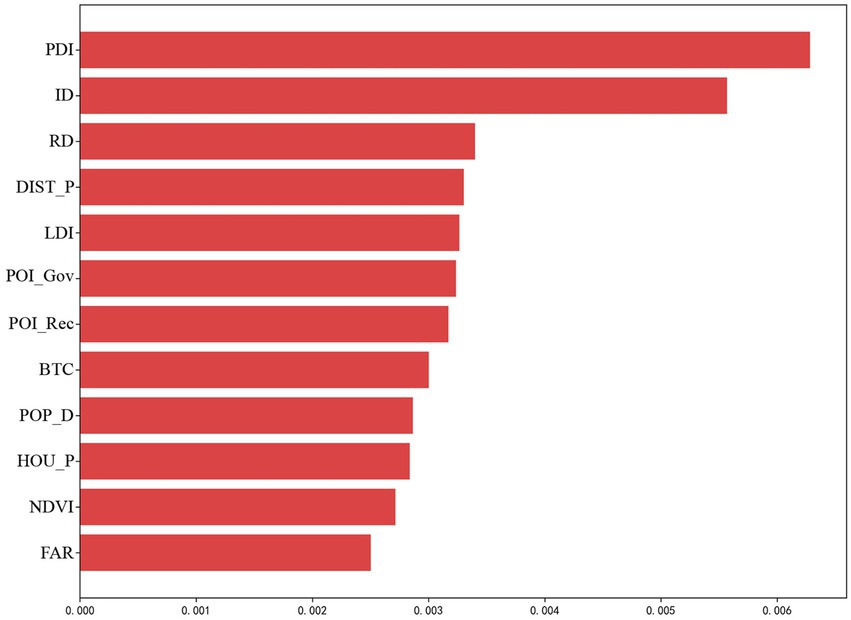
Figure 9. Top 12 variable interaction combination.
Notably, variables related to diversity and density, such as PDI, LDI, ID, and RD, while not ranking high in individual importance, contributed significantly in the interaction matrix. This indicated that although these factors may not directly drive older adults’ metro travel on their own, they play an important indirect role by influencing the perception of the urban environment and the connectivity of spatial structures, thereby reinforcing travel motivation (Guo et al., 2023; Yang et al., 2024).
Due to the large number of interaction pairs, we selected six pairs with the strongest interaction values and clear variation ranges for further analysis using SHAP dependence scatter plots (Figure 10). These plots largely revealed either synergistic (positive) or suppressive (negative) interaction patterns.
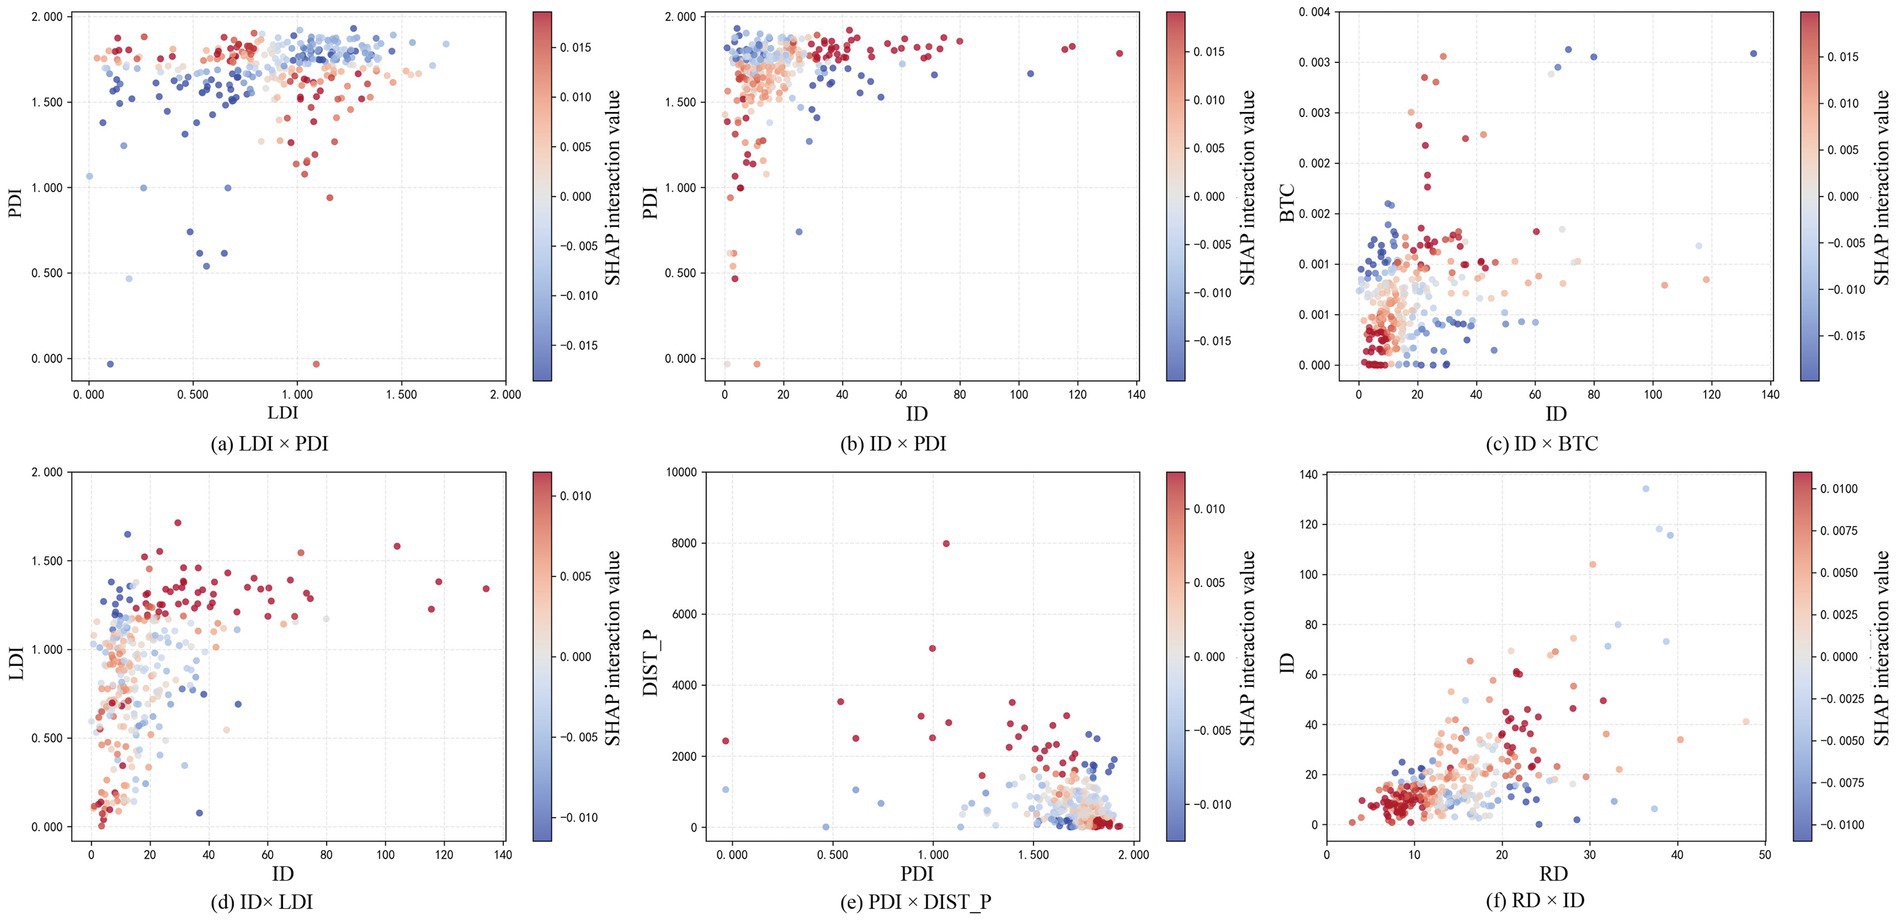
Figure 10. Interaction effect of representative variable combinations. (a) LDI×PDI, (b) ID×PDI, (c) ID×BTC, (d) ID×LDI, (e) PDI×DIST_P, (f) RD×ID.
The interaction between LDI and PDI (Figure 10a) revealed a clear mutual suppression pattern. When one variable was above the mean and the other below (e.g., PDI > 1.7 & LDI < 0.9 or vice versa), the interaction SHAP values were predominantly positive, suggesting a reinforcing effect. However, when both variables were simultaneously high or low, the interaction turned negative, indicating diminishing or even suppressive returns. This suggested that these two “diversity” metrics do not always complement each other, and excessive functional diversity may increase environmental complexity, thereby reducing the attractiveness of metro travel. Similar findings have been reported in prior studies, where land-use mix beyond a certain threshold can hinder travel behavior due to over-complexity (Guo et al., 2023).
A similar suppressive interaction was observed between PDI and DIST_P (distance to parks) (Figure 10e). When both values were simultaneously low or high (e.g., PDI < 1.7 & DIST_P < 700 or PDI > 1.7 & DIST_P > 700), the interaction effect was neutral or weakly negative. Conversely, when one was high and the other low, the interaction tends to be positive. This indicated that functional diversity and park accessibility did not act not independently, but as complementary or coupled factors. High POI diversity could not fully compensate for poor park access, and vice versa, indicating a synergistic dependence in influencing older adults’ travel behavior and (Yang et al., 2024; Gong et al., 2016).
Several variable pairs demonstrated synergistic enhancement effects, such as ID and PDI (Figure 10b), and ID and BTC (Figure 10c). When both variables were either low (e.g., ID < 20 & PDI < 1.7) or high (e.g., ID > 20 & BTC > 0.0007), their SHAP interaction values were predominantly positive, indicating mutually reinforcing influence. In contrast, when only one variable was high, the interaction turned negative. Similar synergistic effects were found in ID-LDI (Figure 10d) and RD-ID (Figure 10f) combinations. These results underscored the key role of ID and in mediating the effectiveness of other structural or functional environmental variables (Guo et al., 2023; Yang et al., 2024).
4.6 localized analysis of built environment influence by station type
To further explore how BE factors influence older adults’ metro travel behavior in high-density cities, we drew on methods in previous studies that applied clustering and selected representative samples whose SHAP profiles were closest to the cluster mean (Yang et al., 2024; Liu et al., 2025). Following this logic, our study classified metro stations into four types based on the median values of population density (POP_D) and destination ridership volume (DR). It should be noted that “low density” and “low ridership” are relative terms within the highly urbanized central Shanghai context, reflecting spatial and functional heterogeneity among stations rather than typical suburban conditions. As shown in Figure 11, these four types exhibited a distinct concentric spatial pattern.
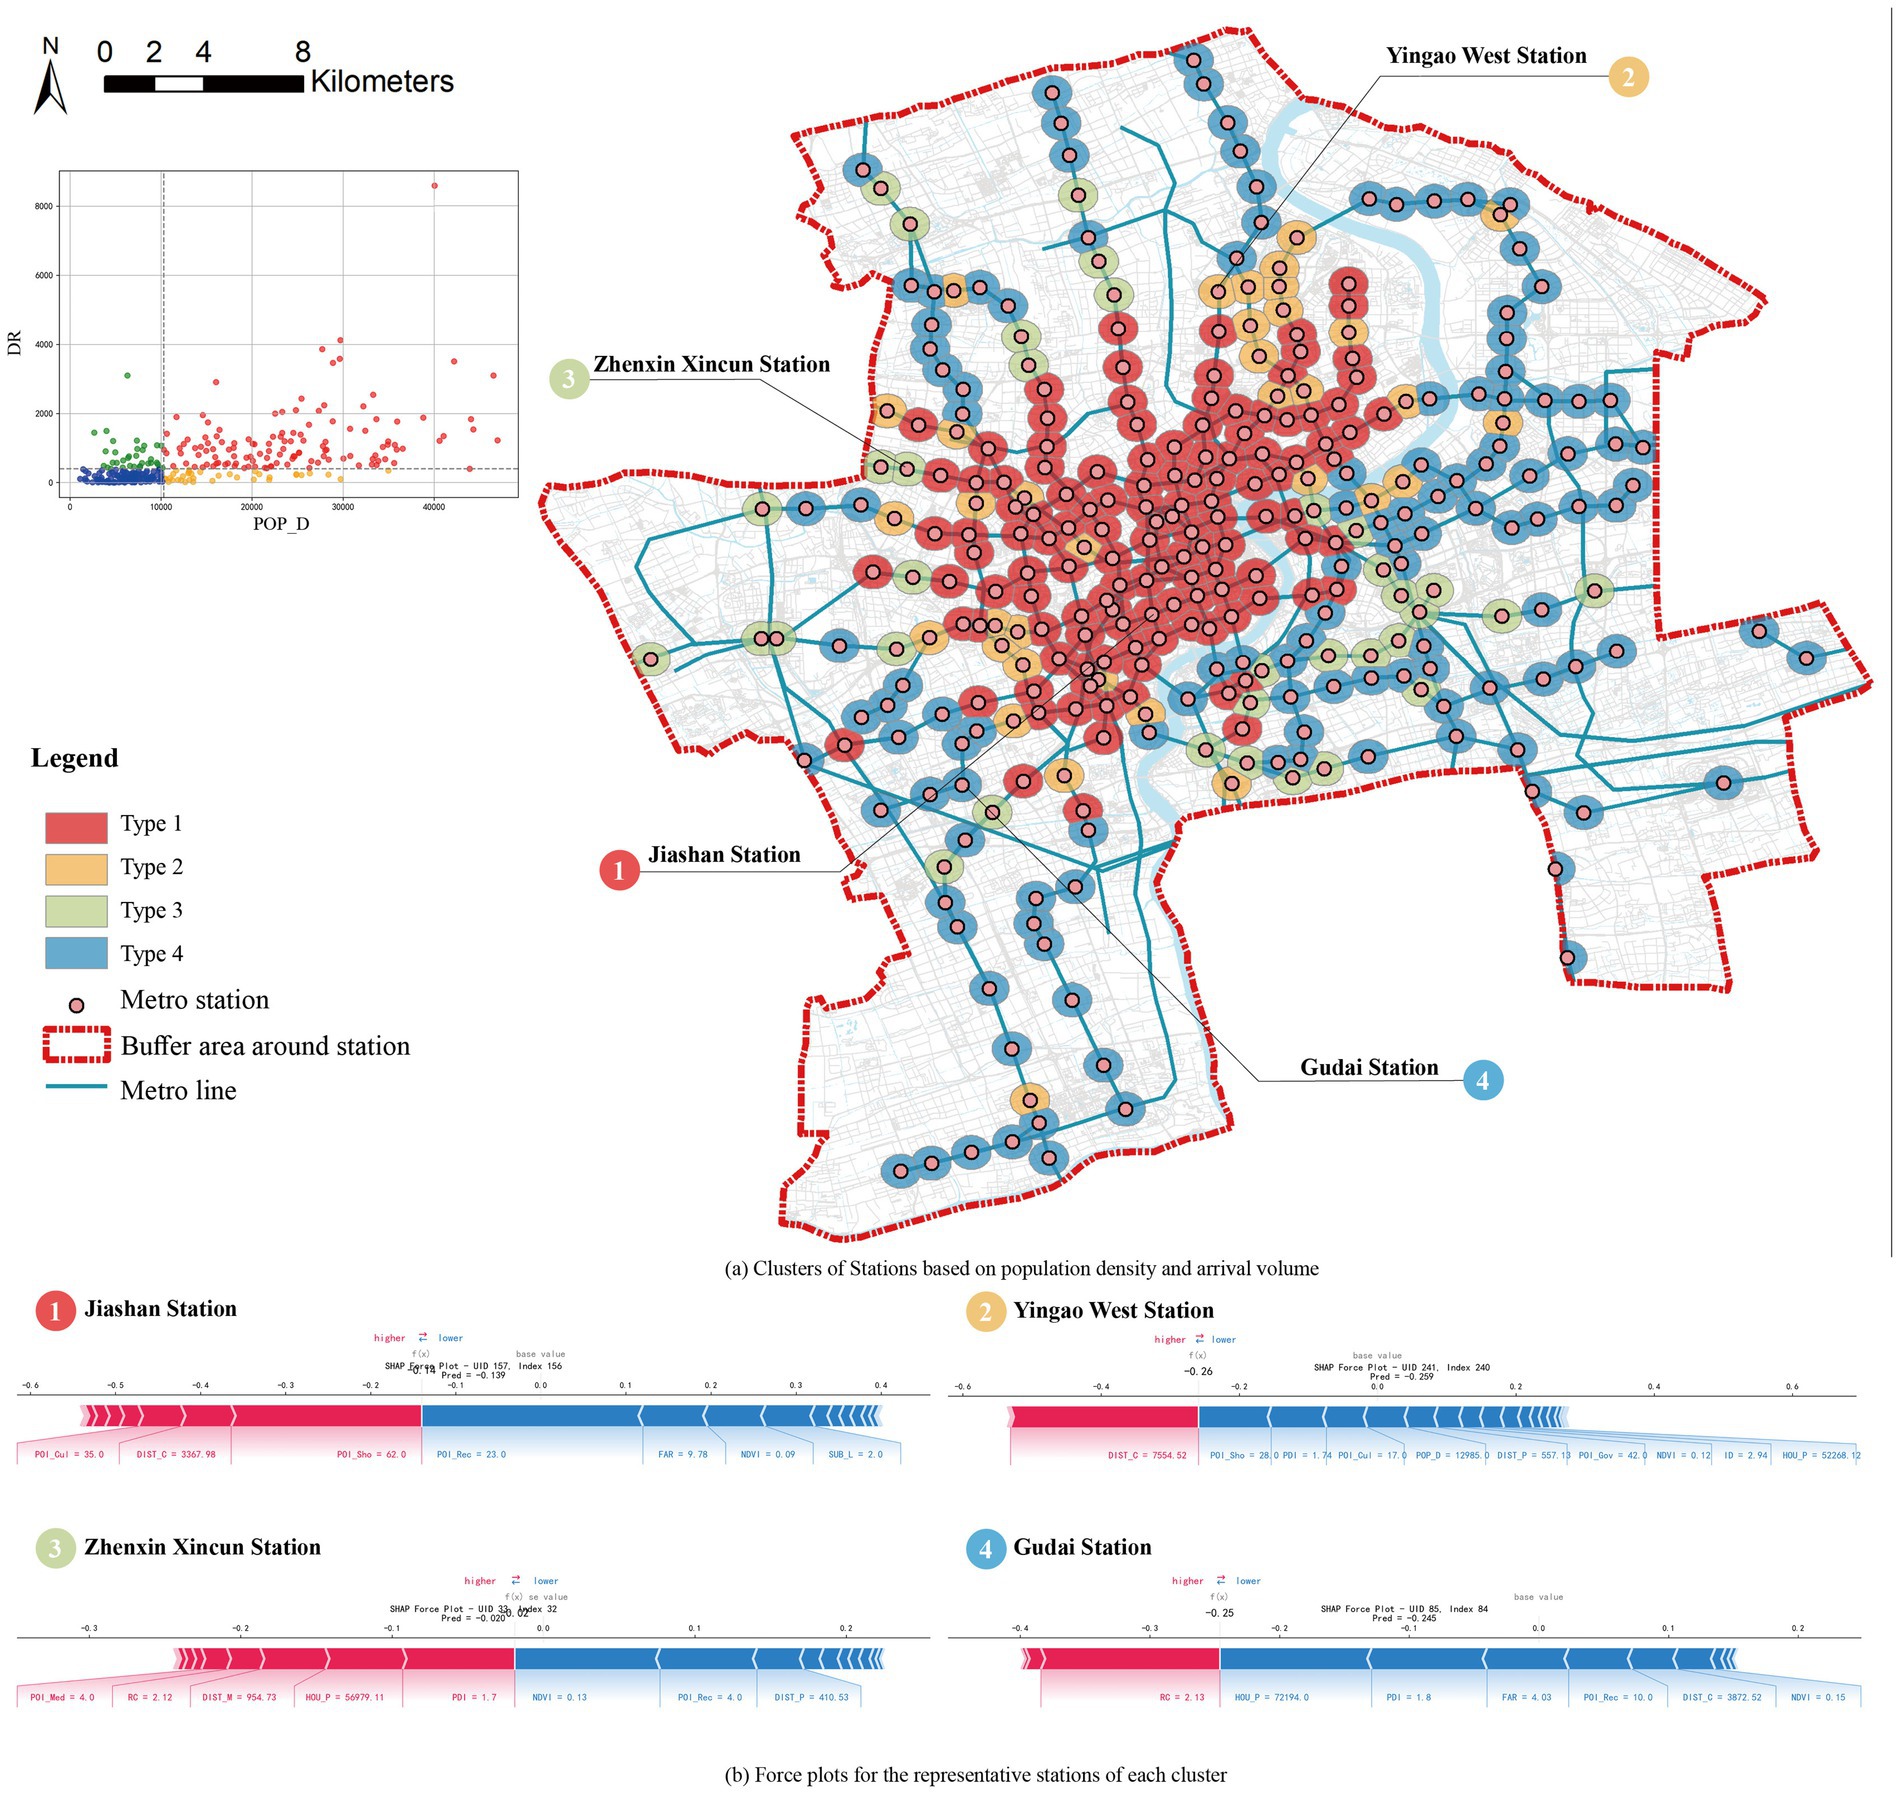
Figure 11. Station categories and representative stations SHAP plots.
Within each type, we utilized SHAP values from the localized Geographically Weighted Random Forest (GWRF) models and identified representative stations whose predicted ridership values, calculated as the sum of SHAP contributions, were closest to the category mean. Although these stations cannot capture every variation within their respective groups, they provide illustrative examples of the dominant driving factors. Force plots were then generated for these representative stations to visually depict the positive and negative contributions of variables. In these plots, red arrows indicate positive effects on ridership, while blue arrows denote negative effects, with arrow length and transparency corresponding to contribution magnitude.
Type 1 is High Population Density—High Ridership represented by Jiashan Road Station, included stations primarily located in core urban areas between the Inner and Middle Ring roads, such as those in Huangpu, Xuhui, Hongkou, Jing’an districts. Moreover, these stations are often located in TOD zones or major transport hubs with dense residential and commercial activity and high travel demand. SHAP results revealed strong positive contributions from POI_Cul, POI_Sho, and DIST_C, underscoring the advantages of mixed-use development and central accessibility (Yang et al., 2024; Yang et al., 2022). Conversely, FAR, NDVI, and SUB_L exerted negative influences, likely due to high development intensity compressing walkability, limited green space, or increased transfer complexity (Guo et al., 2023; Yang et al., 2022).
Type 2 is High Population Density—Low Ridership represented by Yingaoxi Road Station, included stations mainly located at core area edges or in aging high-density residential zones, such as stations in Putuo, Yangpu, Changning districts. Normally, these stations exhibit high population but relatively lower activity, likely stemming from insufficient facilities or suboptimal BE quality. SHAP analysis identified dominant negative contributors like PDI, POI_Sho, and POI_Cul, indicating that existing diversity fails to generate sufficient appeal. NDVI and DIST_P also showed negative effects, emphasizing green accessibility’s role in motivating older adults’ metro travel (Guo et al., 2023).
Type 3 is Low Population Density—High Ridership represented by Zhenxin Xincun Station, including stations typically in emerging peripheral hubs or transport nodes in Baoshan, Minhang, or Pudong districts, which achieved high ridership despite lower density, driven by superior accessibility and services. SHAP results highlighted positive drivers such as POI_Med, RC, and DIST_M, underscoring infrastructure and service accessibility’s importance for older adults (Yang et al., 2022; Sun et al., 2023). NDVI and DIST_P remained negative, pointing to ongoing green space accessibility challenges.
Type 4 is Low Population Density—Low Ridership represented by Gudai Road Station, including stations predominantly in outer residential or newly developed zones in Baoshan, Minhang, and Pudong districts. These areas suffer from limited infrastructure and functional supply, leading to low demand. SHAP results indicated markedly low predicted ridership, with RC as the sole notable positive factor. Variables like HOU_P, FAR, PDI, and POI_Rec exert negative impacts, implying that without complementary age-friendly amenities, development intensity and high prices may heighten environmental complexity and perceived barriers, deterring older adults (Guo et al., 2023; Salvador et al., 2024). Furthermore, while high housing prices and FAR often signal urban centrality and functional density, their decoupling from senior-oriented facilities can amplify perceived stress and suppress mobility (Guo et al., 2023; Zang et al., 2019).
5 Discussion and conclusion
This study aimed to identify metro travel chains of older adults in Shanghai using large-scale metro smart card data, and further analyzes the complex interactions between their destination choices and built environment factors by integrating a Geographically Weighted Random Forest (GWRF) model with SHAP-based interpretability techniques. The research identified key factors influencing older adults’ metro destination choices, and uncovered localized determinants across different density contexts. This work enriched the application of interpretable machine learning tools in urban mobility studies and established a data-driven, spatially targeted framework for urban interventions. Moreover, it provided empirical and methodological support for aging-friendly urban regeneration and the implementation of Transit-Oriented Development (TOD) strategies.
Older adults’ metro travel behavior is profoundly shaped by various built environment factors, including service supply structures, environmental quality, and accessibility systems. A defining feature is their high dependence on non-commuting functional facilities and heightened sensitivity to spatial complexity. Consistent with existing findings (Cerin et al., 2017; Hu et al., 2013), our study extracted specific travel chains and observed that older adults tend to follow a simple travel pattern while avoid peak-hour travel. However, these patterns may not solely reflect natural behavioral preferences; the preferential Baotong Card policy in Shanghai, which provides free or discounted metro travel during off-peak periods, could also reinforce or amplify such tendencies. Such tendencies typically reflect everyday needs like medical visits, social interactions, shopping, and leisure, underlining their preference for safe, convenient, and predictable travel environments. Clarke and Gallagher similarly suggest that older adults’ travel is driven primarily by daily activity needs (Clarke and Gallagher, 2013). Spatially, these travel patterns form linear corridors from urban cores to peripheral zones, indicating a core-function-based, high-accessibility-driven spatial structure (Li et al., 2021). By extracting destination-specific ridership from smart card data, this study further highlights spatial heterogeneity and concentration of older adults’ travel demand, providing more detailed insights compared to traditional aggregate ridership analyses (Yang et al., 2022; Chen et al., 2023).
From a global perspective, shopping, living services, and government facilities ranked as the top three contributors, followed by cultural, medical, and recreational amenities, confirming the functional destination-oriented nature of older adults’ metro travel (Yang et al., 2022; Yang et al., 2024). Transfer stations also played a critical role, as they combine high accessibility and multiple functional overlays, serving as travel hubs for older adults (Yang et al., 2022). In contrast, density-related variables like intersection density and floor area ratio, as well as diversity indices, showed relatively lower importance, deviating from traditional findings that emphasize density and diversity as decisive factors for transit usage (Cerin et al., 2017; Ewing and Cervero, 2010). A possible explanation lies in Shanghai’s intensely developed central areas, where traditional density indicators have reached saturation, resulting in diminishing marginal returns. Recent studies have noticed that in such “over-saturated built environments,” spatial complexity, cognitive burden, and walkability barriers can act as inhibitors for older adults, even when functional density is high (Guo et al., 2023; Chen et al., 2023).
The study also identified clear threshold effects in built environment variables. For instance, commercial and service facilities showed diminishing returns beyond a certain volume, while NDVI exhibited a inverted U-shaped effect, indicating a trade-off between green space availability and destination functionality. These findings enrich the literature on nonlinear built environment influences. Partial dependence analysis confirms that “more is better” does not always apply in high-density settings. For example, shopping and service facilities show decreasing marginal effects beyond a threshold, while cultural, medical, and recreational facilities, due to their relative scarcity, exert consistently increasing influence (Yang et al., 2022; Yang et al., 2024). Similarly, road density demonstrated a threshold effect, highlighting older adults’ need for a balance between accessibility and safety (Yang et al., 2024). NDVI’s inverted U-shaped curve suggested that moderate greening improves comfort and promotes travel, while excessive greenery may indicate peripheral areas with weak functionality, thus inhibiting mobility (Gong et al., 2016). These nuanced findings clarify the preference of older adults for moderate environmental complexity and optimal facility distribution.
Interaction effect analysis further deepened our understanding of built environment dynamics, identifying both synergistic and suppressive relationships between variables. Combinations like land use diversity and POI diversity show suppressive effects. Excessive environmental complexity and facility density may increase cognitive burden and safety concerns among older adults, thus reducing their willingness to travel (Maresova et al., 2023). On the other hand, interaction terms involving intersection density, diversity indices, and road connectivity demonstrate synergistic enhancement, suggesting that a well-connected street network can amplify the positive effects of other facilities, especially in highly heterogeneous environments (Gu et al., 2022). Furthermore, this study’s stratified analysis based on population and ridership conditions captured significant spatial heterogeneity, reinforcing the importance of localized planning strategies.
Practically, this research extended traditional TOD frameworks by emphasizing aging-friendly planning considerations in high-density urban context. Conventional urban development strategies based on “density–diversity” must evolve toward “people-centered, functionally adaptive, and systemically coordinated” models (Du et al., 2022; Chen et al., 2023). Instead of prioritizing facility density alone, planning should focus on whether infrastructure matches older adults’ daily rhythms, functional needs, and perceptual experiences, thereby building a more inclusive and resilient mobility environment. Digital tools now enable the capture of travel behaviors and evaluation of spatial interventions dynamically, prompting a governance shift toward behavior-responsive, real-time interventions essential for building age-friendly urban ecosystems.
Tailored planning strategies should acknowledge distinct regional characteristics. Specifically, differentiated strategies should be developed based on the varying urban regional contexts. In the urban core, the concentration of commercial, cultural, and governmental facilities, along with intensive metro lines and transfer stations, naturally attracts ridership (Guo et al., 2023; Yang et al., 2022). However, excessively high floor area ratios, complex transfer environments, and limited green spaces in core areas may impose cognitive difficulties and psychological burdens on older adults, thus negatively affecting their willingness to travel (Peng et al., 2024; Xi et al., 2024). High-density residential zones surrounding the core, although relatively well-developed, should continue enhancing the construction of “15-min neighborhoods” and embedding various functional facilities within urban renewal initiatives. Moreover, community micro-renewal projects should incorporate accessible small- to medium-sized green spaces (Guo et al., 2023; Yang et al., 2022).
Peripheral secondary sub-center stations play a crucial role for older adults’ travel and represent key areas for future aging-friendly metro ridership growth. These areas should enhance the provision of non-commuting functional facilities specifically oriented toward older adults, such as healthcare, cultural, and leisure amenities, thus increasing destination attractiveness and providing vital daily support. Additionally, enhancing the connectivity of surrounding street networks and improving the accessibility of green and open spaces can significantly alleviate cognitive and physical stress in high-density urban environments for older adults (Guo et al., 2023; Yang et al., 2022).
In newly developing peripheral areas, still in the early stages of urban expansion and functional integration, the TOD development approach should emphasize coordinated layouts of infrastructure and service facilities. Incorporating small- and medium-scale commercial services through urban operation strategies can prevent community hollowing caused by functional deficiencies. Moreover, improving metro connections with central urban areas, optimizing barrier-free pedestrian environments around stations, and enhancing transit services will ensure convenient and efficient cross-district travel for older adults, driven by their needs (Guo et al., 2023; Yang et al., 2024).
Nevertheless, this study has several limitations. First, it primarily relies on Baotong Card smart card data and macro- to mid-scale built environment indicators, without considering micro-scale attributes such as sidewalk width, walkability, accessibility, or visual greenness, which could better capture fine-grained environmental influences on mobility. Second, the dataset is restricted to older adults aged 70 and above who benefit from Shanghai’s preferential Baotong Card policy, which incentivizes off-peak metro use. While this provides valuable insights into an important subgroup, the observed behavioral patterns may be shaped partly by institutional policy effects rather than purely natural preferences. Third, although Shanghai serves as a representative case of high-density urbanism, its unique demographic and policy context may constrain the broader generalizability of the findings. Future research should draw on multi-source datasets covering a wider range of elderly metro users as well as other population groups, employ causal inference and quasi-experimental approaches with spatiotemporal behavior data, and integrate multi-dimensional built environment measures to establish a more comprehensive analytical framework.
In conclusion, this study employed large-scale smart card data and interpretable machine learning to elucidate how built environment factors influence older adults’ metro travel in high-density cities. It advanced understanding of age-friendly planning and offers a robust evidence base for targeted, inclusive urban mobility strategies. Given the spatial heterogeneity of travel-environment dynamics, typological interventions are essential to creating truly inclusive and resilient urban mobility systems.
Data availability statement
The original contributions presented in the study are included in the article/Supplementary material, further inquiries can be directed to the corresponding author.
Author contributions
BL: Conceptualization, Data curation, Formal analysis, Methodology, Software, Visualization, Writing – original draft. SF: Conceptualization, Data curation, Methodology, Software, Visualization, Writing – original draft. HZ: Funding acquisition, Resources, Writing – review & editing. SJ: Data curation, Supervision, Writing – review & editing. CL: Formal analysis, Funding acquisition, Writing – review & editing. YC: Formal analysis, Resources, Writing – original draft. ZC: Conceptualization, Methodology, Resources, Supervision, Writing – review & editing.
Funding
The author(s) declare that financial support was received for the research and/or publication of this article. Shanghai Municipal Housing and Urban-Rural Development Administration Committee Scientific Research Project (Hu Jian Ke 2024–005-011).
Conflict of interest
SJ and CL were employed by Shanghai Shentong Metro Group Co. Ltd.
The remaining authors declare that the research was conducted in the absence of any commercial or financial relationships that could be construed as a potential conflict of interest.
Generative AI statement
The authors declare that Gen AI was used in the creation of this manuscript. Generative AI was used solely for grammar, spelling check, language editing. All research contents were originally generated by the authors.
Any alternative text (alt text) provided alongside figures in this article has been generated by Frontiers with the support of artificial intelligence and reasonable efforts have been made to ensure accuracy, including review by the authors wherever possible. If you identify any issues, please contact us.
Publisher’s note
All claims expressed in this article are solely those of the authors and do not necessarily represent those of their affiliated organizations, or those of the publisher, the editors and the reviewers. Any product that may be evaluated in this article, or claim that may be made by its manufacturer, is not guaranteed or endorsed by the publisher.
Supplementary material
The Supplementary material for this article can be found online at: https://www.frontiersin.org/articles/10.3389/frsc.2025.1681723/full#supplementary-material
Footnotes
References
Affairs SMOftE. Release of comprehensive statistical information on the elderly population, aging undertakings, and elderly care services in Shanghai in 2024 Shanghai: Putuo District government of Shanghai (2025). Available online at: https://www.shpt.gov.cn/zhengwu/ylfwzc-mzjylfw/2025/140/196297.html (Accessed June 20, 2025).
Agard, B., Morency, C., and Trépanier, M. (2006). Mining public transport user behaviour from smart card data. IFAC Proc Volumes 39, 399–404. doi: 10.3182/20060517-3-FR-2903.00211
Cerin, E., Nathan, A., van Cauwenberg, J., Barnett, D. W., and Barnett, A. (2017). The neighbourhood physical environment and active travel in older adults: a systematic review and meta-analysis. Int. J. Behav. Nutr. Phys. Act. 14:15. doi: 10.1186/s12966-017-0471-5
Cervero, R., and Kockelman, K. (1997). Travel demand and the 3Ds: density, diversity, and design. Transp. Res. D Transp. Environ. 2, 199–219. doi: 10.1016/S1361-9209(97)00009-6
Chen, Z. H., Li, P. R., Jin, Y. X., Bharule, S., Jia, N., Li, W. J., et al. (2023). Using mobile phone big data to identify inequity of aging groups in transit-oriented development station usage: a case of Tokyo. Transp. Policy 132, 65–75. doi: 10.1016/j.tranpol.2022.12.010
Chen, E. H., Liu, Y., and Yang, M. (2023). Revealing senior mobility patterns and activities in urban transit systems. IEEE Trans. Intell. Transp. Syst. 24, 11424–11437. doi: 10.1109/TITS.2023.3275389
Chen, L., Lu, Y., Liu, Y. F., Yang, L. C. A., Peng, M. J., and Liu, Y. L. (2022). Association between built environment characteristics and metro usage at station level with a big data approach. Travel Behav. Soc. 28, 38–49. doi: 10.1016/j.tbs.2022.02.007
Chen, J., Tian, W., Xu, K., and Pellegrini, P. (2022). Testing small-scale vitality measurement based on 5D model assessment with multi-source data: a resettlement community case in Suzhou. ISPRS Int. J. Geo Inf. 11:626. doi: 10.3390/ijgi11120626
Chen, Y. Y., Yuan, R., Wei, J. M., and Li, S. C. (2023). Research on the influencing factors of elderly pedestrian traffic accidents considering the built environment. Int. Rev. Spat. Plann. Sustain. Dev. 11, 44–63. doi: 10.14246/irspsd.11.1_44
Cheng, L., Chen, X. W., Yang, S., Cao, Z., De Vos, J., and Witlox, F. (2019). Active travel for active ageing in China: the role of built environment. J. Transp. Geogr. 76, 142–152. doi: 10.1016/j.jtrangeo.2019.03.010
Cheng, L., Shi, K., De Vos, J., Cao, M., and Witlox, F. (2021). Examining the spatially heterogeneous effects of the built environment on walking among older adults. Transp. Policy 100, 21–30. doi: 10.1016/j.tranpol.2020.10.004
Clarke, P., and Gallagher, N. A. (2013). Optimizing mobility in later life: the role of the urban built environment for older adults aging in place. J. Urban Health Bull. NY Acad. Med. 90, 997–1009. doi: 10.1007/s11524-013-9800-4
Diao, M., Lin, K. Y., and Chang, Z. (2024). Impacts of new metro lines on the activity space of older people. Transp. Res. D Trans. Environ. 137:104505. doi: 10.1016/j.trd.2024.104505
Du, Y., Sun, G. B., and Kwan, M. P. (2022). Transit-oriented development for older people: does using multiple public transport options improve their physical and mental health? J. Transp. Land Use 15, 729–753. doi: 10.5198/jtlu.2022.2152
Ewing, R., and Cervero, R. (2010). Travel and the built environment. J. Am. Plan. Assoc. 76, 265–294. doi: 10.1080/01944361003766766
Gan, Z. X., Feng, T., Wu, Y. T., Yang, M., and Timmermans, H. (2019). Station-based average travel distance and its relationship with urban form and land use: an analysis of smart card data in Nanjing City, China. Transp. Policy 79, 137–154. doi: 10.1016/j.tranpol.2019.05.003
Georganos, S., Grippa, T., Gadiaga, A. N., Linard, C., Lennert, M., Vanhuysse, S., et al. (2021). Geographical random forests: a spatial extension of the random forest algorithm to address spatial heterogeneity in remote sensing and population modelling. Geocarto Int. 36, 121–136. doi: 10.1080/10106049.2019.1595177
Gong, FY, Zheng, ZC, and Ng, E, editors. Modeling elderly accessibility to urban green space in high density cities: A case study of Hong Kong. International conference on geographies of health and living in cities - making cities healthy for all (H-cities) ; (2016) JuUniv Hong Kong, Hong Kong, Amsterdam, Netherlands: PEOPLES R CHINA2016.
Government PNA. Metro lines in Shanghai Shanghai: Pudong new area government (2017). Available online at: https://english.pudong.gov.cn/2017-07/19/c_84850_3.htm (Accessed June 18, 2025).
Gu, Z. N., Luo, X. L., Chen, Y. R., Liu, X. M., Xiao, C. R., and Liang, Y. F. (2022). Density, diversity, and design: evaluating the equity of the elderly communities in three measures of the built environment. Land 11:1976. doi: 10.3390/land11111976
Guo, C., Jiang, Y. Q., Qiao, R. L., Zhao, J. B., Weng, J. C., and Chen, Y. (2023). The nonlinear relationship between the active travel behavior of older adults and built environments: a comparison between an inner-city area and a suburban area. Sustain. Cities Soc. 99:104961. doi: 10.1016/j.scs.2023.104961
Haan, C. Free subway rides for seniors strains South Korea’s railways, and ignites debate: Koreapro (2024). Available online at: https://koreapro.org/2024/05/free-subway-rides-for-seniors-strains-south-koreas-railways-and-ignites-debate/?utm_source=chatgpt.com (Accessed June 18, 2025).
Hu, XW, Wang, J, and Wang, L, editors. Understanding the travel behavior of elderly people in the developing country: A case study of Changchun, China. 13th COTA international conference of transportation professionals (Amsterdam, Netherlands: CICTP); (2013)
Huang, J., Xiong, M. C., Wang, J., Cheng, L., and Yang, H. R. (2024). Investigating socio-spatial differentiation for metro travelers using smart card data: older people vs. others. Appl. Geogr. 165:103230. doi: 10.1016/j.apgeog.2024.103230
Kang, C.-D. (2018). The s+5ds: spatial access to pedestrian environments and walking in Seoul, Korea. Cities 77, 130–141. doi: 10.1016/j.cities.2018.01.019
Kesarovski, T., and Hernandez, F. (2023). Time, the other dimension of urban form: measuring the relationship between urban density and accessibility to grocery shops in the 10-minute city. Environ. Plan. Urban Analytics City Sci. 50, 44–59. doi: 10.1177/23998083221103259
Lei, D., Chen, X. W., Cheng, L., Zhang, L., Ukkusuri, S. V., and Witlox, F. (2020). Inferring temporal motifs for travel pattern analysis using large scale smart card data. Transp. Res. C Emerg. Technol. 120:102810. doi: 10.1016/j.trc.2020.102810
Li, C., Bai, L., Liu, W., Yao, L. N., and Waller, S. T. (2021). Urban mobility analytics: a deep spatial-temporal product neural network for traveler attributes inference. Transp. Res. C Emerg. Technol. 124:102921. doi: 10.1016/j.trc.2020.102921
Li, Z., Zhen, F., Zhang, S., and Yang, Y. (2021). Seasonal and spatiotemporal differences in the public transport-based mobility of elderly population: a case study of Wuhu City in Anhui Province. Prog. Geogr. 40, 293–303. doi: 10.18306/dlkxjz.2021.02.010
Liu, X. H., Ye, Q., Li, Y., Yang, K. D., and Shao, X. (2025). Investigating relationships between ride sourcing and public transit using big data analysis and nonlinear machine learning: a case study of Shanghai, China. Transp. Res. A Policy Practice 192:104339. doi: 10.1016/j.tra.2024.104339
Liu, X., Yu, Q., Bian, W., Yu, H., Zhang, C., Liu, X., et al. (2025). Unraveling spatiotemporal dynamics of ridesharing potential: nonlinear effects of the built environment. Transp Res Part D: Transp Environ 139:104594. doi: 10.1016/j.trd.2025.104594
Lu, B., Liu, Q. Y., Liu, H., and Long, T. X. (2025). Exploring nonlinear and interaction effects of urban campus built environments on exercise walking using crowdsourced data. Front. Public Health 13:1549786. doi: 10.3389/fpubh.2025.1549786
Lundberg, S. M. (2017) in A unified approach to interpreting model predictions. Advances in neural information processing systems (NeurIPS 2017). ed. S. Lee (New York, USA: Curran Associates, Inc.).
Maresova, P., Krejcar, O., Maskuriy, R., Bakar, N. A. A., Selamat, A., Truhlarova, Z., et al. (2023). Challenges and opportunity in mobility among older adults - key determinant identification. BMC Geriatr. 23:447. doi: 10.1186/s12877-023-04106-7
Nduwayezu, G., Zhao, P. X., Kagoyire, C., Eklund, L., Bizimana, J. P., Pilesjo, P., et al. (2023). Understanding the spatial non-stationarity in the relationships between malaria incidence and environmental risk factors using geographically weighted random forest: a case study in Rwanda. Geospat. Health 18:1184. doi: 10.4081/gh.2023.1184
Peng, B. Z. Z., Zhang, Y., Wang, T., and Li, C. Y. (2024). Exploring nonlinear effects of the built environment on employment behavior among older adults: evidence from metro station catchment areas. ISPRS Int. J. Geo Inf. 13:420. doi: 10.3390/ijgi13120420
Salvador, C. C., Lopes, A. A. S., Saboya, R. T., Kanashiro, M., and d’Orsi, E. (2024). Land use mix and walking for transportation among older adults: an approach based on different metrics of the built environment. Urbe Rev. Bras. Gestão Urbana 16, 1–19. doi: 10.1590/2175-3369.016.e20220211
Schmöcker, J. D., Su, F. M., and Noland, R. B. (2010). An analysis of trip chaining among older London residents. Transportation 37, 105–123. doi: 10.1007/s11116-009-9222-z
Shi, Z. B., Liu, Y., He, M. W., and Liu, Q. Y. (2022). How does built environment affect metro trip time of elderly? Evidence from smart card data in Nanjing. J. Adv. Transp. 2022, 1–17. doi: 10.1155/2022/2080552
Shi, Z. C., Liu, X. T., Lai, J. H., Tong, C. Z., Zhang, A. S., and Shi, W. Z. (2021). A data-driven framework for analyzing spatial distribution of the elderly cardholders by using smart card data. ISPRS Int. J. Geo Inf. 10:728. doi: 10.3390/ijgi10110728
Sun, J. R., Zhu, Z. J., Han, J., He, Z. P., and Xu, X. F. (2023). Influence of the built environment on older adults' travel time: evidence from the Nanjing metropolitan area, China. Land 12:1264. doi: 10.3390/land12061264
Wang, Z. B., Li, S. H., Li, Y. J., Liu, D., Liu, S. Y., and Chen, N. (2023). Investigating the nonlinear effect of built environment factors on metro station-level ridership under optimal pedestrian catchment areas via the machine learning method. Appl. Sci. 13:12210. doi: 10.3390/app132212210
Wang, Z. J., and Shi, P. J. (2017). Analyses of metro station service area in Shanghai downtown based on traffic networks. J. Indian Soc. Remote Sens. 45, 337–352. doi: 10.1007/s12524-016-0595-0
Wei, J. M., Kan, Z. H., Kwan, M. P., Liu, D., Su, L. X., and Chen, Y. Y. (2024). Uncovering travel communities among older and younger adults using smart card data. Appl. Geogr. 173:103453. doi: 10.1016/j.apgeog.2024.103453
Wen, C., Albert, C., and Von Haaren, C. (2018). The elderly in green spaces: exploring requirements and preferences concerning nature-based recreation. Sustain. Cities Soc. 38, 582–593. doi: 10.1016/j.scs.2018.01.023
WHO. Ageing and health Geneva, Switzerland: World Health Organization (2024) Available online at: https://www.who.int/news-room/fact-sheets/detail/ageing-and-health (Accessed June 18, 2025).
Xi, Y. F., Hou, Q. H., Duan, Y. Q., Lei, K. X., Wu, Y., and Cheng, Q. Y. (2024). Exploring the spatiotemporal effects of the built environment on the nonlinear impacts of metro ridership: evidence from Xi'an, China. ISPRS Int. J. Geo Inf. 13:105. doi: 10.3390/ijgi13030105
Xin, L. Shanghai, in motion Shanghai: Sixth tone (2023). Available online at: https://www.sixthtone.com/news/1012982 (Accessed June 20, 2025).
Yang, W., Fei, J., Li, Y. P., Chen, H., and Liu, Y. (2024). Unraveling nonlinear and interaction effects of multilevel built environment features on outdoor jogging with explainable machine learning. Cities 147:104813. doi: 10.1016/j.cities.2024.104813
Yang, W., Li, Y., Liu, Y., Fan, P., and Yue, W. (2024). Environmental factors for outdoor jogging in Beijing: insights from using explainable spatial machine learning and massive trajectory data. Landsc. Urban Plan. 243:104969. doi: 10.1016/j.landurbplan.2023.104969
Yang, H., Peng, J. D., Lu, Y., Wang, J. J., and Yan, X. X. (2024). Nonlinear impact of built environment on people with disabilities' metro use behavior. Appl. Geogr. 169:103323. doi: 10.1016/j.apgeog.2024.103323
Yang, H., Ruan, Z. H., Li, W. S., Zhu, H. J., Zhao, J., and Peng, J. D. (2022). The impact of built environment factors on elderly people's mobility characteristics by metro system considering spatial heterogeneity. ISPRS Int. J. Geo Inf. 11:315. doi: 10.3390/ijgi11050315
Yang, L., Yang, H., Cui, J., Zhao, Y., and Gao, F. (2024). Non-linear and synergistic effects of built environment factors on older adults’ walking behavior: an analysis integrating LightGBM and SHAP. Trans. Urban Data Sci. Technol. 3, 46–60. doi: 10.1177/27541231241249866
Yang, H. R., Zhang, Q. R., Wen, J., Sun, X., and Yang, L. C. (2024). Multi-group exploration of the built environment and metro ridership: comparison of commuters, seniors and students. Transp. Policy 155, 189–207. doi: 10.1016/j.tranpol.2024.06.020
Zang, P., Lu, Y., Ma, J., Xie, B., Wang, R. Y., and Liu, Y. (2019). Disentangling residential self-selection from impacts of built environment characteristics on travel behaviors for older adults. Soc. Sci. Med. 238:112515. doi: 10.1016/j.socscimed.2019.112515
Zhang, R. Y., Huang, L., and Wang, H. (2023). Accessibility improvement and renewal of urban park green space for the elderly and the disabled. Forests 14:1801. doi: 10.3390/f14091801
Zhang, W. J., Lu, D. M., Chen, Y. Y., and Liu, C. C. (2021). Land use densification revisited: nonlinear mediation relationships with car ownership and use. Transp. Res. D Transport Environ. 98:102985. doi: 10.1016/j.trd.2021.102985
Zhang, S., Zhang, K., Liu, X. Y., Zeng, J., Liu, Y., and Zhao, L. (2022). Characterisation of elderly daily travel behaviour in Tianjin using a space-time cube. Environ. Plann. B Urban Analytics City Sci. 49, 603–618. doi: 10.1177/23998083211019756
Keywords: older adults, travel chain, built environment, nonlinear relationships, high-density
Citation: Lu B, Fan S, Zhang H, Jiang S, Liu C, Chen Y and Chen Z (2025) How does the built environment in high-density cities affect subway travel for the older adults: insights from travel chain and explainable machine learning. Front. Sustain. Cities. 7:1681723. doi: 10.3389/frsc.2025.1681723
Edited by:
Haoyu Hu, The Chinese University of Hong Kong, ChinaReviewed by:
Liangkan Chen, Institute of Geographic Sciences and Natural Resources Research (CAS), ChinaYongheng Feng, Peking University, China
Copyright © 2025 Lu, Fan, Zhang, Jiang, Liu, Chen and Chen. This is an open-access article distributed under the terms of the Creative Commons Attribution License (CC BY). The use, distribution or reproduction in other forums is permitted, provided the original author(s) and the copyright owner(s) are credited and that the original publication in this journal is cited, in accordance with accepted academic practice. No use, distribution or reproduction is permitted which does not comply with these terms.
*Correspondence: Zheng Chen, emhlbmdjaGVuQHRvbmdqaS5lZHUuY24=