Abstract
Urban congestion significantly impairs economic output, energy efficiency, and mobility in India’s fast-expanding cities. This study focuses on Panagal Park, T. Nagar, an at-grade commercial crossroads, and Kathipara Junction, a grade-separated interchange, in order to build a quantitative, intersection-specific approach for diagnosing and controlling congestion in Chennai. LOS E–F situations with Degree of Saturation (DoS) values between 1.32 and 1.45, indicating near or complete flow breakdown, are shown by the findings of delay-based Level of Service (LOS) analysis, traffic-volume counts at 15-min intervals, and video-derived journey durations. There was a cumulative delay of 12,708 vehicle minutes (212 vehicle hours) with operating speeds as low as 1.5 km/h due to peak-hour traffic, which reached 10,230 vehicles per hour at Kathipara and 8,960 vehicles per hour at Panagal Park. Beyond descriptive evaluation, the study presents a decision-oriented congestion assessment model that translates LOS–DoS outcomes into measurable performance indicators for prioritizing intersection upgrades. The study offers planners and policymakers a reproducible method to statistically benchmark intersection efficiency by tying empirical delay data to adaptive signal optimization, congestion-pricing viability, and multimodal corridor management. The framework combines data-driven design principles with field-based performance measures to create one of the first intersection-level models for sustainable mobility planning in Indian megacities. This is a big step forward for both research and practice.
1 Introduction
1.1 Background
In the framework of global urbanization, urban centers are key players in determining national development and are hubs for social interaction, cultural expression, and economic growth (Tesfaye Demdime, 2012). A robust and effective transportation system is essential for supporting urban economic activity and enabling the efficient movement of people and goods across the city (Almselati et al., 2011). Urban transportation systems are under increasing pressure to adapt in today’s rapidly changing world, characterized by globalization, technological innovation, and shifting economies. Adequate transportation infrastructure is becoming increasingly necessary as cities grow, as it is essential for maintaining economic production and enhancing the quality of life (Satterthwaite, 2007).
India is undergoing a dramatic phase of urban expansion. The country’s urban population is projected to rise from 483 million in 2021 to over 675 million by 2035 (Habitat, 2020). Among the major urban centers, Chennai, the capital of Tamil Nadu and one of India’s leading metropolises, is experiencing rapid urbanization, rising vehicle ownership, and increased daily commute demand (Chennai Metropolitan Development Authority (CMDA), 2019). As of 2023, the city’s transport systems are under tremendous strain due to its anticipated population growth of over 10 million people and more than 4.9 million registered automobiles (Statistics, M. T, 2004).
Chennai still has a lot of traffic, especially at key intersections, even with significant investments in infrastructure, including flyovers, metro networks, and expanded roadways (Ramachandraiah, 2012). In addition to longer travel times and slower average speeds, this increasing imbalance between demand and road capacity has also resulted in deteriorating vehicle-related air pollution (Roychowdhury and Dubey, 2018a). The most affected areas are high-traffic areas, such as Panagal Park in T. Nagar, a busy commercial sector with high pedestrian flow, and Kathipara Junction, a vital flyover center (Centre of Excellence for Urban Transport, Indian Institute of Technology Madras, 2014).
A broader global problem is a part of these regional issues. The Schrank and Lomax (2009) estimated that lost time and wasted fuel cost the U.S. economy about $87.2 billion annually. This report highlights the magnitude of the financial burden caused by traffic congestion. Similar concerns have been raised in papers by India’s National Transport Development Policy Committee (Berisha, 2016; Chennai Metropolitan Development Authority (CMDA), 2019), which highlight how critical traffic congestion is to public health, urban sustainability, and economic efficiency in cities like Chennai.
Measuring congestion accurately is essential to solving these problems. Indicators such as travel time, delay, and LOS provide transportation engineers and urban planners with critical data that form the basis for improved solutions (Litman, 2022). This study examines two significant intersections in Chennai, combining quantitative traffic statistics and planning perspectives to inform decisions on managing urban congestion.
Although considerable research has been conducted on traffic congestion in Indian cities, particularly in Chennai, a significant lack of intersection-level analysis remains. Localized intersection performance has not received much attention in the past because most studies have concentrated on citywide models or traffic flow at the corridor level. To bridge that gap, this study examines two significant crossroads that represent distinct urban environments: Kathipara Junction and Panagal Park (T. Nagar). The research develops a system specifically designed to comprehend and manage congestion at these particular sites by fusing field-collected traffic volume data with delay-based LOS ratings and socioeconomic situations. The goal is to provide insights that can inform transport planning decisions, improve traffic management, and promote sustainable mobility strategies in Chennai and other metropolitan areas facing similar challenges.
1.2 Problem statement
Chennai, one of India’s largest cities, is home to a considerable amount of commercial, industrial, and IT-based activity zones. Tamil Nadu’s economic hub has become a major driving force due to the city’s central business districts, manufacturing corridors, and technological parks, with these areas contributing more than 30% of the state’s GDP (Tamil Nadu Government, 2019). A dependable and effective transportation network is crucial to maintaining growth by ensuring a smooth flow of people, products, and necessary services across the urban landscape (Singh, 2012).
In recent years, Chennai has seen worsening traffic congestion, particularly at key intersections like Kathipara and Panagal Park in T. Nagar. These locations serve as crucial hubs within the city’s transportation network but have evolved into congested hotspots, particularly during peak periods. Extended travel delays have resulted from congestion at these intersections, causing slower average vehicle speeds and increased levels of commuter fatigue. The effects of these impacts extend beyond mere inconvenience, affecting public health, economic production, and environmental quality (Roychowdhury and Dubey, 2018b).
It also has a significant impact on emergency response. Congestion at major intersections can hinder the response of police, fire, and emergency medical services. Regions such as T. Nagar or the highway-connected Kathipara interchange, which are densely populated or commercially active, pose a particularly high risk because any hold-up could be catastrophic. The overall efficiency of public safety operations is diminished by unpredictable traffic conditions and slower response times (Rasheed, 2022).
Urban congestion results in higher fuel consumption, increased emissions, and restricted access to markets, schools, and businesses. Rush hour travel times in Chennai often last 1.5 to 2 times longer than off-peak times, as stated by Chennai Metropolitan Development Authority (CMDA) (2019). Localised traffic data, especially at key intersections, is essential for creating effective traffic management solutions. This study aims to provide data-driven insights for more sustainable and effective urban transportation planning by conducting an analysis of traffic patterns at two of the city’s busiest intersections.
2 Research objectives and focus
Based on the notion that field-based metrics like LOS, DoS, and trip delay can be used to objectively evaluate Chennai’s intersection-level traffic congestion, this study was conducted. It is also predicted that intersections with poor multimodal integration, higher vehicle demand, and insufficient traffic-control systems will display LOS E–F situations, which signify severe congestion and decreased operational effectiveness.
The creation of a performance-based paradigm for managing traffic at Indian urban crossroads is supported by empirical data obtained from field observations at Panagal Park and Kathipara Junction.
2.1 Objective of the research
The primary objective of this study is to examine traffic congestion at two key intersections in Chennai: Panagal Park in T. Nagar and Kathipara Junction. We examine factors such as journey time, delay rates, and LOS indicators. By combining ideas from urban planning with real-world traffic data, the study enhances its understanding of how traffic affects vehicle flow, commuter experiences, and overall junction performance in congested metropolitan areas. For sustainable and efficient traffic management, it also seeks to promote more informed decision-making.
2.2 Study limitations
The study is subject to various real-world limitations. The depth of dynamic analysis was limited by the absence of official real-time traffic data sources. Pedestrian and vehicular traffic, particularly at peak hours and holidays, made field data collection more difficult. However, the possibility of collecting data for an extended period during various seasons or times of day was limited by time, financial, and resource constraints. The study provides a helpful summary of traffic patterns at two key intersections in Chennai, despite the challenges that may arise.
3 Methodology
To achieve its objectives, this study employed both qualitative and quantitative research methods. The primary objective was to assess traffic at two key intersections in Chennai: Panagal Park in T. Nagar and Kathipara Junction. Factors such as traffic volume, flow rates, delay ratios, travel time, total delay (in vehicle-minutes), congestion duration, and LOS were examined in the analysis, which conformed to the guidelines set out in research (Litman, 2022). A variety of techniques were used to gather the data, including field observations, video recordings, satellite imaging analysis, manual vehicle counts, and photographic documentation. To maintain uniformity during the periods of highest traffic, measurements were made in the morning and evening. The intricacy of pedestrian movement, traffic flow, and potential conflicts between various modes was captured through observations made at several points near each intersection, in accordance with the requirements (Chennai Metropolitan Development Authority (CMDA), 2019).
A triple-method approach was employed to bolster the study, integrating quantifiable data with subjective interpretations via surveys and interviews (Denzin, 2017). Individuals, including commuters, street vendors, auto drivers, and traffic personnel, were interviewed using concise questionnaires to grasp their experiences with congestion, safety issues, and traffic conduct. Both direct observations and covert as well as overt monitoring were employed to capture real-world behaviors such as jaywalking, signal violations, double parking, and informal stops. The video footage was beneficial for examining patterns such as queue lengths, pedestrian density, and signal hold-ups. A more thorough understanding of the impacts of congestion on various modes was provided by analyzing video frames to categorize delays by vehicle type, including cars, buses, autorickshaws, and two-wheelers (Papageorgiou et al., 2003).
Microsoft Excel software and SPSS (version 23) were used to evaluate data gathered in the field. Various visual tools, including delay curves, traffic volume charts, and LOS scoring tables, were developed to gain a clearer understanding of peak-time congestion (Bryman, 2016). Base layers for spatial mapping were created using QGIS 3.22, which incorporated imagery from Google Earth and OpenStreetMap (Google Earth, 2024). The qualitative responses from the interviews were analyzed using a methodology (Kvale, 1996) outlined in 1996. In this process, condensation was applied to distill lengthy responses into their core concepts. The information was then arranged into coherent and understandable flows through a process known as narrative structuring. Finally, interpreting the data involved drawing connections between the findings and broader urban planning and transportation contexts. The study ensured its trustworthiness by combining multiple sources through cross-verification, which included human interviews, video evidence, GIS data, and observation notes. This mixed-method approach enabled a thorough understanding of the traffic patterns at two of Chennai’s busiest and most complicated intersections.
This study effectively adapts well-known frameworks for assessing congestion, such as LOS and delay-based indicators (Aftabuzzaman, 2007), to the mixed-traffic environment of Chennai. This research takes into account the diverse vehicle compositions, different signal coordination, and pedestrian interactions seen at the intersections of Kathipara and Panagal Park, in contrast to earlier studies that apply these metrics to homogenous traffic systems. The accuracy of intersection-level analysis in Indian urban contexts is enhanced by this localized adaptation, which provides more accurate congestion predictions.
Furthermore, to record intersection dynamics at 15-min intervals, the system combines field-observed speed profiles, probe vehicle monitoring, and real-time video-based travel-time data. By considering factors that are rarely taken into account in traditional LOS-based research, such as pedestrian interference, irregular signal cycles, and heterogeneous traffic compositions, this hybrid analytical approach enhances accuracy and reliability. For mixed-traffic cities in developing nations, the method provides a reproducible framework and enhances methodological rigor.
3.1 Rationale for choosing the two intersections
In the city, traffic congestion is a significant issue, particularly during periods of high pedestrian activity, rapid urban expansion, and increasing car ownership. The Kathipara Junction and Panagal Park Intersection in Tamil Nadu are two highly significant and congested areas within the city’s traffic network, which are the focal points of this study. These locations were chosen due to their strategic importance and persistent traffic issues. Intersections frequently encounter prolonged congestion, simultaneous traffic flow, and insufficient pedestrian infrastructure, primarily during peak periods. While they are crucial for facilitating citywide mobility, these intersections have been somewhat overlooked in comprehensive, data-based analyses that assess metrics such as travel time delays, vehicle queuing, and LOS. Our research aims to bridge the gap through a targeted examination at the intersection level.
Kathipara Junction is one of South India’s most complex interchanges. Besides serving as a significant transit centre between central Chennai, the international airport, and major industrial and IT routes, it connects several key highways, such as Jawaharlal Nehru Road, Anna Salai, GST Road, and Inner Ring Road. Located at the heart of Chennai’s most crowded shopping district is Panagal Park, situated in T. Nagar. It links major roads, including Ranganathan Street, Usman Road, G.N. Road, Chetty Road, and Venkatanarayana Road. The area experiences a significant amount of foot traffic due to its dense business community, especially on weekends and during holiday periods.
These two intersections were chosen for their strategic and functional importance within Chennai’s transport network. They serve as critical corridors for trade, employment-related travel, and daily commuting, functioning as essential economic lifelines for the city. Despite their significance, both locations experience persistent congestion due to factors such as inadequate signal coordination, limited lane capacity, and the presence of mixed traffic. Panagal Park represents a busy at-grade intersection situated in a major commercial district, while Kathipara Junction is a multi-level, grade-separated interchange, illustrating two distinct traffic conditions. By analyzing these contrasting locations, the study captures a wide spectrum of congestion patterns and generates location-specific insights that can inform the design of more effective traffic management strategies for Chennai.
4 Theoretical framework
The rapid growth of metropolitan centers in developing nations has a direct relationship with their ability to provide urban mobility. The efficient flow of people and products across residential, commercial, and institutional zones is primarily facilitated by transportation infrastructure (Abeje, 2012). A well-connected transportation system is often considered the base of a city, as it not only links distinct parts of the urban environment but also affects the spatial and functional development of the city (Solanke, 2013).
In the context of India, cities like Chennai are confronting substantial difficulties in managing metropolitan transportation. Infrastructure is being overburdened by factors like growing population density, a surge in private car ownership, and inadequate public transportation coverage. People rely on numerous transportation methods, including walking, buses, autorickshaws, two-wheelers, and private vehicles, to navigate their daily routines. Unfortunately, the pace of infrastructure development has not kept pace with mounting demand, leading to poor air quality, increased travel times, and persistent traffic congestion (Centre for Science and Environment, 2019). Traffic flow theory provides a valuable basis for understanding these problems. This conceptual and mathematical framework is used by moving agents like cars and drivers to interact with each other, as well as by fixed infrastructure examples such as roads, signals, and signage (Gartner, 2001). These models assist with simulations, traffic control plans, and road network designs.
Researchers have reported that well-planned roads and enhanced traffic control can significantly decrease traffic congestion (Afrin and Yodo, 2020; Knoop, 2017). Such interventions must be founded on traffic theory-based simulations and data. In developing nations, unresolved traffic problems result in economic inefficiencies and compromise broader sustainability goals (Berisha, 2016). Despite a rise in private car ownership, a substantial segment of Chennai’s population continues to travel to work every day on foot and by public transport. The Comprehensive Mobility Plan (Roychowdhury and Dubey, 2018a; Weisbrod et al., 2003) reports that approximately 30% of trips are made on foot, with buses and rail accounting for an additional 35%. The remaining 35% of trips are made using private modes such as cars and two-wheelers.
Traffic congestion ultimately poses a serious threat to urban mobility, economic productivity, and environmental health. Examining the usage of various transport modes, travel patterns, and congestion hotspots, particularly at key intersections, is crucial for developing a more sustainable and efficient transport system for the study in Figure 1.
Figure 1
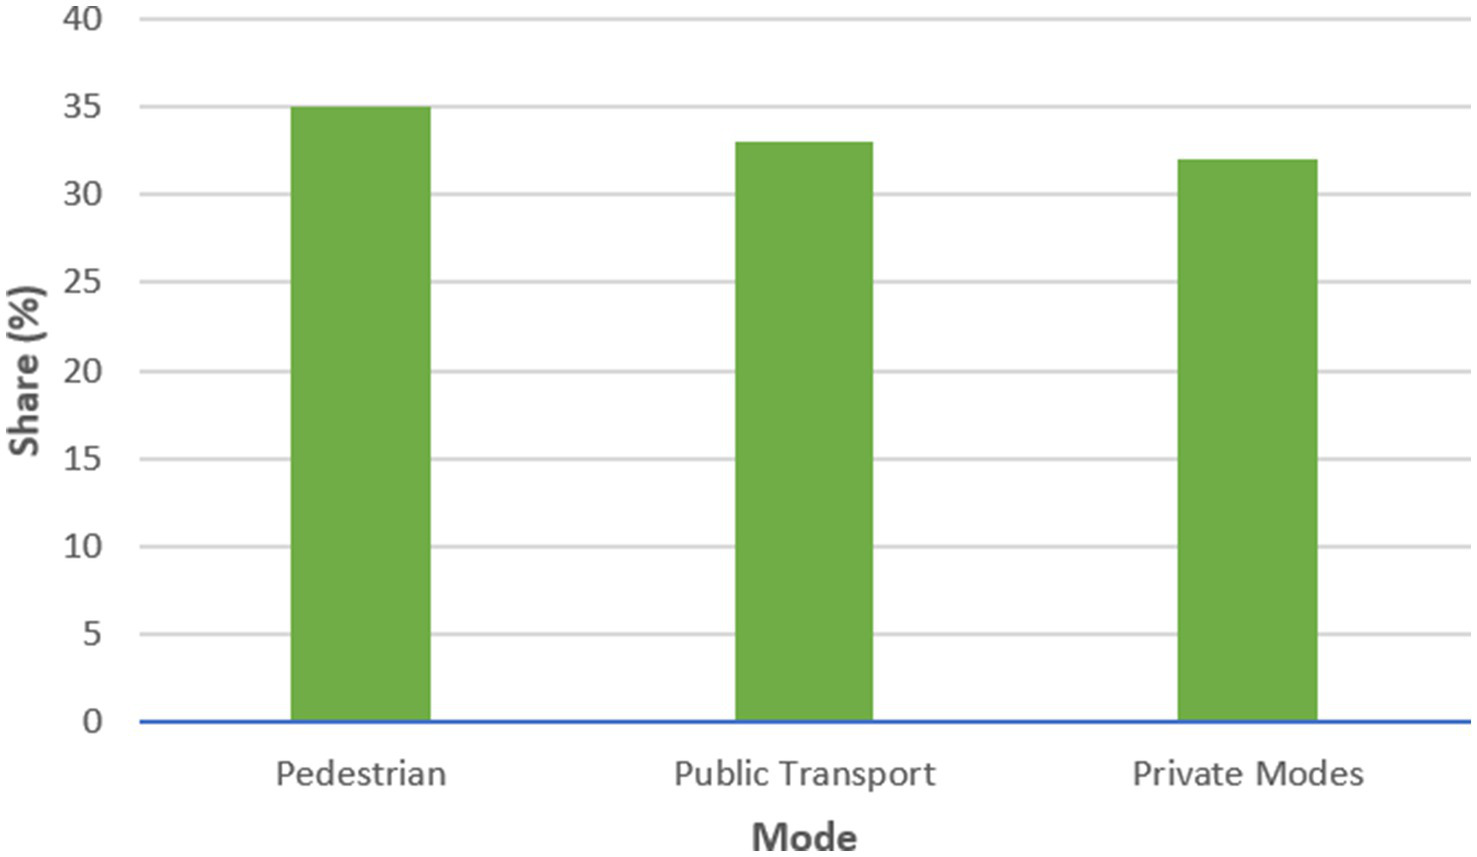
Chennai’s transport modal share across pedestrian, public transport, and private modes (Chennai Metropolitan Development Authority (CMDA), 2019).
4.1 Traffic congestion
Chennai, like many other rapidly growing cities, faces a significant problem with traffic congestion. As the number of vehicles on the road rises and urban populations grow, transportation networks often struggle to keep up. When traffic exceeds the capacity of road infrastructure, congestion occurs, leading to slower speeds, longer travel times, and general inefficiency in mobility (Weisbrod et al., 2003). Particularly noticeable during peak hours in areas with high levels of business activity or along major transportation routes is the discrepancy between the demand for traffic and the amount of available road space.
Surprisingly, a universally accepted definition of traffic congestion does not exist. The perception of congestion is influenced by both objective factors, such as road capacity and traffic volume, and subjective considerations (Congestion, M. U. T, 2007). A bus passenger may experience delays differently from someone in a private vehicle on the same route, and congestion is defined as an increase beyond normal travel time or delay under typical conditions of free-flow traffic. The definition of unacceptable congestion can differ based on factors such as road type, local land use, and the city’s layout and traffic flow.
Congestion is typically at its worst when the volume of traffic reaches or surpasses the road’s maximum capacity. Slower speeds, erratic vehicle movement, increased stop-and-go driving, and extended queuing at intersections occur as a result (Congestion, M. U. T, 2007; Lowe, 1980). Adding more vehicles to a disrupted traffic network only exacerbates the issue, ultimately reducing the system’s overall efficiency.
In Chennai, traffic is especially bad at important crossings like Kathipara Junction and Panagal Park in T. Nagar. There is a complex and often chaotic atmosphere in these places due to the intense traffic from a variety of vehicles, including cars, buses, two-wheelers, autorickshaws, and pedestrians. Poor coordination between various traffic flows, erratic traffic signal timing, and a high vehicle concentration are some of the factors causing the problem. As a result, there are longer delays, more car emissions, and worse economic productivity. Congestion is a regular issue on many of Chennai’s main roadways, as seen in Figure 2, which happens when real travel speeds fall noticeably below predicted free-flow speeds.
Figure 2
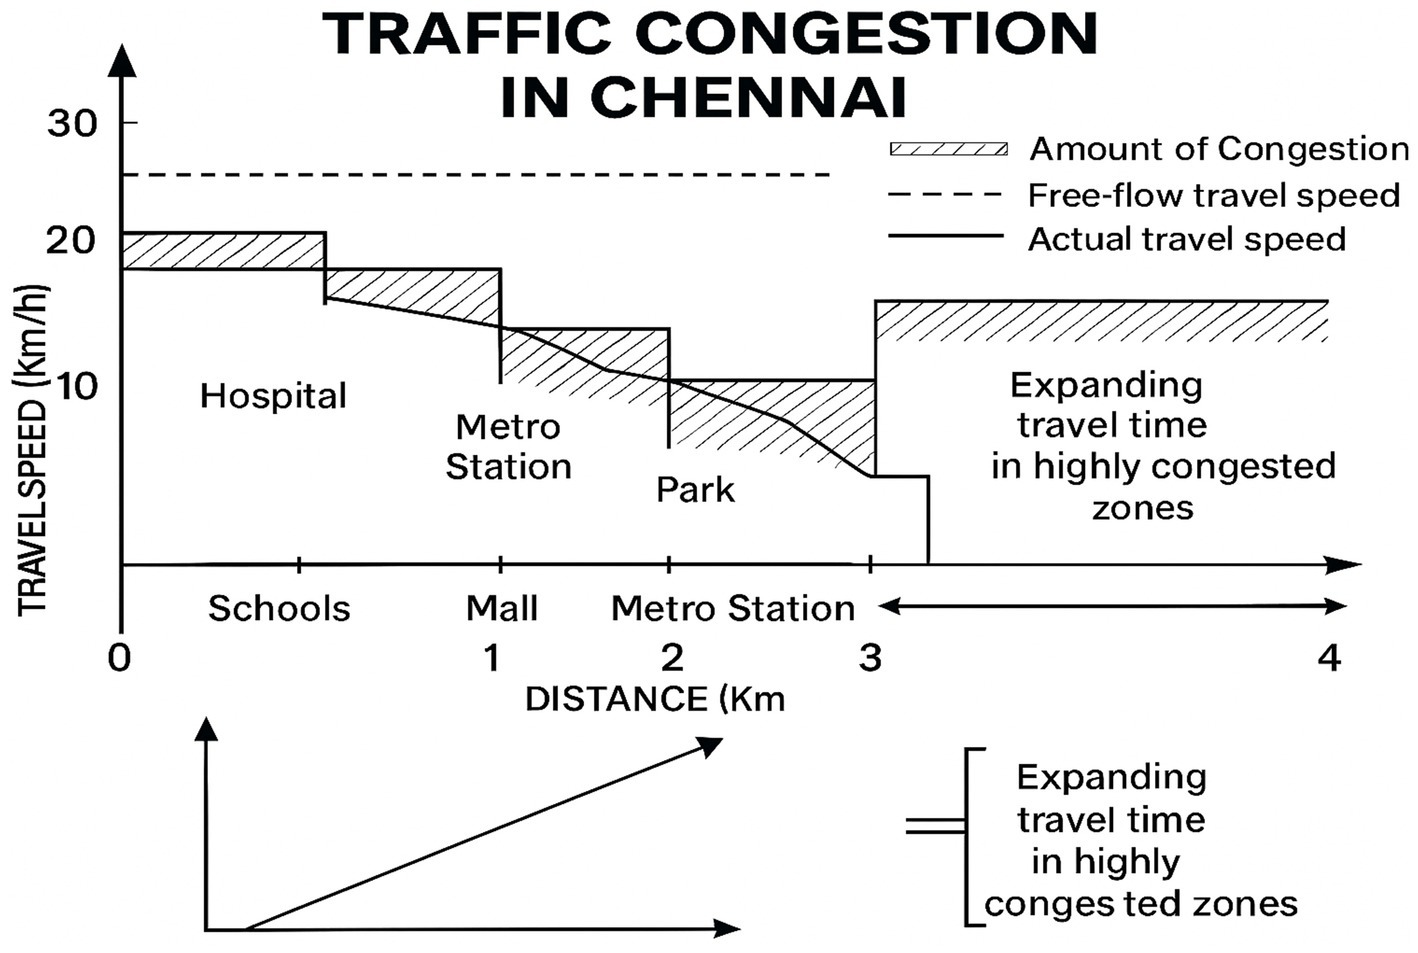
Congestion shown by the gap between free-flow and actual travel speeds on a road segment.
4.2 Urban traffic congestion and its socioeconomic and environmental impacts
Road transportation is crucial to India’s expanding economy, particularly in major cities like Chennai. Road transportation is essential to most of the city’s institutional, social, and commercial activities. Traffic congestion is a significant daily issue caused by an increase in the number of cars on the road, inadequate infrastructure, and competing modes of transportation. Long commutes are no longer the only issue; the city’s economy, environment, and general standard of living are all being negatively impacted.
The rise in traffic accidents is a serious issue related to congestion. This is a significant issue across India. The World Health Organization (Roychowdhury and Dubey, 2018b; Segui-Gomez et al., 2025) reports that India records roughly 150,000 road-traffic fatalities each year, representing about 11% of the global total. In urban areas where traffic congestion is typically at its worst, many of these incidents occur due to lax enforcement of traffic laws (Ministry of Road Transport and Highways, 2023). Emergency vehicles such as ambulances are frequently delayed when roads are congested, often resulting in delayed access to life-saving treatment, thereby making traffic congestion not only a mobility issue but also a public health concern.
An efficient transportation system is essential for economic growth, but ongoing traffic jams lead to rising operating costs, logistical problems, and lost time for workers caught in traffic. These influences affect both formal and informal sectors (Singh, 2012). Congested places in Chennai, such as Kathipara Junction and Panagal Park in T.N. The city of T. Nagar suffers from long-term traffic jams, frustrated drivers, and higher car maintenance costs due to fuel inefficiency and engine wear.
Environmental degradation is also a result of congestion. Traffic congestion causes vehicles to burn more fuel and release greater amounts of pollutants, thereby lowering the air quality in the city (Bigazzi and Clifton, 2015). Daily public transport users are also affected by other side effects, such as noise pollution and mental stress. Lower- and middle-income residents who rely on buses and shared transportation are disproportionately impacted by these issues (Levinson, 2010).
Research indicates that even modest alterations can have a significant impact. Boosting the average speed of buses by half a kilometer per hour can lead to time savings, a decrease in fuel consumption, and a reduction in the overall economic effects of delays (Levinson, 2010). Researchers like (Singh, 2012) also underscore the significance of calculating delay-related costs, which can underpin more intelligent policies, such as congestion pricing or time-based vehicle access, to improve peak-hour traffic management. The lack of a thorough traffic management system in Chennai leads to persistent traffic, which results in lost hours, lowers productivity, and worsens environmental degradation. The absence of a unified urban mobility policy makes it difficult for the city to meet the increasing demands of transport. Because of this, it is crucial to keep an eye on traffic at busy crossings to understand the whole cost of inaction as well as to address problems with traffic flow.
Chennai needs to make lowering traffic congestion a top priority in its policy objectives if it wants to become more sustainable, competitive, and livable. Understanding the causes and timing of traffic congestion is the first stage, followed by the development of solutions that enable a more effective and inclusive transportation system for everybody. Addressing traffic congestion must be a top priority for policymakers if Chennai hopes to become more sustainable, competitive, and livable. Understanding the times and locations of traffic delays is the first step in developing solutions that promote a more effective and inclusive transportation system for all.
4.3 Causes of traffic congestion
Effectively managing traffic is crucial for ensuring safe and efficient movement in densely populated cities like Chennai. The city is under increasing pressure due to a rising number of vehicles, varied road users, and expanding urban areas, where a substantial part of daily travel relies on road-based transport. Road intersections such as Kathipara Junction and Panagal Park in Tamil Nadu, particularly in the T. Nagar area, experience chronic traffic congestion due to the convergence of multiple transportation modes, including buses, cars, auto-rickshaws, two-wheelers, and pedestrians. A significant contributing factor to the traffic problems in the study is the absence of modernized planning and cooperation in traffic management systems. The city has experienced rapid growth, but its infrastructure development has not kept pace with the rise in vehicle ownership and uncontrolled land use. Recurring congestion hotspots have resulted from this mismatch, especially in densely populated or commercial areas.
This problem has been made worse by local issues. On-street parking commonly causes narrow roads in commercial areas, such as Usman Road, to become congested, reducing the effective road width and disrupting traffic flow. Avoidable delays are also caused by poorly operated traffic lights and short green light intervals, especially at complex crossroads like Kathipara. Traffic flow is further hampered by unofficial street vendors occupying sidewalks and crossing onto roadways. People are forced to cross roadways in hazardous areas due to inadequate pedestrian infrastructure, which hinders traffic flow and exacerbates dangerous road conditions. A major obstacle is the large number and diverse range of vehicles on the road. The scarcity of road space leads to a rivalry among private vehicles, buses, cars, and motorcycles, resulting in unpredictable traffic flow and recurring congestion. Poor enforcement of traffic laws, encompassing inadequate adherence to lane markings and unregulated illegal parking, exacerbates this already challenging situation by causing unnecessary roadblocks and hindering traffic movement.
The causes of congestion can also be better understood by utilizing international frameworks in conjunction with local data. A widely cited study by Systematics (2005) identified the main contributors to congestion as bottlenecks (40%), traffic accidents (25%), adverse weather (15%), construction zones (10%), and inadequate signal synchronization or special events (10%). In the Indian context, (Chennai Metropolitan Development Authority (CMDA), 2019; Singh, 2012) highlighted concerns, including rapid and unplanned urban sprawl, inadequate public transportation systems, outdated traffic engineering methods, and inadequate institutional regulatory powers. Many Indian cities, such as Chennai, exhibit a similar alignment of these factors with observed realities.
In Congestion, M. U. T (2007) offers further insight by categorizing the causes of traffic congestion into three main levels. Causes at the micro level comprise physical infrastructure problems such as unsafe road conditions, insufficient signage, and congestion caused by merging or narrow lanes. Urban conditions like population density, land-use patterns, and overall trip demand are linked to broader macro-level causes. Factors external to traffic, such as crowds at festivals, adverse weather conditions, and roadwork-related closures, significantly impact traffic movement. Chennai frequently experiences recurring traffic, especially during weekday rush hours in areas such as T. Nagar, Velachery, Saidapet, and Guindy. These zones regularly exceed the specified capacity restrictions. Non-recurring congestion, on the other hand, is typically caused by isolated incidents. This includes car breakdowns or accidents, unexpected rains that cause waterlogging in low-lying locations, and disturbances from maintenance, including utility digging in commercial areas. Addressing both recurring and non-recurring causes of congestion is essential for developing effective short- and long-term traffic-management strategies (Rao and Rao, 2012). It can achieve sustainable and efficient traffic management only through a comprehensive and context-sensitive approach.
4.4 Traffic congestion components and metrics
Understanding the features of traffic congestion and how it may be measured is the first step towards effectively managing it in metropolitan settings. Congestion is commonly assessed using four fundamental dimensions: duration, extent, intensity, and reliability, which are derived from established frameworks such as those described in NCHRP Reports 398 and 618 (Schrank and Lomax, 1997; Cambridge Systematics, 2008). By demonstrating how congestion spreads and varies over time and across regions, these dimensions enable a more thorough evaluation of congestion than only traffic delays.
Time span, range, severity, and believability are the four main dimensions of traffic congestion in Chennai that together characterise the extent and enduring nature of the city’s mobility issues. The morning (8:00–10:30 a.m.) and evening (5:00–8:00 p.m.) peak hours are when severe congestion usually happens, as locations like Kathipara Junction and Panagal Park in T. Nagar see significant traffic accumulation. The range of congestion extends beyond these intersections, affecting adjoining corridors such as Usman Road, Anna Salai, and Jawaharlal Nehru Road, thereby disrupting both local and regional traffic circulation. The intensity of congestion is reflected in parameters such as average delay per vehicle, speed reduction, and the volume-to-capacity (v/c) ratio; values at or above 1.0 indicate that demand has exceeded roadway capacity—a condition frequently observed near Kathipara during peak hours. The credibility, or reliability, of travel times also presents a major concern: rainfall, roadside encroachments, and malfunctioning traffic signals often cause unpredictable variations in commuting durations.
The current study uses a set of congestion indicators to rigorously assess these conditions, identifying capacity overloads and bottlenecks at Kathipara Junction and Panagal Park. This research, which combines temporal, geographical, and performance-based dimensions, offers a thorough grasp of local traffic dynamics and serves as the foundation for evidence-based plans to reduce congestion and improve urban mobility throughout Chennai (Table 1).
Table 1
| Metric | Formula/Description |
|---|---|
| Travel RATE (min/km) | |
| Delay rate (min/km) | |
| Total segment delay | |
| Delay ratio | |
| Travel time index (TTI) | |
| Buffer index (%) | |
| Planning time index | |
| Annual delay per traveler (hrs) | |
| Volume-to-capacity () ratio |
Traffic congestion metrics and their calculation methods.
4.5 Level of service (LOS) and intersection efficiency
LOS is the fundamental statistic used to evaluate the traffic management capabilities of roadways and crossings. Traffic flow quality is reflected by considering factors including traffic volume, travel speed, vehicle delay, and overall driving experience. The Highway Capacity Manual (Transportation Research Board, 2000) defines LOS as a qualitative assessment of how traffic behaves in different quantities and situations (Schrank and Lomax, 1997). In Chennai, where many intersections are constantly congested, LOS is a crucial instrument for assessing performance, especially at key locations such as Kathipara Junction, a significant flyover hub, and Panagal Park in T. Nagar, a busy intersection with a high volume of both foot and vehicle traffic. Similar to grades in school, LOS is categorized into six levels, from A (open flow) to F (extremely crowded). Each car’s average control latency at junctions determines its classification (Table 2).
Table 2
| LOS | Avg. delay at (signalized) intersections (sec/vehicle) | Avg. delay at (unsignalized) intersections (sec/vehicle) |
|---|---|---|
| A | ≤10 s | ≤10 s |
| B | 10–20 s | 10–15 s |
| C | 20–35 s | 15–25 s |
| D | 35–55 s | 25–35 s |
| E | 55–80 s | 35–50 s |
| F | > 80 s | > 50 s |
LOS Categories at urban intersections (Transportation Research Board, 2000).
At the intersection of major arterial highways, Kathipara Junction, LOS typically drops to levels D or E during peak hours, with average delays frequently exceeding 50 s per vehicle. Meanwhile, Panagal Park in T. Nagar frequently experiences LOS E or F, especially on weekends and during festive periods, due to vehicle congestion, pedestrian overflow, and poorly timed traffic signals. Table 3 and Figure 3 demonstrate distinct peak-hour traffic surges at both intersections, highlighting significant imbalances between traffic demand and infrastructure capacity, which directly contribute to poor LOS performance.
Table 3
| Time Interval | Guindy → Kathipara | Kathipara → Guindy | Usman Road → Panagal Park | Panagal Park → Usman Road |
|---|---|---|---|---|
| 7:00–8:00 a.m. | 1,020 | 960 | 860 | 790 |
| 8:00–9:00 a.m. | 1,530 | 1,430 | 1,180 | 1,150 |
| 9:00–10:00 a.m. | 1,620 | 1,500 | 1,120 | 1,080 |
| 10:00–11:00 a.m. | 1,500 | 1,470 | 1,050 | 1,040 |
| 11:00–12:00 p.m. | 1,470 | 1,460 | 1,010 | 1,030 |
| 12:00–1:00 p.m. | 1,480 | 1,350 | 970 | 1,000 |
| 1:00–2:00 p.m. | 1,420 | 1,320 | 940 | 970 |
| 2:00–3:00 p.m. | 1,480 | 1,370 | 950 | 910 |
| 3:00–4:00 p.m. | 1,460 | 1,350 | 930 | 920 |
| 4:00–5:00 p.m. | 1,480 | 1,240 | 890 | 900 |
| 5:00–6:00 p.m. | 1,520 | 1,190 | 850 | 890 |
| 6:00–7:00 p.m. | 1,260 | 1,020 | 770 | 750 |
Estimated hourly directional traffic volumes at key intersections (Parkavi and Parthiban, 2024).
Figure 3
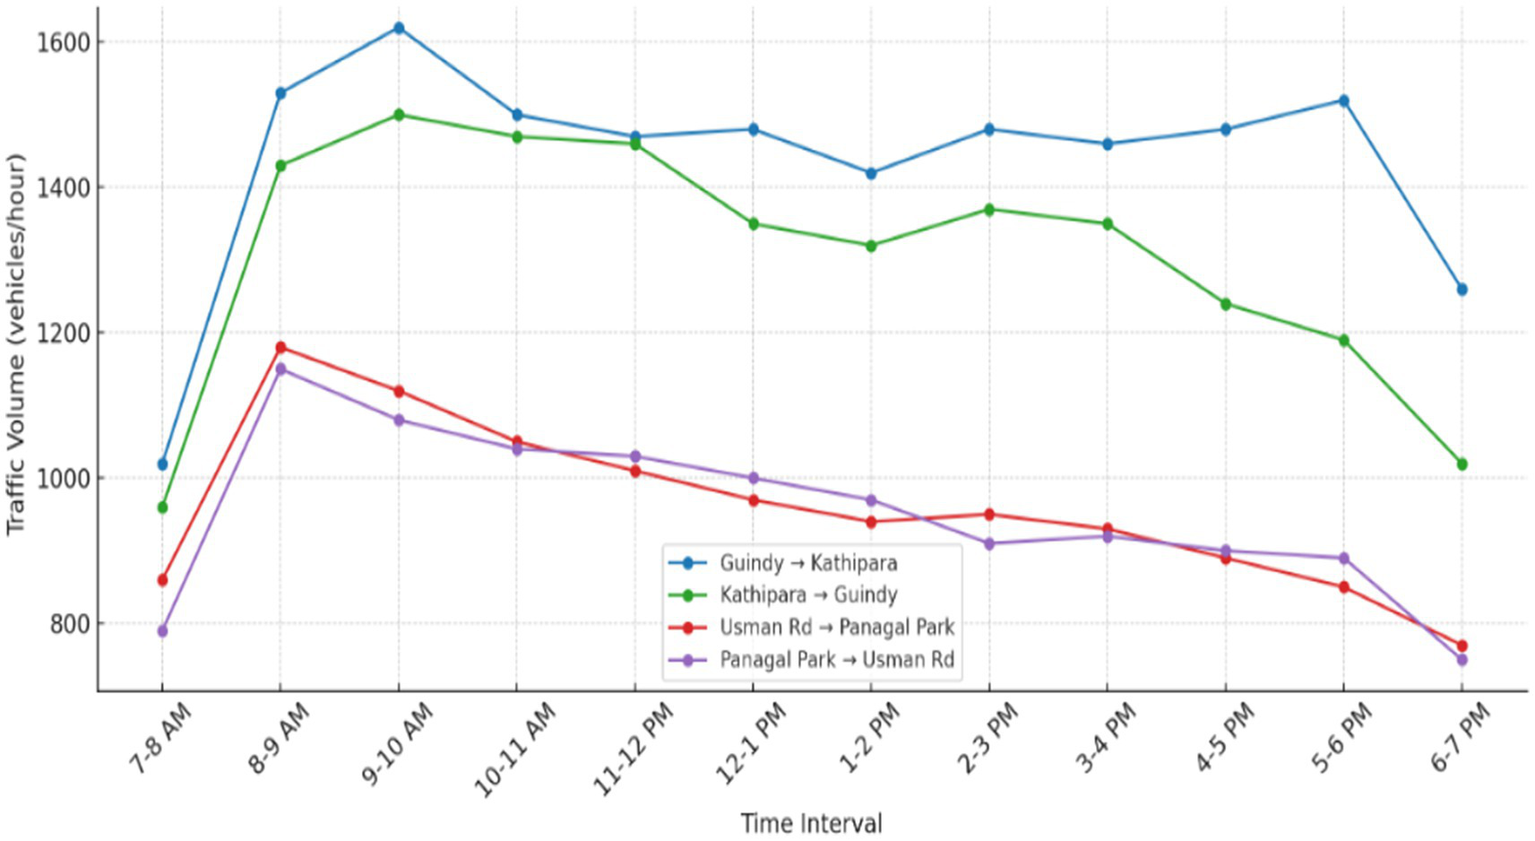
Hourly Directional Traffic Volumes at Kathipara Junction and Panagal Park Intersection (Parkavi and Parthiban, 2024).
As highlighted by Bireda (2017), lower LOS levels are linked to more than just delays; they also impact economic output, increase vehicle operating costs, and raise stress for daily commuters. Long wait times deter customers, disrupt local business operations, and place a burden on public transportation systems in crowded commercial areas like T. Nagar. Vehicle speeds on Chennai’s city streets frequently drop to less than one-third of the free-flow pace when LOS E or F is in effect. Increased pollutants, increased fuel use, and significant financial losses result from this. Roadside encroachments, ineffective traffic signal coordination, and the absence of pedestrian underpasses or overpasses in high-traffic areas exacerbate these issues.
5 Results and discussion
5.1 Directional traffic volume analysis
In Chennai, the areas feature two bustling mid-block intersections, connecting Guindy and Kathipara via a stretch of road, as well as Usman Road near Panagal Park in T. Nagar, where a 12-h traffic volume analysis was conducted. Traffic patterns and daily changes were assessed by counting vehicles in both directions every 15 min.
Traffic on the route from Guindy to Kathipara was at its busiest between 8:00 and 10:00 a.m., as depicted in Figure 4, and the return journey became progressively congested between 5:00 and 6:30 p.m. The corridor’s importance is underscored by its connections to the airport, industrial sectors, and IT zones.
Figure 4
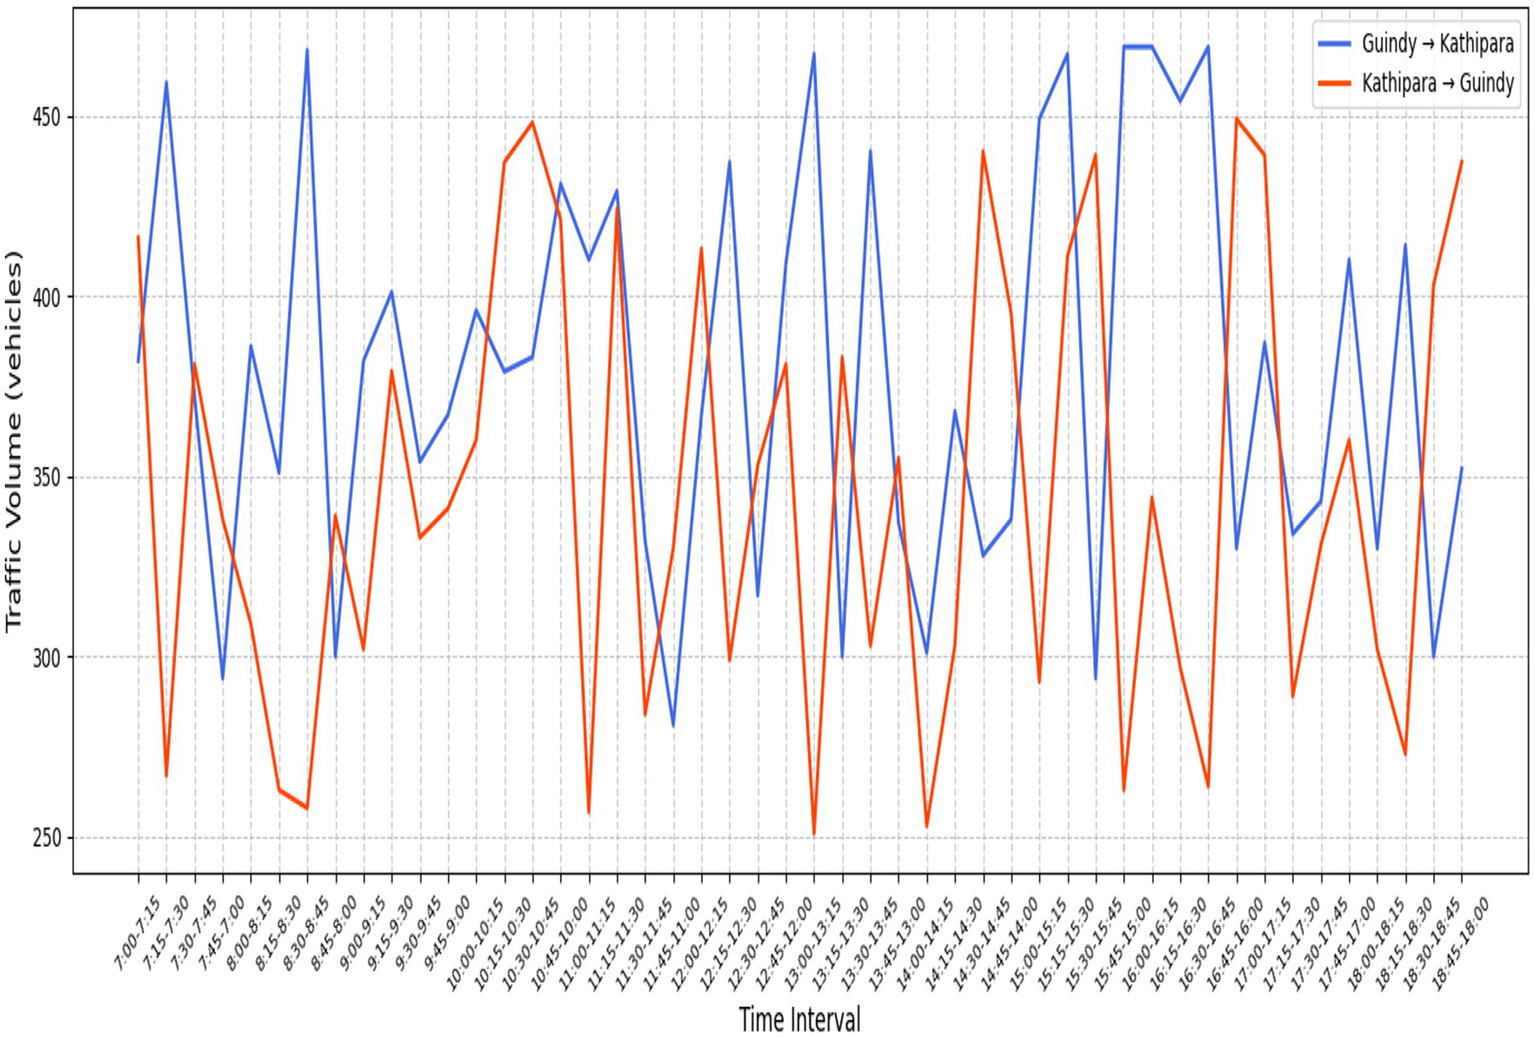
Directional traffic volume at Kathipara Midblock (15-Minute Intervals) (Parkavi and Parthiban, 2024).
Congestion on the roads typically occurs during both morning and evening rush hours between Panagal Park and Usman Road, as shown in Figure 5. Increased commercial activity on weekends and holidays further exacerbates these trends. Located near Panagal Park, two-wheelers and autorickshaws are the primary modes of transportation, followed by private vehicles and taxis, as shown in the vehicle type statistics depicted in Figure 6. The scarcity of public buses and cargo transport vehicles in the area suggests that residents rely heavily on personal vehicles.
Figure 5
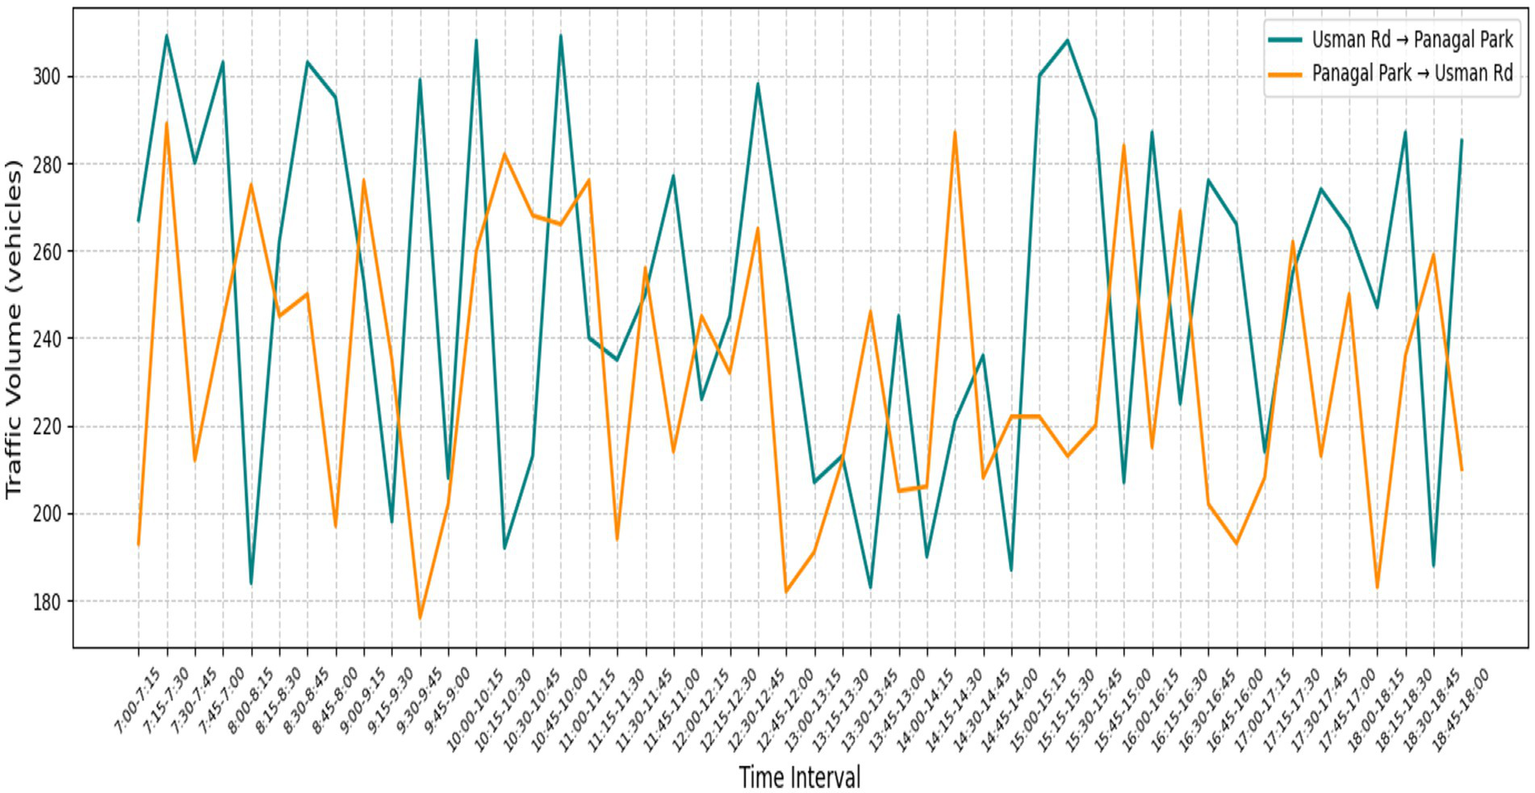
Directional traffic volume at Panagal Park Midblock (15-Min Intervals) (Parkavi and Parthiban, 2024).
Figure 6
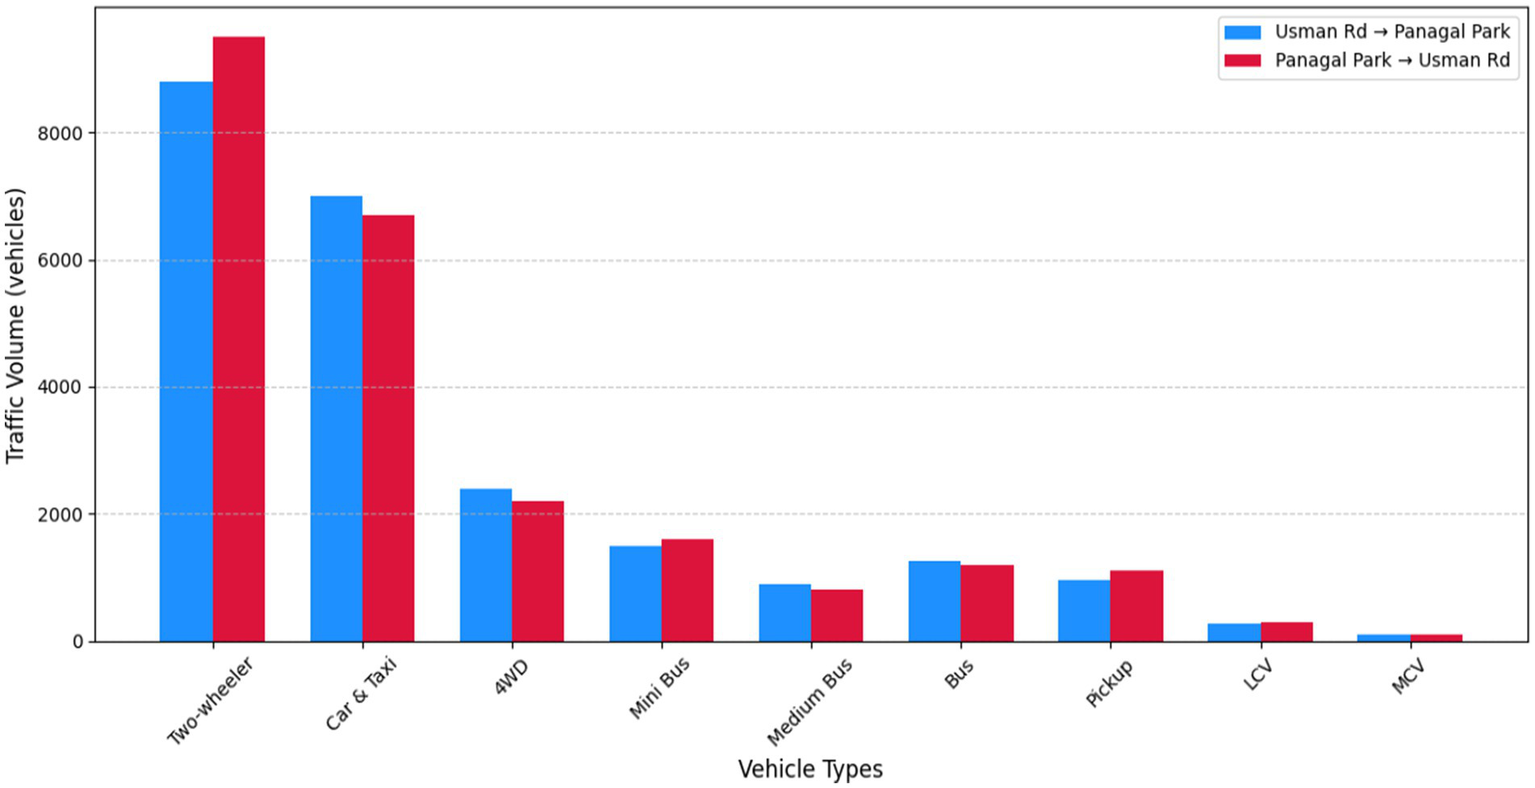
Traffic volume by vehicle types at Panagal Park intersection (Parkavi and Parthiban, 2024).
Traffic in Chennai is unstable and varies over time and location. Traffic management techniques, such as adaptive signal control, pedestrianised hours, or improved public transportation systems, rely on an understanding of traffic flow patterns. Delays are worsened by factors beyond volume, including poor signal synchronisation, lane encroachment issues, and insufficient designated lanes. Examining directional traffic data enables a more in-depth understanding of areas where demand exceeds capacity, thus guiding the implementation of targeted and efficient traffic solutions.
5.2 Kathipara junction midblock
It is a major traffic hub in Chennai, experiencing substantial fluctuations in vehicle movement throughout the day. Traffic flow data reveals a directional imbalance, with a heavier volume heading from Guindy toward Kathipara, particularly in the morning. This route connects commuters to key destinations like the airport and IT corridors. During the morning peak (8:00–9:00 a.m.), traffic volume reached its highest at 1,530 vehicles per hour in the Guindy-to-Kathipara direction. In contrast, the evening peak (5:00–6:00 p.m.) showed a greater outbound flow as people returned from workplaces. During peak hours, Figure 4 shows a reasonably balanced traffic flow, with noticeable decreases in the early morning (7:00–8:00 a.m.) and late evening (6:00–7:00 p.m.) hours. Over a 12-h period, the cumulative vehicle count from Guindy toward Kathipara was approximately 18,240. This trend underlines the junction’s importance as a key connector in Chennai’s urban transport network.
5.3 Midblock of Panagal Park (T. Nagar)
In contrast, the Panagal Park neighborhood in T. Nagar experiences heavy traffic, primarily due to its status as a business and retail hub. Significant levels of congestion are caused by the concentration of stores and pedestrian traffic, especially during business hours and holiday seasons. As Figure 5 shows, cars/taxis and two-wheelers make up the majority of the traffic mix in this area. Between 9:00 and 10:00 a.m., the number of vehicles traveling to Panagal Park increases significantly due to the arrival of customers and staff. The relatively constant outbound traffic during this period indicates that many tourists stay in the area for extended periods.
The breakdown of vehicle types seen in the vicinity of Panagal Park is shown in Figure 7. Minibuses and commercial vehicles are slightly more common than personal vehicles, such as cars, cabs, and two-wheelers. Notably, only 12% of all traffic consists of two-wheelers, underscoring the significant reliance on private vehicles. This disparity underscores the urgent need for improved public transportation and modal integration to mitigate traffic congestion.
Figure 7
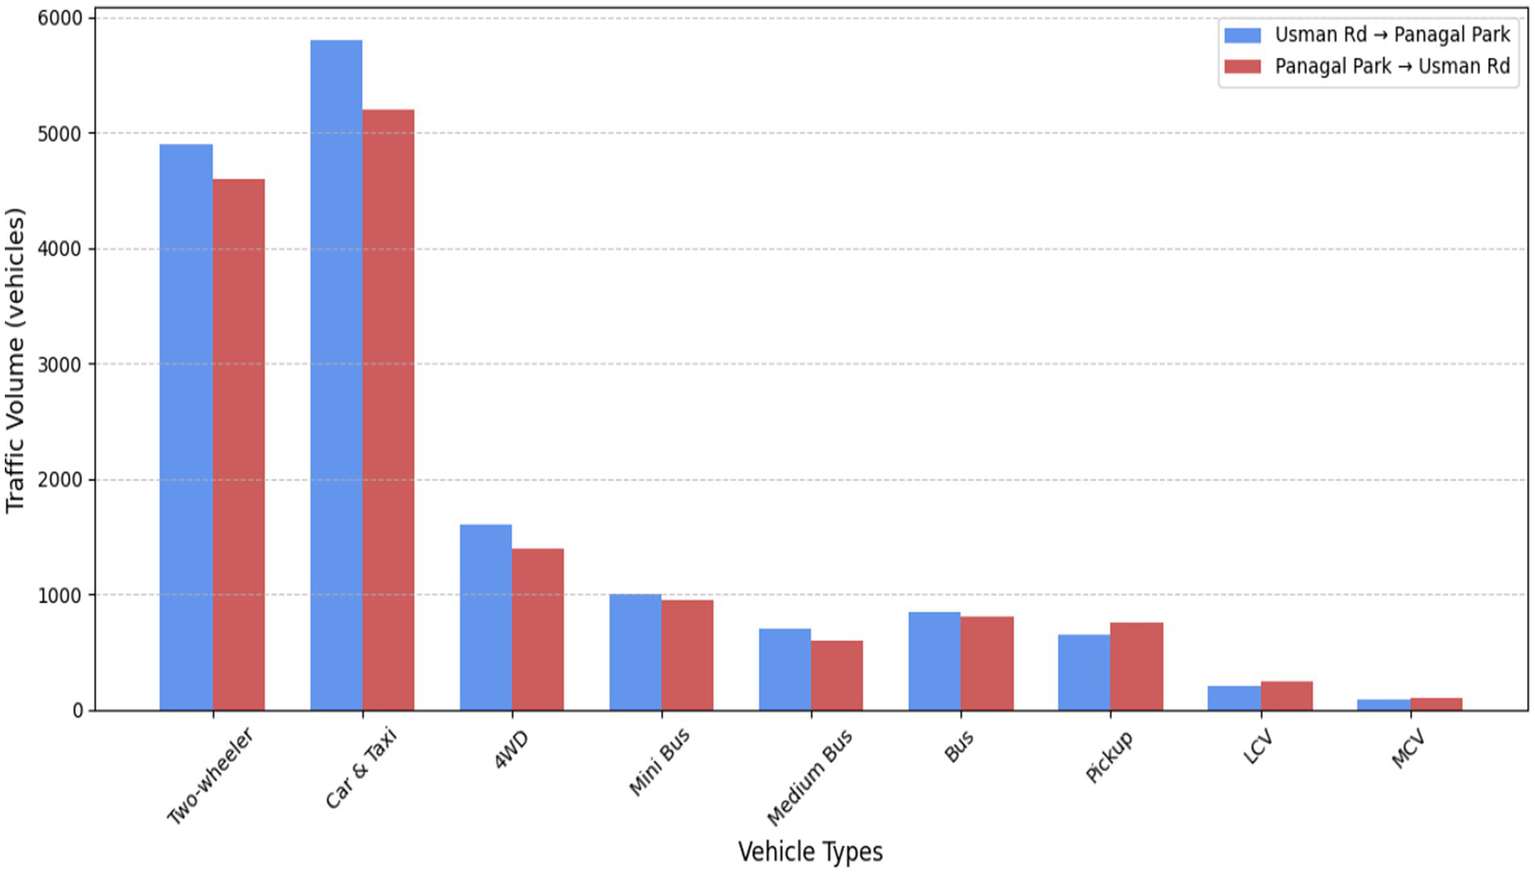
Traffic volume by vehicle types at Panagal Park Midblock (Parkavi and Parthiban, 2024).
Due to its function as a transportation corridor connecting important routes, Kathipara Junction records a greater overall traffic volume, but Panagal Park is subject to more localized pressure from demand caused by retail. On weekends and holidays, Panagal Park experiences very heavy traffic. These different traffic patterns and vehicle compositions are depicted in Figures 4, 5, and 7, which provide important information for traffic planning and congestion control tailored to the specific requirements of each site.
5.4 Level of service (LOS) and travel time analysis
A thorough LOS analysis was conducted to assess the effectiveness of traffic management at two of Chennai’s busiest intersections: Kathipara Junction and the Panagal Park intersection in T. Nagar. The Transportation Research Board (2000) serves as the foundation for the technique, which has been modified as needed to account for regional traffic patterns and road characteristics that are typical of Indian roadways.
The traffic volume in each direction at each approach, lane count and configuration, median presence and width, and turning movement volumes for left turns (LT), right turns (RT), and through movements (TH) were among the key factors considered in the LOS assessment. A high-resolution satellite image of the two crossings is shown in Figure 8, which also shows the distribution of turning movements at each location and the main approach routes. Understanding traffic patterns and locating pressure areas during peak hours is made easier with the help of this visual representation.
Figure 8
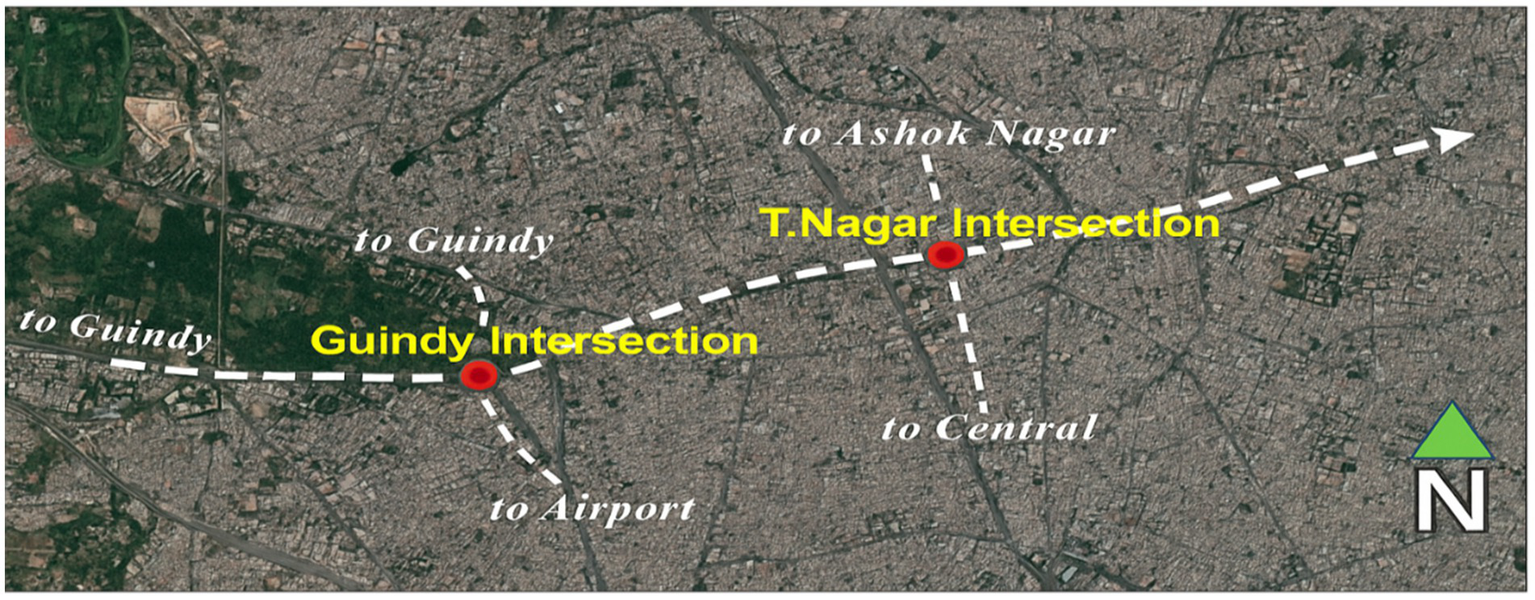
Kathipara and Panagal Park intersections (Google Earth, 2024).
The key intersection attributes obtained from direct field surveys and additional traffic data are shown in Table 4. This comprises the width of medians, the number of approach and exit lanes, and precise counts of turning motions, including through, left, and right turns, recorded for each direction at the chosen intersections.
Table 4
| No | Intersection | Approach leg | Entry lanes | Exit lanes | Median width (m) | LT | TH | RT |
|---|---|---|---|---|---|---|---|---|
| 1 | Kathipara | Guindy | 3 | 3 | 1.5 | 530 | 610 | 140 |
| Ashok Pillar | 2 | 3 | 30 | 450 | 240 | 190 | ||
| Airport Rd | 3 | 2 | 1.5 | 310 | 500 | 420 | ||
| Mount Rd | 2 | 2 | 30 | 390 | 320 | 440 | ||
| 2 | Panagal Park | Usman Rd | 2 | 2 | 2.0 | 420 | 210 | 360 |
| Venkatanarayana Rd | 2 | 2 | 30 | 270 | 160 | 130 | ||
| G.N. Chetty Rd | 2 | 2 | 1.5 | 190 | 270 | 110 | ||
| Ranganathan Street | 2 | 2 | 30 | 250 | 420 | 210 |
Intersection parameters and turning movement volumes at Kathipara and Panagal Park.
A methodology similar to SIDRA was used to evaluate the LOS at each approach, with the Degree of Saturation (DoS) serving as the primary performance metric. The majority of approaches at Panagal Park and Kathipara Junction run at LOS E or F during peak hours, according to the data, as shown in Table 5. These ratings underscore the need for targeted measures to improve traffic flow, as they reveal significant congestion, delays, and reduced intersection efficiency.
Table 5
| No | Intersection | Approach leg | Degree of saturation | LOS |
|---|---|---|---|---|
| 1 | Kathipara | Guindy | 2.480 | E |
| Ashok Pillar | 1.360 | E | ||
| Airport Rd | 1.070 | E | ||
| Mount Rd | 1.402 | F | ||
| 2 | Panagal Park | Usman Rd | 1.760 | F |
| Venkatanarayana Rd | 1.225 | F | ||
| G.N. Chetty Rd | 0.720 | B | ||
| Ranganathan Street | 1.330 | F |
LOS analysis synopsis for important intersection methods.
5.5 Guindy to Kathipara corridor (225 m)
A vital access point for traffic from industrial areas and important transportation hubs is the 225 m section between Guindy and Kathipara. Video recordings and on-site observations were used to gather data at 15-min intervals to evaluate traffic delays. Figure 9 shows that the worst traffic jams happened between 2:45 and 4:15 p.m., with a maximum recorded travel duration of 551 s. Significant delays were highlighted in this sector, with an average travel time of approximately 298.27 s during peak circumstances.
Figure 9
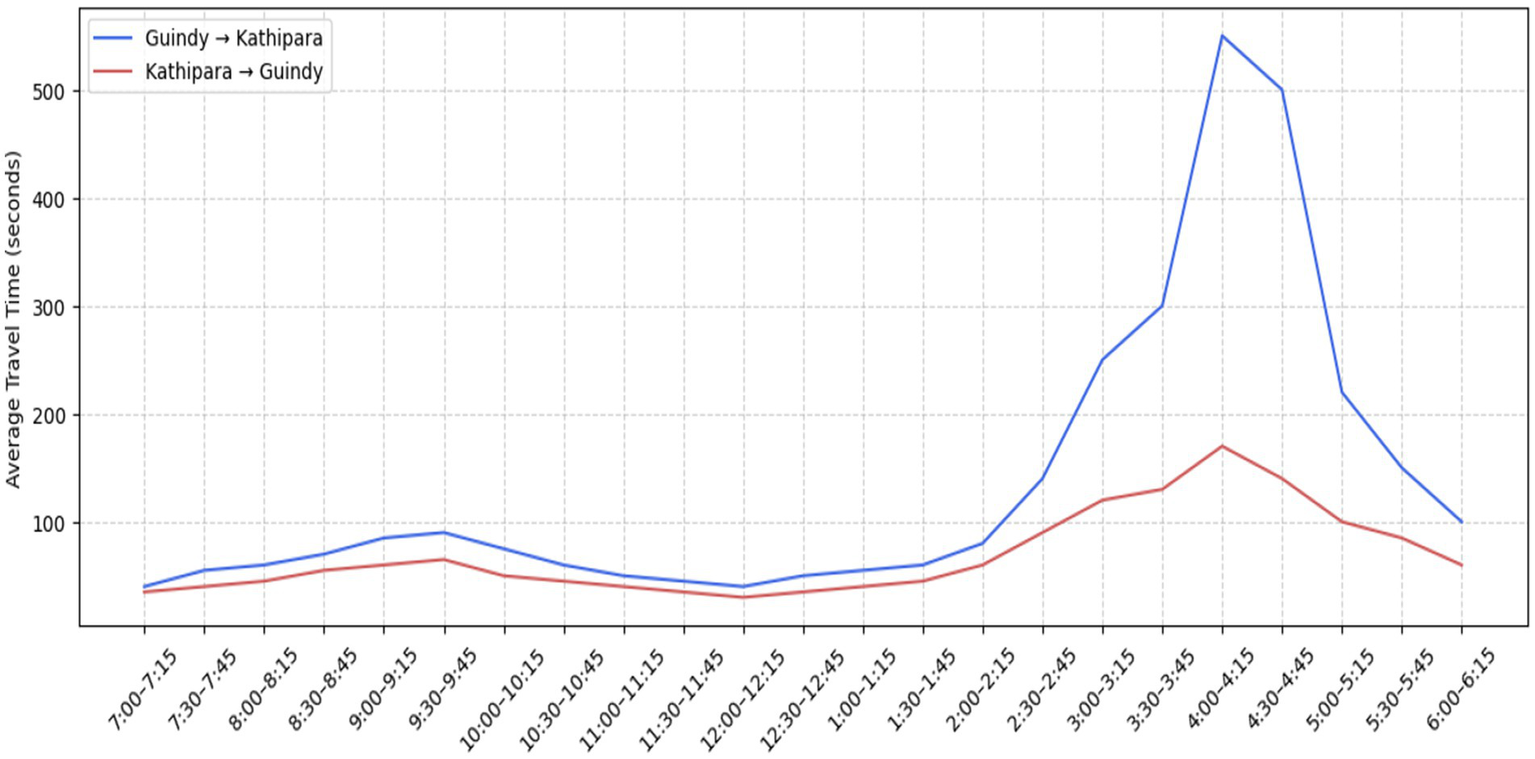
Average travel time (in seconds) for the Guindy-Kathipara road segment and Kathipara-Guindy segment, based on 15-min interval observations (Parkavi and Parthiban, 2024).
5.6 Panagal Park to G.N. Chetty road segment (150 m)
The 150-meter commercial stretch in T. Nagar frequently experiences traffic congestion, primarily due to on-street parking, high pedestrian volumes, and signal-related delays. As summarized in Figure 10, the heaviest traffic occurred during the morning shopping hours (8:15 a.m.–12:00 p.m.) and the evening peak (3:00 p.m.–6:00 p.m.). The longest travel time documented on this segment was 58.3 s, with average delays of 39.88 s in the morning and 33.92 s in the evening.
Figure 10
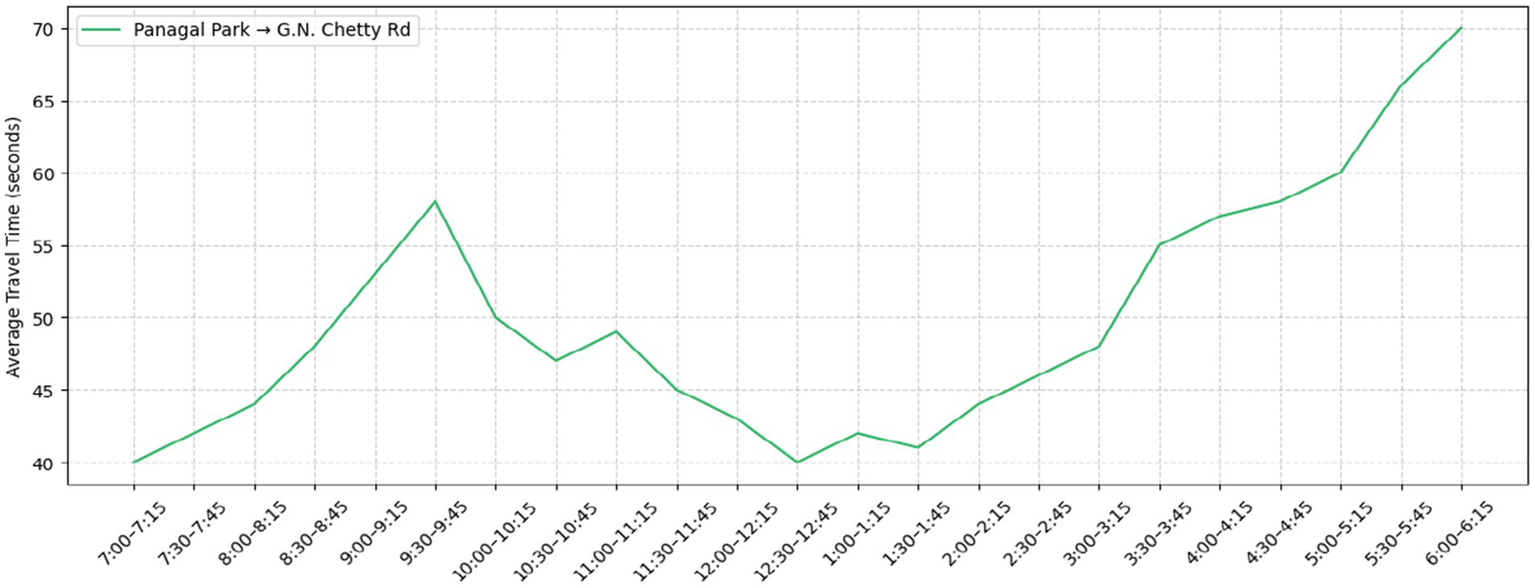
Average travel time (in seconds) along the Panagal Park-G.N. Chetty Road segment (entry leg of Panagal Park intersection) (Parkavi and Parthiban, 2024).
5.7 Average speed and travel rate analysis
Average travel times over a 12-h period are shown in Figure 11 for three crucial corridors: T. Nagar-Usman Road, Panagal Park-G.N. Chetty Road, and Guindy-Kathipara. The traffic movement on the Guindy-Kathipara segment was the slowest of them, especially during the afternoon peak (3:15 p.m.-4:00 p.m.), when speeds fell below 5 km/h. Since the segment’s lowest recorded speed was only 1.5 km/h, it is clear that a significant amount of traffic was present during that time. Average daily speeds on all three routes remained below 15 km/h for extended periods, underscoring the severity of traffic in these busy thoroughfares.
Figure 11
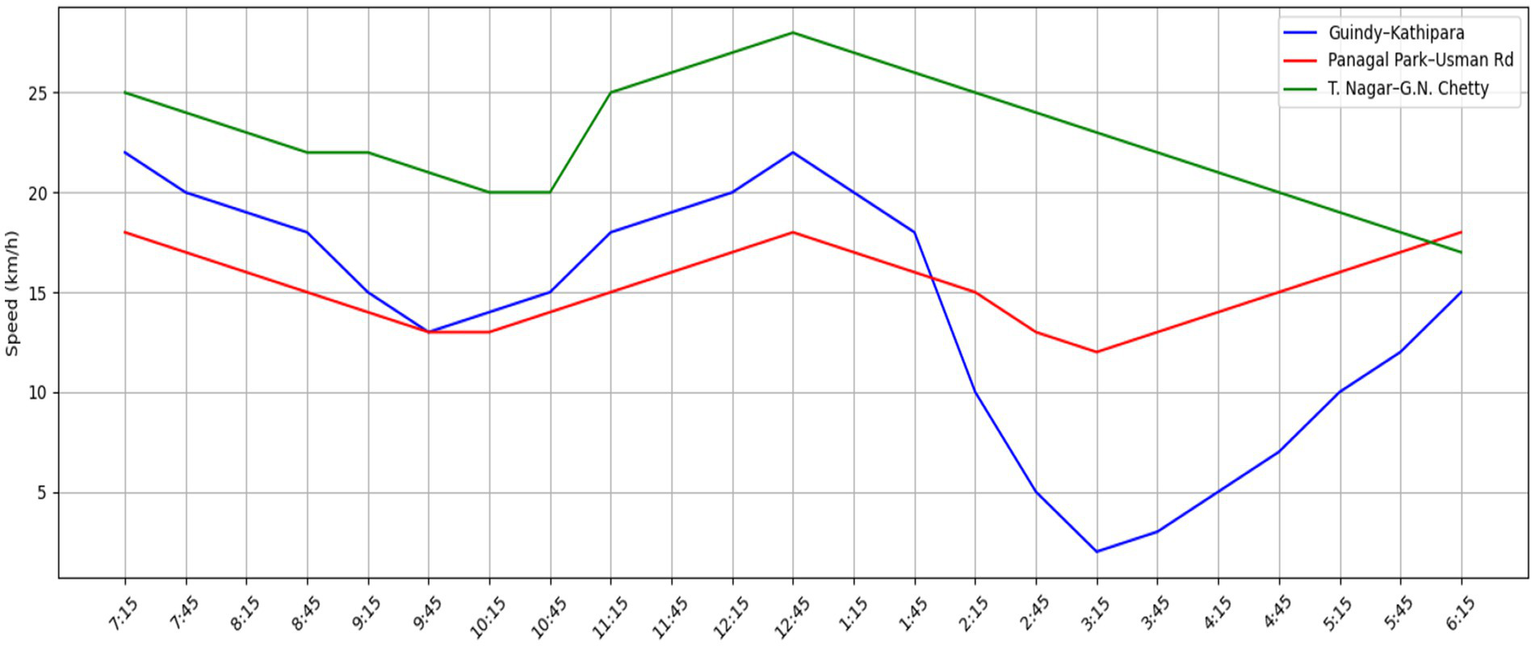
During peak hours, the average vehicle speed was noted along Chennai’s major midblocks (Parkavi and Parthiban, 2024).
However, the T. Nagar-G.N. Chetty Road portion had the fastest average speed, reaching a peak of approximately 28.3 km/h at midday, when business activity was at its lowest. This stretch has also shown improved speed and stability throughout the day.
The travel rate, which is the time it takes to travel 1 km, was also examined in the study to gain a deeper understanding of traffic efficiency. Between 1:30 and 4:15 p.m., the Guindy-Kathipara corridor had the highest trip rate, indicating slower mobility, as shown in Figure 12. Comparing the T. Nagar-G.N. Chetty Road portion to the others, the latter continuously maintained lower travel rates, suggesting a smoother traffic flow.
Figure 12
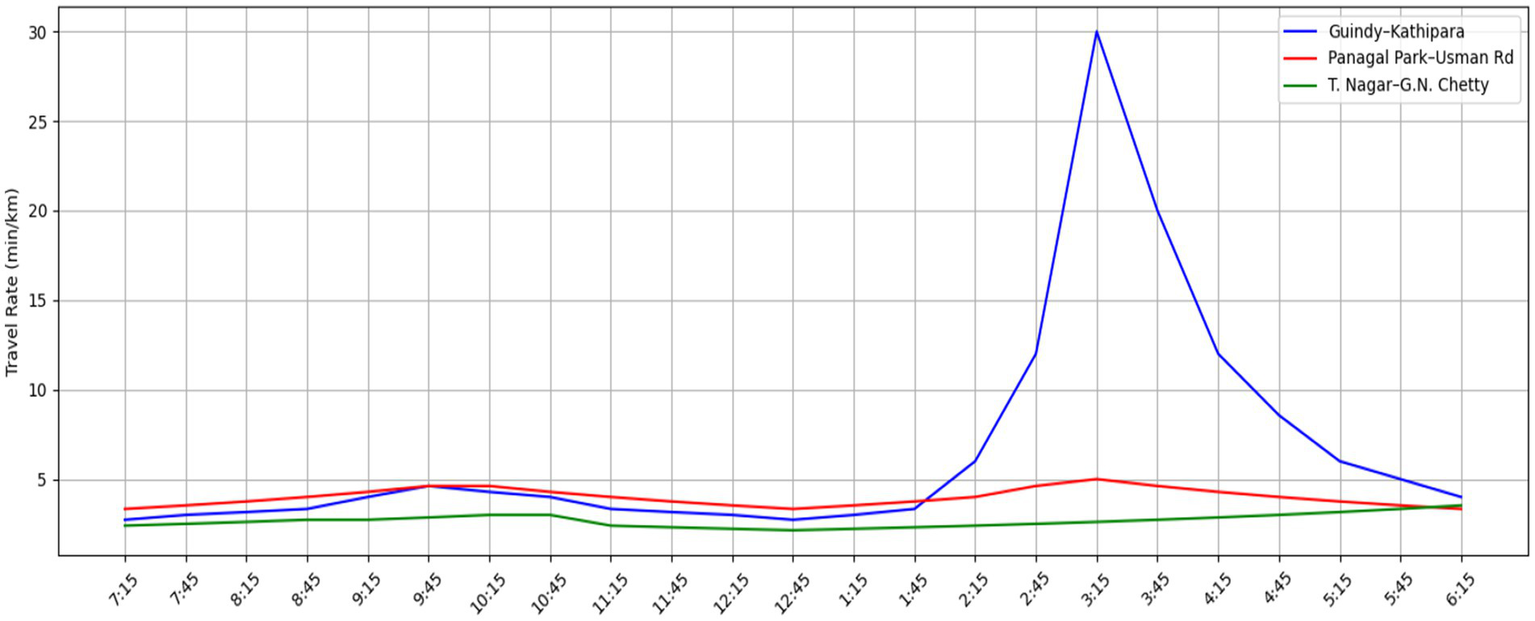
Travel time () in Chennai’s main urban areas (Parkavi and Parthiban, 2024).
5.8 Delay metrics: rate, ratio, and impact per traveler
To diagnose traffic bottlenecks, it is essential to have a thorough understanding of the causes of delays. Standard metrics, such as delay rate, delay ratio, and delay per traveler, are used in this section in accordance with accepted approaches from Schrank and Lomax (1997).
The delay rate is calculated by comparing actual travel performance against ideal free-flow conditions. As illustrated in Figure 13, the Guindy-Kathipara route experienced the highest delay rate of the study, peaking at 38.67 min per kilometer during the 2:30 to 4:15 p.m. time slot. At 7.77 min/km, a lesser peak was also seen in the morning. In contrast, the T. Nagar-G.N. Chetty Road route consistently exhibited lower delay rates compared to the Panagal Park-Usman Road, which displayed intermediate levels of delay.
Figure 13
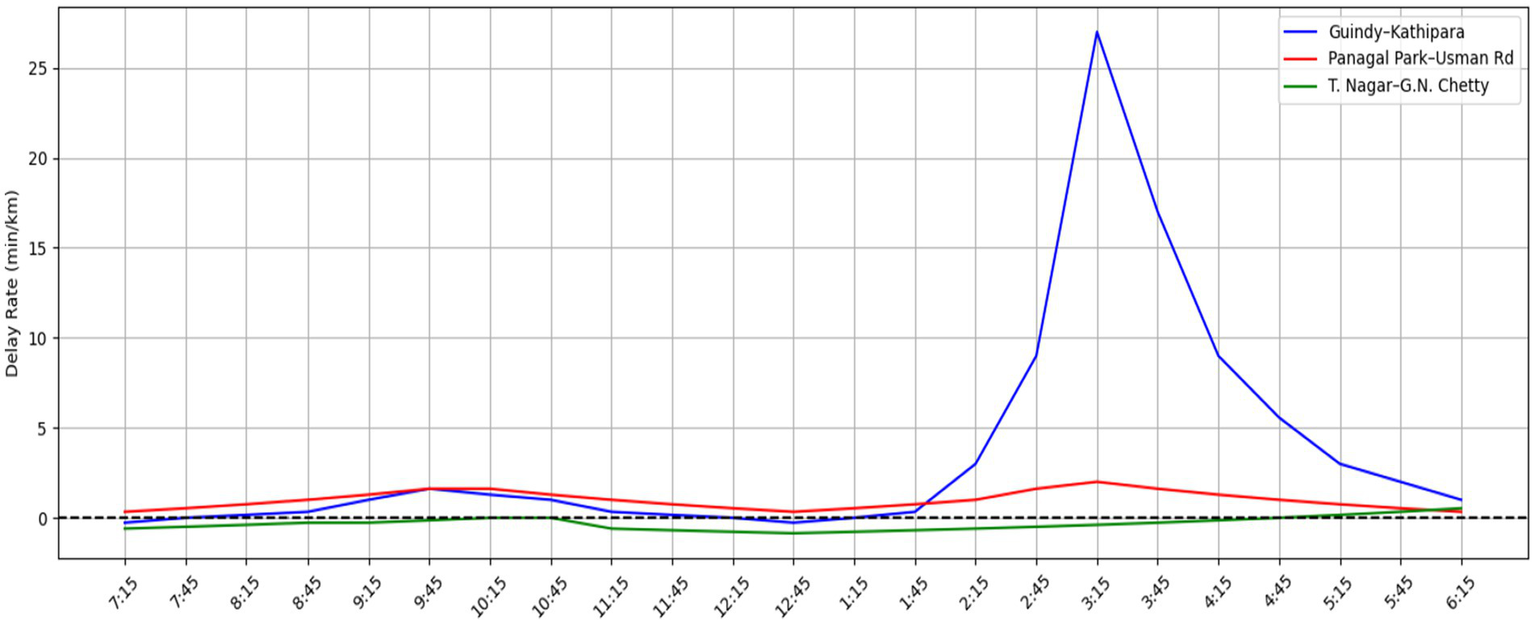
Delay rate (min/km) throughout a 12-h observation period on a few chosen road segments (Parkavi and Parthiban, 2024).
A standardized comparison across road segments is provided by the delay ratio, which calculates the percentage of delay in relation to the real travel rate. The majority of segments showed delay ratios ranging from 0.4 to 0.6, as shown in Figure 14. The lowest readings, frequently below 0.4, were found along the Panagal Park stretch, suggesting relatively better flow conditions. But during the busiest afternoon hours, Guindy-Kathipara achieved peak ratios above 0.8, confirming its status as the corridor most negatively impacted.
Figure 14
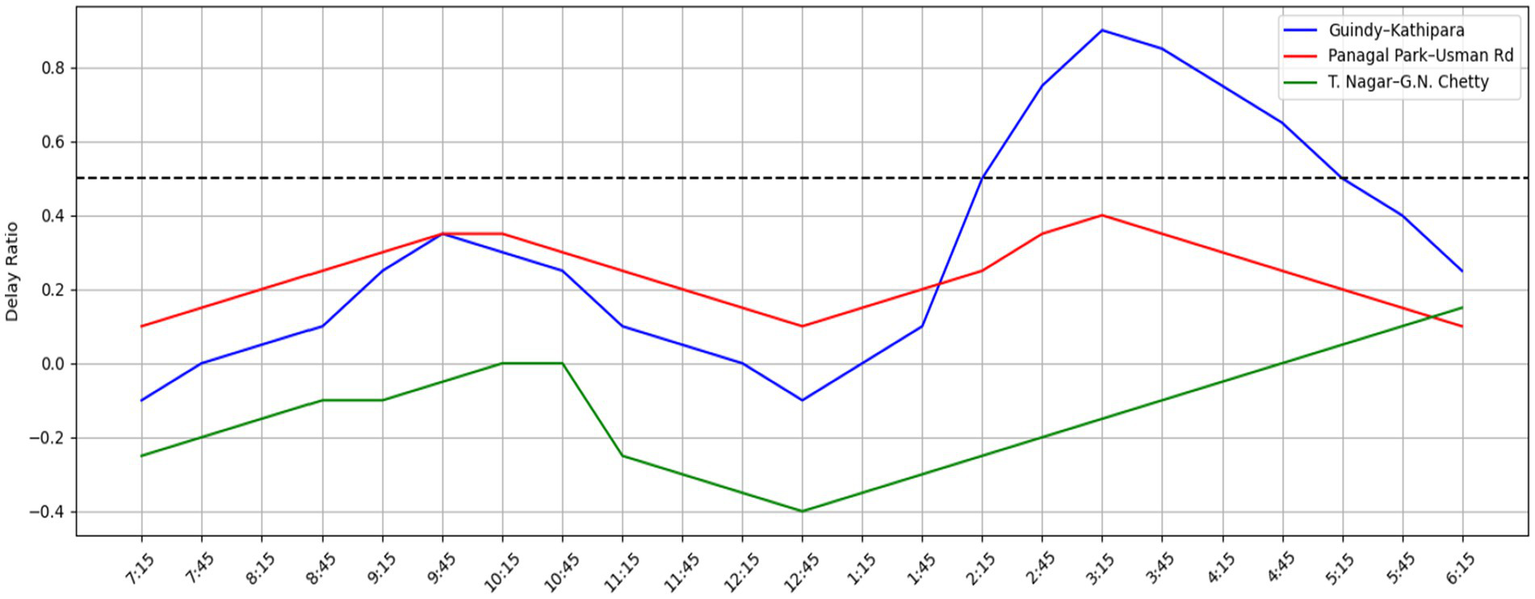
Comparison of the delays in a few road corridors (Parkavi and Parthiban, 2024).
The cumulative impact of everyday congestion on commuters is illustrated by the delay per traveler in Figure 15. For instance, an individual who commutes daily at 3:00 p.m. along the Guindy-Kathipara route would miss an estimated 32.1 h a year due to traffic, which is comparable to over 1.33 full days. This demonstrates the broader impact of traffic on the quality of life and productivity of commuters in Chennai’s central area.
Figure 15

Estimated yearly traveler delay on the Guindy-Kathipara corridor (in hours) (Parkavi and Parthiban, 2024).
5.9 Total segment delay
One of the most trusted methods for assessing traffic congestion at urban intersections is calculating the total segment delay, which measures the cumulative time lost by vehicles in terms of vehicle minutes or person-hours. In Schrank and Lomax (1997), it is suggested that this metric accurately measures the decline in traffic efficiency and functions as a significant marker of the social and economic repercussions of congestion.
The late afternoon hours were the most congested times on the 225-meter stretch of road connecting Kathipara Junction to Guindy. Vehicle delays rose to between 12 and 15 times those experienced during the off-peak morning hours around 3:30 p.m. The observed pattern, illustrated in Figure 16, is primarily due to uncoordinated signal timing and a significant increase in traffic inflows from nearby major roads.
Figure 16
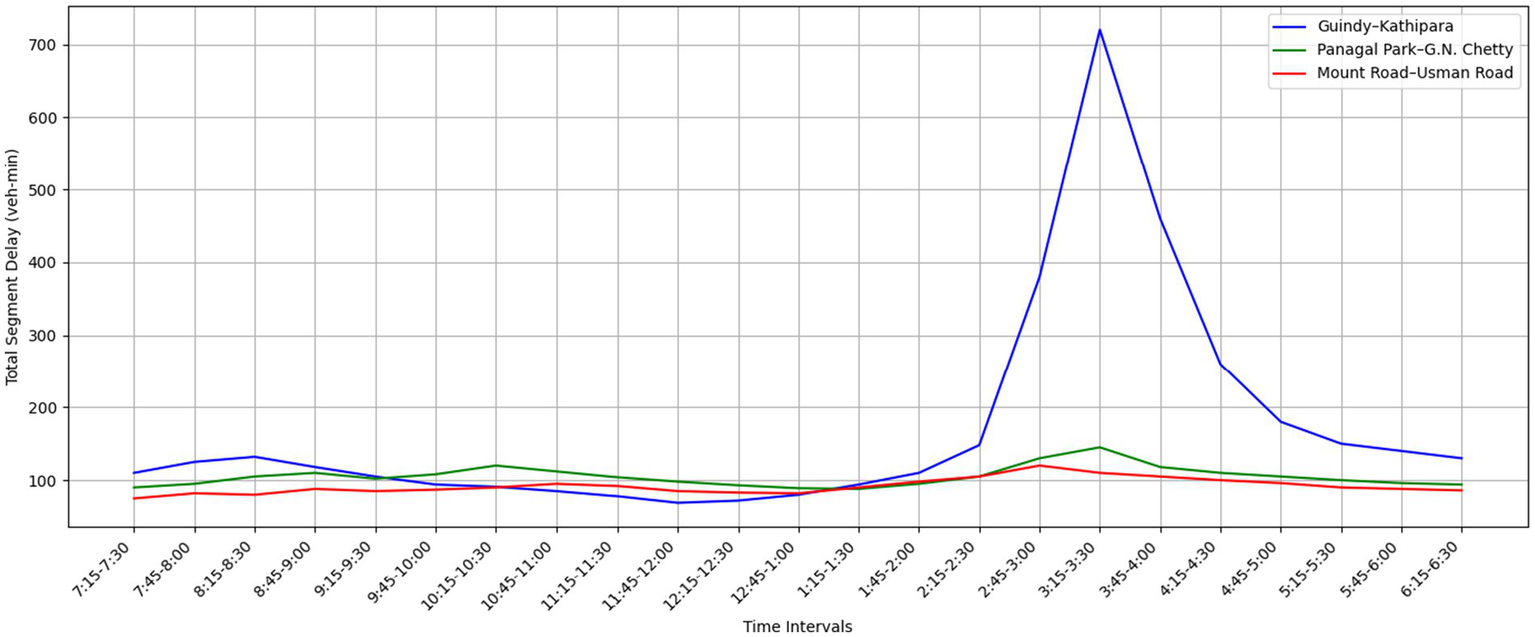
Total segment delay (Parkavi and Parthiban, 2024).
A surge in business activity and pedestrian density led to considerable traffic on the Panagal Park to G.N. road. The G.N. road stretch was observed between 12:45 and 4:15 p.m. Following the Centre for Science and Environment (2019) procedure, delays across road segments were normalized and reported in vehicle-minutes per meter to enable accurate comparisons. Figure 17 illustrates this normalized delay metric, enabling a more transparent comparison of congestion levels across different corridors and facilitating informed decision-making for traffic planning and management.
Figure 17
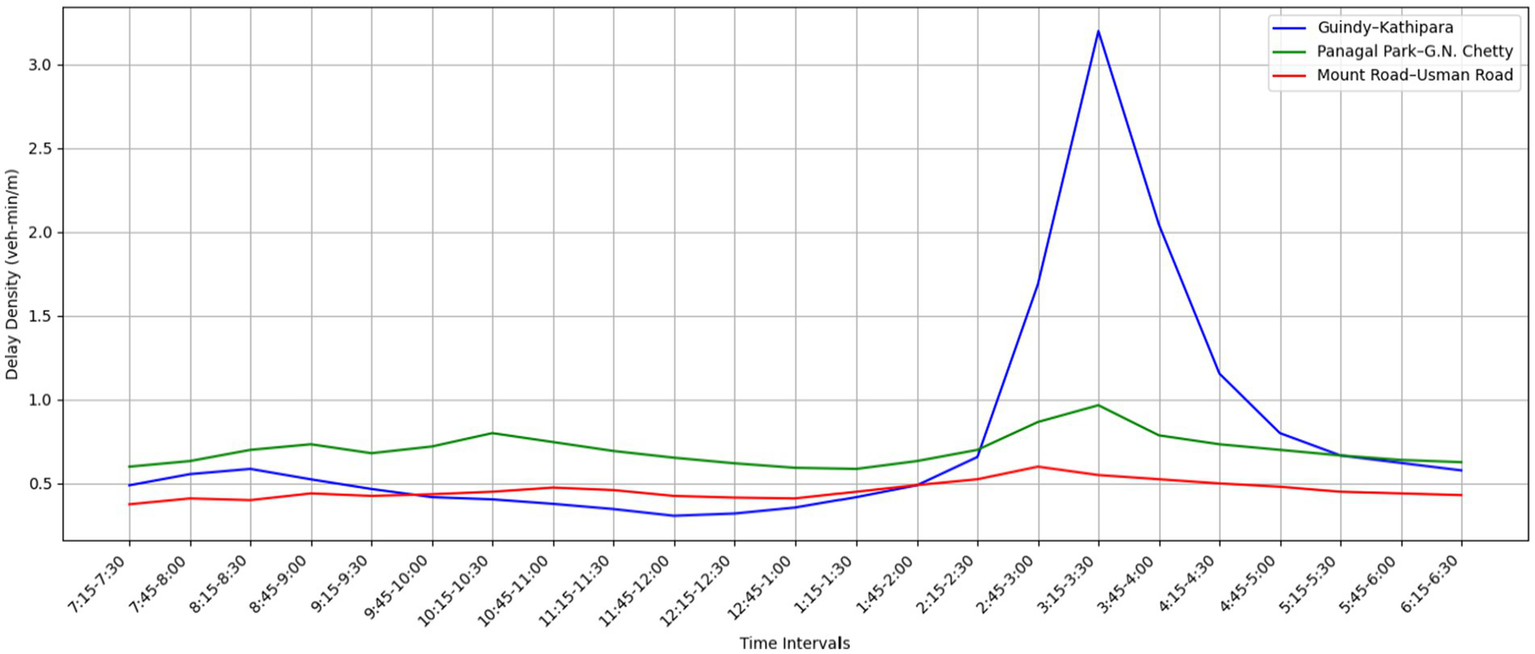
Segment delay density normalized per meter (Parkavi and Parthiban, 2024).
5.10 Causes of congestion
Urban traffic congestion in Chennai is caused by a complex interplay of commuter behavior, operational inefficiencies, and infrastructure constraints, particularly around key locations such as Kathipara Junction and Panagal Park. Numerous contributing factors were identified through commuter surveys and field observations; these were found to be consistent with trends observed in other major Indian cities (Ministry of Road Transport and Highways, 2023; Sarker et al., 2018).
Two of the most apparent issues are the significant number of pedestrians using the streets and the inadequate state of the sidewalks. At Panagal Park, pedestrians are frequently forced onto the carriageway due to the irregularities in the walkways and the lack of space. Street vendors encroaching on pedestrian zones exacerbate the problem, causing direct clashes between vehicles and pedestrians. The observed pattern aligns with findings from similar studies in other Indian cities, where congestion is often attributed to inadequate pedestrian facilities (Google Earth, 2024).
Another important consideration is the prevalent street parking practice, particularly in business districts like T. Nagar. The road’s effective width is much reduced, and traffic flow is impeded by the large number of automobiles parked in illegal spots due to a shortage of off-street parking spaces. These results are consistent with earlier research that found on-street parking to be a significant cause of urban congestion (Aworemi et al., 2009).
The situation is worsened by public transport stops being situated near intersections. Frequently, autos, taxis, and shared autos stop near intersections with traffic signals to pick up and drop off passengers, resulting in temporary traffic congestion and reduced lane options, particularly during periods of high traffic volume (see Figure 18; Table 6). Inefficient signal control at major intersections, such as Kathipara, is also a factor in extended wait times and traffic congestion. Uneven signal phase timing results in varied clearance times for approach lanes, leading to blocked turning lanes and decreased traffic flow. A broader structural concern is the large number of private vehicles and the lack of comprehensive integration of public transport systems. Personal motorized transport remains the primary travel mode in both study areas, as demonstrated in Section 7.2 (Figure 6), with little to no modal shift or last-mile connectivity alternatives. The modal imbalance places an unsustainable burden on intersection infrastructure and hinders the effectiveness of traffic management plans.
Figure 18
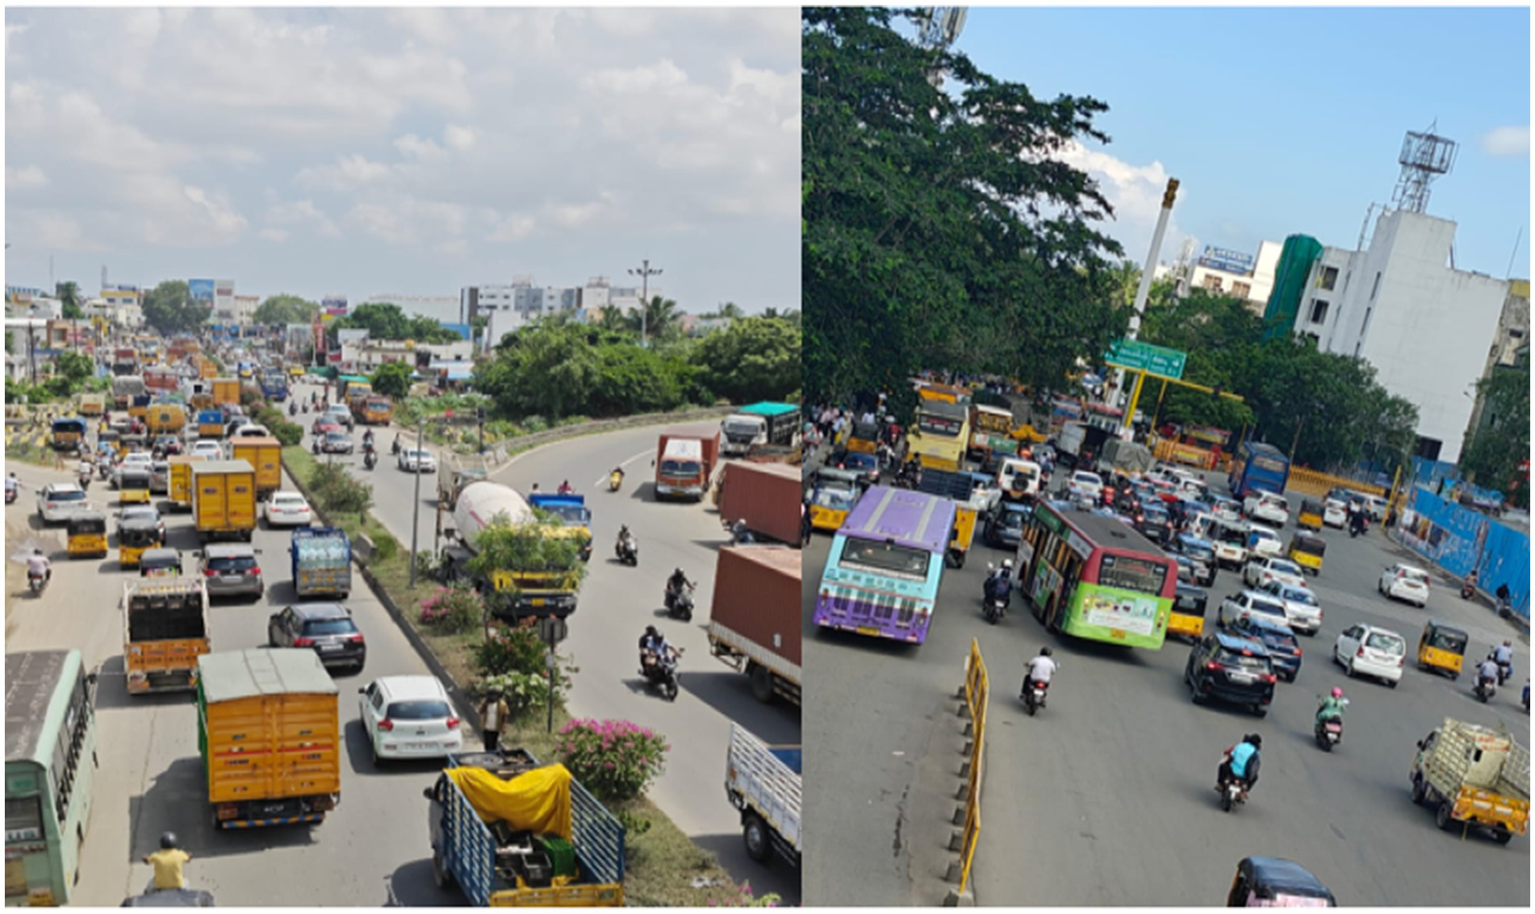
Real-time view of Kathipara Junction showing peak-hour traffic conditions [Source: Author’s field survey, Chennai, 2024 (Parkavi and Parthiban, 2024)].
Table 6
| Intersection | Approach arm | Peak hour volume (veh/h) | Avg delay (s/veh) | LOS | DoS |
|---|---|---|---|---|---|
| Kathipara | Guindy—Kathipara | 10,230 | 142 | F | 1.45 |
| Panagal Park | Usman Road—G.N. Chetty | 8,960 | 126 | E | 1.32 |
Intersection performance summary based on field-observed traffic data and LOS evaluation (Aftabuzzaman, 2007; Parkavi and Parthiban, 2024).
Lacking at both intersections are the crucial infrastructure elements required to efficiently manage mixed-mode traffic. Specifically, grade-separated pedestrian crossings, exclusive turn lanes, and adaptive traffic signal control are among the features that hinder these intersections from meeting the escalating demands of urban transportation. It is clear from these results that both behavioral patterns and infrastructure shortcomings contribute to congestion at key intersections. A comprehensive approach will be necessary to resolve these issues, encompassing infrastructure upgrades, enhanced parking and traffic enforcement, and investments in integrating various modes of transportation.
6 Conclusion
The study’s examination of traffic congestion at two of Chennai’s busiest crossroads, Panagal Park (T. Nagar) and Kathipara Junction, finds significant system overload, high degrees of delay, and operational inefficiencies. The combined observed vehicle delay throughout the three main segments (Guindy–Kathipara, Panagal Park–Usman Road, and G.N. Chetty Road–Panagal Park) was roughly 12,708 vehicle-minutes (212 vehicle-hours), which equates to more than 27 days of lost vehicle time. These results validate severe congestion and decreased network efficiency, as they align with peak-hour traffic loads of 10,230 vehicles per hour at Kathipara and 8,960 vehicles per hour at Panagal Park.
During peak hours, travel speeds in these zones drop precipitously, often falling as low as 1.5 km/h between 2:45 and 4:15. Both crossings are in LOS E–F conditions, which indicate extremely high traffic, according to the Transportation Research Board (2000). With DoS values between 1.32 and 1.45, the Usman Road approach at Panagal Park and the Guindy arm at Kathipara perform the worst, showing a near or complete interruption of traffic movement.
The majority of automobiles are privately owned, outnumbering public transportation, and intersection problems are exacerbated by inadequate pedestrian infrastructure and poorly placed bus and automobile stations. Chronic congestion and hazardous conditions are also compounded by on-street parking and insufficient signal coordination.
Real-time speed measurement, video-based travel-time analysis at 15-min intervals, and probe-vehicle tracking were all combined in this work to capture the temporal and spatial dynamics of congestion. This high-resolution method enabled the accurate characterization of delay variations and bottlenecks during peak hours. Congestion pricing, flexible work schedules, and improved corridor management are examples of adaptive policy responses that are supported by the data-driven technique.
Field observations (Figures 19, 20) highlight key physical and operational bottlenecks, including encroachments, misaligned pedestrian movements, and conflicts with public transportation near signalized intersections. Conceptual design remedies, such as curb-separated pedestrian walkways, organized bus bays, and pedestrian safety buffers, are shown in Figure 21, providing design guidance for safer intersection retrofits.
Figure 19
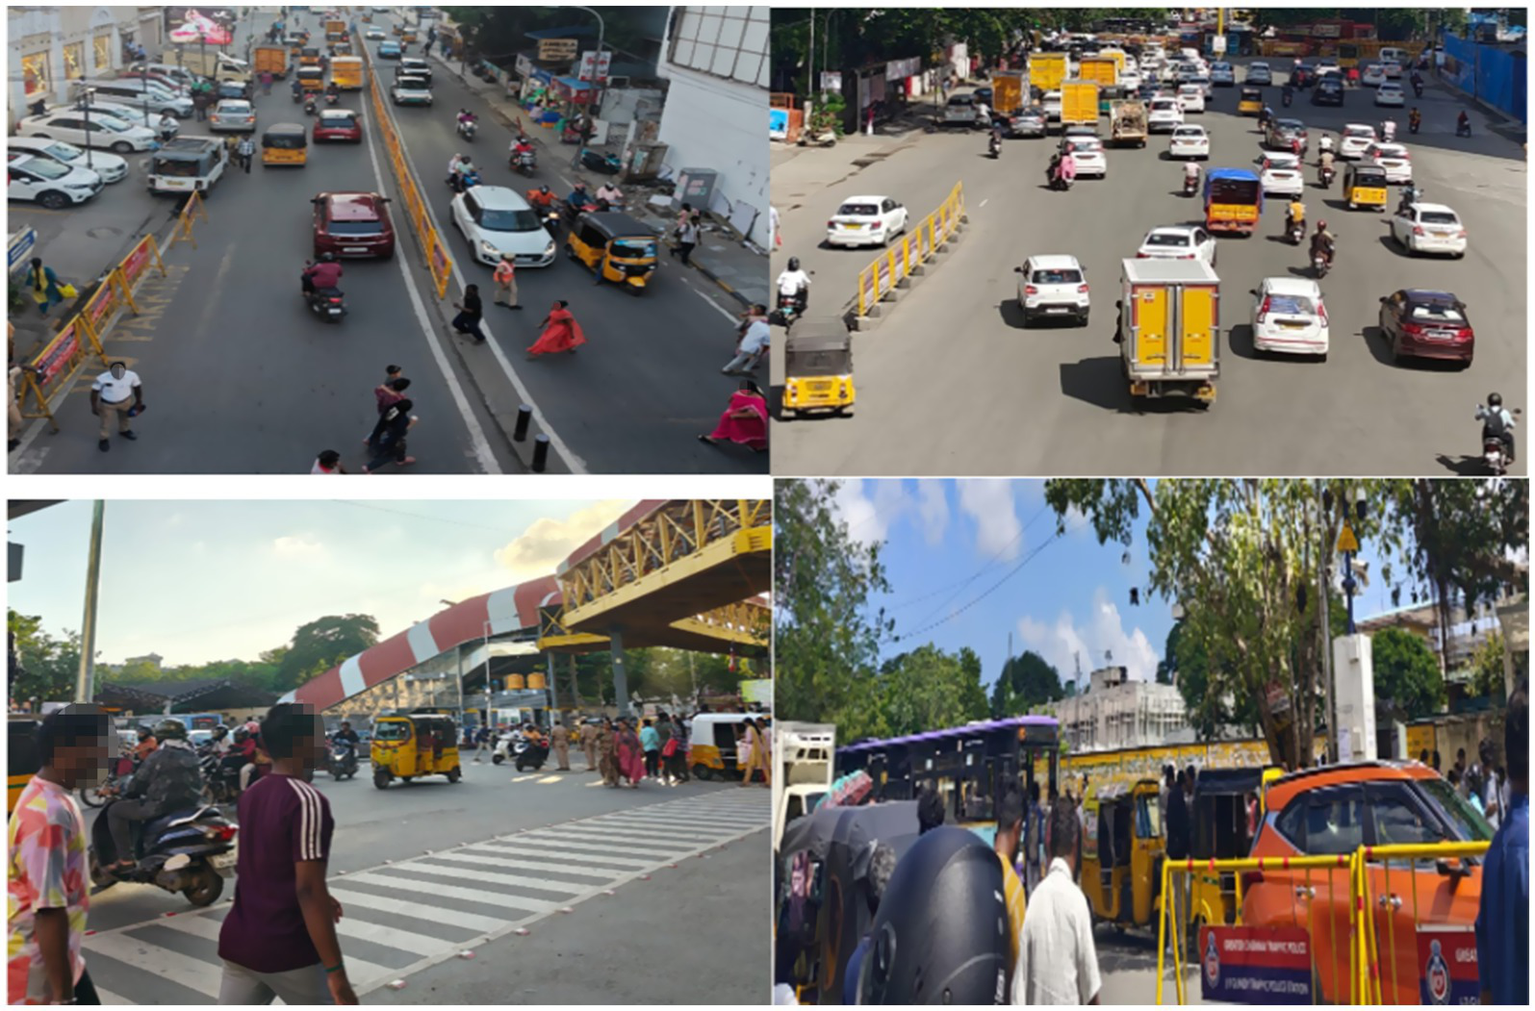
On-ground photo of Panagal Park intersection illustrating mixed traffic and pedestrian density [Source: Author’s field survey, Chennai, 2024 (Parkavi and Parthiban, 2024)].
Figure 20
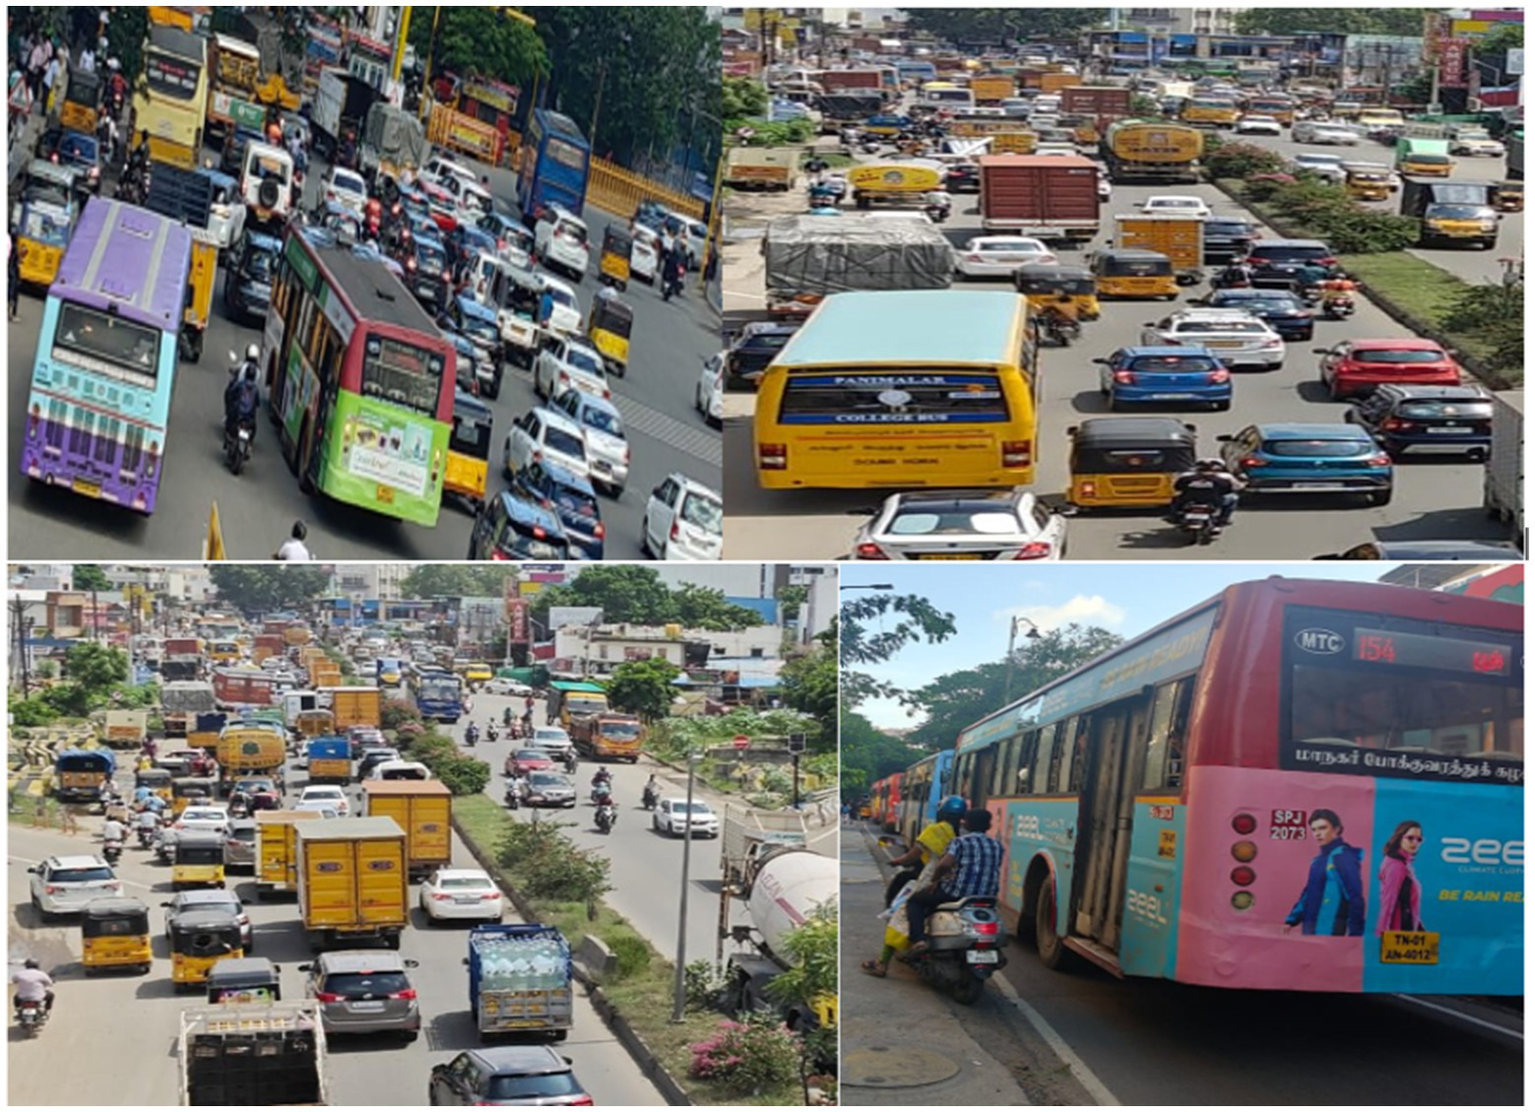
On-street parking and encroachment near Panagal Park reducing effective carriageway width [Source: Author’s field survey, Chennai, 2024 (Parkavi and Parthiban, 2024)].
Figure 21
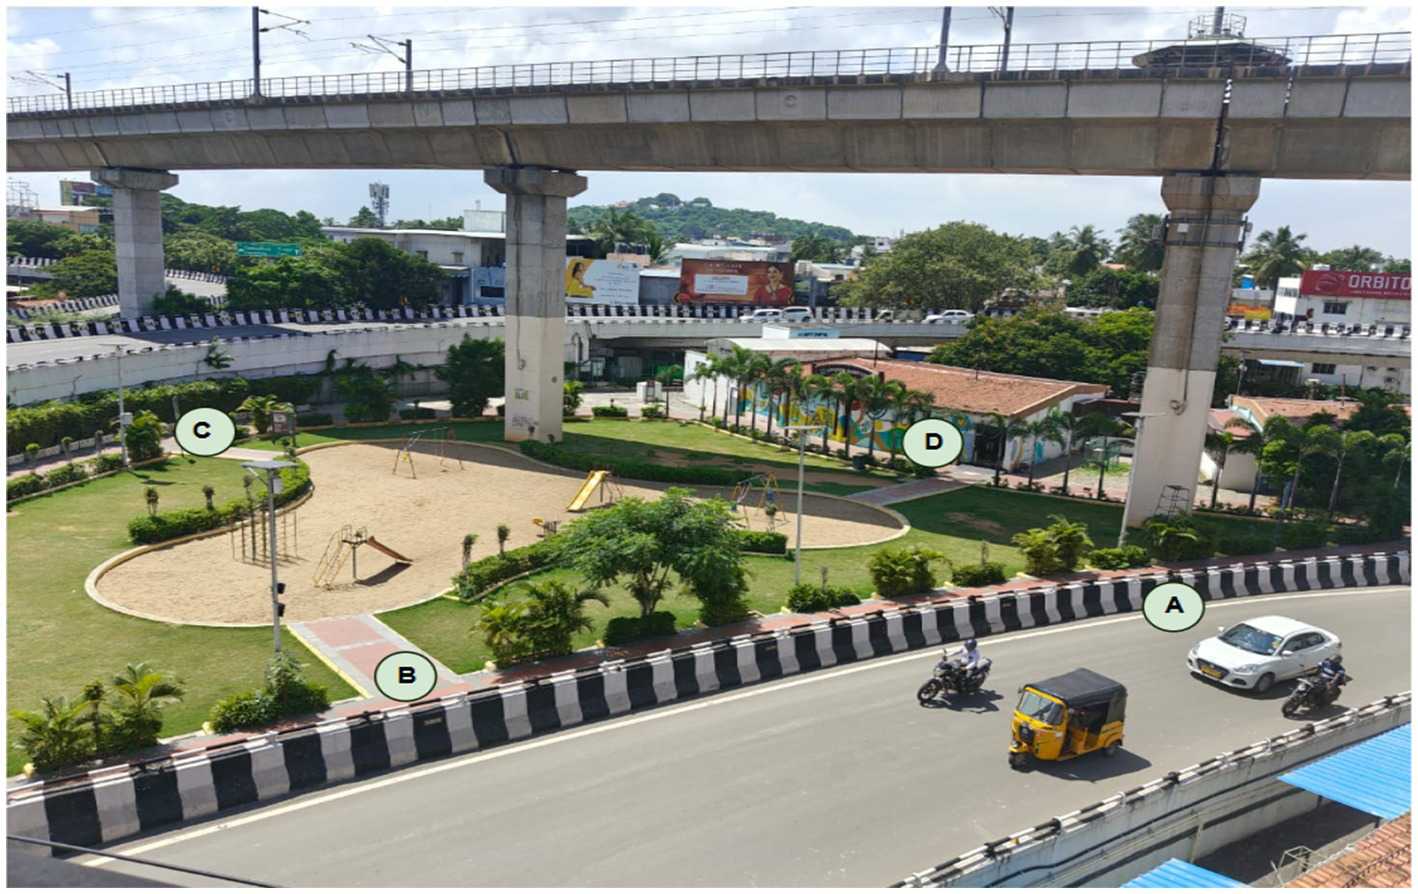
Design solutions at Panagal Park intersection: (A) Proposed bus and auto-rickshaw stop near the junction, (B) Green buffer separating walkway and carriageway, (C) Continuous obstruction-free pedestrian walkway, (D) Curb-separated waiting area for commuters [Source: Author’s field survey, Chennai, 2024 (Parkavi and Parthiban, 2024)].
The investigation revealed that Chennai’s traffic jams stem from non-adaptive signal systems, inadequate multimodal integration, and spatial constraints. The proposed framework is one of the first intersection-level congestion assessments for Chennai, combining field-measured data with delay-based LOS evaluation (Aftabuzzaman, 2007). It provides an approachable, contextually aware methodology that can direct comparable research in other Indian megacities.
The findings support policies that encourage adaptive signal regulation, multimodal integration, and pedestrian-oriented planning to promote sustainable urban transportation by tying local observations to global norms (Werland, 2020; Planning Department, 2019).
The study’s suggestions combine internationally accepted sustainable mobility concepts with the unique transportation issues of Chennai. This approach provides a reproducible paradigm for other Indian cities by incorporating tried-and-true tactics, including adaptive signal control, congestion pricing, and non-motorized integration. It highlights the study’s uniqueness and policy relevance by bridging local field-based findings with international norms.
7 Future research recommendations
The results of this study are in line with global campaigns that support evidence-based and sustainable traffic management. The following suggestions propose practical methods to alleviate mixed-traffic congestion in Chennai’s intersection-level setting by incorporating established international techniques such as adaptive signal control, congestion pricing, and non-motorized transportation.
Significant delays and poor intersection efficiency are confirmed by field observations at Panagal Park and Kathipara Junction. Future research should expand data collection to encompass a full week, including weekends, to simulate temporal variation in traffic demand and increase model precision.
-
Reinforcing Governance and Policy: For mobility management to be efficient, Chennai’s major transport authorities must work together in concert. Congestion-pricing schemes can increase the proportion of public transportation and deter private vehicle use in crowded business zones like T. Nagar and Guindy. The efficacy of policies will be increased by combining parking management, enforcement, and signal synchronization into a single urban mobility framework (D’Agostino et al., 2020).
-
Enhancing Infrastructure and Parking Management: Strict curbside control, multilevel off-street parking, and moving bus stops and auto-rickshaw stands away from signalized intersections are all ways to improve intersection performance (Planning Department, 2019). Additionally, establishing refuge islands and designated pedestrian zones will enhance operational flow and safety.
-
Implementation of Smart Traffic Systems: Intelligent Transportation Systems (ITS) will be installed at key intersections to provide real-time traffic control. CCTV-based enforcement, a centralized operations center, and adaptive signal control can all enhance compliance, minimize delays, and dynamically adjust signal phases in Chennai’s complex traffic environment (Land Transport Authority (Singapore), 2020).
-
Endorsing the Avoid-Shift-Improve (ASI) Model: The ASI framework provides a thorough method for mitigating congestion (Regmi, 2020; UN-Habitat, 2020):
-
Avoid: By using remote work choices and staggered work schedules, you can lower demand during peak hours.
-
Change: Increase and include dependable last-mile connectivity with public transportation options.
-
Improve: Upgrade infrastructure through better walkways, skywalks, and illumination at high-demand intersections such as Kathipara and T. Nagar.
-
Integration of Non-Motorized Transportation (NMT): Short-distance automotive traffic can be significantly reduced by promoting walking and bicycling through dedicated NMT lanes and continuous pedestrian walkways. If Chennai’s key transit corridors were connected with networks for pedestrians and bikes, the city’s mobility would be safer and more sustainable (Elesawy, 2021; City of Amsterdam, 2019).
Statements
Data availability statement
The original contributions presented in the study are included in the article/supplementary material, further inquiries can be directed to the corresponding author.
Ethics statement
Ethical approval was not required for the study involving humans in accordance with the local legislation and institutional requirements. Written informed consent to participate in this study was not required from the participants or the participants in accordance with the national legislation and the institutional requirements.
Author contributions
AP: Investigation, Supervision, Validation, Visualization, Writing – original draft, Writing – review & editing. SP: Formal analysis, Methodology, Writing – original draft, Writing – review & editing.
Funding
The author(s) declare that no financial support was received for the research and/or publication of this article.
Conflict of interest
The authors declare that the research was conducted in the absence of any commercial or financial relationships that could be construed as a potential conflict of interest.
Generative AI statement
The author(s) declare that no Gen AI was used in the creation of this manuscript.
Any alternative text (alt text) provided alongside figures in this article has been generated by Frontiers with the support of artificial intelligence and reasonable efforts have been made to ensure accuracy, including review by the authors wherever possible. If you identify any issues, please contact us.
Publisher’s note
All claims expressed in this article are solely those of the authors and do not necessarily represent those of their affiliated organizations, or those of the publisher, the editors and the reviewers. Any product that may be evaluated in this article, or claim that may be made by its manufacturer, is not guaranteed or endorsed by the publisher.
References
1
Abeje W. (2012). Sustainable urban mobility planning for coping challenges of urban transportation in the fast urbanizing Ethiopia. In CODATU XV: The role of urban mobility in (re) shaping citiesCODATU.
2
Afrin T. Yodo N. (2020). A survey of road traffic congestion measures towards a sustainable and resilient transportation system. Sustainability12:4660. doi: 10.3390/su12114660
3
Aftabuzzaman M. (2007). Measuring traffic congestion-a critical review. In 30th Australasian transport research forum (Vol. 1). London, UK: ETM GROUP.
4
Almselati A. S. I. Rahmat R. A. O. K. Jaafar O. (2011). An overview of urban transport in Malaysia. Soc. Sci.6, 24–33. doi: 10.3923/sscience.2011.24.33
5
Aworemi J. R. Abdul-Azeez I. A. Oyedokun A. J. Adewoye J. O. (2009). A study of the causes, effects and ameliorative measures of road traffic congestion in Lagos metropolis. Eur. J. Soc. Sci.11, 119–128.
6
Berisha B. (2016). Alleviating traffic congestion in Prishtina.
7
Bigazzi A. Y. Clifton K. J. (2015). Modeling the effects of congestion on fuel economy for advanced power train vehicles. Transp. Plan. Technol.38, 149–161. doi: 10.1080/03081060.2014.997449
8
Bireda T. (2017). “Intelligent transport system in Ethiopia: status and the way forward” in International conference on information and communication Technology for Develoment for Africa. Eds. F. Mekuria, E. E. Nigussie, W. Dargie, M. Edward, and T. Tegegne. (Cham: Springer International Publishing), 34–45.
9
Bryman A. (2016). Social research methods. Oxford: Oxford University Press.
10
Cambridge Systematics (2008). Cost-effective performance measures for travel time delay, variation, and reliability, Oxford: Transportation Research Board, 618.
11
Centre for Science and Environment (2019). The urban commute and how it contributes to pollution and energy consumption: A CSE analysis and ranking of 14 cities in India. Available online at: https://data.opencity.in/dataset/70eb645c-d2b8-4246-887d-83bdf701a975/resource/f0586580-87e3-4b5b-a8c1-92062ba2fe32/download/cse-india-the-urban-commute-report.pdf
12
Centre of Excellence for Urban Transport, Indian Institute of Technology Madras (2014). Consultancy Services for after Study-Traffic Data Collection and Analysis for the research study on advanced traveler information system (ATIS) for Indian cities. After Study Report. Available online at: https://coeut.iitm.ac.in/Final%20Report%20R01.pdf (Accessed July 14, 2025).
13
Chennai Metropolitan Development Authority (CMDA) . (2019). Comprehensive mobility plan for CMA final report. Available online at: https://www.cmdachennai.gov.in/pdfs/ComprehensiveMobilityPlan-CMA.pdf (Accessed July 14, 2025).
14
City of Amsterdam (2019). Bicycle and pedestrian master plan. Available online at: https://bicycleinfrastructuremanuals.com/manuals4/GemeenteAmsterdam-long-term_bicycle_plan_2017-2022_English.pdf (Accessed July 14, 2025).
15
Congestion, M. U. T . (2007). Managing urban traffic congestion.
16
D’Agostino M. C. Pellaton P. White B. (2020). Equitable congestion pricing.
17
Denzin N. K. (2017). The research act: A theoretical introduction to sociological methods. Oxford: Routledge.
18
Elesawy E. (2021). The bicycle strategy 2011–2025, Copenhagen. Urban planning for transitions, 121–137.
19
Gartner N. (2001). Traffic flow theory: A state-of-the-art report Available online at: http://www.cta.ornl.gov/cta/research/trb/tft.html (Accessed July 14, 2025).
20
Google Earth (2024). A Complete Google Earth Pro Beginner’s Guide in 2023. #googleearth #spatialdata.
21
Habitat U. N. (2020). The value of sustainable urbanization. World Cities Report.
22
Knoop V. L. (2017). Introduction to traffic flow theory: An introduction with exercises. Delft, The Netherlands: Delft University of Technology.
23
Kvale S. (1996). InterViews: An introduction to qualitive research interviewing. Oxford: Sage.
24
Land Transport Authority (Singapore) (2020). Smart Mobility 2030 Master Plan. Available online at: https://www.lta.gov.sg/content/dam/ltagov/getting_around/driving_in_singapore/intelligent_transport_systems/pdf/smartmobility2030.pdf (Accessed July 14, 2025).
25
Levinson D. (2010). Equity effects of road pricing: a review. Transp. Rev.30, 33–57. doi: 10.1080/01441640903189304
26
Litman T. M. (2022). Evaluating transportation equity: guidance for incorporating distributional impacts in transport planning. Inst. Transp. Eng. J.92, 43–49.
27
Lowe J. C. (1980). The urban transportation system: politics and policy innovation. Econ. Geogr.56:81. doi: 10.2307/143032
28
Ministry of Road Transport & Highways . (2023). Road Accidents in India 2022. Available online at: https://morth.nic.in/sites/default/files/RA_2022_30_Oct.pdf (Accessed July 14, 2025).
29
Papageorgiou M. Diakaki C. Dinopoulou V. Kotsialos A. Wang Y. (2003). Review of road traffic control strategies. Proc. IEEE91, 2043–2067. doi: 10.1109/JPROC.2003.819610
30
Parkavi S. Parthiban A. (2024). Questionnaire Survey, Interview and Observation, Field Survey, 2024 at Selected Intersections. Chennai.
31
Planning Department (2019). Transport infrastructure and traffic review [Hong Kong 2030+. Available online at: https://www.pland.gov.hk/file/planning_studies/comp_s/hk2030plus/document/Transport%20Infrastructure%20and%20Traffic%20Review_Eng.pdf (Accessed July 14, 2025).
32
Ramachandraiah C. (2012). A Superficial Picture. pp. 35–37.
33
Rao A. M. Rao K. R. (2012). Measuring urban traffic congestion-a review. Int. J. Traffic Transp. Eng.2, 286–305. doi: 10.7708/ijtte.2012.2(4).01
34
Rasheed M. R. (2022) Moving forward: an assessment of Qatar's public transportation system and recommendations for future development.
35
Regmi M. B. (2020). Measuring sustainability of urban mobility: a pilot study of Asian cities. Case Stud. Transp. Policy8, 1224–1232. doi: 10.1016/j.cstp.2020.08.003
36
Roychowdhury A. Dubey G. (2018a). The urban commute: And how it contributes to pollution and energy consumption — A CSE analysis and ranking of 14 cities in India Centre for Science and Environment. Available online at: https://www.cseindia.org/the-urban-commute-8950 (Accessed July 14, 2025).
37
Roychowdhury A. Dubey G. (2018b). The urban commute: And how it contributes to pollution and energy consumption: Centre for Science and Environment.
38
Sarker A. Shen H. Stankovic J. A. (2018). MORP: data-driven multi-objective route planning and optimization for electric vehicles. Proc. ACM Interact. Mobile Wearable Ubiquitous Technol.1, 1–35. doi: 10.1145/3161408
39
Satterthwaite D. (2007). The transition to a predominantly urban world and its underpinnings (No. 4) Iied.
40
Schrank D. L. Lomax T. J. (1997). Urban roadway congestion—1982 to 1994, volume 1: annual report. College Station, TX: Texas Transportation Institute, The Texas A&M University System.
41
Schrank D. L. Lomax T. J. (2009). Urban mobility report. Texas Transportation Institute, The Texas A&M University System.
42
Segui-Gomez M. Luo F. Tingvall C. Taylor M. P. (2025). Assessing the impact of the WHO global status reports on road safety. Inj. Prev.:ip-2024-045536. doi: 10.1136/ip-2024-045536
43
Singh S. K. (2012). Urban transport in India: issues, challenges, and the way forward. European Transport/Trasporti Europei (2012) Issue, 52.
44
Solanke M. O. (2013). Challenges of urban transportation in Nigeria. Int. J. Dev. Sustain.2, 891–901.
45
Statistics, M. T . (2004). Government of India, Ministry of Road Transport and Highways, New Delhi. Available online at: morth.nic.in/mts.htm [Accessed July].
46
Systematics C. (2005). Traffic congestion and reliability: Trends and advanced strategies for congestion mitigation (no. FHWA-HOP-05-064). United States: Federal Highway Administration.
47
Tamil Nadu Government (2019). The Tamil Nadu town and country planning act, 1971 (Tamil Nadu act 35 of 1972). Available online at: https://www.cmdachennai.gov.in/pdfs/tntcp_act.pdf (Accessed July 14, 2025).
48
Tesfaye Demdime F. (2012). Integrating public transport networks and built environment.: the case of Addis Ababa and experiences from Stockholm.
49
Transportation Research Board (2000). Highway Capacity Manual (HCM). Available online at: https://onlinepubs.trb.org/Onlinepubs/sr/sr209/209.pdf (Accessed July 14, 2025).
50
UN-Habitat (2020). Guidelines for sustainable urban transport. Available online at: https://unhabitat.org/sites/default/files/2020/10/wcr_2020_report.pdf (Accessed July 14, 2025).
51
Weisbrod G. Vary D. Treyz G. (2003). Measuring economic costs of urban traffic congestion to business. Transp. Res. Rec.1839, 98–106. doi: 10.3141/1839-10
52
Werland S. (2020). Diffusing sustainable urban mobility planning in the EU. Sustainability12:8436. doi: 10.3390/su12208436
Summary
Keywords
transport, traffic congestion, level of service, traffic management, intersections, Chennai
Citation
Parkavi S and Parthiban A (2025) Assessing urban traffic congestion for sustainable transportation in Chennai, India: a case study of Kathipara and T. Nagar intersections. Front. Sustain. Cities 7:1684489. doi: 10.3389/frsc.2025.1684489
Received
12 August 2025
Accepted
29 October 2025
Published
13 November 2025
Volume
7 - 2025
Edited by
Jaeyoung Jay Lee, Central South University, China
Reviewed by
Siddardha Koramati, Sarvejana Foundation, India
Malik Sarmad Riaz, National University of Technology (NUTECH), Pakistan
Updates
Copyright
© 2025 Parkavi and Parthiban.
This is an open-access article distributed under the terms of the Creative Commons Attribution License (CC BY). The use, distribution or reproduction in other forums is permitted, provided the original author(s) and the copyright owner(s) are credited and that the original publication in this journal is cited, in accordance with accepted academic practice. No use, distribution or reproduction is permitted which does not comply with these terms.
*Correspondence: Angamuthu Parthiban, parthiban.a@vit.ac.in
†These authors have contributed equally to this work
Disclaimer
All claims expressed in this article are solely those of the authors and do not necessarily represent those of their affiliated organizations, or those of the publisher, the editors and the reviewers. Any product that may be evaluated in this article or claim that may be made by its manufacturer is not guaranteed or endorsed by the publisher.