Abstract
In recent years, the Chinese new energy vehicle (NEV) market has undergone rapid expansion, playing a significant role in reducing urban carbon emissions. Using panel data from 299 Chinese cities, spanning the period from 2008 to 2024, this study develops a regression model to analyze the impact of NEV market expansion on urban green development and to investigate the underlying mechanisms. The findings reveal that the growth of the NEV market significantly enhances urban green development, with urban population density serving as a key positive moderating factor. Mechanistically, the expansion of the NEV market stimulates technological advancements in new energy, reshapes urban energy consumption patterns, and optimizes both upstream and downstream industrial structures. Additionally, the implementation of policies promoting the adoption of NEVs has proven effective in advancing urban green development. Cities that have adopted subsidy policies for NEVs have seen a substantial increase in the expansion of the NEV market, leading to significant improvements in urban green development levels. Based on these findings, the paper offers policy recommendations aimed at accelerating urban green transformation through the strategic expansion of the NEV market.
1 Introduction
The Chinese government has identified high-quality development as a central objective in its pursuit of a modern socialist nation. In this context, the government is dedicated to accelerating the comprehensive green transformation of both the economy and society. This transformation encompasses improving the ecological and environmental governance systems, advancing the prioritization of ecological preservation, promoting resource conservation and efficiency, and championing green, low-carbon development. Such efforts aim to foster the harmonious coexistence of humanity and nature. Green development, characterized by its focus on environmental stewardship and sustainable progress, is a cornerstone of this new development model, and an integral component of the nation’s vision for ecological civilization.
At the urban level, the concept of green development was further deepened after the 1992 United Nations Conference on Environment and Development in Rio de Janeiro (the “Earth Summit”). The Agenda 21 adopted by the conference clearly emphasized the key role of cities in promoting sustainable development, pointing out that cities are both centers of resource consumption and pollution emissions, as well as core stages for green transformation and innovation. Since then, international organizations such as the OECD, UN-Habitat, and the World Bank have proposed concepts such as “green cities,” “low-carbon cities,” and “ecological cities,” providing theoretical support for academic research and practical promotion of urban green development. Based on the comprehensive research results from both domestic and international sources above, this paper defines urban green development as: the process in which a city achieves the intensification and efficiency of resource utilization, the protection and restoration of the ecological environment, the green transformation of economic growth, and the overall enhancement of social welfare.
Against this backdrop, the State Council issued the “New Energy Vehicle Industry Development Plan (2021–2035)” in 2020, positioning the development and promotion of new energy vehicles (NEVs) as a pivotal strategy to mitigate climate change, catalyze the green transformation of the transportation sector, and bolster the overarching goals of green development. The electrification of vehicles not only leads to a reduction in greenhouse gas emissions but also significantly improves urban air quality and reduces health losses associated with air pollution, thereby creating direct public benefits for urban green development (Carey, 2023).
By 2024, the number of NEVs in China has surged to 31.4 million, more than five times the figure recorded in 2020. The rapid expansion of the NEV market has had a profound impact on urban green development, particularly in facilitating the green transformation of cities. First, the growth of the NEV market has spurred significant advancements in new energy technologies, including key innovations in energy storage systems. These technological strides are crucial for enhancing urban green development. Yue and Duan (2024) focused on green innovation performance and analyzed how the concentration of the NEV industry can enhance regional green innovation. Liu and Xie (2025) also found that green technology innovation played an important intermediary role in the process of promoting green development through the aggregation of the NEV industry. Second, the expansion of NEVs has catalyzed a transformative shift in urban energy consumption patterns. Qiu et al. (2024) have found that the energy supply has a long-term and significant impact on the carbon reduction effect of new energy vehicles. As of 2024, NEVs account for 8.9% of the nation’s total vehicle fleet, up from just 1.75% in 2020. This shift marks a gradual but profound departure from reliance on traditional fossil fuel-powered vehicles to an increasing reliance on electric power. Such a transformation mitigates carbon emissions in the transportation sector and significantly advances urban green development. Lastly, the growth of the NEV market has induced a green transformation across industries. The synergies and spillover effects brought about by the aggregation of the manufacturing industry can enhance the efficiency of green innovation, and this conclusion provides theoretical support for the regional green transformation driven by the NEV industry aggregation (Xu and Zhang, 2023). Increased demand for electricity, driven by the widespread adoption of NEVs, has promoted the growth of clean energy industries, such as solar and wind power, further accelerating the green development of cities.
However, the expansion of the NEV market is not merely a function of technological advancement; it also requires significant support from both industry clustering and large-scale market consumption potential. The population size of a city plays a pivotal role in both the expansion of the NEV market and the promotion of urban green development. Several studies have figured out the promotion of the green effect of new energy vehicles by high population density (Gao et al., 2023; Zhao et al., 2023; Schnell et al., 2021). A moderate population density not only provides the necessary vitality for market expansion but also fosters the technological innovation and talent needed to facilitate the clustering of NEV-related industries. In light of this, this paper investigates the effects of the NEV market on urban green development, exploring both its direct impacts and the mechanisms through which it operates, with a specific focus on the role of urban population size.
2 Literature review
2.1 Research on green development in China
In recent years, research on green development in China has unfolded from multiple dimensions such as technological innovation, policy mechanisms, industrial structure adjustment, and environmental regulations.
Firstly, technology innovation represented by artificial intelligence plays a key role in China’s green development. Feng F. et al. (2024) have figured out that the application of artificial intelligence significantly enhances the efficiency of green innovation and holds the potential to become a catalyst for green development. Secondly, Li et al. (2025d) empirically examined the mechanism through which uncertainty inhibits corporate ESG (environmental, social and governance) performance, indicating the significant role of macro policy expectation stability in green development. Thirdly, the adjustment of the industrial structure has provided space for the development of various green industries such as solar and hydropower, thereby impacting the level of green development in China. Several empirical studies have shown that upgrading industrial structures can enhance green total factor productivity by eliminating backward production capacity, optimizing factor allocation, and promoting technological progress, thus reducing carbon intensity and promoting regional green development (Yang et al., 2022; Xu and Zhou, 2023). Lastly, environmental regulations can monitor China’s green development by influencing corporate behavior. Regarding the connection between corporate behavior and green development, Li et al. (2025c) found that investor attention under certain conditions may induce companies to engage in “greenwashing” behaviors, and environmental regulations have intensified this suppression.
2.2 Urban greening and its influencing factors
Research on urban green development includes three aspects: green economy, green environment and green society. Green economic development connotes balancing the efficiency of environmental protection, resource conservation and economic growth. Huang et al. (2025) found that there is a long-term stable cointegration relationship between the intensity of development of land resources and green economic development, which helps to formulate sustainable development policies to solve the problems of economic growth and environmental sustainability. On the aspect of green environment, green development implies low-carbon development and reduction of environmental pollution. According to Chen (2024), the core of green development is to harmonize economic growth and environmental protection, and the concept of green development makes environmental protection no longer an independent field, but permeates all aspects of economic and social development. From an ecological perspective, the configuration and management of urban green infrastructure critically determine the supply of ecosystem services such as temperature regulation, storm water retention, and carbon sequestration (Jato-Espino et al., 2023; Hanna et al., 2023). Landscape connectivity, vegetation diversity, and long-term maintenance practices are decisive factors in enhancing these ecological functions (Yao et al., 2025). In the dimension of green society, green development implies the enhancement of people’s well-being and the maintenance of social stability, which refer to the sustainable development of society. According to Kong (2024), enterprises can promote green development by making positive contributions in many aspects, such as assisting the poor as well as supporting education, spreading the concept of peace, helping energy conservation and environmental protection, and protecting biodiversity. Additionally, land-use policies and urban expansion patterns exert significant influence on urban greening outcomes. Remote-sensing analyses reveal that uncontrolled urban sprawl and weak land-use regulation often result in vegetation degradation, whereas integrated planning and nature-based solutions promote multifunctional green spaces with climate and social co-benefits (Dorst et al., 2019; Li et al., 2025a). Last but not least, from the aspect of social source and spatial equity. The equality of green resource allocation is also affecting the progress of urban greening. Social-economic disparities, historical land allocation, and property market dynamics lead to unequal distribution of urban green spaces, undermining both accessibility and environmental justice (Bressane et al., 2024). Conversely, strong community engagement and participatory governance have been shown to significantly improve the sustainability and public acceptance of urban greening initiatives (Li and Carter, 2025).
Urban green development is the result of the interaction of multiple influencing factors: first, the policy is an important factor in promoting urban green development. The empirical study of Deng and Wu (2024) proves that the pilot policy of low-carbon city construction significantly promotes the green development of resource-oriented cities. Second, technology and innovation are the core driving force to realize urban green development. Zhao et al. (2024) have shown that green technological innovation plays a significant role in promoting urban green development, mainly through technological progress to enhance the green total factor productivity of cities. The study by Wang and Yang (2025) further shows that science and technology innovation will promote urban green development through the mediating effect of promoting industrial structure optimization and strengthening resource inputs. Third, the development of digital economy also has a great impact on urban green development. Some scholars argue that the development of digital economy has a positive effect on urban green development (Li Y. et al., 2025; Sun et al., 2023). However, there are some studies indicate that the rapid development of the digital economy also brings about huge energy consumption. The consumption can make it difficult to control carbon emissions under the current electricity production which relies mainly on fossil fuels. Accordingly, the digital economic development will have a negative effect on the green development of cities (Wang and Gu, 2024).
2.3 Corporate green development
Urban green development is built on the foundation of corporate green development, and tracking the research trajectory of corporate green development helps us delve into the micro-mechanisms of urban greening. Corporate green development (CGD) is the firm-level process of integrating environmental objectives into strategy (Feng J. et al., 2024), operations (Rauf et al., 2024) and innovation (de Oliveira et al., 2023; Khan et al., 2025)—aiming to grow economically while minimizing ecological burdens through cleaner production, energy efficiency, emissions reduction, green products and transparent disclosure. CGD is often framed as corporate green transformation—a strategy-driven, capabilities-based upgrade that converts regulatory, financial and market pressures into greener technologies and practices—consistent with broader “green growth” and corporate-sustainability paradigms (Li et al., 2020).
Recent studies converge on four drivers—regulation, green finance, AI capabilities and innovation-performance linkages—while emphasizing heterogeneous effects across ownership, life-cycle and governance contexts. Firstly, environmental regulation plays a catalytic role in corporate green development. Quasi-natural experiments conducted by Su (2024) show that tighter rules spur firm green invention in line with Porter-type effects. Secondly, green credit pilots and policy guidelines ease financing constraints and upgrade innovation quality at heavy-polluters, with DID estimates showing boosts to both the quantity and quality of innovation (Bai et al., 2024). Green-finance pilot reforms also lift green invention among “green enterprises,” indicating place-based finance can shift firm innovation portfolios (Wang et al., 2023). Thirdly, artificial intelligence (AI) is gradually becoming an undeniable force in promoting green innovation and development in enterprises. The study of Li et al. (2025b) provides direct firm-level evidence that AI adoption significantly promotes corporate green development, operating through enhanced green innovation efficiency and remaining robust across multiple tests; effects are typically stronger in high-tech firms. Complementary studies show AI improves green innovation efficiency, and increases enterprise green TFP via green transformation pathways (Li, 2025). Last but not least, companies that pursue green development have advantages in market performance. New evidence from Cheng et al. (2025) links green innovation to future environmental improvements and—when focused on pollution prevention rather than end-of-pipe control—financial performance gains, reconciling CGD with shareholder value in the medium term. In summary, corporate green development is a process of enterprise growth that balances environmental protection and innovation efficiency, with technology, economy, and policy being important intervening factors in the process.
2.4 Impact of new energy vehicles on green development
Along with the wave of supply-side structural reform of the automobile industry, the new energy vehicle industry has begun to emerge, and it is widely recognized that new energy vehicles play an important role in the low-carbon transformation and even green development of the regional economy (Liu et al., 2021; Shan et al., 2024; Bonsu, 2020). Mechanistically, new energy vehicles can contribute to green development through technological innovation: new energy vehicle industrial agglomeration can improve regional green economic efficiency by promoting green technological innovation (Yang et al., 2024), and the charging facilities supporting new energy vehicles can help governments effectively reduce their carbon footprint by adopting green energy technologies such as energy storage (Barman et al., 2023). The rechargeable batteries of new energy vehicles alleviate the high dependence on fossil energy in the previous energy structure and promote the transition of energy to green, low-carbon, safe and efficient (Li et al., 2024). New energy vehicle technology can improve the efficiency of regional carbon emissions, by promoting the upgrading of the automobile industry, thus realizing the goal of carbon peaking and carbon neutrality (Yi et al., 2025).
2.5 Regional differences in the promotion of NEVs and green development
The adoption and expansion of NEVs have varied effects across different regions, largely due to regional differences in economic development, policy implementation, infrastructure availability, and population density. Wu et al. (2025) argue that cities in China’s eastern coastal regions, which are economically more developed, tend to benefit more from NEV market growth. These regions exhibit higher rates of technological innovation, better infrastructure, and stronger policy support, which together facilitate a smoother transition to green development. In contrast, Dong et al. (2025) show that cities in the central and western parts of China, with lower levels of economic development and infrastructure, experience slower growth in the NEV market and face more challenges in achieving sustainable urban transformation. Additionally, policy differences help explain cross-regional variation in NEV promotion, and regions with proactive government policies such as subsidies and incentives for NEV adoption, see more pronounced benefits (Fan et al., 2024; He, 2025).
2.6 Review of research
Research on green development at the macro level provides a research direction for this article to explore the impact mechanism of new energy vehicles on green development. At the city level, the existing studies on green development have explored in detail the influencing factors of urban green development, and provide a few useful ideas for the subsequent exploration of how the expansion of the new energy vehicle market affects the process of green development, and has a certain reference value for this study.
However, there are still two shortcomings in the above studies. First, studies on the impact of new energy vehicles on urban green development have mainly focused on individual cities, but few scholars have compared different types of cities to explore the heterogeneity of the impact of new energy vehicle promotion on green development. Second, few studies have explored the mechanism of the impact of new energy vehicles on green development at the city level, and even if a few scholars have conducted studies on the mechanism, their studies are still lack of empirical tests which can support their conclusions. The possible innovations of this paper are: First, this article conducts an empirical analysis of the mechanism by which the market expansion of new energy vehicles impacts green development at the urban level, including three major intermediary mechanisms (green technology, energy structure and industrial transformation) and the regulatory effect mechanism of the population. Second, this article breaks the previous research trend of conducting case studies on individual cities regarding new energy vehicles and urban green development, and introduces the DID policy model to analyze the heterogeneity of the green effects of new energy vehicles in different cities.
3 Impact mechanisms and research hypotheses
3.1 Green technology and urban green development
Existing research generally believes that technological innovation is a key driving force for urban green development. Cheng et al. (2024) pointed out that technological innovation can significantly improve urban environmental quality through industrial upgrading and energy efficiency enhancement. In addition, under the influence of policy promotion and market demand, innovation in renewable energy patents not only improves technology levels but also promotes the diffusion of green technology in cities (Huang et al., 2023). Building on this literature, we assume that exploring how the expansion of the NEV market promotes technological innovation, thereby enhancing the level of green development in cities.
At present, the Chinese government is ardently championing the low-carbon economy, with energy technologies and emission-reduction innovations at the core of this transition. The fundamental tenets of a low-carbon economy—encompassing technological innovation, industrial system reform, and a paradigm shift in sustainable development—position the promotion of NEVs as a crucial element in the realization of national low-carbon objectives. As the NEV market expands, it not only generates demand for vehicles but also drives technological advancements in NEV-related industries. This demand propels the development of green technologies, most notably in energy storage systems, which significantly enhance the efficiency and sustainability of urban energy consumption.
Simultaneously, these technological innovations contribute to the restructuring of urban industrial ecosystems. In the contemporary economic landscape, cities are increasingly focused on cultivating technological systems that underpin industrial development. NEVs, as pivotal drivers of green technologies such as energy storage, play a crucial role in reshaping urban industrial frameworks. This transformation occurs through three distinct mechanisms.
3.1.1 Technological innovation and industrial upgrading
According to Xu et al. (2021), the accelerated pace of technological innovation, particularly in green technologies, is a powerful catalyst for industrial upgrading. Green technological advancements stimulate heightened consumer demand for sustainable products and services, thereby attracting investment and boosting the development of emerging green industries. The NEV market expansion is similarly fostering the growth of key green technologies, such as energy storage, and catalyzing greater investment in clean industries, including battery production. This infusion of resident and innovation further refines the structure of urban industries, steering them toward more sustainable practices.
3.1.2 Technological innovation and digital transformation of urban industries
The digitization of industries is a critical driver of green economic development. As digital technologies facilitate green transformation, they improve the overall efficiency of urban systems. New energy vehicles, emblematic of this digital shift, have fueled advancements in various technologies, including electric power systems, human-computer interaction, and autonomous driving. By stimulating innovation across these domains, the NEV market accelerates the digitalization of urban industries, further promoting the green economy. In addition, government policies aimed at supporting NEVs reinforce this trajectory, enhancing the market’s ability to foster digital transformation in the transportation sector and beyond.
3.1.3 Technological innovation and environmental regulation
As green technologies mature, they often drive more stringent environmental regulations. Wen et al. (2023) argue that regions experiencing high levels of green technological innovation tend to adopt more advanced environmental regulatory frameworks. The expansion of the NEV market, by driving innovation in green technologies, indirectly contributes to the evolution of urban environmental regulations. Such advancements help eliminate inefficient, energy-intensive industries and promote the proliferation of cleaner, more sustainable industries. As environmental regulation strengthens, it facilitates the reorganization of urban industrial structures, fostering green development.
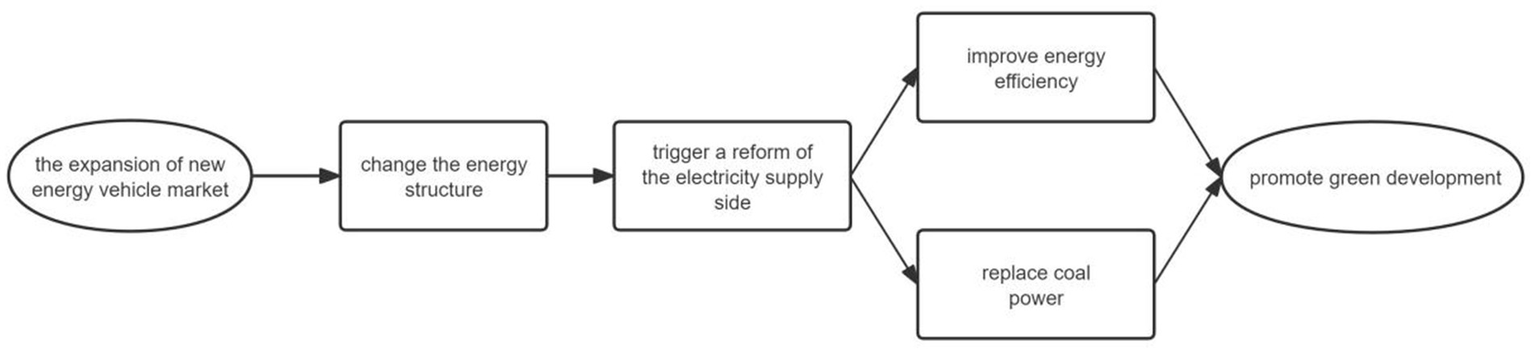
This reconfiguration of urban industries provides more space for the development of urban green industries and promotes the process of urban green development. The principle of mechanism 1 is shown in Figure 1.
Figure 1

The expansion of the new energy vehicle market promotes the urban green development by promoting green technology innovation.
Based on the mechanism 1 above, hypothesis 1 is formulated in this paper.
H1: Expansion of the new energy vehicle market scale promotes green technology innovation, which in turn improves urban green development.
3.2 Energy structure and urban green development
The change in energy structure is key for current cities to get rid of their dependence on non-renewable energy and achieve green development. In terms of energy structure mechanisms, existing literature indicates that improving the energy mix, transitioning from high-carbon sources like coal to clean energy can help reduce pollution and carbon emissions. Wang et al. (2019) demonstrated a positive correlation between green development and energy structure adjustment in China. Jiang et al. (2024) confirmed the adjustment of the energy structure driven by policies (including increased use of new and clean energy) as an important mechanism for enhancing urban green innovation and environmental performance. Therefore, this mechanism assumes that the increase in NEV sales impacts green development through its influence on the energy structure.
Externalities refer to the unintended side effects of economic activities on other agents. In the case of NEVs, the externalities are predominantly positive, as the transition from traditional fuel vehicles to electric vehicles results in lower carbon emissions, thereby reducing the negative environmental externalities traditionally associated with the transportation sector. This shift has profound implications for the sustainable development of urban environments, particularly in terms of energy structure transformation.
The large-scale deployment of NEVs has triggered significant changes in urban energy consumption patterns, sparking a systemic shift in energy production. The substitution effect — wherein electric vehicles replace traditional fossil-fuel-powered vehicles — has prompted a transition toward cleaner energy sources, accelerating the growth of the clean energy sector and facilitating the reduction of coal-based power production. In turn, this transformation in energy production helps to mitigate carbon emissions and supports the green development of urban areas.
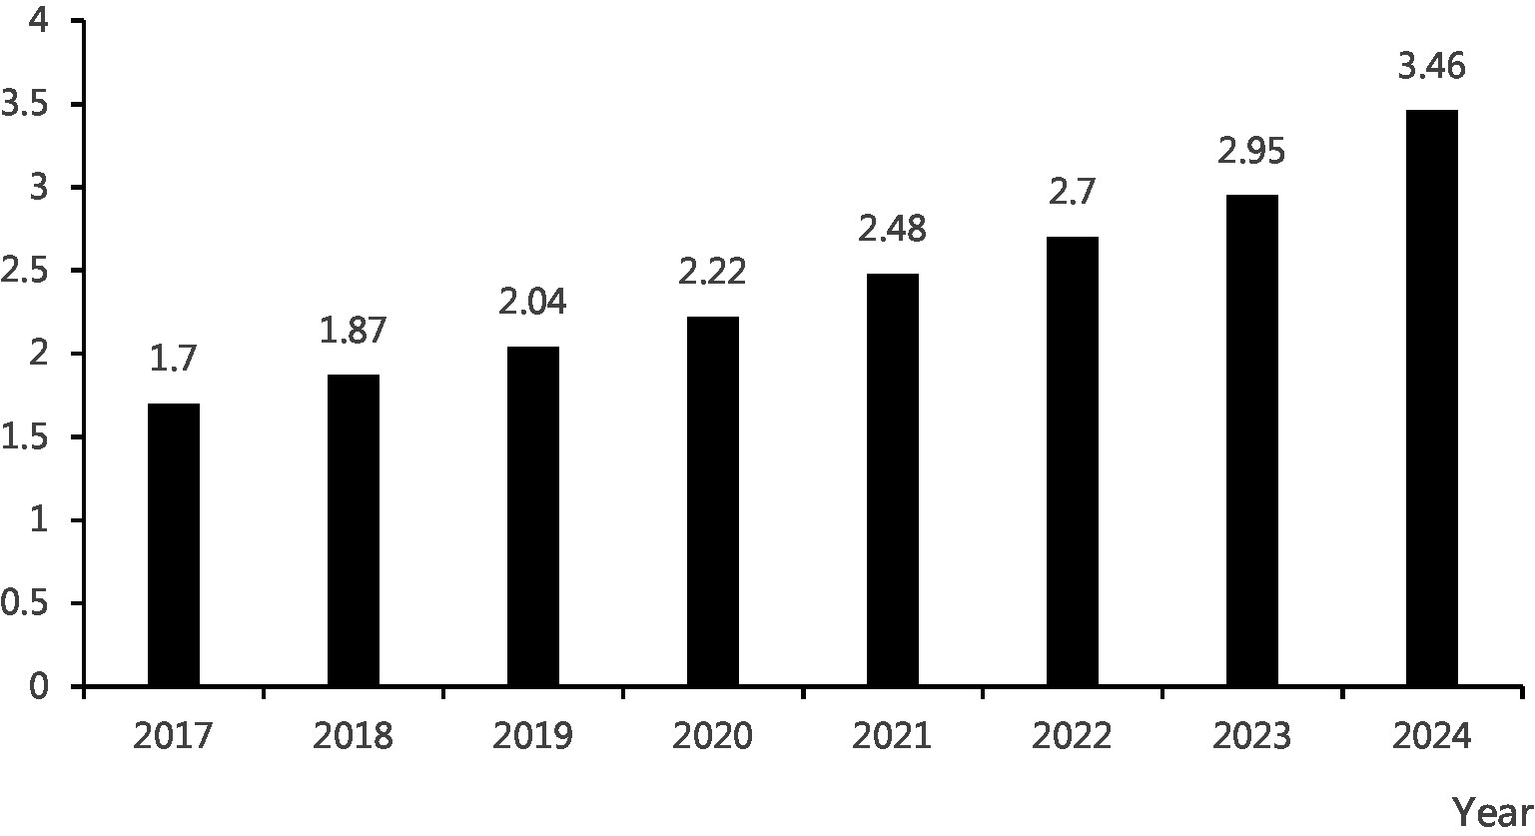
As NEVs increase electricity demand in the transportation sector, national policies aimed at promoting a low-carbon economy have created a conducive environment for the development of clean energy industries. Solar, wind, and hydroelectric energy sources are now being more widely integrated into the national power grid, helping to decarbonize the energy sector. The continued growth of renewable energy generation — which reached 3.46 trillion kilowatt-hours in 2024—is a testament to this shift, highlighting the role that NEVs play in promoting the widespread adoption of clean energy (Figure 2).
Figure 2
Renewable energy generation (trillion kWh), 2017–2024.
The development of the new energy vehicle market, while promoting the transformation of the transformation of the end-use energy structure along the urban industrial chain, also optimizes the traditional fossil energy-based power supply system and combines with a new type of power system to continuously improve the efficiency of energy use and ultimately achieve the goal of energy conservation and green development. Figure 3 illustrates mechanism 2.
Figure 3
The expansion of new energy vehicle market contributes to urban green development by promoting the green transformation of energy structure.
Based on mechanism 2, this paper proposes research hypothesis 2.
H2: Expansion of the new energy vehicle market scale can accelerate the transformation of the city's energy structure, improve the utilization rate of clean energy, and boost the city's green development.
3.3 Industrial transformation and urban green development
Industrial transformation is one of the important variables in the field of green development research. Multiple studies consider the changes in industrial structure as an important intermediary link in green development (Gao et al., 2022; Sheng et al., 2024). The process of expanding the NEV market is inevitably accompanied by the continuous development and evolution of the industries related to NEVs. Based on the above considerations, this section delves into the intermediary mechanisms by which industrial transformation promotes the green effects of the NEV market.
The expansion of the new energy vehicle market has promoted the green transformation of the upstream and downstream industrial structure and has stimulated the development of a series of clean industries, which has also made this market expansion promote the green development of cities. A series of clean energy industries such as photovoltaic and energy storage construct a new type of energy system and apply a number of information technology to form a synergistic development of clean industry clusters. This industrial transformation has led to two major systemic changes in the city’s economic system.
On the one hand, this transformation is gradually shaping the circular economy network in cities. The products brought about by the consumption of new energy vehicles, such as a large number of retired batteries, provide an opportunity for the development of circular economy industries such as battery recycling. Battery recycling involves the recycling of a variety of resources such as metal materials, which can be used in scenarios such as backup batteries and two-wheelers after the retirement of power batteries for laddering, which improves the utilization rate of resources and achieves the efficient use of resources. The development of the recycling economy industry promotes the establishment of a recycling economy network, and different resource recycling industries can use new energy vehicles as a link to realize interconnection and form a pattern of synergistic development.
On the other hand, this transformation has also gradually improved the mechanism for realizing the value of carbon assets. Emission reduction gains from infrastructure such as charging piles and power exchange stations related to new energy vehicles can be securitized to attract the participation of social capital. Carbon emissions reduced by traveling with new energy vehicles instead of traditional oil vehicles can be included in carbon credit accounts as a form of carbon asset holding. New energy vehicle companies can also offset their carbon footprint by investing in carbon reduction projects, for example, Tesla’s sale of carbon credits has yielded a cumulative income of US$9 billion, suggesting that carbon assets can have a real value equivalent to money. The green transformation of the city’s industrial structure promotes the improvement of the carbon asset pricing system, and companies have an incentive to reduce carbon emissions in exchange for carbon assets in the form of carbon credits, creating a virtuous cycle.
These two major changes are formed based on the mutual coordination and information sharing of industrial elements in the city, and bring about an increase in the level of green development of the city. The principle of mechanism 3 is shown in Figure 4.
Figure 4
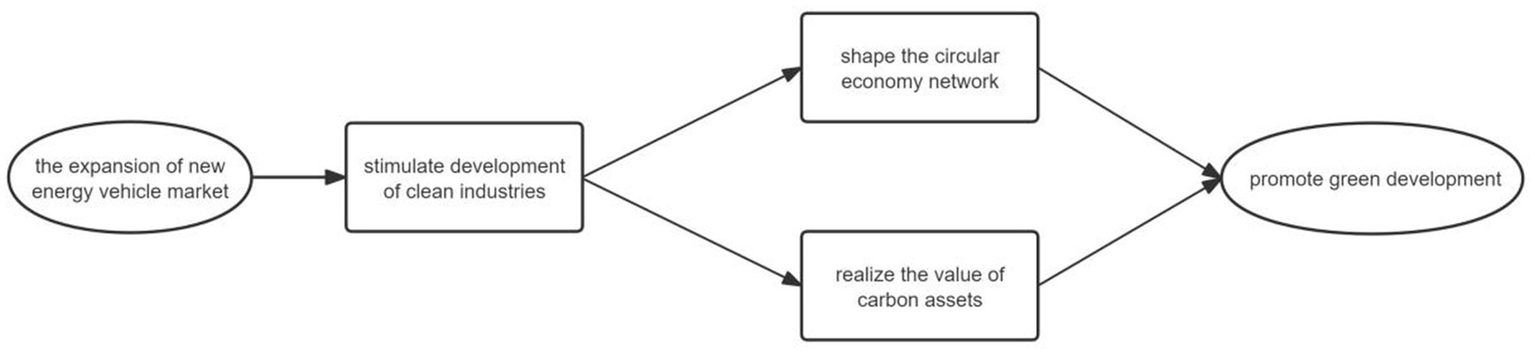
The new energy vehicle promotion enables urban green development by pulling the clean industry development from upstream and downstream.
Based on the mechanism 3, we propose the third hypothesis of the study.
H3: The expansion of the market scale of new energy vehicles drives the structural transformation of upstream and downstream industries, and pulls the development of urban cleaning industry to improve the level of urban green development.
3.4 Market scale, population density and urban green development
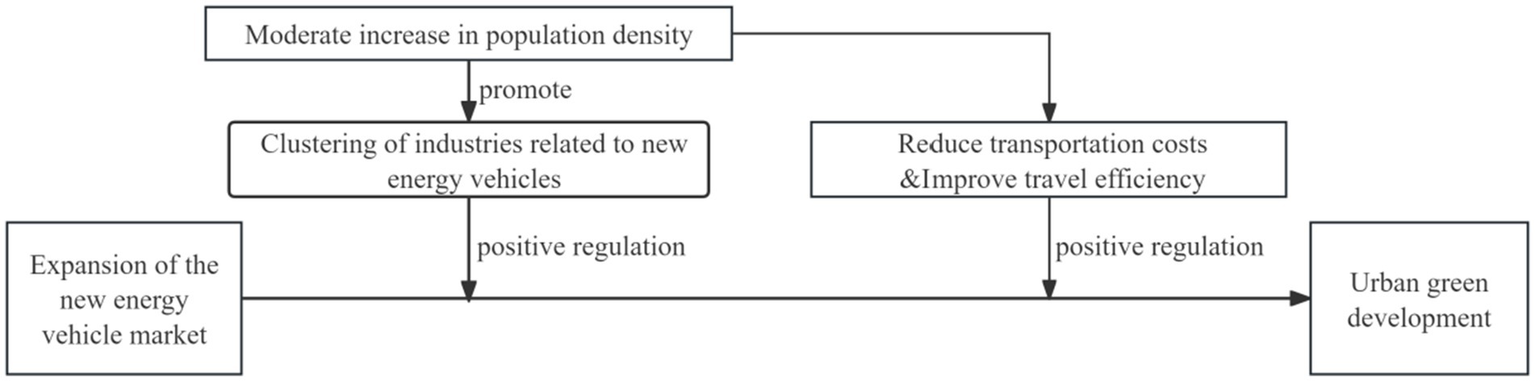
In the process of the development of the new energy vehicle market, the expansion of the market scale has a positive promotional effect on the improvement of urban green development levels. Furthermore, this promotional effect is strengthened by the increase in urban population density, primarily due to the following two reasons.
First, a moderate increase in population density is conducive to the clustering of new energy vehicles and related green industries. Wu (2025) uses urban population density as an indicator of green development, arguing that it is a moderate indicator. Cities with low population density lack economic vitality, but excessively high population density is detrimental to resource conservation. Zhang and Mu (2017) proposed the concept of “green population density,” suggesting that there exists an optimal population density level where the material, health, and environmental conditions of the population can be maximally aligned with ecological sustainability. Within this limit, an appropriate increase in population density provides labor support for urban industrial agglomeration, which also benefits the development of new energy vehicles and related green industries, thereby strengthening the role of new energy vehicle market expansion in promoting green development.
Second, an increase in population density has a positive impact on urban transportation costs and travel efficiency. Research by Wang and Zhao (2025) indicates that an appropriate increase in population density has an inhibitory effect on transportation carbon emissions. As population density increases, the unit distance travel cost per vehicle decreases, scale economies increase, and the relative cost of long-distance travel per capita decreases, which is beneficial to the profits of new energy vehicle companies. Additionally, higher population density leads to denser road networks, thereby improving travel efficiency, which has a positive impact on the green development of the transportation sector and cities. Xu et al. (2022) found that the population density that maximizes overall satisfaction with urban ecological livability is approximately 1.5–2.0 million people per square kilometer, while the current population density of most Chinese cities is below this value. Therefore, further increases in population density will continue to enhance urban ecological livability and residents’ travel efficiency, playing a positive role in fostering the NEV market and improving the level of urban green development.
Population density plays a crucial regulatory role in driving the expansion of the new energy vehicle market and promoting green development in the transportation sector and cities. In cities with higher population densities, the expansion of the new energy vehicle market enhances the effects of urban green development. The mechanism is illustrated in Figure 5.
Figure 5
The regulatory effect of population density.
Based on Mechanism 4, this paper proposes Hypothesis 4.
H4: An increase in urban population density has a significant positive moderating effect on the expansion of the new energy vehicle market and the promotion of green urban development.
4 Research design
4.1 Data sources
New energy vehicle sales volume (thousand units) data is sourced from the China Association of Automobile Manufacturers (CAAM). City new energy patent counts (hundred units) data is sourced from the National Intellectual Property Administration. City clean energy share (%) data is sourced from the National Energy Administration. City population density (thousand people per square kilometer) data is collected through annual economic statistics reports from the National Bureau of Statistics and local statistics bureaus. For control variables, human resident data is sourced from the annual GDP growth rate (%) and sulfur dioxide emissions per unit of GDP (kilograms per ten thousand yuan), which are obtained from annual city statistical yearbooks and the China Environmental Statistics Yearbook. All data is panel data for 299 prefecture-level and above cities (excluding Hong Kong, Macao, and Taiwan due to data availability) from 2008 to 2024.
4.2 Selection of variables
4.2.1 Explained variable
This paper uses the level of urban green development as the dependent variable. Considering the rationality of the indicators, the availability of data, and the reliability of data sources, this paper selects the Urban Green Development Level Index (Green) as the quantitative indicator. This index is derived from data regularly published by Peking University based on its green development level evaluation indicator system. The indicator system covers aspects such as environmental quality, energy efficiency, ecological protection and construction, pollution control, and green industry development, providing a comprehensive representation of a city’s green development level. The specific method for obtaining the data is the use of web crawling algorithms. The official indicator system is shown in Table 1, which comprises six primary indicators (resource utilization, environmental governance, environmental quality, ecological protection, quality of growth, and green living) and 55 secondary indicators. Using these indicators to construct a green development index is sufficient to reflect the overall situation of green development in a region.
Table 1
| Primary indicator | Secondary indicators |
|---|---|
| Resource utilization | The indicators under resource utilization include: the energy consumption per unit of GDP/carbon dioxide emissions per unit of GDP/water consumption per unit of industrial added value/coal consumption per unit of industrial added value/total utilization of water resources per unit/degraded arable land rate of arable land quality level. |
| Environmental governance | The indicators under environmental governance include: the pass rate of industrial wastewater discharge pollution control/the comprehensive utilization rate of solid waste/the harmless treatment rate of urban domestic waste/sewage treatment rate/the intensity of investment in air pollution control/the ratio of pollution prevention and control investment to regional GDP, etc. |
| Environmental quality | The indicators under environmental quality include, but are not limited to: the concentration of 7 major pollutants (such as PM2.5, SO₂, NO₂, etc.), the proportion of surface water reaching or better than Class III, the ratio of days with good air quality, and the status of soil pollution monitoring. |
| Ecological protection | The indicators under ecological protection include: tree cover rate/forest cover rate/wetland area ratio/natural shoreline retention rate/protected ecological area size/safe utilization rate of contaminated arable land, etc. |
| Quality of growth | Economic structure adjustment indicators such as the proportion of the tertiary industry/the proportion of high-tech industry added value/the intensity of industrial waste emissions/per capita GDP growth rate/per capita income growth, etc. |
| Green living | The indicators under green living include: several indicators related to the quality of life environment for residents, such as the coverage rate of rural tap water/the coverage rate of rural sanitary toilets/the green space rate in urban built-up areas/the proportion of green buildings in new constructions/per capita volume of public transport. |
Green development level evaluation indicator system.
4.2.2 Explanatory variable
The explanatory variable in this paper is the size of the new energy vehicle market, which is quantified using new energy vehicle sales volume (Sale). New energy vehicle sales volume is a direct and effective indicator for measuring the size of a city’s new energy vehicle market. Several researchers, including Li et al. (2022), have adopted this indicator as a substitute for the size of the new energy vehicle market, primarily because it directly reflects consumer demand and acceptance of new energy vehicles. By observing changes in new energy vehicle sales volume, one can effectively judge the development trend of the market.
4.2.3 Regulatory variable
Based on the analysis in Section 3.4, this paper sets the moderating variable as urban population density (Popden), which is the ratio of the permanent population of each city to its area. Setting this moderating variable will help to verify H4 in the subsequent model construction.
4.2.4 Control variables
This paper requires the selection of additional factors, beyond explanatory variables, that may influence green development levels to be included as control variables in the model. Lv and Ding (2024) argue that human capital inhibits the positive impact of manufacturing agglomeration on green development efficiency, potentially due to the crowding effect of human capital growth outweighing its agglomeration effect, thereby potentially exerting a negative influence on green development levels; GDP growth, especially the growth of green industry GDP, also plays an important role in urban green development; furthermore, urban green development is the result of the integration of the two major development concepts of economic civilization and ecological civilization. Therefore, when examining the level of urban green development, it is necessary to consider the environmental pressure caused by GDP growth, as the environmental pollution caused per unit of GDP is another key factor constraining urban green development.
Therefore, this study references the research of Guo et al. (2020) and selects human capital (Humcap), performance evaluation (Pevalu), and environmental pressure (Epres) as control variables in the model. Among these, human capital is measured by the average years of education for the population aged 6 and above, performance evaluation is measured by the annual GDP growth rate of the city, and environmental pressure is measured by the ratio of sulfur dioxide emissions to GDP.
4.2.5 Mediating variables
The mediating variables in this paper are green technology variables, energy structure variables and industrial transformation variables. Three indicators, namely the number of urban new energy patents (Patent), the proportion of urban clean energy to total energy consumption (Energy) and the urban green economy index (Economy), are chosen to quantify the above mediating variables, respectively. The reasons are as follows:
The number of new energy patents in a city can reflect the development of new energy technology in the city to a certain extent, and more new energy patents in the city indicate that talents engaged in the new energy industry are more concentrated in the city on the one hand, and on the other hand, it indicates that the city holds more rights to new energy technology, which is conducive to the development of new energy technology. Based on the above considerations and with reference to the study of Xu and Zhao (2019), this paper takes the number of new energy patents in the city as a mediating variable to measure new energy technology innovation.
The ratio of clean energy in a city directly reflects the energy structure of the city. The larger the proportion of clean energy in the total energy consumption of a city, the higher the degree of green transformation of the energy structure; the city’s green economy index is measured by the green economy index system released by Peking University, which includes indicators related to the city’s green GDP and green industry, and this index can measure the level of development of the city’s clean industry.
4.3 Model construction
In this paper, all the standard errors of the reports are clustered at the province level to account for intra-province correlation. The selection of this clustering hierarchy is mainly based on the following considerations: Firstly, provincial-level economic policies, industrial layouts, and environmental governance policies often simultaneously affect multiple cities within the province. Subsidies for the promotion of new energy vehicles and policies for energy structure adjustment are uniformly formulated at the provincial or central level. Secondly, cities within the same province are geographically, economically, and socially closer, which may result in spatial correlation of the error term. Based on the above reasons and other studies (Bertrand et al., 2004; Cameron and Miller, 2015), we set province level as the clustering hierarchy and assume that the error terms between different provinces are relatively independent. In all subsequent empirical reports, the standard errors are reported at this clustering level.
4.3.1 Benchmark regression model
The baseline regression equation for this paper is Equation 1:
where t denotes the year, i denotes the city, t = 2008, …, 2024, i = 1, …, 299; Greenit represents the green development level of city i in year t; Saleit represents the sales volume of new energy vehicles in city i in year t; Zit represents the set of control variables; μi denotes the individual fixed effect; λt denotes the time fixed effect; β0 denotes the constant term; β1 and β2 denotes the regression coefficient; εit denotes the random error term.
4.3.2 Moderation effect model
According to the theoretical analysis in Section 3.4, population density acts as a moderating variable in the process of promoting urban green development as the market size of new energy vehicles in cities expands. This paper adopts the method of mechanism analysis proposed by Li J. et al. (2025) to construct a moderation effect model by adding interaction terms to the baseline regression model, and the moderation effect model is shown as Equation 2:
where is the population density of city i in year t; is the interaction term between new energy vehicle sales volume and urban population density; is the regression coefficient of the interaction term, and the rest are the same as the benchmark regression model.
4.3.3 Models of mediating effects
Based on the mediation mechanisms analyzed in Sections 3.1–3.3, green technology, energy structure, and industrial transformation may serve as key drivers propelling urban green development through the expansion of the new energy vehicle market, acting as parallel mediators. Drawing on the theoretical framework for multiple mediation of Hayes (2017), this study employs the mediating variables identified in Section 4.2.5 to construct the following mediation effect models shown as Equations 3–6:
In this mediation model, the mediation effects of variables Patent, Energy, and economy are α1σ2, ξ1σ3, and τ1σ4 respectively, with a total mediation effect of α1σ2 + ξ1σ3 + τ1σ4.
5 Empirical findings and analysis
5.1 Baseline regression results and analysis
Based on the benchmark regression results, the main effect of the expansion of the new energy vehicle market on urban green development can be determined, and the moderating role of population density can be further explored. The benchmark regression results are shown in Table 2, where the dependent variable is the level of urban green development. Column (1) does not include Zit, while Column (2) includes it. In both Column (1) and Column (2), the regression coefficients of the core explanatory variable Sale are significantly positive at the 1% level, indicating that new energy vehicle sales volume is significantly positively correlated with the level of urban green development at the 1% level. Additionally, the adjusted R2 in Column (2) is greater than that in Column (1), indicating that the regression model incorporating control variables has a stronger explanatory power for reality than the model without control variables, meaning that the set of control variables effectively explains the improvement in the level of urban green development.
Table 2
| Variable | (1) Green |
(2) Green |
|---|---|---|
| Sale | 0.3397*** (0.0048) |
0.2500*** (0.0064) |
| 0.0108*** (0.0005) |
||
| Cons | 55.9558*** (0.1216) |
54.4498*** (0.1652) |
| Observation | 5,083 | 5,083 |
| Adj-R2 | 0.4998 | 0.5381 |
Benchmark regression results.
*, **, and *** indicate significant at the 10%, 5% and 1% levels respectively; standard errors are in parentheses.
5.2 Moderation effect
The regression results of moderation effect model are shown in Table 3. The results indicate that the regression coefficients of the core explanatory variable Sale and the interaction term Sale × Popden are both significantly positive at the 1% level. Therefore, the increase in urban population density further strengthens the main effect, and the variable Popden has a significant positive moderation effect, which validates hypothesis H4.
Table 3
| Variable | Green |
|---|---|
| Sale | 0.3173*** (0.0058) |
| Sale × Popden | 0.0074*** (0.0011) |
| 0.0107*** (0.0005) |
|
| Cons | 55.9093*** (0.1213) |
| Observation | 5,083 |
| Adj-R2 | 0.5040 |
The regulatory effect of urban population density.
***Indicates significant at the 1% level; standard errors are in parentheses.
5.3 Tests for mediating effects
To validate the three mediation mechanisms described in Sections 3.1–3.3, regression analyses were conducted on baseline model (1) and mediating models (3)–(6), with the results presented in Table 4. The results in Table 4 indicate that the regression coefficients for the three mediating variables regarding Sale are all significant. Moreover, after incorporating the mediating variables, the regression coefficient for the variable Green regarding Sale remains significant. This demonstrates that all three mediating variables exhibit significant mediating effects. Simultaneously, the regression coefficient for Sale in Column (6) is significantly positive at the 5% level, proving the direct effect is significant. This indicates that the growth in new energy vehicle sales also directly contributes to enhancing the level of urban green development to a certain extent. Thus, it can be demonstrated that the three mediating variables produce partial mediating effects between new energy vehicle sales and the level of urban green development, thereby validating hypotheses H1–H3.
Table 4
| Variable | (1) Green |
(3) Patent |
(4) Energy |
(5) Economy |
(6) Green |
|---|---|---|---|---|---|
| Sale | 8.297*** (0.121) |
1.872*** (0.038) |
0.184*** (0.007) |
0.328*** (0.005) |
6.253*** (0.170) |
| Patent | 0.045** (0.050) |
||||
| Energy | 0.746*** (0.231) |
||||
| Economy | 5.558*** (0.395) |
||||
| Cons | 109.900*** (3.082) |
−15.803*** (0.976) |
19.501*** (0.183) |
45.994*** (0.124) |
−159.598*** (19.010) |
| 0.011*** (0.001) |
0.046*** (0.001) |
0.054*** (0.001) |
0.037*** (0.001) |
0.006*** (0.001) |
|
| Observation | 5,083 | 5,083 | 5,083 | 5,083 | 5,083 |
| Adj-R2 | 0.481 | 0.320 | 0.115 | 0.472 | 0.510 |
| F | 5079.183*** | 2397.469*** | 658.754*** | 4548.404*** | 2403.475*** |
Mediated effects test.
*, **, and *** denote significance at the 10%, 5% and 1% levels respectively; standard errors are in parentheses.
Using the Bootstrap method, 500 samples were drawn from the data. The presence of mediating effects was assessed by examining the 95% confidence intervals. The 95% confidence intervals for all three mediating effects excluded zero, indicating significant indirect effects. This further validates the mediating roles of technological innovation, energy structure, and industrial transformation. Table 5 presents the magnitude of mediating effects and Bootstrap test results, while Figure 6 illustrates the mediating effects.
Table 5
| Model effect | Effect value | BootSE | 95%BootCI | Proportion | |
|---|---|---|---|---|---|
| Lower limit | Upper limit | ||||
| Total Effect | 8.297 | 0.000 | 8.296 | 8.298 | 100% |
| Direct Effect | 6.253 | 0.001 | 6.252 | 6.256 | 75.36% |
| Total indirect effect | 2.044 | 0.014 | 2.029 | 2.071 | 24.64% |
| Sale→Technology→Green | 0.084 | 0.007 | 0.077 | 0.095 | 1.01% |
| Sale→Energy→Green | 0.137 | 0.003 | 0.136 | 0.140 | 1.65% |
| Sale→Industry→Green | 1.823 | 0.014 | 1.804 | 1.829 | 21.97% |
Mediating effect sizes and Bootstrap test results.
BootSE is the standard error of the bootstrap sampling estimate; 95% BootCI is the 95% confidence interval of the bootstrap sampling.
Figure 6
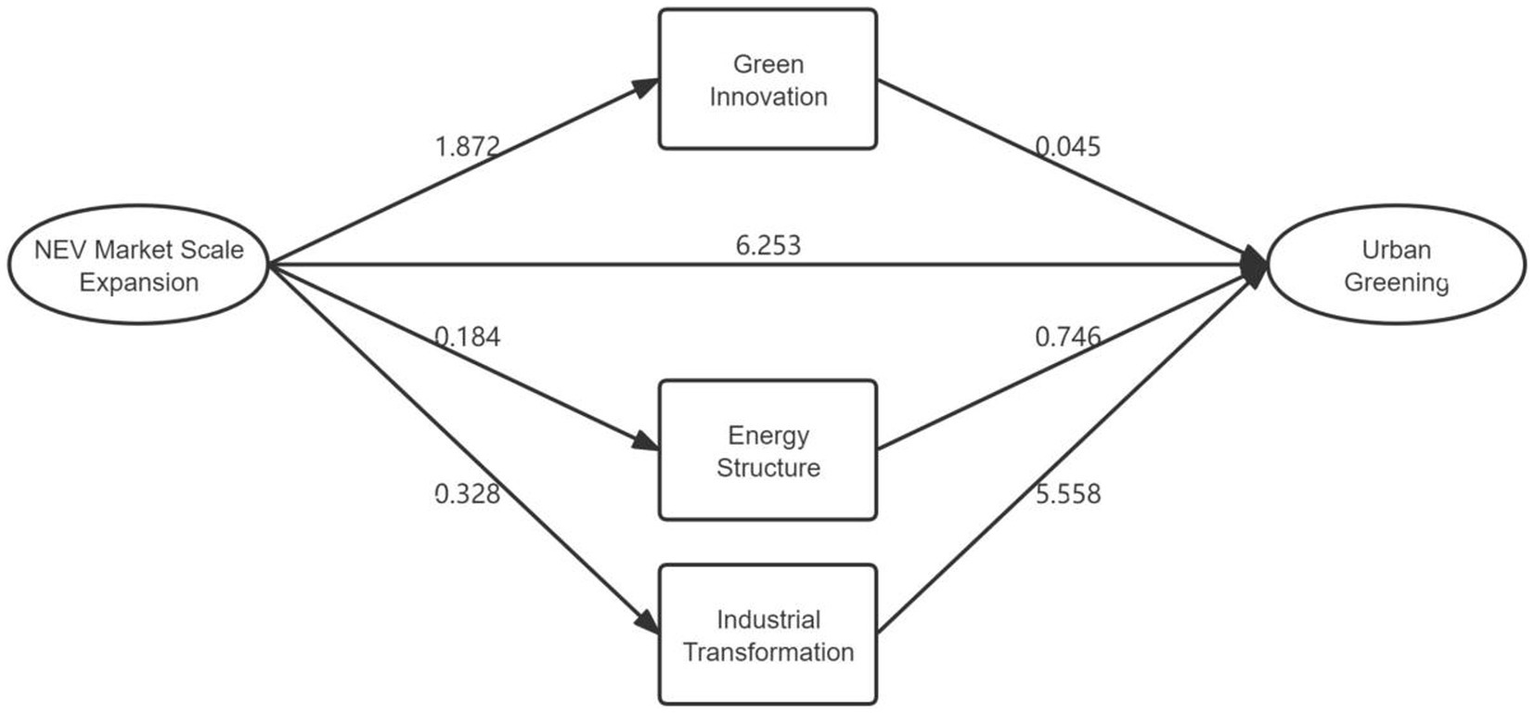
Mediating effect diagram.
5.4 Endogeneity test
Given the limitations of the data, the estimated sales volume of new energy vehicles may be subject to measurement errors. Furthermore, these measurement errors may introduce a correlation between the sales volume of new energy vehicles and other factors that influence the level of green development in cities which cannot be observed, thereby introducing endogeneity issues into the correlation coefficient of Sale.
To address this, this paper employs the instrumental variables method for endogeneity testing. The selected instrumental variables must be exogenous and indirectly influence the dependent variable Green through the explanatory variable Sale, without directly and significantly affecting Green. This paper refers to the study of Nacken et al. (2024), constructing the one-period lagged variable of the independent variable Sale as an instrumental variable and conduct the endogeneity test according to the following steps.
Firstly, we use Sale as the dependent variable and the lagged variable as the independent variable for the first stage regression, to test whether the lagged variables significantly relate to the endogenous explanatory variables as instrumental variables, the regression model is shown as Equation 7:
where Salei,t-1 represents the lagged variable of Sale in one period.
Secondly, we conduct weak instrument tests to check for the existence of weak instrument problems, and an underidentification test (Anderson LM statistic) to examine whether the instrumental variable can adequately identify the model.
Thirdly, we use the predicted value Saleit from the first phase regression instead of Sale in the second phase regression to estimate the casual effect on green development in the Equation 8:
The results of instrumental variable test is as shown in Table 6.
Table 6
| Variable | (7) OLS |
(8) IV-2SLS |
|---|---|---|
| Sale_lag | 1.0600*** (0.0011) |
|
| 0.2456*** (0.0065) |
||
| −0.0010*** (0.0001) |
0.0111*** (0.0005) |
|
| Cons | 1.2678*** (0.0223) |
54.7390*** (0.1410) |
| R 2 | 0.9972 | 0.5302 |
| City fixed effects | YES | YES |
| Year fixed effects | YES | YES |
| First stage F statistic | 930000*** (0.0000) |
|
| Stock-Yogo Weak ID Test Critical Value | 16.38 | |
| Anderson Canon. Corr. LM Statistic | 4759.410*** (0.0000) |
|
Instrumental variable test regression results.
The critical values of the Stock-Yogo weak ID test is at the 10% significance level.***Indicates significant at the 1% level; standard errors are in parentheses.
According to the results in Table 6, the first stage F statistic is 930000, which is greater than the critical value of 16.38 at the 10% level in Stock-Yogo weak ID Test, indicating that there are no weak instrument problems with the lagged variable. The Anderson LM statistic is significant at the 1% level, thus confirming that the lagged variables are effective as instrumental variables. The regression coefficients of Salei,t-1 and Saleit are both significantly positive at the 1% level, which means that after considering the potential endogeneity, we are still able to observe the effect of variable Sale on urban green development. The significance of the regression coefficients also means that we have successfully solved the issue of endogeneity and obtained a more accurate and reliable estimate.
5.5 Robustness tests
5.5.1 Change the statistical sample
This paper takes into account the significant economic and social disparities across different regions in China. The four municipalities directly under the central government (Beijing, Shanghai, Tianjin, and Chongqing) possess distinct advantages in terms of economic development, policy implementation intensity, and talent accumulation. However, the expansion of the new energy vehicle market in these cities may be influenced by policy biases, leading to potential distortions in assessing its impact on green development. Additionally, there are significant differences between coastal and inland regions, as well as between open regions (or special economic zones) and other regions. Therefore, this paper excludes samples from the four municipalities of Beijing, Tianjin, Shanghai, and Chongqing, as well as samples from prefecture-level and above cities involved in the seven special economic zones established since China’s reform and opening-up, including Shenzhen, Zhuhai, Shantou, Xiamen and all prefecture-level cities in Hainan Province.
After excluding the aforementioned samples, a benchmark regression was conducted again, and the regression results are shown in Table 7. The regression coefficient of the variable Sale remains significantly positive at the 1% level, indicating that the results of the benchmark regression are robust.
Table 7
| Variable | (1) Green |
(2) Green |
|---|---|---|
| Sale | 0.3172*** (0.0049) |
0.2329*** (0.0064) |
| 0.0104*** (0.0005) |
||
| Cons | 56.1782*** (0.1201) |
54.7621*** (0.1625) |
| Observations | 4,879 | 4,879 |
| Adj-R2 | 0.4582 | 0.5001 |
Regression results after removing special samples.
***Indicates significant at the 1% level; standard errors are in parentheses.
5.5.2 Trim outliers
To avoid the impact of outliers on the regression results, this paper performed tail trimming on the explanatory variables and dependent variables at the upper and lower 2% levels, and conducted regression analysis using the processed data. The benchmark regression results after processing are shown in Table 8. The results in Table 6 indicate that the significance of the regression coefficient for the variable Sale is the same as that in Table 2 of Section 5.1, and the model passes the robustness test.
Table 8
| Variable | (1) Green |
(2) Green |
|---|---|---|
| Sale | 0.3378*** (0.0052) |
0.2384*** (0.0068) |
| 0.0109*** (0.0005) |
||
| Cons | 56.0101*** (0.1250) |
54.7722*** (0.1618) |
| Observations | 5,083 | 5,083 |
| Adj-R2 | 0.4535 | 0.4999 |
Regression results after tail trimming.
***Indicates significant at the 1% level; standard errors are in parentheses.
The regression results after trimming indicate that the benchmark regression model is robust. Even after removing individual outliers that are unusually high or low, the expansion of the new energy vehicle market still has a significant positive effect on a city’s green development.
5.5.3 Substitute explanatory variable
The production volume of new energy vehicles reflects the supply chain and production capacity of the new energy vehicle market, and to some extent indicates the scale of the local new energy vehicle market. A regression analysis was conducted using the natural logarithm (lnSupply) of new energy vehicle production volume, as published by the Ministry of Industry and Information Technology, to replace the explanatory variable Sale. The regression results are shown in Table 9. In Table 9, the regression coefficient of the variable lnSupply is significantly the same as the coefficient of Sale in Table 1. The benchmark regression model passed the robustness test by replacing the explanatory variable, further validating the benchmark regression results.
Table 9
| Variable | (1) Green |
(2) Green |
|---|---|---|
| lnSupply | 2.2455*** (0.3146) |
1.4045*** (0.2349) |
| 0.0301*** (0.0021) |
||
| Cons | 51.9519*** (3.0866) |
44.2102*** (2.3951) |
| Observations | 5,083 | 5,083 |
| Adj-R2 | 0.1843 | 0.5788 |
Regression results for replacement explanatory variables.
***Indicates significant at the 1% level; standard errors are in parentheses.
6 Heterogeneity analysis-based on DID policy effects modeling
NEV promotion policy is an important factor influencing the development of the NEV market. Cities with NEV subsidy policies tend to have a better market environment for new energy vehicles, which is conducive to market expansion. Therefore, there may be heterogeneity in the development of the NEV market between cities piloting subsidy policies and other cities.
6.1 Description of selected policies and sources
To ensure a sufficient policy observation period before and after (for conducting event studies and parallel trend tests), this study sets the policy breakpoint to 2016, corresponding to the phased policies (financial and ministerial documents) released by the central government regarding the purchase and promotion of financial subsidies and supporting measures for new energy vehicles in 2015, which were implemented in 2016. The main policy basis and reference materials include: the financial support plan for the promotion of NEVs issued by the central government and relevant ministries in 2015 (covering the implementation arrangements for the years 2016–2020), as well as the adjustment documents for subsidies and technical requirements issued in 2016. There are two reasons for selecting 2016 as the breakpoint: first, this period marks the institutional implementation of national subsidies and supporting policies, and second, the NEV market entered a rapid expansion phase after 2016, which is conducive to identifying long-term dynamic effects in event studies. The paper will define 2016 and the subsequent years as post-treatment.
6.2 Treatment/control group and DID basic model setting
The treatment group in this paper includes cities that actively implemented local vehicle purchase subsidies or were listed as demonstration or pilot cities for the promotion of NEVs and implemented supporting measures during the period of 2015–2016. We initially identified the treatment group sample as 31 cities with earlier implementation or strong policy intensity. Correspondingly, the control group consists of a collection of cities that had not implemented local car purchase subsidies before 2016 and were not included in the demonstration programs.
The DID model is used to test whether the pilot new energy vehicle promotion policy promotes the improvement of urban green development level, and the regression model is constructed in Equation 9:
where Treati are handling group city dummy variables and take 1 if city i belongs to the treatment group, otherwise take 0; Postt are policy time-point dummy variables and take 1 if t ≥ 2016, otherwise take 0; β is the average treatment effect (ATE). The results of regression is reported in Table 10.
Table 10
| Variable | Green |
|---|---|
| Treat × Post | 8.2435*** (0.3753) |
| 0.0215*** (0.0005) |
|
| Cons | 56.3616*** (0.1425) |
| City fixed effects | YES |
| Year fixed effects | YES |
| Adj-R2 | 0.4491 |
NEV policy effects (DID).
*, **, and *** indicate significant at the 10%, 5%, and 1% levels, respectively; standard errors are in parentheses.
The coefficient on Treat × Post is positive and significant at the 1% level (ATE = 8.2435), which means the green development level of the treatment group significantly increased by an average of 8.2435 units after the implementation of the policy.
6.3 Parallel trend test
The parallel trend assumption is an important assumption of the DID model, and in order to conduct the parallel trend test, we estimate dynamic coefficients using an event study approach:
In the Equation 10, Postt+k are the processed time point dummy variables(k of the processing year is 0, years before processing are negative and years after processing are positive), t0=2016 is the policy break-point year; take k = −5, −4, …, 5 as the event window and choose k = 0 as the base period. The results of parallel trend test are shown in Figure 7.
Figure 7
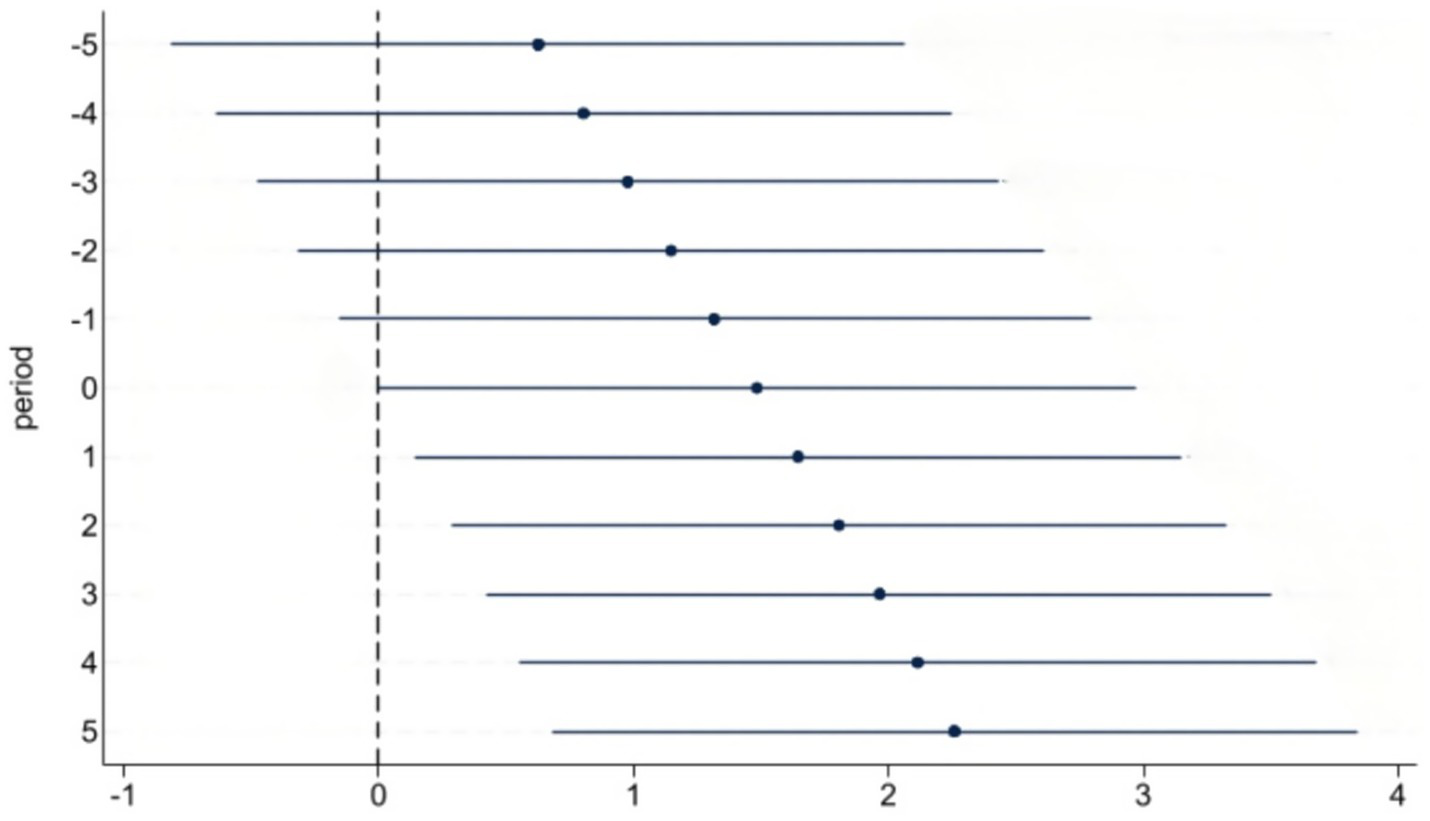
Parallel trend test results.
Figure 7 shows that before the implementation of the policy (when the period values are negative), the regression coefficients of the time dummy variables are not significant, indicating that there is no significant difference in the level of green development between the treatment group and the control group before the policy intervention. Therefore, the parallel trend assumption is validated.
6.4 Preference score matching and robustness analysis
To address potential selection bias between demonstration cities and non-demonstration cities, we employed a Propensity Score Matching (PSM) approach before re-estimating the impact of NEV sales on urban green development. After matching, the treatment and control groups exhibited comparable co-variate distributions, thereby mitigating concerns regarding systematic differences across cities prior to policy implementation. Table 11 reports the PSM-DID regression results.
Table 11
| Variable | Green |
|---|---|
| Sale | 0.0803*** (0.0042) |
| Treat × Sale | 0.0429*** (0.0037) |
| 0.0022*** (0.0003) |
|
| Cons | 56.0551*** (0.2996) |
| City fixed effects | YES |
| Year fixed effects | YES |
PSM-DID regression results.
*, **, and *** indicate significant at the 10%, 5% and 1% levels respectively; standard errors are in parentheses.
The coefficient on Sale is significantly positive at 1% level, indicating that an increase in NEV sales is strongly associated with improvements in urban green development. Moreover, the interaction term Treat × Sale remains positive and statistically significant at 1% level even after matching, suggesting that the marginal effect of NEV sales on green development is significantly larger in demonstration cities than in non-demonstration cities. Taken together, these findings confirm that our main results are not driven by sample selection bias and remain robust after controlling for pre-treatment heterogeneity.
6.5 Subgroup heterogeneity regression and analysis
Compared to western Chinese cities, the central and eastern regions of China have a higher population density, a relatively well-developed automotive industry structure, and are more attractive for talent inflow, thus demonstrating stronger capabilities in green technology innovation. Based on these considerations and results of mediating effects, this paper refers to the approach of Lan and Wang (2025), grouping the regression by region (East, Central, and West). The results are shown in Table 12. The results in Table 12 indicate that the expansion of the NEV market has a significant promoting effect on the level of urban green development in the three regions. However, in the western region, this promoting effect is relatively weak, possibly due to the lower population density in the west, which results in insufficient positive regulatory effects. The Treat × Sale variables are significantly positive at 1% level in all region groups, indicating that the NEV subsidy policy has a positive effect on the coordinated green development of various regions.
Table 12
| Variable | Green | ||
|---|---|---|---|
| West | Central | East | |
| Sale | 0.0206** (0.0081) |
0.0654*** (0.0096) |
0.1146*** (0.0057) |
| Treat × Sale | 0.0726*** (0.0071) |
0.0818*** (0.0073) |
0.0158*** (0.0053) |
| 0.0005*** (0.0005) |
0.0072*** (0.0005) |
0.0007* (0.0004) |
|
| Cons | 56.4400*** (0.2875) |
58.3895*** (0.3248) |
58.1808*** (0.3299) |
| City fixed effects | YES | YES | YES |
| Year fixed effects | YES | YES | YES |
| Observation | 1,581 | 1,360 | 2,142 |
| Adj-R2 | 0.9717 | 0.9740 | 0.9798 |
Group regression results (West/Central/East).
*, **, and *** indicate significant at the 10%, 5%, and 1% levels, respectively; standard errors are in parentheses.
7 Conclusions and policy recommendations
7.1 Conclusion
This study investigates the impact of the expansion of the new energy vehicle (NEV) market on urban green development, with a particular focus on the underlying mechanisms that drive this transformation. Through empirical analysis, we arrive at the following conclusions:
First, the expansion of the NEV market has a demonstrably positive effect on urban green development. This relationship is significantly enhanced by the moderating role of urban population density, which amplifies the impact of NEV market growth on green urban transformation. Higher population density amplifies market dynamics and concentrates technological resources, accelerating green-industry growth.
Second, as the NEV market expands, it contributes to a transformative shift in the energy structure of cities. The growing adoption of electric vehicles (NEVs) results in a reduced reliance on traditional fossil fuels, which, in turn, promotes the use of clean energy sources. This transition leads to lower carbon emissions in urban transportation systems, contributing to the broader goals of urban sustainability and green development.
Third, the NEV market fosters significant technological advancements, particularly in areas such as energy storage and electric power systems. These innovations facilitate the optimization of urban energy consumption and promote industrial upgrades. Furthermore, the NEV market stimulates the development of green technologies, which helps to green the industrial ecosystem and optimize urban industrial structures.
Fourth, the expansion of the NEV market has induced a green transformation in both upstream and downstream industries, which has had a profound impact on the urban economy. In particular, the growth of clean energy industries, such as solar and wind power, has led to the formation of industry clusters that support sustainable development. Additionally, the establishment of carbon asset markets, where emissions reductions can be traded, has created new opportunities for cities to capitalize on their green initiatives.
Last but not least, the implementation of policies promoting the adoption of NEVs has proven to be effective in advancing urban green development. Cities that have adopted subsidy policies for NEVs have experienced a marked increase in the expansion of the NEV market, leading to significant improvements in urban green development levels.
7.2 Policy recommendations
In light of the findings in 7.1, we propose the following policy recommendations to further promote urban green development in China:
7.2.1 Strengthen the technological innovation ecosystem
To sustain the momentum of green development, it is crucial to enhance the technological innovation system that supports NEVs. This can be achieved by increasing investment in research and development (R&D), especially in core technologies such as power batteries and solid-state electrolytes. Establishing special funds for R&D and fostering collaborative partnerships between industry players and research institutions will expedite technological breakthroughs, such as improvements in battery performance, safety, and energy density. Moreover, promoting the integration of NEVs with intelligent technologies, such as autonomous driving and the Internet of Things (IoT), will elevate the user experience and expand the functionality of these vehicles. Additionally, the government should focus on optimizing the path for technology spillovers, encouraging the industrialization of emerging technologies like the sustainable reuse of retired batteries.
7.2.2 Accelerate the transformation of energy structures
To fully capitalize on the benefits of NEVs, the government should expedite the transformation of the urban energy structure. This includes supporting the development of a smart energy network that can accommodate the increased demand for electricity driven by NEVs. Policymakers should encourage the construction of distributed photovoltaic and energy storage facilities, as well as improve the technical standards for vehicle-grid interaction. Additionally, providing tariff incentives for clean energy technologies will further incentivize the shift toward renewable energy sources, reducing the carbon footprint of urban energy consumption.
7.2.3 Foster the green transformation of industry chains
The government should focus on developing a low-carbon, circular industrial chain that spans the entire life cycle of NEVs. This includes establishing systems for recycling power batteries and encouraging the integration of new energy vehicles with other clean energy sectors, such as solar, wind, and hydrogen. Implementing extended producer responsibility (EPR) schemes for battery recycling and offering tax incentives for companies in the renewable resources sector will help promote a sustainable circular economy. Furthermore, promoting cross-industry collaboration will create synergies that enhance the development of green industry clusters, contributing to urban green development.
7.2.4 Incorporate carbon assets into the green economy
The creation of a carbon asset market linked to the NEV sector should be encouraged to provide financial incentives for emission reductions. By integrating carbon credits into the broader urban economy, cities can benefit from the reduction of carbon emissions resulting from the adoption of NEVs. Additionally, the government should establish a carbon trading platform where the reduction of emissions from transportation and energy consumption can be traded. This will further promote the green transformation of urban industries and provide an avenue for private-sector investment in green projects.
7.2.5 Policy support for new energy vehicle adoption
Building on the success of existing subsidy policies for NEVs, it is essential for the government to continue supporting the expansion of the NEV market. Policies should focus on increasing the affordability and accessibility of NEVs for both consumers and businesses, particularly in smaller cities and rural areas. Additionally, creating incentive programs that reward cities for achieving specific green development milestones will encourage local governments to prioritize sustainable urban development.
By implementing these policies, China can accelerate its transition to a green economy, harnessing the potential of new energy vehicles to drive sustainable urban development and reduce the environmental impact of transportation. These efforts will not only help achieve the nation’s carbon neutrality goals but also improve the quality of life for urban residents through cleaner air, reduced congestion, and more efficient use of resources.
Statements
Data availability statement
Publicly available datasets were analyzed in this study. This data can be found here: http://www.stats.gov.cn/tjsj/ndsj/, https://navi.cnki.net/knavi/yearbooks/YZLCX, https://navi.cnki.net/knavi/yearbooks/YCXME, and https://www.miit.gov.cn/.
Author contributions
YD: Writing – review & editing, Supervision. JZ: Writing – original draft.
Funding
The author(s) declare that financial support was received for the research and/or publication of this article. This research was funded by Major Project of the National Philosophy and Social Science Fund of China: Statistical Monitoring, Early Warning, and Countermeasures for Food Security in China (23&ZD119).
Conflict of interest
The authors declare that the research was conducted in the absence of any commercial or financial relationships that could be construed as a potential conflict of interest.
Generative AI statement
The authors declare that no Gen AI was used in the creation of this manuscript.
Any alternative text (alt text) provided alongside figures in this article has been generated by Frontiers with the support of artificial intelligence and reasonable efforts have been made to ensure accuracy, including review by the authors wherever possible. If you identify any issues, please contact us.
Publisher’s note
All claims expressed in this article are solely those of the authors and do not necessarily represent those of their affiliated organizations, or those of the publisher, the editors and the reviewers. Any product that may be evaluated in this article, or claim that may be made by its manufacturer, is not guaranteed or endorsed by the publisher.
References
1
Bai E. Wu K. Zhu H. Zhu H. Lu Z. (2024). How does China's green credit policy affect the innovation of high-polluting enterprises? From the perspective of innovation quantity and quality. PLoS One19:e0302789. doi: 10.1371/journal.pone.0302789
2
Barman P. Dutta L. Bordoloi S. Kalita A. Buragohain P. Bharali S. et al . (2023). Renewable energy integration with electric vehicle technology: a review of the existing smart charging approaches. Renew. Sust. Energ. Rev.183:113518. doi: 10.1016/J.RSER.2023.113518
3
Bertrand M. Duflo E. Mullainathan S. (2004). How much should we trust difference s-in-differences estimates?Q. J. Econ.119, 249–275. doi: 10.1162/003355304772839588
4
Bonsu N. O. (2020). Towards a circular and low-carbon economy: insights from the transitioning to electric vehicles and net zero economy. Clean. Prod.256:120659. doi: 10.1016/j.jclepro.2020.120659
5
Bressane A. da Cunha Pinto J. P. de Castro Medeiros L. C. (2024). Urban green space disparities: implications of environmental injustice for public health. Urban For. Urban Green.99:128441. doi: 10.1016/j.ufug.2024.128441
6
Cameron C. A. Miller L. D. (2015). A practitioner’s guide to cluster-robust inference. J. Hum. Resour.50, 317–372. doi: 10.3368/jhr.50.2.317
7
Carey J. (2023). The other benefit of electric vehicles. Proc. Natl. Acad. Sci. USA120:e2220923120. doi: 10.1073/pnas.2220923120
8
Chen C. (2024). Xi Jinping's green development concept and China's environmental engineering development. Shanghai Energy Conserv.11, 1729–1735. doi: 10.13770/j.cnki.issn2095-705x.2024.11.001
9
Cheng Q. Lin A.-P. Yang M. (2025). Green innovation and firms’ financial and environmental performance: the roles of pollution prevention versus control. J. Account. Econ.79:101706. doi: 10.1016/j.jacceco.2024.101706
10
Cheng M. Wang J. Yang S. Li Q. (2024). The driving effect of technological innovation on green development: from the perspective of efficiency. Energy Policy188:114089. doi: 10.1016/j.enpol.2024.114089
11
de Oliveira U. R. Menezes R. P. Fernandes V. A. (2023). A systematic literature review on corporate sustainability: contributions, barriers, innovations and future possibilities. Environ. Dev. Sustain.26, 31–35. doi: 10.1007/S10668-023-02933-7
12
Deng S. Wu Y. (2024). Impacts of low-carbon city pilot policies on the development of green transformation in Chinese resource-based cities. China Popul. Resour. Environ.34, 65–79. Available online at: https://kns.cnki.net/kcms2/article/abstract?v=BP09Z8g3bnKHU-dB4mrFgJafGsthKQaXjMnxiRZBdjaCArO3og9h2A3-U3IOdW13sgQmXyB-05LNUfI5tix7F5dsWavGiBVV-M1GKRKK5boojmtxQvqmb4Jb1OxZi_kxiL6HsjV4g4TrWvaDsCB21A1tAV7D9HiCjaeHvGHM19m5oTVPhEoIXw==&uniplatform=NZKPT&language=CHS
13
Dong Y. Zeng F. Sun H. (2025). Research on the evaluation of Urban green transportation development level in Guangzhou under the promotion of new energy vehicles. World Electr. Veh. J.16:253. doi: 10.3390/wevj16050253
14
Dorst H. Van der Jagt A. Raven R. Runhaar H. (2019). Urban greening through nature-based solutions–key characteristics of an emerging concept. Sustain. Cities Soc.49:101620. doi: 10.1016/j.scs.2019.101620
15
Fan B. Wen Z. Qin Q. (2024). Competition and cooperation mechanism of new energy vehicle policies in China’s key regions. Humanit. Soc. Sci. Commun.11:1640. doi: 10.1057/s41599-024-04167-y
16
Feng F. Li J. Zhang F. Sun J. (2024). The impact of artificial intelligence on green innovation efficiency: moderating role of dynamic capability. Int. Rev. Econ. Financ.96:103649. doi: 10.1016/J.IREF.2024.103649
17
Feng J. Wang Y. Xi W. (2024). Does green technology transformation alleviate corpora te financial constraints? Evidence from chinese listed firms. Heliyon10:e27841. doi: 10.1016/J.HELIYON.2024.E27841
18
Gao J. Ma S. Zou H. Du H. (2023). How does population agglomerat ion influence the adoption of new energy vehicles? Evidence from 290 cities in China. Technol. Forecast. Soc. Change196:122857. doi: 10.1016/j.techfore.2023.122857
19
Gao P. Wang Y. Zou Y. Su X. Che X. Yang X. (2022). Green technology innovation and car bon emissions nexus in China: does industrial structure upgrading matter?Front. Psychol.13:951172. doi: 10.3389/fpsyg.2022.951172
20
Guo A. Zhang N. Deng J. (2020). Fiscal vertical imbalance, environmental governance and green development efficiency. Financ. Sci.12, 72–82. Available online at: https://kns.cnki.net/kcms2/article/abstract?v=BP09Z8g3bnIDnxP2NiD6xavCSBVf3_OkWNysgXuC8XEqICluQLgmspYETNVf7s9qE6Rb2hXM_fs0SlBjsQUrDGjISv9gbP9x_uNZa4uBNMYyJMkQCU9y5fy04VAHA8RlK6AOH8qmE7x9LM0oz3i9jpHivdS7dONL4_IjLvY0is6M2l4rwS6hCg==&uniplatform=NZKPT&language=CHS
21
Hanna E. Bruno D. Comín A. F. (2023). The ecosystem services supplied by urban green infrastructure depend on their naturalness, functionality and imperviousness. Urban Ecosyst.27, 187–202. doi: 10.1007/s11252-023-01442-9
22
Hayes A. F. (2017). Introduction to mediation, moderation, and conditional pro cess analysis: A regression-based approach. New York: Guilford Publications.
23
He J. (2025). The impact of energy transition policies on urban green innovation: e vidence from the new energy demonstration cities in China. Econ. Change Restruct.58:34. doi: 10.1007/s10644-025-09867-2
24
Huang Y. Cui J. Lin S. (2023). Green technology innovation under China’s new development concept: the effects of policy-push and demand-pull on renewable energy innovation. Soc. Sci. China44, 158–180. doi: 10.1080/02529203.2023.2192093
25
Huang H. Xu S. Fang K. (2025). Exploring the coupling of land development intensity and green economy development in the Pearl River Delta: patterns, challe nges, and strategic pathways. Land14:105. doi: 10.3390/land14010105
26
Jato-Espino D. Capra-Ribeiro F. Moscardo V. del Pino L. E. B. Mayor-Vitoria F. Gallardo L. O. et al . (2023). A systematic review on the ecosystem services provided by green infrastructure. Urban For. Urban Green.86:127998. doi: 10.1016/j.ufug.2023.127998
27
Jiang Y. Fan M. Fan Y. (2024). Does energy transition policy enhance urban green in novation capabilities?–a quasi-natural experiment based on China’s new energy demonstration city policy. Front. Environ. Sci.12:1377274. doi: 10.3389/fenvs.2024.1377274
28
Khan Z. R. Razak A. L. Premaratne G. (2025). Green growth and sustainability: a systematic literature review on theories, measures and future directions. Clean. Responsible Consum.17:100274. doi: 10.1016/J.CLRC.2025.100274
29
Kong M. (2024). Social responsibility and green development of Boshi home appliances continues to write the future chapter of sustainable development. Home Appliances3, 78–79. Available online at: https://kns.cnki.net/kcms2/article/abstract?v=BP09Z8g3bnIPYEMskzG7Aj8FLzRReRpegUnOUMgJ865k4hGu8PlPa1ZHNbm-Q2CUmS50TUsDKoUk5zWiYxo6-c7VLuN-3RBPmuu7EVD158GlJQ0QAGNNDmEUFHNfgJ0o_EQqJuVgBl0l3zBNfESqXQEYDgKkzj18T8I8XoQDNhghYBsscXpwgw==&uniplatform=NZKPT&language=CHS
30
Lan S. Wang J. The study on the mechanism and effect of national auditing quality on carbon emission reduction governance. Ecol. Econ., (2025),41:198–205+227. Available online at: https://kns.cnki.net/kcms2/article/abstract?v=sfGpRh49pdF4K0kfkEajQAILHAvJK3xKDo7N-YoBQ-VHbuH7rBiniIG6cV4dNgNloxaceTXQ58PeKygEsqWXuMMCa8AqM1TrmZYPaTs877Nh9hJzdEiGS9IICuqDdXuxmECTiYm36euzkXS7Rcqqe5vvg2D7t8Zh&uniplatform=NZKPT
31
Li H. (2025). Artificial intelligence, green transition and green total factor productivi ty in enterprises. Sci. Rep.15:33248. doi: 10.1038/s41598-025-18878-y
32
Li G. Cao Y. Fang C. Sun S. Qi W. Wang Z. et al . (2025a). Global urban greening and its implication for urban heat mitigation. Proc. Natl. Acad. Sci. USA122:e2417179122. doi: 10.1073/pnas.2417179122
33
Li L. Carter J. (2025). Exploring the relationship between urban green infrastr ucture connectivity, size and multifunctionality: a systematic review. Landsc. Ecol.40:61. doi: 10.1007/s10980-025-02069-1
34
Li J. Chen S. Qin P. Geng K. Wang Y . (2025). The dual impact of credit management on consumer behavior: an empirical analysis based on Haro bike license points. Manage. World41, 136–159. doi: 10.19744/j.cnki.11-1235/f.2025.0051
35
Li W. Cheng R. Garg A. Wang N. Gao L. (2024). Batteries boost the internet of everything: technologies and potential orientations in renewable energy sources, new energy vehicles, energy interconnection and transmission. Sustain. Energy Grids Netw.37:101273. doi: 10.1016/J.SEGAN.2024.101273
36
Li X. Du J. Long H. (2020). Understanding the green development behavior and performance of industrial enterprises (GDBP-IE): scale development and validation. Int. J. Environ. Res. Public Health17:1716. doi: 10.3390/ijerph17051716
37
Li G. Guo B. He T. Xu H. (2025b). Artificial intelligence and corporate green development: the role of innovation efficiency. Appl. Econ. Lett.33, 1–5. doi: 10.1080/13504851.2025.2479078
38
Li G. He T. Chen B. Wang F. (2025c). Investor attention and corporate greenwashing: evidence from China. Appl. Econ. Lett.32, 2244–2249. doi: 10.1080/13504851.2024.2332568
39
Li G. Hei B. Ma Q. Wang H. (2025d). Subjective perception of econo mic policy uncertainty and ESG performance: evidence from China. Invest. Anal. J.54, 93–109. doi: 10.1080/10293523.2024.2370665
40
Li X. Liu Y. Yang J. (2022). Technological innovation and new energy vehicle sales: an empirical test based on the “innovation-induced demand theory”. J. Dalian Univ. Technol.43, 31–41. doi: 10.19525/j.issn1008-407x.2022.04.004
41
Li Y. Xu H. Li H. Xu Y. (2025). Digital economy, environmental regulations, and green economic development. Financ. Res. Lett.75, –106858. doi: 10.1016/j.frl.2025.106858
42
Liu W. Xie T. (2025). The impact of new energy vehicle industry agglomeration on high-quality green development—evidence from China. World Electr. Veh. J.16:369. doi: 10.3390/wevj16070369
43
Liu Q. Zhao P. Yuan Y. Xu X. Zhou P . (2021). Study on the construction of urban green transportation system under the carbon neutral target--taking Jinan City as an example. Environ. Prot.49, 33–39. doi: 10.14026/j.cnki.0253-9705.2021.z2.004
44
Lv X. Ding M. (2024). Manufacturing agglomeration, human resident, an d green development efficiency: an empirical study based on 30 provinces in China. Sci. Technol. Entrep. Mon.37, 56–60. Available online at: https://kns.cnki.net/kcms2/article/abstract?v=BP09Z8g3bnK9XI1GPB_0oiAZWZgFArrIT8nT3OkQNSk8pjwHu6J4JxX0ymO3Y1zTYFgZM1fZUZd5dtlzh6H3J-PQjmmBpHVY1nXapYi6U2nJqMt4zHwR0g343oTiz2q7XY45I3d-HmqsJW4ubrQwpkS6UFE8cVrTwse0HMDcSmvwTVTGYxUT4g==&uniplatform=NZKPT&language=CHS
45
Nacken T. Karreman B. Pennings E. (2024). Addressing endogeneity in the relationship between early entry and performance: the case of foreign market expansion. Long Range Plan.57:102478. doi: 10.1016/j.lrp.2024.102478
46
Qiu Y. Deng N. Wang B. Shen X. Wang Z. Hultman N. et al . (2024). Power supply disruptions deter electric vehicle a doption in cities in China. Nat. Commun.15:6041. doi: 10.1038/s41467-024-50447-1
47
Rauf F. Wanqiu W. Naveed K. Zhang Y. (2024). Green R & D investment, ESG reporting, and corporate green innovation performance. PLoS One19:e0299707. doi: 10.1371/JOURNAL.PONE.0299707
48
Schnell J. L. Peters D. R. Wong D. C. Lu X. Guo H. Zhang H. et al . (2021). Potential for electric vehicle adoption to mitigate extreme air quality events in China. Earth's Future9:1788. doi: 10.1029/2020EF001788
49
Shan W. Zhao Y. Xu R. (2024). Study on the spatial impact of t he development level of new energy vehicles on regional low-carbon economic transformation. Environ. Ecol.6, 131–137. Available online at: https://kns.cnki.net/kcms2/article/abstract?v=BP09Z8g3bnLVEzZ-kp1jWksfxyE9fmvD9lnxdNSCk3H2PIiN9JRfKyVcso14hzQ44e5i1KD9A9D4nukdR6vAmPWvL_RNjXk2tVTUxH0lrQcBcneX2-ZLFwvdC1EWGukNcGOMnvNf1mlRCUoslXtHgBTghK1MpNcFVAk0k14AQ_lMk-yoV9gygg==&uniplatform=NZKPT&language=CHS
50
Sheng Q. Guo W. Zhao M. (2024). Differentiated paths of regional green development driven by industrial enterprise innovation. Bull. Chin. Acad. Sci.38:2024001. doi: 10.1051/bcas/2024001
51
Su L. (2024). Environmental regulation and corporate green innovation: evidence fro m the implementation of the total energy consumption target in China. J. Bus. Econ.95, 1–28. doi: 10.1007/S11573-024-01207-6
52
Sun H. Hu D. Zhang X. (2023). Retraction note: green economic revival acquisition: evaluating the impact of digital finance and natural resource development. Environ. Sci. Pollut. Res.30, 108667–108680. doi: 10.1007/S11356-024-35081-0
53
Wang H. Du D. Tang X. Tsui S. (2023). Green finance pilot reform and corporate green innovation. Front. Environ. Sci.11:1273564. doi: 10.3389/fenvs.2023.1273564
54
Wang Y. Gu S. (2024). Harmonizing the digital economy and green development: challenges, strategies and pathways to achieve the double-carbon goal. J. Econ. Manag. Sci.7:56. doi: 10.30560/JEMS.V7N3P56
55
Wang Q. Qu J. Wang B. Wang P. Yang T. (2019). Green technology innovation development in China in 1990–2015. Sci. Total Environ.696:134008. doi: 10.1016/j.scitotenv.2019.134008
56
Wang Y. Yang P. How science and technology innovation affects the level of green development-considering the transmission analysis of industrial s tructure and resource mismatch.Frontiers of engineering management. Sci. Technol.,(2025),45:1–11. Available online at: http://kns.cnki.net/kcms/detail/34.1013.N.20241017.1137.002.html.
57
Wang D. Zhao J. (2025). Factors influencing transportation carbon emissions in Liaoning Province based on the LMDI model. J. Shenyang Univ.37, 123–133+189. doi: 10.16103/j.cnki.21-1583/n.2025.02.009
58
Wen X. Qi X. Jiang L. (2023). Green technology innovation, industrial structure upgrading and environmental regulation. Coop. Econ. Technol.7, 10–13. doi: 10.13665/j.cnki.hzjjykj.2023.07.038
59
Wu X. (2025). Research on the coupling compatibility of new productive for ces and green development in China's five Major River basins. Contemp. Econ.42, 27–38. doi: 10.26932/j.cnki.ddjjzz.2025.05.003
60
Wu J. Yi H. Zheng X. Liu K. (2025). The impact path of new energy vehicle promotion on green development—empirical research from the provincial level in China. Sustainability17:5684. doi: 10.3390/su17135684
61
Xu S. Zhang Y. (2023). Impact of manufacturing agglomeration on the green innovati on efficiency-spatial effect based on China's provincial panel data. Int. J. Environ. Res. Public Health20:4238. doi: 10.3390/ijerph20054238
62
Xu J. Zhang W. Chen L. (2022). The impact of urban population density on perceptions of the human environment in Hangzhou. Geogr. Sci.42, 208–218. doi: 10.13249/j.cnki.sgs.2022.02.003
63
Xu Y. Zhang R. Sun W. (2021). Green technology innovation, factor market distortion and industrial structure upgrading. Res. Dev. Manag.33, 75–86. doi: 10.13581/j.cnki.rdm.20210483
64
Xu L. Zhao L. (2019). Research on new energy technology innovation effect of key industrial policies. Resour. Sci.41, 113–131. Available online at: https://kns.cnki.net/kcms2/article/abstract?v=BP09Z8g3bnJcEAQiQEkytOm6NeIhMlrgQJmtjB79XEyOgixrufn5DdKtDguNtxlDTvaZSxjLaOeRFUkHD4LZH2poAW-8wcUDtVh9GKf5mUYFslzWJy4mYn7zWrYvVA03kstsIDcaA47txdUJxzTDl3-BLEU75moIoyK6gSi0AFJXaZwoGwb4Nw==&uniplatform=NZKPT&language=CHS
65
Xu S. Zhou Y. (2023). OFDI, industrial structure upgrading and green development—spatial effect based on China’s evidence. Sustainability15:2810. doi: 10.3390/su15032810
66
Yang K. Cao A. Fang C. (2024). Impact of new energy automobile industry agglomeration on regional green economy efficiency--an empirical study base d on the Yangtze River Economic Belt. Resour. Ind.26, 35–49. doi: 10.13776/j.cnki.resourcesindustries.20231213.002
67
Yang Y. Wei X. Wei J. Gao X. (2022). Industrial structure upgrading, green Total factor productivity and carbon emissions. Sustainability14:1009. doi: 10.3390/SU14021009
68
Yao Y. Zheng H. Ouyang Z. Gong C. Zhang J. Ying L. et al . (2025). Impact of urban green infrastructure on ecosystem services: a systematic review. Ecol. Indic.178:113885. doi: 10.1016/j.ecolind.2025.113885
69
Yi L. Tian M. Zou F. Yan S . (2025). How does new energy vehicle technology innovation enhance regional carbon emission efficiency?--an empirical analysis based on 274 cities in China. Soft Sci.39, 1–14. Available online at: https://kns.cnki.net/kcms2/article/abstract?v=BP09Z8g3bnIKWU6qsMLucr61YiumqyZSXTKjtWinb46lGdmqn2JQu9v4WwPGnxC95QUWd9xq0445Na2mcnyQntbI8yWTeVQ_1lqw8S5ijiUBVvRzObpowpf5HJKv7pXuql3YU_fKn5PuyjVqJrUgxQMOA8-MPh5472FfCW0pb2rgJc0hQ7vtgw==&uniplatform=NZKPT&language=CHS
70
Yue J. Duan H. (2024). The influence of new energy industry agglomeration on regional green innovation performance—evidence from China. Sustainability16:2029. doi: 10.3390/su16052029
71
Zhang W. Mu H. (2017). Research on green population density in Chinese cities. Res. Technol. Econ. Manag.5, 113–118. Available online at: https://kns.cnki.net/kcms2/article/abstract?v=BP09Z8g3bnICmjl4vIkyAON3DKFNL3wbxgC1c6QFEVonErUELCJh2h3Bf3B7T3lXP-KBijHWcJcDz5e9euc4ihBCyLavObLZ6voNbMOtZEsXOgGpdcIWfIvE0TeAEypOwDCvuwoChuyN_IBfQxSs_P7Iub6XYGFFF2efBFuZG2-MQqMwOwF-Xg==&uniplatform=NZKPT&language=CHS
72
Zhao X. Hui H. Yuan H. Chu X. (2023). How does adoption of electric vehicles reduce carbon emissions? Evidence from China. Heliyon9:e20296. doi: 10.1016/J.HELIYON.2023.E20296
73
Zhao J. Wang X. Li X. (2024). Influence mechanism of green technolog y innovation and environmental regulation on green development of cities in th e Yellow River Basin. China Popul. Resour. Environ.34, 132–141. Available online at: https://kns.cnki.net/kcms2/article/abstract?v=BP09Z8g3bnI2lNuU7f_J_gl5AZL0cf9Mu0MHdKYmiAMfb4071kiwvPwiHV7ecETL8zGL09Z1ZUKcCf5jI8GXGDsM_EG9ZQeteN8yeIbcVOpc-pu3Dk1K4u_pRIyTTqyiqZ8dfqeWEQ1zjinXgyUs5z5pXEMNDJd882GQq74uRV0zTZbGVWS11Q==&uniplatform=NZKPT&language=CHS
Summary
Keywords
urban green development, new energy vehicle market, energy structure, new energy technology, industrial upgrade
Citation
Du Y and Zhang J (2025) Impact of new energy vehicle market scale expansion on urban green development: evidence from Chinese cities. Front. Sustain. Cities 7:1685887. doi: 10.3389/frsc.2025.1685887
Received
20 August 2025
Accepted
29 September 2025
Published
22 October 2025
Volume
7 - 2025
Edited by
Haoyu Hu, The Chinese University of Hong Kong, China
Reviewed by
Guangchen Li, Beijing Wuzi University, China
Yukun Gao, Peking University, Beijing, China
Updates
Copyright
© 2025 Du and Zhang.
This is an open-access article distributed under the terms of the Creative Commons Attribution License (CC BY). The use, distribution or reproduction in other forums is permitted, provided the original author(s) and the copyright owner(s) are credited and that the original publication in this journal is cited, in accordance with accepted academic practice. No use, distribution or reproduction is permitted which does not comply with these terms.
*Correspondence: Jiankai Zhang, 494834016@qq.com
†ORCID: Jiankai Zhang, orcid.org/0009-0001-6505-7601
Disclaimer
All claims expressed in this article are solely those of the authors and do not necessarily represent those of their affiliated organizations, or those of the publisher, the editors and the reviewers. Any product that may be evaluated in this article or claim that may be made by its manufacturer is not guaranteed or endorsed by the publisher.