Abstract
An in-depth understanding of travel behavior underpins the development of efficient and sustainable urban transport systems. While several studies have examined aspects of urban mobility in Sub-Saharan Africa, comprehensive and in-depth studies remain limited across most cities in the region. Consequently, many urban contexts in this area are still underexplored, particularly in Ethiopia, the mobility dynamics and the factors that influence it are unknown. Therefore, this study explores the urban mobility behavior of emerging cities and its relationships with individual and household attributes in Bahir Dar. To this end, data was collected through a household travel survey from 2,000 participants, selected using cluster and systematic sampling techniques, and analyzed using descriptive statistics, SEM and curve fitting techniques using SPSS, R, and AMOS. The findings showed that the travel characteristics of residents vary among individuals based on personal and household attributes. Overall, Bahir Dar residents made on average 2.4 daily trips, with a trip rate of 2.5 for men predominantly for work and administrative service purposes, and 2.33 trips undertaken by women mainly for shopping, social affairs and health purposes. Demographically, females, the elderly and relatively young group of populations tended to make fewer and shorter distance travels compared to other groups. The results of the structural equation model have proved the relationships between identified characteristics of travelers and their travel behavior. As a result, transport system attributes (β = 0.98), economic characteristics (β = 0.96), household size (β = 0.96), and number of workers in households (β = 0.94) were key factors influencing travel behavior in emerging cities. However, gender, possession of a driving license, and land use variables were found to be less significant in determining the travel behavior of residents. Besides filling the research gap, this study recommends the consideration of travel variations among different socio-demographic and economic groups when developing various city plans, policies and traffic management interventions.
1 Introduction
Cities in developing countries are known for their rapid physical and demographic growth (Alizadeh and Sharifi, 2023; Bassolas et al., 2019). As these cities continue to expand and populations increase rapidly, the demand for travel, transportation services, and infrastructures may outpace the capacity of existing urban transport systems and put pressure on the planning, managing, and financing of the economic, social, environmental, and transportation issues (Arbuzova et al., 2023; Choi and Loh, 2013; Tai et al., 2016). This can result in poor access to and inefficiencies in transport service provisions in urban areas (Arbuzova et al., 2023; Costa et al., 2017; Gim, 2011; Soliani, 2021).
African cities are currently confronted with a variety of transport problems that are linked to fragmented and underfunded transport authorities (Kumar and Barrett, 2008), insufficient urban transport planning, and poor urban management. Moreover, Ethiopian cities, including Bahir Dar are also facing considerable transport problems that have been intensified by rapid urban expansion and population increase. Even though motorization in Ethiopia has increased in recent decades (FDRE Ministry of Transport and Logistics, 2024), the public transportation systems remain underdeveloped and inefficient, primarily relying on para-transit modes. Due to this and other reasons, cities in Africa are suffering with increased traffic and congestion, long and highly unpredictable trips and daily travel durations, delays and longer waiting times, road accidents, gender and socio-economic inequities, increased transportation costs, and other challenges posed by the dominant informal public transport system (Arbuzova et al., 2023; Bryceson et al., 2003; Foley et al., 2022; Kamuhanda and Schmidt, 2009; Salon and Gulyani, 2010; Tatah et al., 2023; Abeje, 2020). These pressing issues adversely affect both individuals and the environment, necessitating urgent attention, particularly in medium and large cities (Amanor et al., 2025).
Even though several studies (such as Ahmad and Puppim de Oliveira, 2016; Blinkin and Muleev, 2016; Bassolas et al., 2019; Gim, 2011; Hyodo et al., 2005; Ma et al., 2014; Okeke et al., 2021) have been conducted in many cities of the world to comprehend urban mobility behavior and solve the related challenges, knowledge of urban travel behavior is very limited in Ethiopia, especially in Bahir Dar, due to a lack of empirical research. As a result, day-to-day travel characteristics and variations of activities in Bahir Dar are unknown and more complicated to understand. Furthermore, the City lacks organized travel data and transport planning studies that would guide the decisions made by planners, operation authorities, and policy-makers, as well as the development of the transportation system. In addition, travel is perceived as a simple behavior, and there is no indication of any endeavors to investigate the nature and variability of the daily travel patterns and decisions of individuals (Senior experts at Bahir Dar City Transport Office, Personal Communication, November, 2023), which are influenced by various factors such as personal characteristics, socio-economic and demographic attributes, and the configuration of urban transportation systems. This situation has therefore led to an urgent call for a study to comprehend the mobility behavior of the residents and its correlations with the travelers characteristics.
Thus, this study aims to explore the urban mobility behavior and the factors that shape travel patterns of residents considering the temporal aspects of trips by time of day, trip durations and trip frequency to characterize the dynamics of urban mobility. Furthermore, this research is based on survey data of Bahir Dar city which was conducted by the researchers and is a unique case (to the best of the authors' knowledge) that has not previously been done. As this research utilizes original data, new insights can be obtained on the interplay between the travel behavior of individuals and households and the associated factors in developing countries, which remains limited in the literature. In addition, the findings may also serve as baseline information for planning, modeling, traffic management and policy development initiatives that shape the transportation systems and associated challenges of other Ethiopian cities. As a result, it can be applied in urban and transport planning, designing transport demand management strategies, making evidence-based policy and operational decisions, optimizing public transport systems, and modeling travel demand and associated mobility challenges.
This paper is structured into five sections. The first part serves as an introduction, while the next section offers a summary of the literature review. Section 3 provides the materials and methodologies employed in Section 4, which comprises results and discussions. The conclusion and recommendations of the study are presented in Section 5.
2 Literature review
Mobility, also known as transport mobility, is generally associated with the movement of people and describes the willingness and ability to travel efficiently from one place to another (Costa et al., 2017; Meyer, 2016; Wegener, 2013). It encompasses the “potential” for movement, conditioned on the mobility means one can access, including car, public transport, three-wheeled vehicles, cycling, walking and other modes (Spinney et al., 2009 cited in Yao and Wang, 2018). Mobility is inextricably linked to travel behavior, which is dynamic in nature (Kasraian et al., 2022) and the daily life of trip-making behavior of individuals in terms of trip frequency, purpose, distance, travel time and duration, vehicle ownership, and transport mode choice (Alizadeh and Sharifi, 2023; Cui et al., 2018; Martin et al., 2016; Ramírez et al., 2021; Saveleva and Lorens, 2019; Tatah et al., 2023; Van Acker and Witlox, 2010; Yao and Wang, 2018; Zhang et al., 2008).
One of the most widely used theoretical frameworks in mobility research for explaining travel behavior is the Theory of Planned Behavior (TPB). The theory posits that intentions, which are influenced by attitudes, subjective norms and perceived behavioral control, affect travel behavior and choices (Ajzen, 1991). It also serves as an effective framework for elucidating mobility behavior by incorporating main predictors and remaining adaptable to the inclusion of supplementary factors that improve its predictive power (Madha et al., 2016). In this regard, a significant number of empirical studies (such as Abrahamse et al., 2009; Madha et al., 2016; Bamberg et al., 2003; Duan et al., 2023; Lois et al., 2015; Heinen et al., 2013; Lanzini and Khan, 2017; Stark et al., 2018) have proved that the socio-demographic characteristics, economic status, psychological attributes, and external factors such as infrastructure, policy, and culture significantly influence the Theory of Planned Behavior constructs and travel behavior, including travel frequency, mode choice, and travel time. For instance, Abrahamse et al. (2009) discovered that socioeconomic and demographic factors influence traveler behavior. They found that higher-income individuals are less cost-sensitive, women report lower perceived behavioral control over cycling, and younger travelers experience higher social-norm pressures to adopt sustainable travel practices. In addition, Heinen et al. (2013) and Caballero et al. (2019) have stated that the predictive power of intentions on travel behavior is increased by the availability of secure and accessible cycling infrastructure, which enhances both perceived and actual control. Social expectations such as norms, values, beliefs, attitudes and lifestyle also have a great role in explaining travel behavior (Steg and Gifford, 2007; Tai et al., 2016). Therefore, the Theory of Planned Behavior offers a valuable framework for explaining travel behavior and the factors that influence it in the cities of developing countries. Nevertheless, its application needs contextual adaptation to accommodate the socioeconomic, cultural, and infrastructural conditions of the local contexts.
Travel behavior and decision-making process are influenced by the complex interplay of various factors that determine the mobility patterns of individuals and collective travel behaviors over time and space at varying rates (Bertolini, 2012). Overall, these factors can be broadly categorized as socio-demographic and economic factors such as age, gender, income, education, household size and structure, car ownership, etc. (Chaudhry et al., 2023; Ewing and Cervero, 2001; Kasraian et al., 2022; Mohd Shariff and Shah, 2008; Ozbilen et al., 2024; Rahman, 2008; Scheiner and Holz-Rau, 2007; Schwanen et al., 2004; Silva et al., 2020; Van Acker and Witlox, 2010; Zhang et al., 2008); built environment, urban form and policy factors such as land use mix, policy, zoning, density, design, connectivity, location, city size, destination accessibility, and distance to transit services (Cao et al., 2007; Ewing and Cervero, 2001; Galán et al., 2024; Garling and Steg, 2007; Kasraian et al., 2022; Mohd Shariff and Shah, 2008; Silva et al., 2020; Yao and Wang, 2018; Amanor et al., 2025); technologies and innovations (Chaudhry et al., 2023; Levin and Boyles, 2015; Rode et al., 2015; Wang and Law, 2007); psychological factors and personal characteristics (Chaudhry et al., 2023; Rode et al., 2015; Van Acker and Witlox, 2010; Yao and Wang, 2018; Raunio, 2014); availability, cost and convenience of transport options (Maca'rio, 2001; Meyer, 2016; Mohd Shariff and Shah, 2008); and institutional factors (Yao and Wang, 2018). A systematic review by Moses et al. (2022) also proved that the primary determinants of travel behavior and mode choice in cities of developing countries include socio-demographic factors (age, gender, income, education, employment, and household size), mode availability, accessibility, and cost.
In contemporary cities, urban mobility has become increasingly complex due to the confluence of multiple factors (Chapman, 2007; Stead and Marshall, 2001). Since the publication of Mitchell and Rapkin's (1954) classic work on urban travel behavior (Pas, 1980), a large number of empirical studies have been done in various geographical locations to understand urban mobility. Furthermore, from the 1970s onwards, investigating the characteristics of people's travel behavior, its inter-relationships with travelers characteristics, and travel determinants became formalized as a research field in spatial and transport sciences (Boarnet and Crane, 2001; Ewing and Cervero, 2001; Scheiner and Holz-Rau, 2007). However, the state of research in Africa, particularly in cities of Sub-Saharan countries, is insufficient both in number and depth. There is also a tendency to generalize across heterogeneous and changing contexts in the African context (Tatah et al., 2023). On the other hand, it is also important to note that the contexts of cities in developed countries are different from those of cities in developing nations. Thus, it is imperative to conduct localized studies on travel behavior and its influencing factors in order to bridge the regional differences (Amanor et al., 2025) and gain a comprehensive understanding of travel behavior, despite the fact that some findings may have broad applicability. Moreover, scrutinizing why people travel, how people use transport, and what people do over space, including its interrelationships with spatial and non-spatial parameters becomes crucial for planners, policy-makers, and transport authorities to develop effective transport planning, evidence-based policies and demand management strategies, sustainable mobility systems, and enhance the quality of life of residents (Choi et al., 2013; Cui et al., 2018; Tatah et al., 2023; Wey and Huang, 2018), especially for cities that do not have previous empirical studies like Bahir Dar. The study conducted by Mwale et al. (2025) investigated that the primary determinants of travel behavior and mode choices for home-to-work trips in Lusaka, Zambia are travel duration, travel cost, and mode differences.
To explore the complex relationships between travel behavior and the demographic, socio-economic, infrastructural, and psychological characteristics of travelers (Banister, 2008; Zhao et al., 2019), as well as the determinant factors that influence travel behavior in Bahir Dar, the Structural Equation Modeling (SEM) approach was adopted. Conventional analytical techniques, including multivariate regression models, often face difficulties in capturing these intricate relationships and the influence of latent variables (Hair et al., 2019). In contrast, SEM provides a strong analytical framework for modeling complex causal relationships by simultaneously estimating multiple direct and indirect effects and incorporating unobserved constructs that are essential in shaping travel behaviors (Chaudhry et al., 2023; Kline, 2016). Thus, employing SEM in this study not only enables to handle many endogenous, exogenous variables, and latent variables (Deutsch et al., 2013) but also to determine the causal influence of exogenous variables of persons and households characteristics, economic characteristics, transport system attributes, vehicle ownership, and land use attributes and their indicator factors on the endogenous variable travel behavior in Bahir Dar city.
Therefore, this research contributes to the literature gap of understanding people's travel behavior and its variations with travelers' characteristics, as well as the major factors that affect urban travel behavior in Ethiopian emerging cities, using a structural equation modeling approach by taking Bahir Dar as a case city.
3 Materials and methods
3.1 Description of the study area
Bahir Dar is the capital of the Amhara National Regional State (ANRS) and home to several national and international organizations. The City is situated 485 km from the capital city of Addis Abeba through Motta. It is strategically located on the southern borders of Lake Tana, Ethiopia's largest lake, and crossed by the Abay River. Bahir Dar, which is favored by nature, is distinguished by its palm-lined streets and green and blue natural surroundings. Due to its abundance of human-made, historical and natural tourist attractions, Bahir Dar is a key regional hub for trade, transportation, and tourism (Bahir Dar City Urban Development Construction Department, 2021).
According to the ANRS model of urban centers, the City of Bahir Dar is a class one metropolitan City. Its geographic scope, which covers approximately 92,000 hectares over the next decade, is comprised of six sub-cities, four satellite towns, and adjacent rural “kebeles” (Bahir Dar City Structure Plan, 2020). The City has undergone a rapid pace of spatial expansion and population growth over the past decade. According to the 2023 population forecast of Bahir Dar City Socio-economy and Finance Department (BSFD), the population of the City was 376,864, with 175,614 males and 201,250 females (Bahir Dar City Socio-economic and Finance Department, 2023). Furthermore, the City's population is projected to reach over one million by 2030 (Bahir Dar City Structure Plan, 2020), making it the second-largest City in the country by 2035 (EFDRE, Ministry of Urban Development & Housing (NUDSP), 2016). This would correspondingly lead to a high demand for travel within the City (Figure 1).
Figure 1
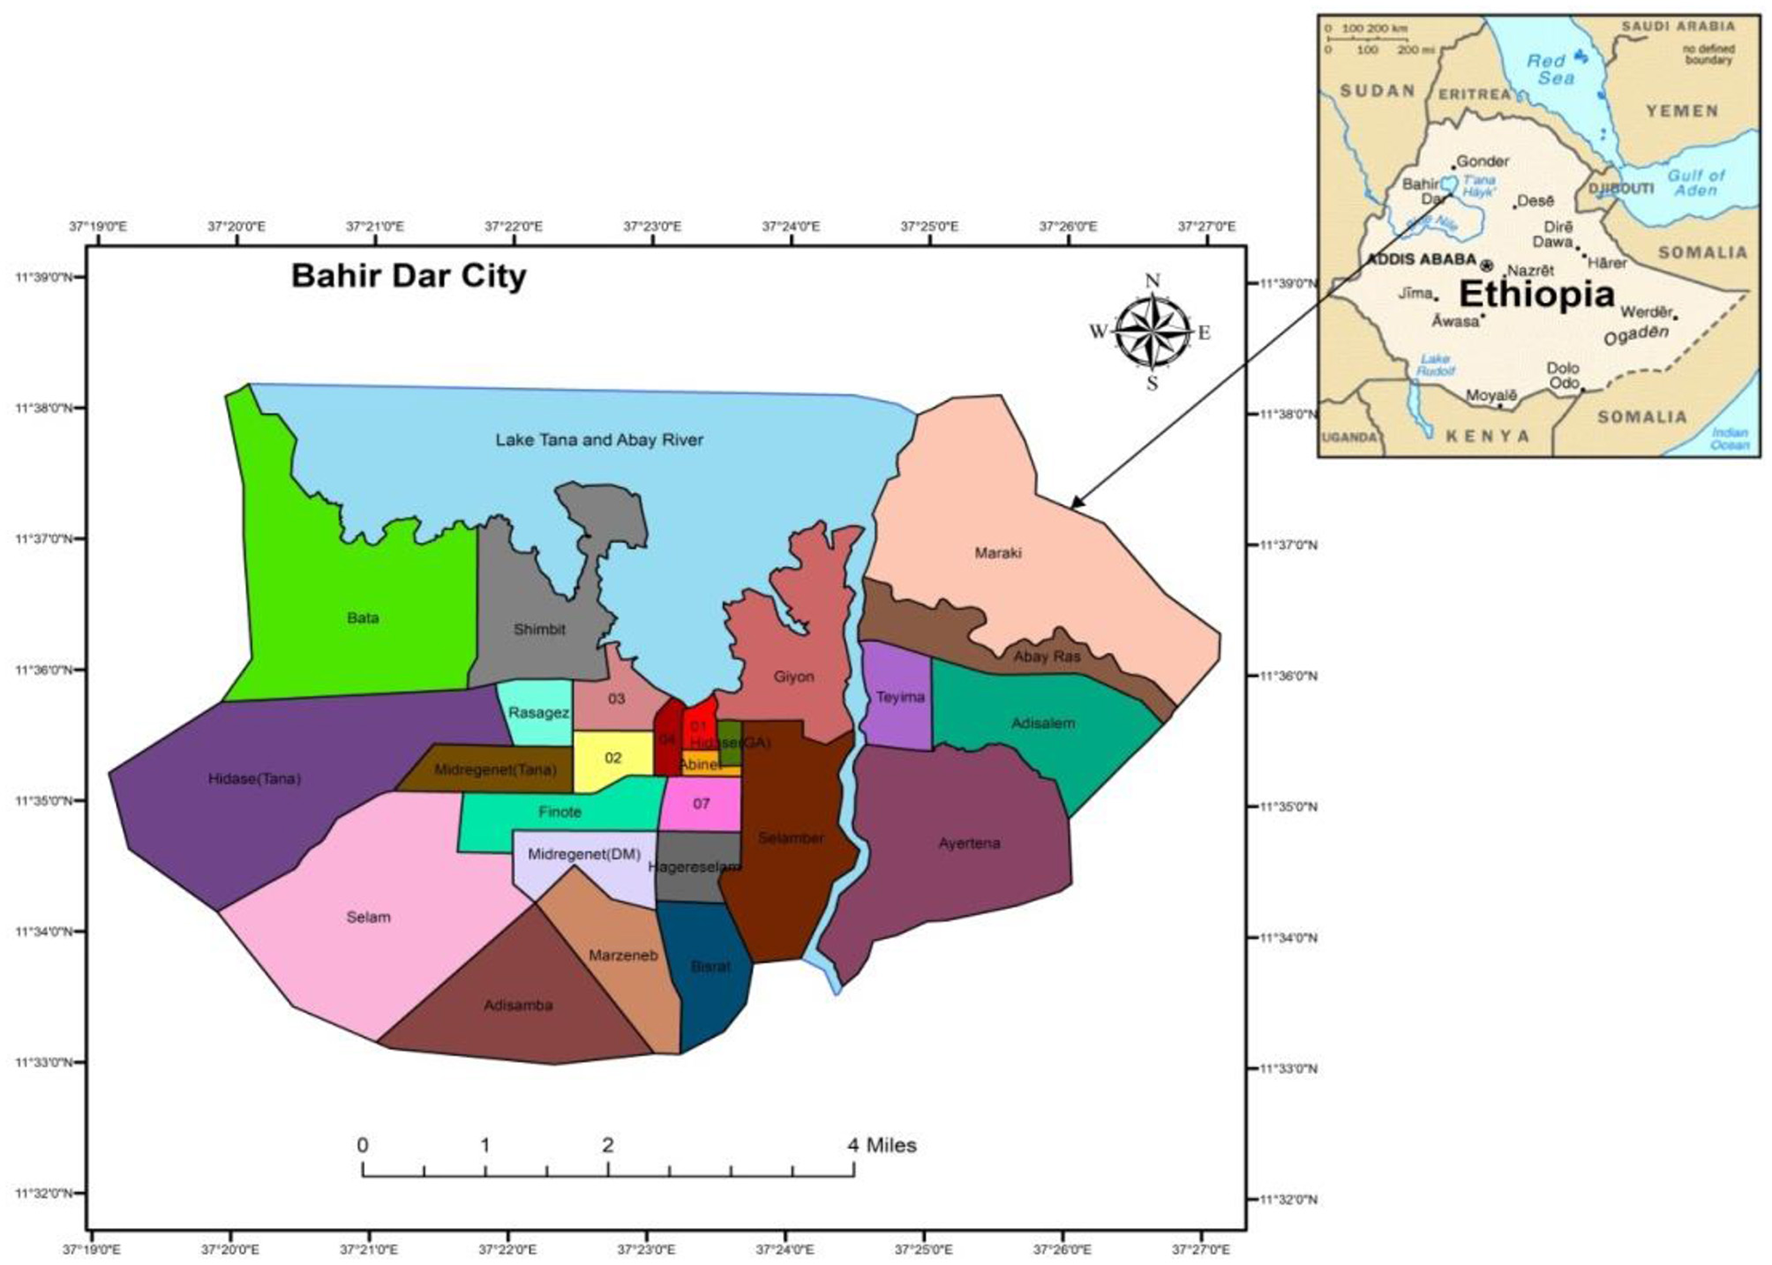
Location map of the study area. Source: Developed by the authors (2024).
The transport system of Bahir Dar is predominantly road-based with a substantial share of the public transport system comprising buses, mini-buses (white and blue taxis), taxi services, and three-wheeled rickshaws, locally called “Bajajs.” Moreover, the City has approximately 16 public buses that operate on two main routes, 607 mini-buses, and more than 3500 registered Bajajs serving on various routes throughout the City. In addition, a water transport service on Lake Tana also plays an important role in connecting the City with the nearby satellite towns and rural kebeles (Bahir Dar City Administration City Service Office, 2021).
3.2 Research design and survey methodology
This research employed a combination of exploratory and descriptive survey research designs to investigate the mobility behavior and its subsequent relationships. To reach on valuable findings, the study used both quantitative and qualitative data from Bahir Dar city residents, Bahir Dar City Urban Development and Construction Office, Bahir Dar City Socio-Economy Development Department, and the City Transport Office through a household survey questionnaire and face-to-face interviews. Due to the absence of any previously organized travel and/or transportation data, this household travel survey was the first organized and comprehensive survey (to the best of the researchers' knowledge) that sought to investigate the travel behavior and the links with residents' characteristics. The survey consisted of questions developed to capture the respondents' attributes and all their trip characteristics of the previous days, including socio-economic and demographic, trip diary, activity location, travel mode, departure time, the factors that influence their travel behaviors, and more.
To select the study participants and collect data, cluster and systematic sampling techniques were employed. As the City has no previously studied zonal system, the smallest administrative units called “Kebeles” were comparatively convenient to cluster the City into homogeneous Traffic Analysis Zones (TAZs) and to ensure geographic representativeness of travel behaviors. Following this, as displayed in Figure 2, the study area was divided into 26 zones to select samples and administer questionnaires (see Annex 1 for details). Careful considerations and procedures were taken to select an appropriate sample size and fairly represent the population in each zone. Due to the lack of a single and definite guideline for sample size determination for a generalized multi-objective household travel survey, the recommendations of Dresser and Gattis (1990) were considered to determine the relative size of the survey sample. They suggested a gross sample size of 1,000–2,500 households for medium-sized cities. Consequently, considering the diversity of the study population, representativeness across socio-demographic groups, and the generalizability of the findings, the researchers arbitrarily determined 2,000 participants from 1,000 sampled households, who were above 14 years old. The questionnaires were designed for distribution among the sampled households, specifically considering gender differences, with one for males and one for females in each household, due to the absence of precise demographic data on gender, age, and educational distributions within each TAZ, to avoid bias.
Figure 2
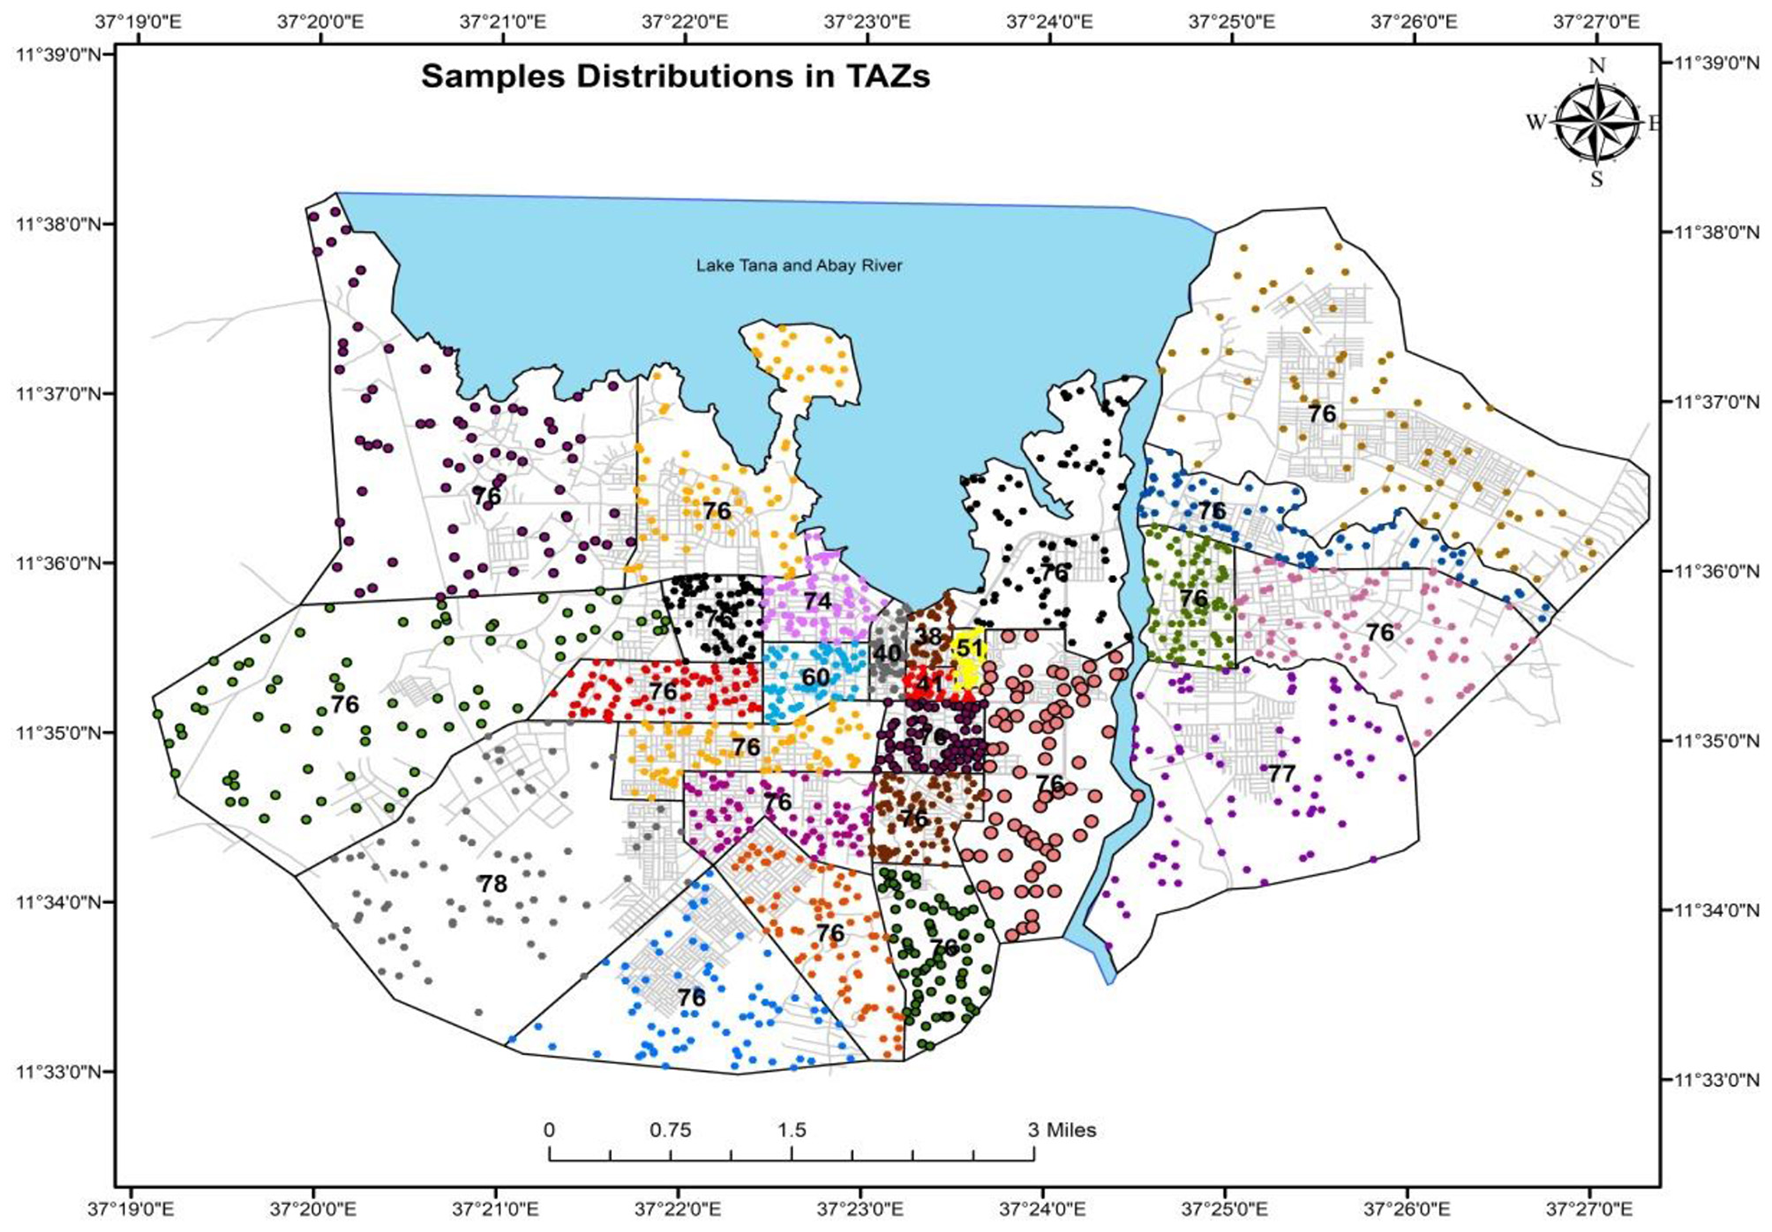
TAZs and sample distributions in the study area. Source: Developed by the authors (2024).
Then, a pilot survey was conducted during the final week of October 2023 to verify the validity of the research. After improving ambiguous questions, the final household survey was conducted in November 2023 by trained survey enumerators. Questionnaires were filled out by pen-and-paper with the help of data collectors, and participants were not offered any financial incentives. To simplify and reach all sampled respondents, these questionnaires were prepared in Amharic (local language) and then translated into English for data analysis.
In order to enhance the response rate, questionnaires were distributed to the respondents 1 day before the data collection. On the subsequent days, data collectors met with them to address any questions that were ambiguous and to collect the questionnaires. As noted above, the samples were identified considering the data that females outnumbered males in the City. However, a significant number of females were not interested in participating in the study, resulting in the participation of more males than females.
3.3 Data analysis and variables
The data obtained from the questionnaires collected from the household travel survey have undergone systematic data handling, encoding, coding, and cleaning procedures. Initially, the recorded dataset was manually cleaned and coded in Excel (see Table 1 for socio-economic and demographic variables), and followed by the implementation of case-wise deletion to address missing values and identify valid responses. Incomplete cases, even when partially accurate, were excluded from the analysis to ensure data integrity. The cleaned Excel dataset was subsequently converted into SPSS format for further processing and analysis. Then, before conducting SEM, preliminary statistical analyses and tests were performed using SPSS to examine data distribution and detect potential outliers. Following this, the indicator variables were carefully selected, regrouped, and recoded for modeling travel behavior as presented in Annex 2. Then, the final data analysis and presentation was carried out using Statistical Package for the Social Sciences (SPSS V.26), Microsoft Excel, R, and AMOS, as well as spatial data presented using Arc GIS version 10.8. Descriptive statistics, factor analysis, SEM and curve fitting techniques were utilized in the data analysis.
Table 1
| Variables | Label | Attribute classification | Frequency | Percentage |
|---|---|---|---|---|
| Gender | 1 | Male | 1,020 | 55.8 |
| 2 | Female | 807 | 44.2 | |
| Age | 1 | 15–24 | 349 | 19.1 |
| 2 | 25–34 | 508 | 27.8 | |
| 3 | 35–44 | 490 | 26.8 | |
| 4 | 45–54 | 293 | 16 | |
| 5 | 55–64 | 141 | 2.5 | |
| 6 | 65 and above | 46 | 2.5 | |
| Education | 1 | Read and write | 8 | 0.4 |
| 2 | Primary education | 263 | 14.4 | |
| 3 | Secondary education | 633 | 34.6 | |
| 4 | Certificate/ diploma | 396 | 21.7 | |
| 5 | Degree and above | 527 | 28.8 | |
| Occupation | 1 | Unemployed | 98 | 5.4 |
| 2 | Government employed | 100 | 5.5 | |
| 3 | NGO employed | 48 | 2.6 | |
| 4 | Private sector employed | 423 | 23.2 | |
| 5 | Private business | 847 | 46.4 | |
| 6 | Student | 156 | 8.5 | |
| 7 | Pensioner | 28 | 1.5 | |
| 8 | Housewife | 117 | 6.4 | |
| 9 | Other | 10 | 0.5 | |
| Monthly income | 1 | Less than 3,000 | 6 | 0.3 |
| 2 | 3,001–6,000 | 235 | 12.9 | |
| 3 | 6,001–10,000 | 425 | 23.3 | |
| 4 | 10,001–15,000 | 547 | 29.9 | |
| 5 | 15,001–20,000 | 292 | 16 | |
| 6 | Above 20,000 | 322 | 17.6 | |
| Family size | 2 | 140 | 7.7 | |
| 3 | 296 | 16.2 | ||
| 4 | 580 | 31.7 | ||
| 5 | 445 | 24.4 | ||
| 6 | 258 | 14.1 | ||
| 7 | 67 | 3.7 | ||
| 8 | 30 | 1.6 | ||
| 9 | 5 | 0.3 | ||
| 10 | 6 | 0.3 | ||
| Number of workers in the household | 1 | 28 | 1.5 | |
| 2 | 753 | 41.2 | ||
| 3 | 671 | 36.7 | ||
| 4 | 293 | 16 | ||
| 5 | 59 | 3.2 | ||
| 6 | 16 | 0.9 | ||
| 7 | 2 | 0.1 | ||
| 8 | 5 | 0.3 | ||
| Driver's license possession | 1 | Yes | 422 | 23.1 |
| 2 | No | 1,405 | 76.9 | |
| Vehicle availability of households | 1 | Bikes | 400 | 21.9 |
| 2 | Motorcycle | 24 | 1.3 | |
| 3 | Bajajs | 187 | 10.2 | |
| 4 | Automobiles | 91 | 4.9 | |
| 5 | Minibuses | 58 | 3.2 | |
| 6 | Midi-buses | 8 | 0.4 | |
| 7 | Other vehicles | 56 | 3.1 |
Socio-demographic and economic characteristics of respondents.
With the ability to integrate concepts from both factor analysis and path analysis, SEM has become a compelling and accessible tool for conducting multivariate analyses. The models comprise a measurement model and a structural model. The measurement model is the component of the general model in which latent (unobserved) variables are defined by specifying the relationships between the latent variables and the measured (observed) variables (Ejes and Marquez, 2000). Accordingly, a structural equation modeling (SEM) was used to investigate the relationships between travel behavior and economic characteristics, transport system attributes, land use, vehicle ownership, and individual attribute-related factors. In the measurement sub-model, factor-to-variable (indicator) relationships were estimated using confirmatory factor analysis, while the structural model evaluated factor-to-factor relationships through path analysis. Considering these relationships, three hypotheses were proposed in the SEM model to explain the travel behavior of residents. Firstly, a strong correlation was assumed between the latent variables of land use, economic characteristics, transport system attributes, vehicle ownership, and their respective indicators. Secondly, it was expected that these latent factors would have a close relationship and influence one another. Finally, travel behavior can be expressed as a function of economic characteristics, land use features, vehicle ownership, and transport system attributes as well as the characteristics of individuals and households, such as gender, age, education, household size, number of workers in households, and possession of a driving license. Thus, the variables mentioned above were regarded as exogenous variables, while travel behavior was treated as an endogenous variable. These variables were selected due to the reason that they are assumed to have relatively high explanatory power in exploring travel characteristics in Ethiopia. Diagrammatically, the latent variables were represented by ovals, and the rectangles represented single observed factors in the model.
The associations between exogenous and endogenous variables were represented by the following structural equation model.
y = By + Γx + ε where,
y = M × 1 matrix of endogenous variables,
x = N × 1 matrix of exogenous variables,
B = M × M matrix of coefficients of the endogenous variables,
Γ = M × N matrix of coefficients of the exogenous variables, and
ε = M × 1 matrix of errors.
The software package AMOS24 (Analysis of Moment Structures) was utilized to estimate the model and perform analyses. As the dataset was relatively large (2,000 samples), Covariance-Based SEM was employed to examine the relationships between observed and latent variables and to evaluate the overall fit of the proposed model. In terms of the estimation method, the maximum likelihood (ML) method was used, assuming that the SEM satisfies the assumption of multivariate normality of its variables.
4 Results
This section presents the findings and discussions of the study, which begin with a description of the sampled respondents' socio-economic and demographic characteristics, and followed by an analysis and discussion of their mobility patterns.
4.1 Respondents' characteristics
Of the 2,000 questionnaires distributed to sampled residents in Bahir Dar, 1,831 were returned, resulting in a response rate of 91.6% (i.e., 1,831/2,000*100). After assessing the quality of respondents' responses, four questionnaires (0.2%) were left unfilled except for the trip diary section. These survey participants reported that they did not make any trips on the previous day and did not complete the remaining questionnaires. As a result, these samples were only included in the travel patterns section, and 1,827 questionnaires were considered for the rest of the analysis.
Information regarding the socio-economic and demographic characteristics of the participants, such as gender, age, educational status, occupation, monthly income, family size, number of workers in households and car ownership was analyzed. Even though the total number of males was 46.6% and females were 53.4% (Bahir Dar City Socio-economic and Finance Department, 2023), the summary result revealed that 55.8% of the participants were males. This is due to the reason that it was found that most heads of households were men, and they were mainly responsible for responding to any enquiries that were brought to their homes, including this household travel survey, due to cultural reasons.
To determine whether family size and the number of workers in households have any correlations with travel characteristics, the survey has included questions regarding household size and composition. Subsequently, most households consisted of three to six family members, with 31.7% reporting four household members, followed by 24.4% of households having five family members. The survey showed that participants were fairly represented across all age groups, with the highest proportions being 27.8% for the 25–34 age group and 26.8% for the 35–44 age category.
The survey has also collected data on education status, occupation and income to establish associations with mobility patterns. The result indicated that 77.6% of respondents were employed, with the majority engaged in private businesses (46.4%), and followed by those working in private organizations at 23.2%. The educational background of the participants was fairly balanced, with 34.6% of participants possessing secondary school qualifications, and 28.9% holding degrees or higher qualifications. In terms of income, the largest percentage (29.9%) of households reported a gross monthly income ranging from Ethiopian Birr (ETB) 10,001 to 15,000, while the lowest share (0.3%) was reported by those who had a gross monthly income of less than ETB 3,000. From this, it can be understood that these variations in socio-economic and demographic characteristics may impact the travel patterns of residents within the City.
Regarding possession of a driving license and the availability of vehicles in households, as displayed in Table 1, nearly 23.1% of participants had a driver's license, of which 17.7% of males held a driver's license, while women possessed only 5.4%. Bearing in mind that two members from each sampled household participated, the number of vehicles may be reported twice. As a result, merely 38.6% of respondents have reported the availability of vehicles in their households. Based on vehicle types, the dominant vehicle types available in households were bicycles, Bajajs, and automobiles, respectively.
4.2 Urban mobility behavior
As discussed in Section 2, travel behavior is considered as the frequency of trips made by car, public transport, motorcycle, and non-motorized transport (mainly walking and cycling) modes. Specifically, a trip is explored as a journey that covers a minimum of 500 m from the starting point to the destination using different modes of transport, or a journey that crosses a traffic analysis zone and may consist of two or more segments. Therefore, travel characteristics such as trip frequency, when, why, with what, how long and how far they travel and its relation with the characteristics of a person and households were analyzed in this part.
4.2.1 Travel patterns
To analyze travel patterns, residents were asked to report the characteristics of the trips they made on the previous day. As a result, as displayed in Table 2, 99.8% of participants have made trips, and 0.2% of the samples reported that they did not make any trip on the previous day. Furthermore, 99.8% residents have made two trips (trips one and two), 27.8% participants have done three trips, and 6.3% persons have undertaken four or more trips per day. This indicates that the number of residents who make complex trips on a daily basis is limited.
Table 2
| Number of trips/day | Frequency | Percentage |
|---|---|---|
| 0 Trip | 4 | 0.2 |
| Only 1 trip | 0 | 0 |
| 2 Trips (round-trip) | 1,827 | 99.8 |
| 3 Trips | 508 | 27.8 |
| 4 Trips or more | 114 | 6.3 |
Trip distributions by number of trips made per day.
Concerning trip frequencies, Bahir Dar residents (aged 15 and above) in general made an average of 2.4 trips per person per day. This average trip rate varies based on the socio-demographic characteristics of the individuals and households. For instance, based on sex types, the average number of trips made by males was 2.5, and the daily trip rate of females was 2.33. Across all trip segments, the proportion of trips made by females was lower than that of males. The fact that a significant number of survey participants were housewives and had family-related responsibilities made the number of daily trips conducted by females comparatively lower than that of males. In addition, regarding trip rates by transport modes, the highest trip rates were made by Bajaj and automobile users with a daily trip rate of 2.59 and 2.54, respectively, and followed by walking and mini-bus mode users, accounting for 2.47 and 2.42 average trips, respectively. Users of city buses and bicycles have registered 2.38 and 2.39 trips, respectively.
Participants of this research were also asked to rate their general travel habits of making pre-planned daily trips in their regular travel activities. The result showed that only 5.1% of participants were always engaged in strict pre-planned trips. In this regard, educational and work trips were the most reported activities in this group of trips. Most of their trips were pre-planned for 9.2% of trip makers. And, 18.5% of participants were occasionally undertaking spontaneous travels. However, 43.9% of participants had a culture of making unplanned trips frequently, and 23.3% of participants reported that they had entirely lacked the practice of arranging prearranged trips. From this, it can be inferred that most of the trips undertaken in Bahir Dar (exceeding 67.2%) were characterized by spontaneity.
4.2.2 Trip purposes
The issue of urban mobility cannot be exclusively linked to particular trip purposes; thus, it is essential to clarify why people travel in emerging cities of Ethiopia like Bahir Dar. Since there were multiple segments of trips involved from home to different destinations and back, tour-based analysis was considered to analyze and better represent the trip-making by purpose. As a result, the findings indicated that the majority of the residents (58.8%) were making travels mainly for work purposes, and followed by educational trips constituting 9.1%. The third largest trips were made for shopping purposes (8.8%) and followed by travels made for social affairs (7.3%). Worship and health services trips constitute 5.4% and 3.2%, respectively, from the total daily trips. Administration services and leisure trips were reported with the share of 2.9% and 2.7% of all urban trips. Other trips took the least share, having a share of 1.8%.
Moreover, the willingness to travel for different trip purposes was calculated using exponential power functions. Accordingly, we have conducted curve fitting of the data in order to create demand decay functions relative to the travel time. This was done differentiated by trip purposes. The data of all trips with a duration of less than 60 min was grouped into groups with a width of 5 min, and calculated how many percent of all trips have less duration than the upper limit of the group. The resulting categorized data was then subjected to a curve fitting for an exponential power function f(x) = exp(–b·xc) to determine coefficients b and c. As presented in Table 3, the Mean Squared Error (MSE) was also checked to evaluate the goodness of fit.
Table 3
| Purpose | b | c | MSE |
|---|---|---|---|
| All | 33.77 | 2.94 | 0.0014 |
| Work | 34.47 | 2.95 | 0.0018 |
| Shopping | 32.77 | 2.92 | 0.0012 |
| Education | 31.87 | 3.59 | 0.0027 |
| Social affairs | 33.5 | 2.8 | 0.0021 |
| Leisure | 37.51 | 3.51 | 0.0009 |
| Administration services | 32.42 | 3.25 | 0.0044 |
| Health services | 33.94 | 2.36 | 0.0026 |
| Worship | 27.55 | 2.9 | 0.0014 |
| Other | 34.7 | 2.9 | 0.0011 |
Coefficients and MSE values differentiated by trip purposes.
To model the decay in willingness-to-travel with increasing distance, two candidate functions were considered:
-
Modified Negative Exponential Function:
f(x) = e∧{-x \cdot b}
where b > 0 represents the decay rate.
-
Exponential Power Function:
f(x) = e∧{-\(\frac{x}{b}\)∧{c}}
where b > 0 is a scaling parameter and c > 0 determines the curvature of the decay.
The empirical willingness values (proportions between 0 and 1) were treated as dependent variables, with travel distance (minutes) as the independent variable. Non-linear least-squares fitting was conducted using the Levenberg–Marquardt algorithm implemented in SciPy's curve_fit function (Python 3.11). For each dataset, both models were fitted to the observed values. Initial parameter estimates were set conservatively (b = 0.01 for the negative exponential; b = 1, c = 1 for the exponential power). Parameter constraints were also imposed to ensure only non-negative values (b, c > 0) and to avoid numerical instabilities. In cases where convergence issues arose, the maximum number of function evaluations was increased and parameter bounds tightened.
Then, model performance was evaluated using the Mean Squared Error (MSE) between the observed values and the fitted predictions:
MSE = \frac{1}{n}\sum_{i=1}∧{n}(y_i - \hat{y}_i)∧2
Where y_i denotes the observed willingness at distance x_i, and \hat{y}_i is the corresponding model prediction. For each dataset, the function with the lower MSE was selected as the superior representation of the distance-decay relationship. Consistently across datasets, the Exponential Power Function achieved substantially lower MSE than the Modified Negative Exponential Function, indicating superior fit and greater flexibility in capturing non-linear curvature in willingness-to-travel. As a result, MSE values were found to be between 0.026 and 0.052 for the Modified Negative Exponential Function and 0.0009–0.0044 for the Exponential Power Function.
As it can be seen in Figure 3, the willingness to travel was the greatest for education purposes and administration services (ignoring the “other” category). Both purposes had rather centralized destinations. The lowest travel times were for health services.
Figure 3
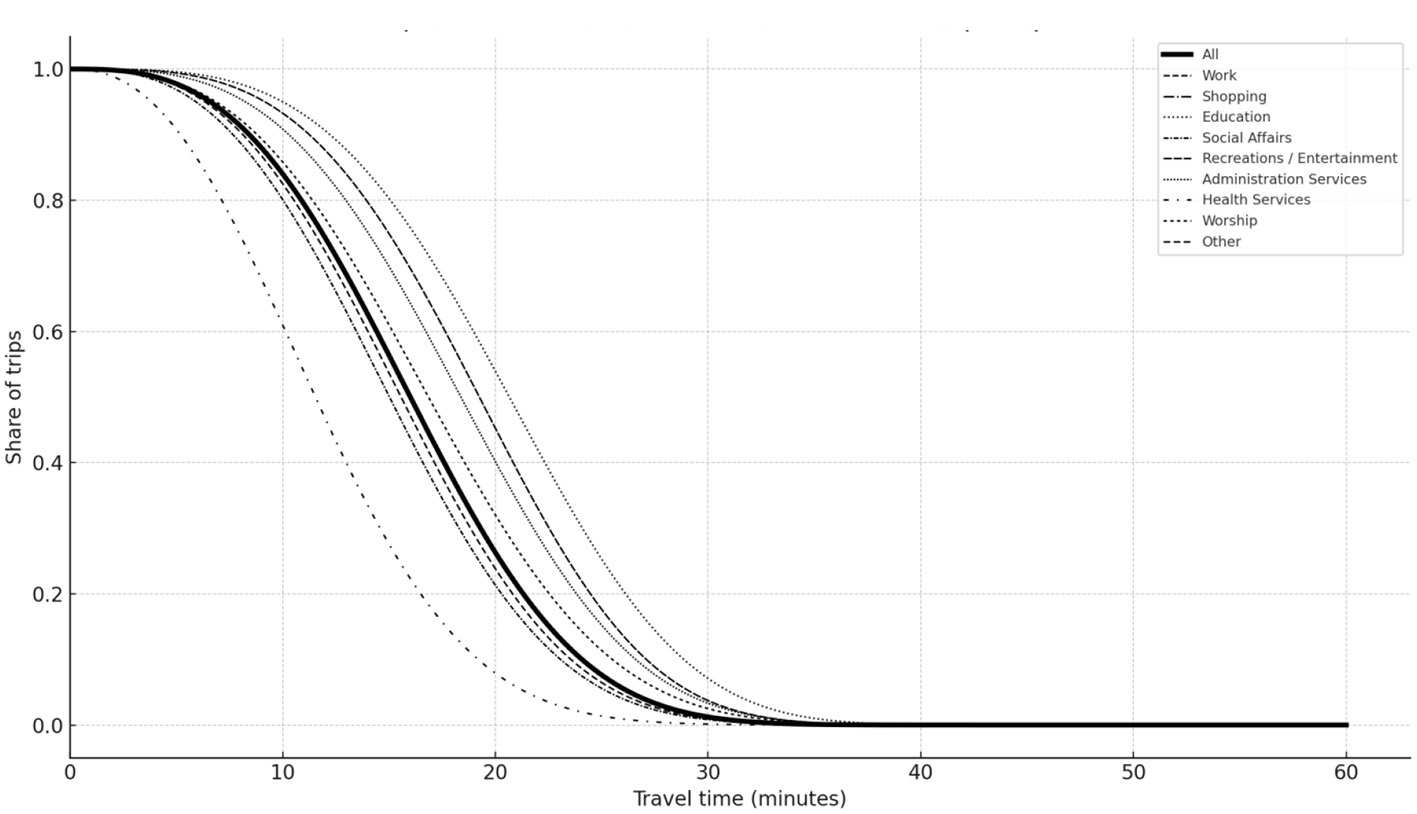
Exponential power functions for different trip purposes.
4.2.3 Travel time and durations
Due to the fact that travel behavior is dynamic in different time dimensions, trips were examined based on reported time of departure and arrival in a total 24-h period. Based on time of departure at the origin, majority of individuals (67.5%) have made their journeys from 7:00 to 8:59; 11% of trips were made between 6:00 and 06:59, 8.4% of journeys were left from 09:00 to 09:59, and 9.3% were made in the time period between 10:00 and 11:59. Regarding the travel patterns of residents in relation to arrival times at destinations, the peak hour was occurred from 18:00 to 18:59 containing about 33.7% of urban trips and, followed by 22.9% of trips made from 16:00 to 17:59. 14.6% of daily trips reached their destinations during lunch time, while 6.6% of trip makers returned to their destinations before lunch time. Only 12% of the journeys arrived at their destination after 19:00. More importantly, this finding calls for the consideration of travel times in the planning and management of public transport service provisions and the city traffic as well.
Concerning travel time duration, the results have disclosed that the average duration per trip was 35 min with a minimum travel time of 9 min and a maximum trip duration of 2:30 h. Based on the average trip rate (2.4), we can infer that the average daily total travel time was 84 min per person. Furthermore, the majority of travelers have traveled from 21 to 30 min (38.3% for trip1, 34.5% for trip2, 25.8% for trip3 and 29.8% for trip4). The second largest share of travelers (22.2% for trip1, 27.5% for trip2, and 26.2% for trip3) have traveled for 31–40 min and followed by 41–50 min travel durations with a share of 12%, 13.6%, and 20.1% for trip1, trip2, and trip3, respectively. Short travel time durations (i.e., < 20 min) were registered in the last trip segments of residents (see Figure 4).
Figure 4
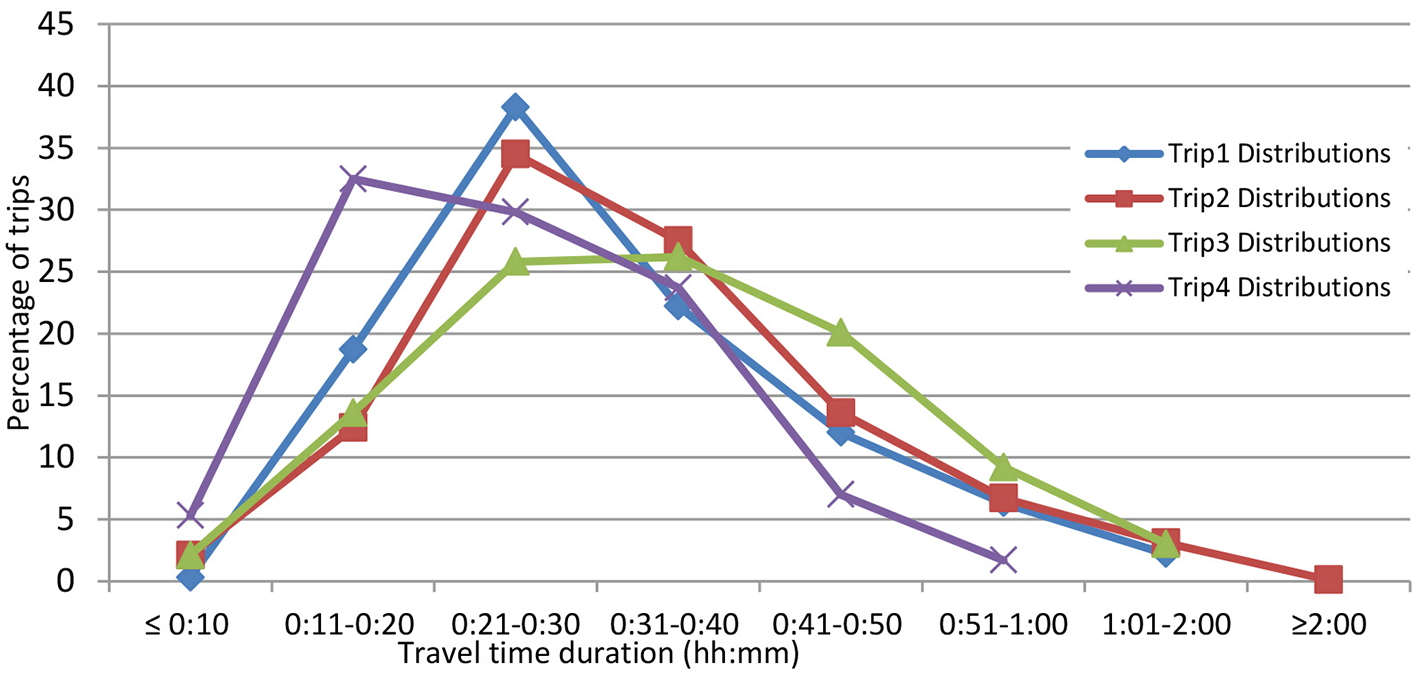
Travel time durations.
4.2.4 Mode of transportation
In Bahir Dar, the most common mode of transportation was the mini-bus, which has represented 35.5% of daily trips. Bajajs were the second most popular means of travel (29.4%), and followed by walking with 18.6%. Even though the City was recognized for its gentle topography and its previous cycling trends, only 5% of daily trips were done on bicycles. Automobiles were utilized by 3.5% of trip makers, and the share of bus journeys, particularly city-bus and public service bus trips was less, accounting for only 3% of all urban daily trips. The remaining 5% of trips were conducted using other modes of transportation within the City (Figure 5).
Figure 5
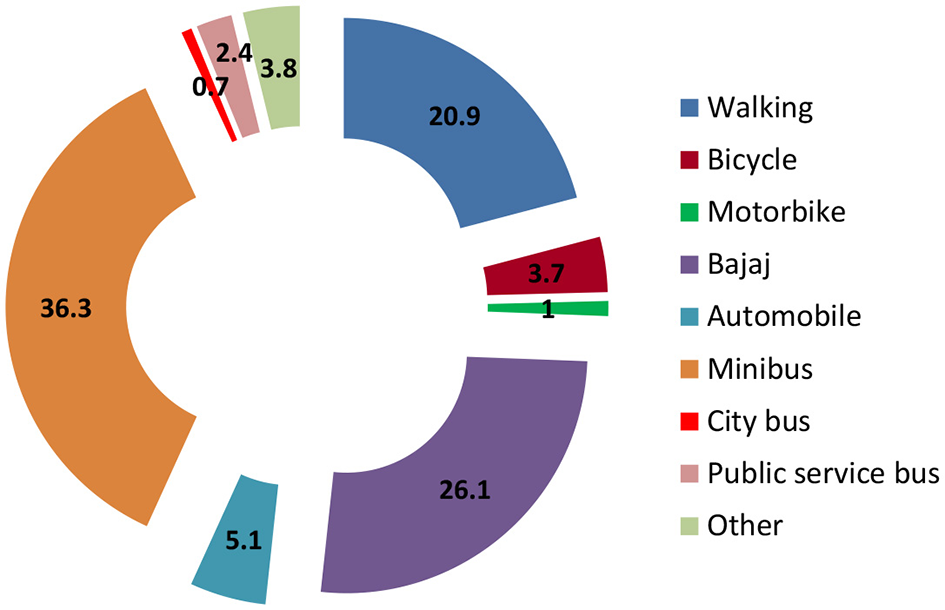
Mode used for trip-making.
In order to calculate the travel times for different modes of transportation in Bahir Dar, an exponential power function was employed. The data of all trips less than 60 min of duration was grouped into groups with a width of 5 min and calculated how many percent of all trips have less duration than the upper limit of the group. The resulting categorized data was then subjected to a curve fitting for an exponential power function f(x) = exp(–b·xc) to determine coefficients b and c, differentiated by travel modes. Below the coefficients, MSE values and plots differentiated by travel modes are presented in Table 4.
Table 4
| Mode | b | c | MSE |
|---|---|---|---|
| Walk | 29.73 | 2.96 | 0.0014 |
| Bike | 34.7 | 3.05 | 0.0014 |
| Bajaj | 32.17 | 3.48 | 0.0012 |
| Car | 30.3 | 2.82 | 0.0012 |
| Bus | 37.8 | 3.92 | 0.0011 |
Coefficients and MSE values differentiated by modes.
As displayed on Figure 6, in the graph for the different modes, Bajajs and buses have higher travel times, which mean they were more used for longer trips. More significantly, bikes, walking and even cars, which in Western Europe have rather long travel times, were used for shorter trips. This underlines the key importance of modeling of para-transit modes and its inclusion in planning.
Figure 6
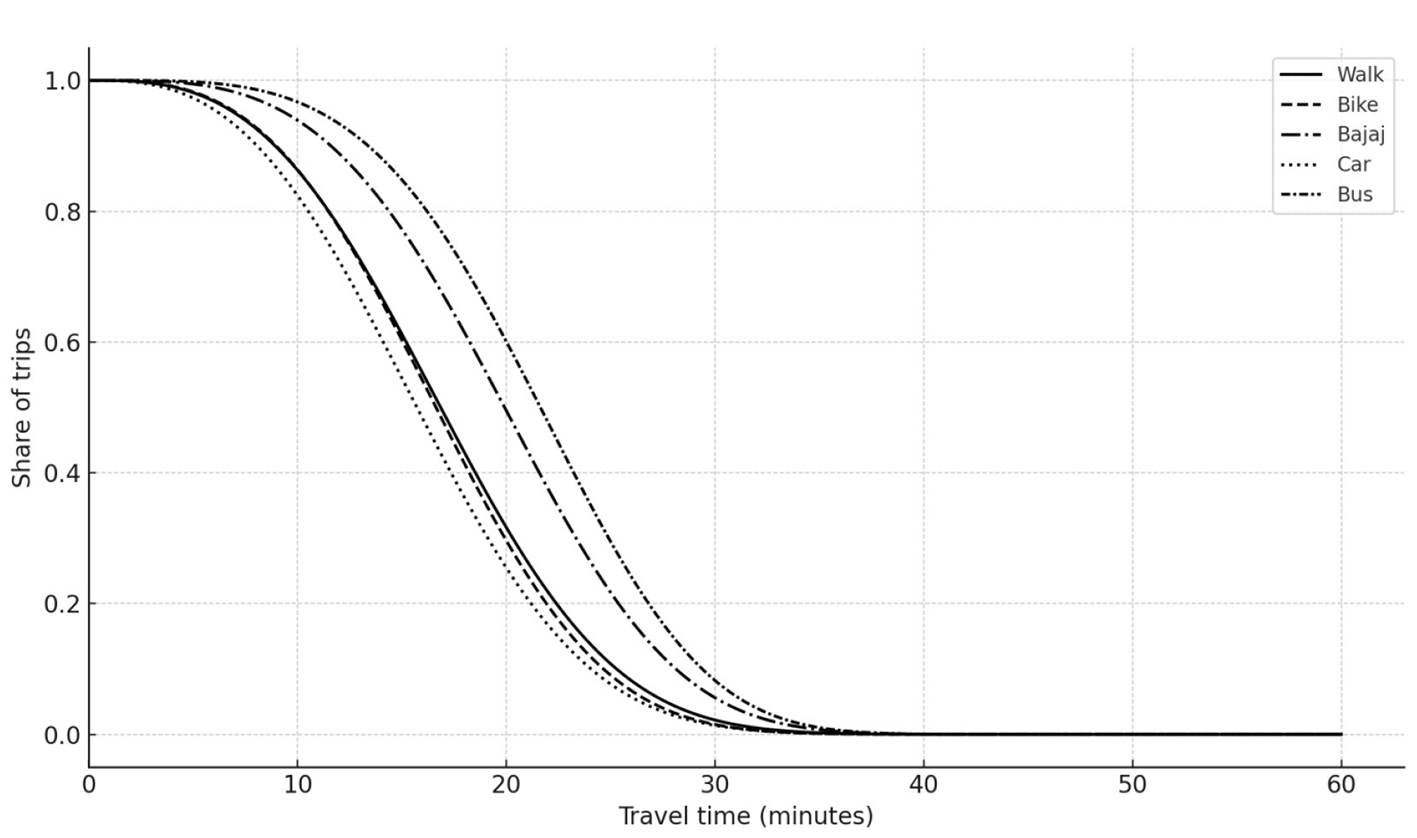
Exponential power functions for different modes.
4.2.5 Travel variations by socio-economic and demographic characteristics
4.2.5.1 Travel patterns by sex and age
The travel characteristics of residents in Bahir Dar city were analyzed based on sex and age category. In line with these findings, residents aged 15–24 (18.1%) and those over 64 years old (2.2%) had lower travel frequencies compared to other age groups, with a daily trip rate of 2.2. The expected “active age groups” of individuals aged 25–44 years have recorded a higher frequency distribution of trips, accounting for 56.2% of daily trips. Furthermore, participants who were in the age range of 35–44 have recorded the highest trip rate (2.5), and followed by those aged 25–34, constituting an average of 2.4 daily trips (Figure 7).
Figure 7
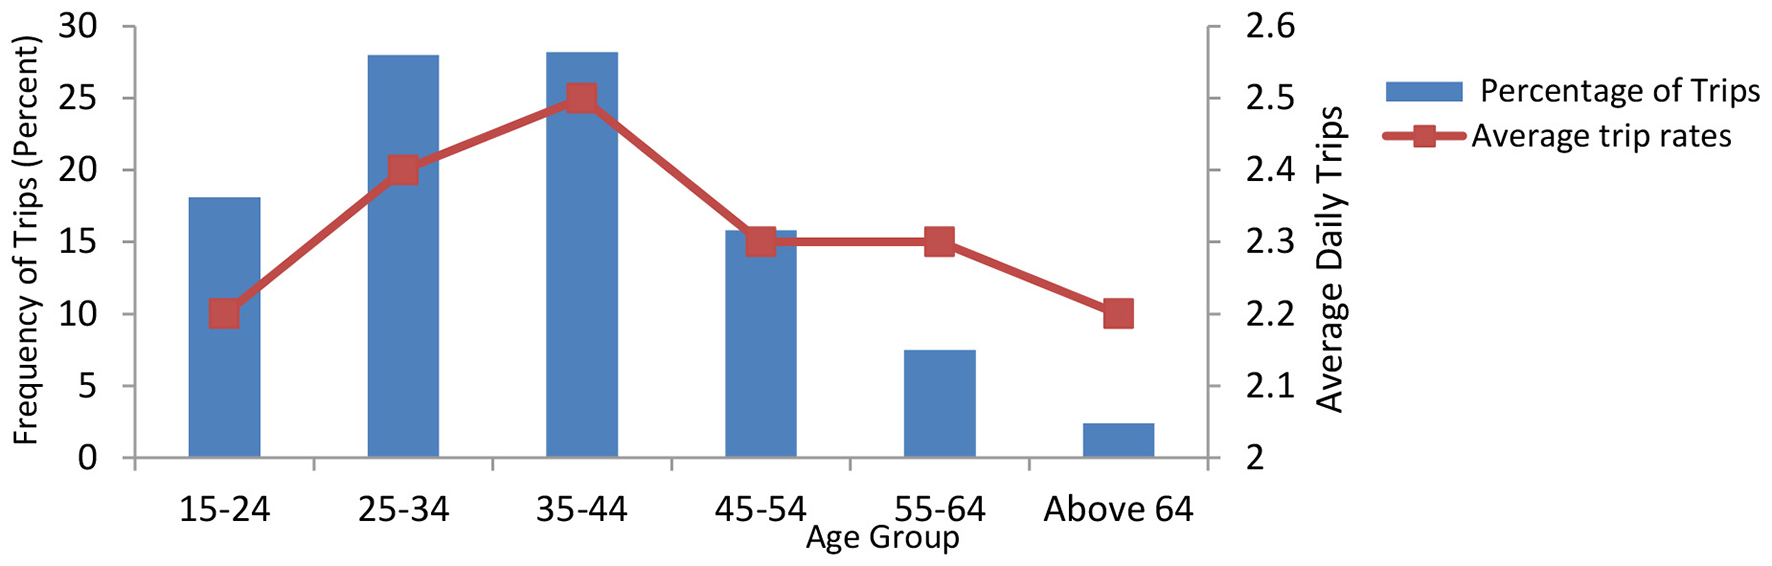
Trip rates by the age of respondents.
The age groups of 45–54 and 55–64 showed the same trip rates, each averaging 2.3 daily trips. The findings of this study revealed that older individuals and younger age groups have traveled less frequently and shorter distances per day, while youths and adults (those aged 25–44) have made more frequent daily trips and covered medium to longer distances daily.
As displayed in Table 5, males were engaged in work (64.2%), leisure (71.4%), and administrative service (65.2%) trips more frequently than females. Whereas, women have shown dominance in shopping (62.9%), social affairs (56.1%), health (55.7%) and other activities (63%) compared to men. Within the same gender category, the majority of trips undertaken by men were for work purposes, accounting for 60% of their total trips. Female trips comprised work and shopping activities, representing 42.3% and 13% of the total women's trips, respectively. The finding infers that females were more engaged in family and social responsibilities, while men were more characterized by business trips.
Table 5
| Gender | Work | Shopping | Education | Social affairs | Recreation | Administrative services | Health services | Worship | Others | |
|---|---|---|---|---|---|---|---|---|---|---|
| Male | Frequency | 612 | 62 | 77 | 72 | 35 | 45 | 27 | 73 | 17 |
| % within sex | 60% | 6.1% | 7.5% | 7.1% | 3.4% | 4.4% | 2.6% | 7.2% | 1.7% | |
| % within purpose | 64.2% | 37.1% | 46.7% | 43.9% | 71.4% | 65.2% | 44.3% | 47.7% | 37 % | |
| Female | Frequency | 341 | 105 | 88 | 92 | 14 | 24 | 34 | 80 | 29 |
| % within sex | 42.3% | 13% | 10.9% | 11.4% | 1.7% | 3.0% | 4.2% | 9.9% | 3.6% | |
| % within purpose | 35.8% | 62.9% | 53.3% | 56.1% | 28.6% | 34.8% | 55.7% | 52.3% | 63% | |
| Total | 953 | 167 | 165 | 164 | 49 | 69 | 61 | 153 | 46 | |
Cross-tabulation of trips by purposes per gender types.
4.2.5.2 Travel behavior per household income and employment
The amount of daily journeys undertaken by individuals is influenced by their employment status and occupation. In Bahir Dar, employed persons made an average of 2.43 daily trips, whereas unemployed individuals made 2.3 trips. Furthermore, individuals engaged in private business activities reported a greater frequency of travel, averaging 2.43 trips per day, whereas students showed the lowest rate of trips with 2.13 daily trips. In contrast to other studies, government employees have recorded the second-largest trip rates (2.4). This may be attributable to the fact that a considerable number of respondents reported that they were returning to their residences during lunchtime.
Despite urban travel behavior is inherently influenced by household monthly income, the findings of this study revealed that respondents with less monthly income made the highest trip rates. As the reason behind this was described by some respondents, these groups of participants were doing more trips for the sake of getting additional income for their households. However, when compared to the overall number of trips made daily per individual, these respondent categories had the lowest share of travel (0.4%). Persons with a household monthly income of ETB 10,001–15,000 made the highest share of trips (30%) and followed by respondents with a household income of ETB 6,001–10,000 who made 23% of the trips with an average rate of 2.4. In general, the majority of the trips were made by residents whose gross monthly income was below ETB 15,000. Therefore, this result suggests the need to develop low-cost transport means in the City (Table 6).
Table 6
| Income | Total number of trips | Percent | Average trips/ person/day |
|---|---|---|---|
| Below 3,000 | 16 | 0.4 | 2.7 |
| 3,001–6,000 | 553 | 12.9 | 2.4 |
| 6,001–10,000 | 985 | 23 | 2.34 |
| 10,001–15,000 | 1,282 | 30 | 2.4 |
| 15,001–20,000 | 682 | 16 | 2.33 |
| Above 20,000 | 758 | 17.7 | 2.4 |
| Total | 4,276 | 100 | 2.4 |
Travel characteristics by gross monthly income of households [in Ethiopian Birr (ETB)].
4.2.6 Travel distance variations based on demographics
4.2.6.1 Travel distance by gender
As travel distances can influence the travel behavior of men and women differently, the way people make travel decisions also varies based on their gender. The results of this study revealed that the average distance traveled by residents of Bahir Dar per trip was 2.9 km, taking into account a ±5% margin of error. As the results of the cross-tabulation analysis show (see Table 7), the majority of the trips (29.4%) made by the residents were between 2 and 2.9 km, with males accounting for 16.1% and females for 13.3% of trip shares. The second greatest proportion of trips (22.6%) was undertaken across distances of 1–1.9 km, with 10.9% of male trips and 11.7% of female travelers. The percentage of those participants who have made long-distance trips (i.e., greater than 5 km) was 10.8%, with 7.15% of males and 3.65% of female trips. The results indicated that the majority of residents traveled a relatively average distance for their daily activity participation.
Table 7
| Travel distance (km) | Male | Female | Total | |||
|---|---|---|---|---|---|---|
| Frequency | Percent | Frequency | Percent | Frequency | Percent | |
| < 1 | 40 | 2.2 | 37 | 2 | 77 | 4.2 |
| 1–1.9 | 200 | 10.9 | 213 | 11.7 | 413 | 22.6 |
| 2–2.9 | 294 | 16.1 | 243 | 13.3 | 537 | 29.4 |
| 3–3.9 | 225 | 12.3 | 158 | 8.7 | 383 | 21 |
| 4–4.9 | 131 | 7.2 | 88 | 4.8 | 219 | 12 |
| 5–9.9 | 115 | 6.3 | 61 | 3.3 | 176 | 9.6 |
| 10–20 | 14 | 0.8 | 6 | 0.3 | 20 | 1.1 |
| >20 | 1 | 0.05 | 1 | 0.05 | 2 | 0.1 |
| Total | 1,020 | 55.85 | 807 | 44.15 | 1,827 | 100 |
Average distance traveled by gender.
With respect to gender groups, the majority of both groups were predominantly traveling distances of less than 3 km. Additionally, the above summary result shows that the majority of short trips were undertaken by females, while longer travels were predominantly conducted by males.
4.2.6.2 Distance traveled by age
As travel distances vary among various age categories, participants were requested to provide their daily travel distances. For this analysis, the initial trips made by residents were taken into account. The cross-tabulation results indicated that the age group of 25–34 has made the majority of trips (27.8%), followed by the age category of 35–44 (26.8%), and the third largest share of trips was made by residents aged 15–24 with a share of 19.1%.
As depicted in Table 8, the largest proportion of journeys below 1 km and distances ranging from 1 to 9.9 km were attributed to the age groups of 35–44 and 25–34 constituting 30.7% and 28%, respectively. Among distances of 10–20 km, the predominant demographic of travelers was residents aged 35–44 (35.3%) and followed by the age groups of 25–34 and 45–54 having a trip share of 23.5% each. In terms of traveled distances within each age category, residents aged 15 to 44 made the majority of their daily journeys between 2 and 2.9 km, and those aged 55 and older made more trips within a distance of less than 2 km than at other distances.
Table 8
| Travel distance | 15–24 | 25–34 | 35–44 | 45–54 | 55–64 | Above 64 | Total | |
|---|---|---|---|---|---|---|---|---|
| < 1 | Frequency | 6 | 22 | 23 | 8 | 13 | 3 | 75 |
| % within travel distance | 8 | 29.3 | 30.7 | 10.7 | 17.3 | 4 | 100 | |
| % within age category | 1.7 | 4.3 | 4.7 | 2.7 | 9.2 | 6.5 | 4.1 | |
| 1–1.9 | Frequency | 90 | 115 | 113 | 42 | 30 | 20 | 410 |
| % within travel distance | 22 | 28 | 27.6 | 10.2 | 7.3 | 4.9 | 100 | |
| % within age category | 25.8 | 22.6 | 23.1 | 14.3 | 21.3 | 43.5 | 22.4 | |
| 2–2.9 | Frequency | 128 | 145 | 140 | 75 | 24 | 9 | 521 |
| % within travel distance | 24.6 | 27.8 | 26.9 | 14.4 | 4.6 | 1.7 | 100 | |
| % within age category | 36.7 | 28.5 | 28.6 | 25.6 | 17 | 19.6 | 28.5 | |
| 3–3.9 | Frequency | 72 | 102 | 96 | 80 | 29 | 3 | 382 |
| % within travel distance | 18.8 | 26.7 | 25.1 | 20.9 | 7.6 | 0.8 | 100 | |
| % within age category | 20.6 | 20.1 | 19.6 | 27.3 | 20.6 | 6.5 | 20.9 | |
| 4–4.9 | Frequency | 26 | 65 | 64 | 39 | 26 | 5 | 225 |
| % within travel distance | 11.6 | 28.9 | 28.4 | 17.3 | 11.6 | 2.2 | 100 | |
| % within age category | 7.4 | 12.8 | 13.1 | 13.3 | 18.4 | 10.9 | 12.3 | |
| 5–9.9 | Frequency | 23 | 55 | 48 | 45 | 18 | 6 | 195 |
| % within travel distance | 11.8 | 28.2 | 24.6 | 23.1 | 9.2 | 3.1 | 100 | |
| % within age category | 6.6 | 10.8 | 9.8 | 15.4 | 12.8 | 13 | 10.7 | |
| 10–20 | Frequency | 2 | 4 | 6 | 4 | 1 | 0 | 17 |
| % within travel distance | 11.8 | 23.5 | 35.3 | 23.5 | 5.9 | 0 | 100 | |
| % within age category | 0.6 | 0.8 | 1.2 | 1.4 | 0.7 | 0 | 0.9 | |
| >20 | Frequency | 2 | 0 | 0 | 0 | 0 | 0 | 2 |
| % within travel distance | 100 | 0 | 0 | 0 | 0 | 0 | 100 | |
| % within age category | 0.6 | 0 | 0 | 0 | 0 | 0 | 0.1 | |
| Total | Frequency | 349 | 508 | 490 | 293 | 141 | 46 | 1827 |
| % within travel distance | 19.1 | 27.8 | 26.8 | 16 | 7.7 | 2.5 | 100 | |
Travel distance by the age of respondents.
In general, the results revealed that the age groups of 15–24 and the elderly mainly tend to travel shorter distances than the other age groups. The “middle–aged groups” of 25–44 travel more frequently and farther distances than others. And, residents over the age of 54 travel more frequently in shorter distances than other age groups, and the other age categories are dominant in making more frequent trips over average distances (2–3.9 km).
4.2.6.3 Distance traveled by purpose
There are reasons why Bahir Dar dwellers travel longer or shorter distances. The findings found that the majority of residents made short travels primarily for religious purposes; medium trips for job, shopping, education, health, social affairs, and leisure activities; and comparatively longer trips to obtain administrative services (Table 9).
Table 9
| Distance traveled (km) | Percentage of travel purpose | Total | ||||||||
|---|---|---|---|---|---|---|---|---|---|---|
| Work | Shopping | Education | Social affairs | Recreation | Administrative services | Health services | Worship | Others | ||
| < 1 | 2 | 3 | 1.8 | 4.9 | 6.1 | 5.8 | 1.6 | 19.6 | 4.3 | 4.1 |
| 1–1.9 | 18.9 | 25.7 | 27.9 | 15.9 | 16.3 | 26.1 | 23 | 39.9 | 30.4 | 22.4 |
| 2–2.9 | 28.5 | 31.1 | 40 | 30.5 | 34.7 | 18.8 | 24.6 | 13.7 | 32.6 | 28.5 |
| 3–3.9 | 22 | 21 | 16.4 | 22 | 26.5 | 37.7 | 24.6 | 7.8 | 17.4 | 20.9 |
| 4–4.9 | 14.5 | 15 | 5.5 | 9.1 | 6.1 | 7.2 | 9.8 | 13.1 | 8.7 | 12.3 |
| 5–9.9 | 12.8 | 3.6 | 8.5 | 14 | 10.2 | 4.3 | 16.4 | 5.9 | 6.5 | 10.7 |
| 10–20 | 1.3 | 0.6 | 0 | 2.4 | 0 | 0 | 0 | 0 | 0 | 0.9 |
| >20 | 0 | 0 | 0 | 1.2 | 0 | 0 | 0 | 0 | 0 | 0.1 |
Heat map of the distribution of activities by travel distance.
As shown on the distribution heat map of activities by travel distance, the average distance traveled for worship (2 km), education (2.52 km), health services (2.67 km), shopping (2.7 km), leisure (2.85 km), and social affairs (2.88 km) trips were below the average travel distance, considering a ±5% error. Moreover, residents were traveling more than the average distance to work (3.62 km) and to get administrative services (2.92 km).
4.2.7 Structural equation model and results
Travel decisions and behaviors, as discussed in Section 2, are influenced by a range of socio-demographic, economic, built environment, and transport system attributes. In this study, the researchers have employed Structural Equation Modeling (SEM) to investigate the potential relationships and effects of these exogenous factors on travel behavior in emerging cities of developing countries like Bahir Dar. First, the measurement sub-model, called confirmatory factor analysis (CFA), was done to investigate how well the observed factors/indicators measure the latent variables and subsequently to exclude observed exogenous variables that do not have significant relationships with unobserved latent variables. Then, evaluation of factor loadings and correlations between the latent constructs and the exogenous factors was done to identify the main indicators. In this step, a loading factor greater than 0.4 with 5% significance and a Cronbach's alpha > 0.7 for each item and latent construct was considered as a significant factor loading (Cheung et al., 2024). Based upon these criteria, the availability and number of public transport means such as motorcycles, mini-buses and midi-buses within households were not found significant under the vehicle ownership latent construct, and therefore they were reduced in the final CFA model.
Next, the final measurement model was developed with 14 observed variables and four latent variables. These latent variables and their indicators include: (i) economic characteristics which was related to employment type, occupation and gross household income; (ii) transport system attributes which was related to access to multiple public transport options, frequency and reliability of public transport services, average travel time to destination and distance to the nearest transit stops; (iii) land use which was related to residential location, land use mix and distance from city center; and (iv) vehicle ownership which was described by the availability of bicycle, bajaj, automobile and other public transport means. The results of the observed variables and latent constructs of the measurement model were evaluated on the basis of the CFA results, which are summarized in Table 10. The findings demonstrated that all the CFA item values were above the loading factor threshold of 0.4 and were significant at p = 0.05. The results of Cronbach's alpha were also within the range of 0.72–0.91, with all values exceeding the minimum recommended value of 0.7 (Byrne, 2010).
Table 10
| Latent variables | Relationship directions | Observed variables | Code | Factor loading | SE | P | Cronbach alpha |
|---|---|---|---|---|---|---|---|
| Economic characteristics | → | Employment type | EmpTy | 0.93 | 0.891 | *** | 0.91 |
| Economic characteristics | → | Occupation | OCC | 0.88 | 1.591 | *** | |
| Economic characteristics | → | Household Income | INC | 0.99 | 0.918 | *** | |
| Transport system attributes | → | Access to public transport options | APT | 0.95 | 1.061 | ||
| Transport system attributes | → | Frequency and reliability of public transport services | FRPTS | 0.89 | 0.875 | *** | 0.89 |
| Transport system attributes | → | Average travel time to destination | ATTD | 0.86 | 1.692 | *** | |
| Transport system attributes | → | Distance to the nearest transit stops | DT | 0.77 | 3.615 | *** | |
| Land use | → | Residential location | ResLoc | 0.91 | 2.036 | *** | 0.72 |
| Land use | → | Land use mix | LUMix | 0.85 | 1.214 | *** | |
| Land use | → | Distance from the city center | DCBD | −0.49 | 2.033 | *** | |
| Vehicle ownership | → | Bicycle | BK | 0.91 | 1.253 | *** | 0.84 |
| Vehicle ownership | → | Bajaj | BJ | 0.94 | 1.224 | *** | |
| Vehicle ownership | → | Automobile | AUTO | 0.82 | 2.760 | *** | |
| Vehicle ownership | → | Other public transport means | OTHER | 0.69 | 3.013 | *** | |
| Relationships between latent constructs | |||||||
| Economic ↔ Transport system attributes | 0.87 | 2.397 | *** | ||||
| Economic ↔ Land use | 0.79 | 2.074 | *** | ||||
| Economic ↔ Vehicle ownership | 0.96 | 1.089 | *** | ||||
| Transport system attributes ↔ Land use | 0.81 | 2.009 | *** | ||||
| Transport system attributes ↔ Vehicle ownership | 0.84 | 1.017 | *** | ||||
| Land use ↔ Vehicle ownership | 0.43 | 27.102 | *** | ||||
Factor loadings (Standardized) results of the CFA measurement model.
Factor loadings are standardized regression weights in AMOS. *** indicates that all factor loadings are significant at P < 0.05.
The model was also subjected to the goodness of fit test and all the indices assessed in the measurement model results has showed satisfactory fit with Chi-square per degree of freedom (χ2/df ) = 2.884; Comparative Fit Index (CFI) = 0.925, Goodness-of-Fit Index (GFI) = 0.920, Root Mean Square Error of Approximation (RMSEA) = 0.071, and Normal Fit Index (NFI) = 0.912.
Looking into relationships between variables (see Figure 8), the measurement model results demonstrated that each observed indicator and each latent variable were related to one another, as all values were within the range of −0.49 to 0.99. Except for the indicator “distance from city center” (factor loading = −0.49), all observed variables were positively correlated with the latent variables. Furthermore, the economic characteristics of households had significant correlations with household income, employment status, and occupation type of the participants with standardized loading factor results ranging from 0.88 to 0.99. Likewise, the observed variables of frequency and reliability of public transport services, access to multiple public transport options, average travel time to destination, and distance to the nearest transit stops also had significant positive effects on transport system attributes.
Figure 8
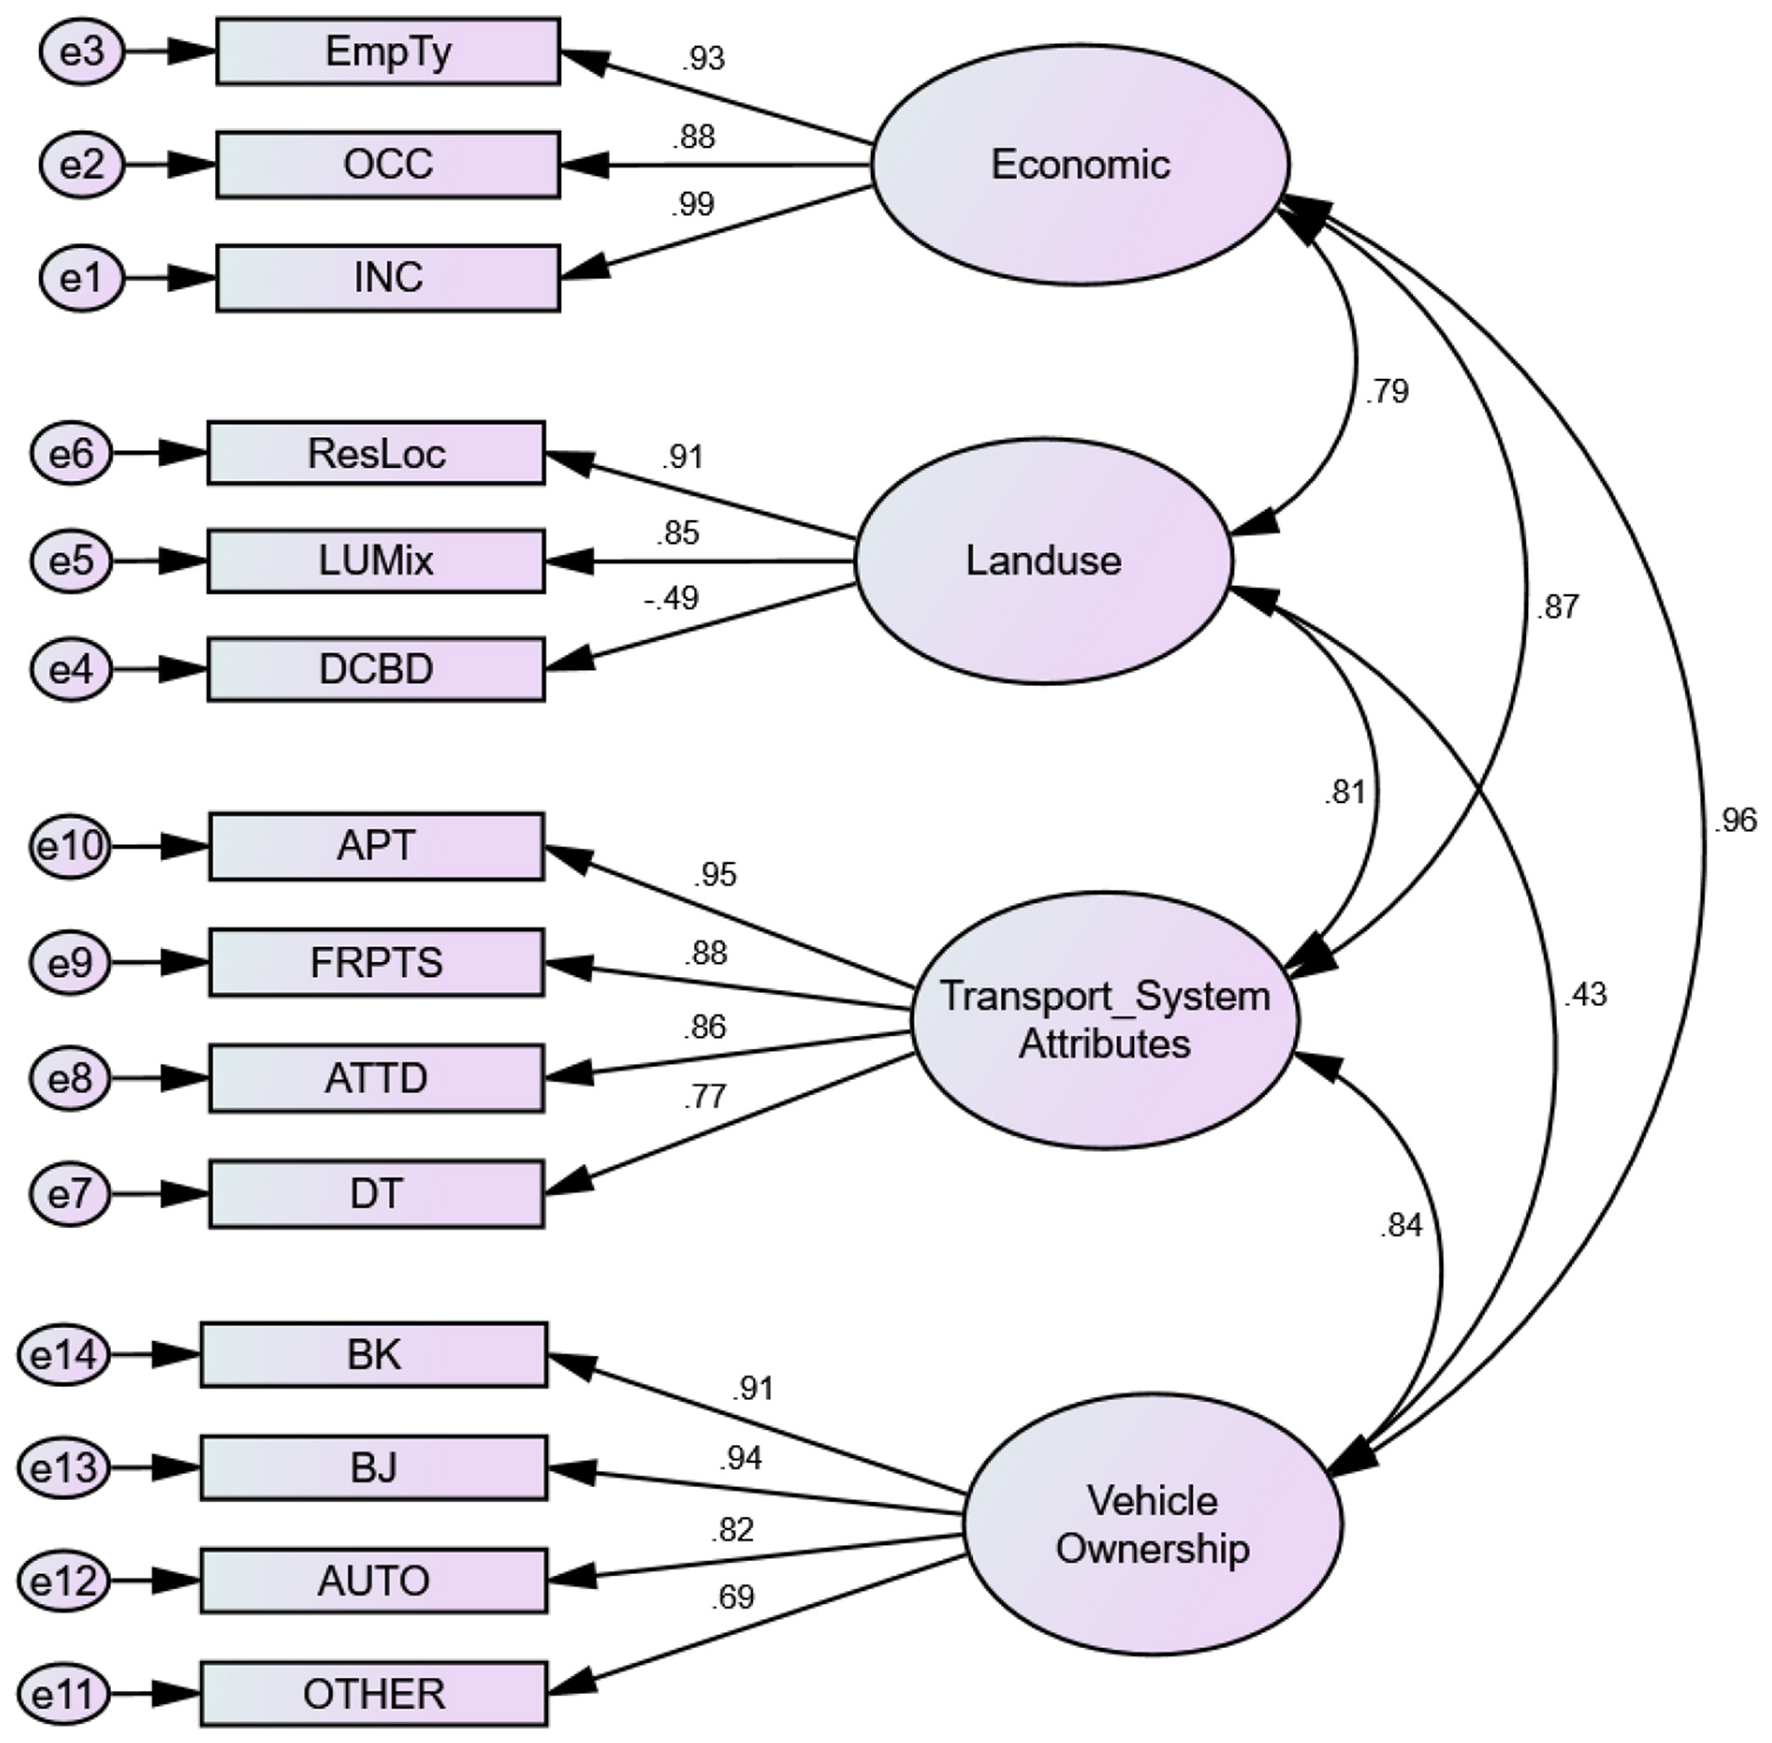
Path diagram of measurement model, showing the relationship between indicator variables and latent constructs.
With respect to the measurement of land use, residential location and land use mix had positive and high factor loads on this construct (loading factor of 0.91 and 0.85, respectively). However, “distance from city center” showed a negative and relatively low factor load result on the land use construct (loading factor = −0.49). In addition, the CFA analysis has demonstrated moderate to strong relationships among the latent construct vehicle ownership and its indicators. Therefore, the availability and number of bicycles, bajajs, automobiles, and other public transport means in households can predict the influence of vehicle ownership on travel behavior. Finally, the interrelationships among latent constructs were also evaluated in the measurement model. The CFA results have shown a positive correlation among these constructs, with values ranging from 0.43 to 0.96.
In the next step, the four latent factors and six personal attribute-related observed variables (without latent variables) were defined in the structure model to better understand the interrelationships between these exogenous variables and the endogenous variable. As illustrated on the path diagram (see Figure 9), the final structure model takes into account travel behavior as an endogenous variable, and gender (GEN), age (AGE), education (EDU), household Size (HHs), number of workers in households (NWHH) and possession of a driving license (PDL) as exogenous observed variables. Additionally, economic characteristics, transport system attributes, land use characteristics and vehicle ownership, along with their respective indicators, were defined as latent variables. The observed variables were supposed to have a direct influence on individual trip patterns, and each latent variable has its own explanatory indicators to establish relations with the characteristics of travel behavior. In addition, the total number of trips made per person per day in Bahir Dar city was the metric used to characterize the dependent variable “travel behavior.”
Figure 9
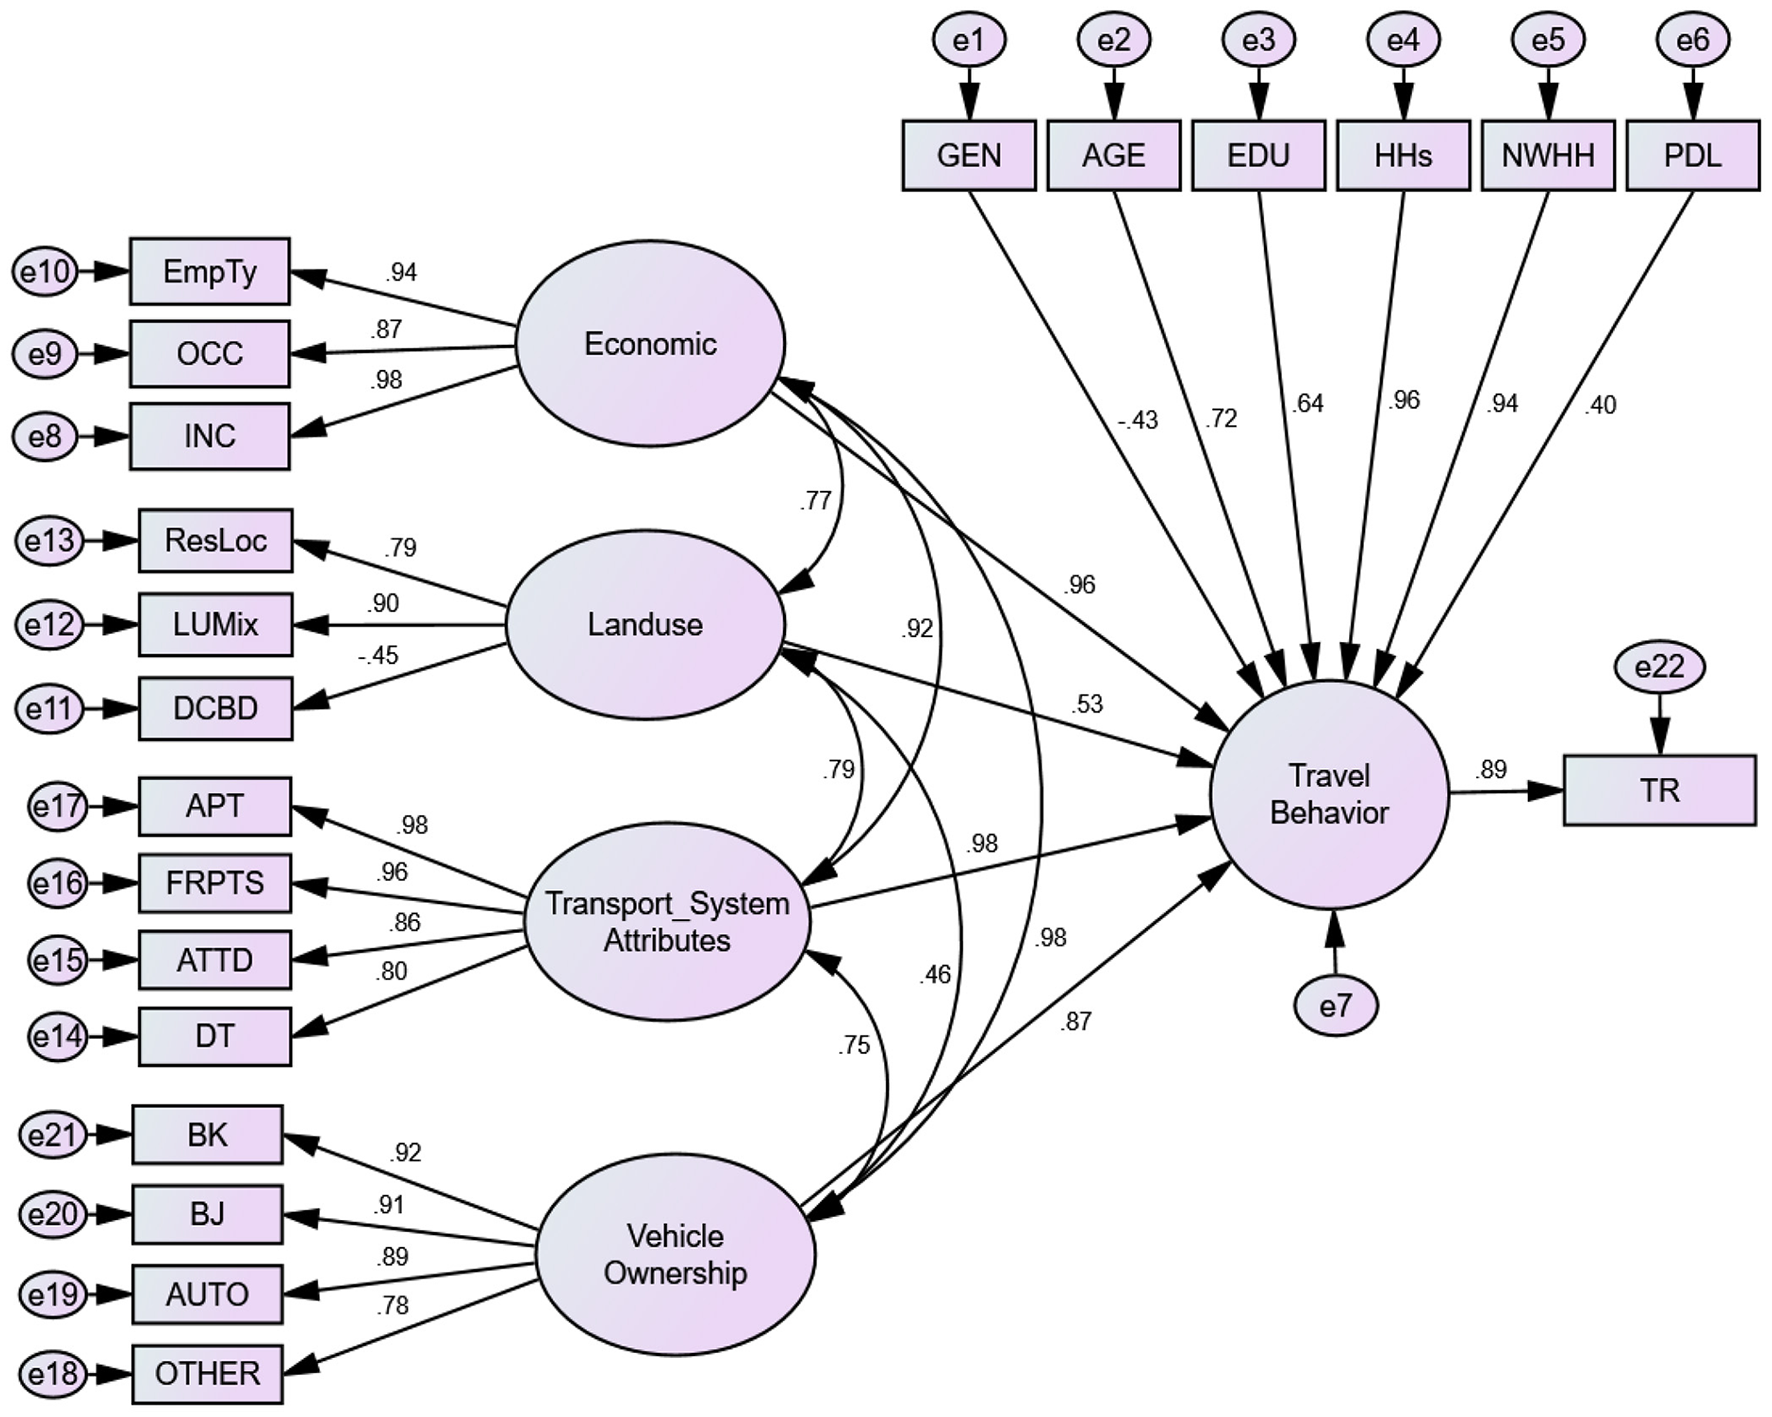
Path diagram of an identified SEM, showing the effects of observed and latent variables on the frequency of travel patterns.
The model's parameters were estimated using the maximum likelihood method, which generates path coefficients as illustrated on the arrows indicating the direction from the exogenous variables, including latent factors, to the endogenous variable (see Figure 9). Consequently, the overall goodness-of-fit indices were used to validate the model in this step, and the results demonstrated that the data strongly supported the predicted directional effects between the exogenous and endogenous variables. The SEM was well-fitted with a chi-square (χ2) statistic (CMIN) of 1,561, degrees of freedom (df ) of 389, Goodness-of-Fit Index (GFI) of 0.937, Root Mean Square Error of Approximation (RMSEA) of 0.051, Comparative Fit Index (CFI) of 0.918, and Normal Fit Index (NFI) of 0.904. The results indicated that all the reported model fit indices exceeded the commonly recommended thresholds: CFI and GFI are above 0.90 (Hu and Bentler, 1999; Kline, 2016), RMSEA falls within the acceptable range of 0.05–0.08 (Browne and Cudeck, 1993), and NFI meets the cutoff value of 0.90 (Bentler and Bonett, 1980; Byrne, 2016).
In this study, it was assumed that the four latent factors that influence travel behavior are interconnected and influence each other. As a result, the SEM model on travel behavior takes into account the effects of these interrelationships too. Even though the path coefficients are displayed on the path analysis (see Figure 9 and Table 11), the interrelations explored within the structure model framework are excluded from interpretation due to a lack of space. Overall, the analysis result proved that travel characteristics of individuals were influenced by all of the defined attributes of residents in the study area. The standardized regression weights (β) of these factors ranged from 0.40 to 0.98, indicating a significant influence at the 0.05 level. From these factors, transport system attributes (β = 0.98), economic characteristics (β = 0.96), household size (β = 0.96), and number of workers in households (β = 0.94) had strong effects in determining travel behavior. However, individual characteristics such as gender (β = −0.43) and possession of a driving license (β = 0.40) have shown less impact on travel behavior. This finding suggests that households with relatively high monthly incomes, large family sizes, and a high number of workers, as well as those who had good accessibility and frequency of various public transport options in their neighborhoods were tended to make more frequent daily trips.
Table 11
| Variables | Relationship directions | Variables | β | S.E. | C.R. | P |
|---|---|---|---|---|---|---|
| Gender (GEN) | → | Travel behavior | −0.43 | 3.920 | −0.110 | 0.049 |
| Age (AGE) | → | Travel behavior | 0.72 | 0.116 | 6.207 | *** |
| Education (EDU) | → | Travel behavior | 0.64 | 0.129 | 4.961 | 0.016 |
| Household Size (HHs) | → | Travel behavior | 0.96 | 0.077 | 12.467 | *** |
| No. of workers in households (NWHH) | → | Travel behavior | 0.94 | 0.089 | 10.562 | *** |
| Possession of Driving License (PDL) | → | Travel behavior | 0.40 | 8.031 | 0.050 | 0.058 |
| Economic characteristics | → | Travel behavior | 0.96 | 0.063 | 15.238 | 0.009 |
| Transport system attributes | → | Travel behavior | 0.98 | 0.057 | 17.193 | *** |
| Land use | → | Travel Behavior | 0.53 | 3.101 | 0.171 | 0.037 |
| Vehicle ownership | → | Travel behavior | 0.87 | 0.068 | 12.794 | *** |
| Economic characteristics | → | EmpTy | 0.94 | 0.091 | 10.330 | 0.021 |
| Economic characteristics | → | OCC | 0.87 | 0.076 | 11.447 | 0.033 |
| Economic characteristics | → | INC | 0.98 | 0.063 | 15.555 | *** |
| Transport system attributes | → | APT | 0.98 | 0.085 | 11.529 | *** |
| Transport system attributes | → | FRPTS | 0.96 | 0.097 | 9.897 | *** |
| Transport system attributes | → | ATTD | 0.86 | 1.100 | 0.782 | 0.042 |
| Transport system attributes | → | DT | 0.80 | 1.005 | 0.796 | 0.011 |
| Land use | → | ResLoc | 0.79 | 1.030 | 0.767 | 0.028 |
| Land use | → | LUMix | 0.90 | 0.099 | 9.091 | 0.035 |
| Land use | → | DCBD | −0.45 | 2.013 | −0.224 | 0.062 |
| Vehicle ownership | → | BK | 0.92 | 0.061 | 15.082 | 0.026 |
| Vehicle ownership | → | BJ | 0.91 | 0.145 | 6.276 | *** |
| Vehicle ownership | → | AUTO | 0.89 | 0.204 | 4.363 | 0.037 |
| Vehicle ownership | → | OTHER | 0.78 | 0.308 | 2.532 | 0.043 |
| Travel behavior | → | Number of trips made per day (TR) | 0.89 | 0.046 | 19.348 | *** |
Estimated path coefficient results for the SEM of urban mobility behavior.
NB: ***indicates statistical significance at P < 0.001.
The findings also revealed that respondents' age and educational status had a strong impact on the frequency of trips, compared to other personal attributes, with standardized regression weights (β) of 0.72 and 0.64, respectively. These coefficients show that an increase of one unit in the age category (except for the elderly group) and education status results in an increase of 0.72 and 0.64 units of daily trips, respectively. From this, it can be generalized that youths, and those with secondary education or above status have made more frequent trips daily (see Figure 9).
The model also takes into account the sex of respondents in order to determine whether the type of gender has an impact on the travel patterns of individuals in urban areas. As indicated in the path diagram, the coefficient result of gender is −0.43, depicting that the probability of making frequent trips was determined by sex differences with a difference of 0.43 units. The fact that this coefficient is negative indicates that, as also demonstrated in the descriptive results of the above analysis, males were more likely to make frequent daily trips than females.
From the latent factors examined in the model, economic characteristics and transport system attributes have shown substantial influence on the travel behavior of residents. As shown in Table 11 and Figure 9, how access to different transport options influences travel patterns was evaluated using its four indicators. The result has revealed that access to public transport options (β = 0.98) and frequency and reliability of public transport services (β = 0.96) were the most explanatory variables of transport system attributes that influence travel patterns, with an overall path coefficient of 0.98. The model results also indicated that the path coefficient for economic characteristics suggests a strong effect on the frequency of travel patterns. From the indicators of this factor, the income status of households and the employment type of persons had great roles in influencing the daily trip rates of individuals.
It is evident that the act of traveling is closely associated with the ownership of vehicles and land use attributes. The results of the study also supported that the availability and number of vehicles in a household had a significant effect on the trip-making behavior of persons and households. Further, the influence of car ownership was best explained by the availability and number of bicycles (β = 0.92), bajajs (β = 0.91), and automobiles (β = 0.89), showing considerable effect on trip making. Regarding the effect of land use on travel behavior, the result showed that land use characteristics have comparatively less effect on the frequency of trip-making with a path coefficient of 0.53. From its indicators, residence distance from the city center was insignificant at 5% level of significance. This implies that the frequency of trips was influenced by residential location and land use mix than other land use attributes.
4.3 Discussions
The travel characteristics of residents and their influencing factors are discussed below using various indicators such as travel rate, travel time consumption, travel purpose, travel mode and travel distances based on the socio-demographic and economic characteristics of households.
The mobility behavior of people in urban areas is often described by trip frequency, travel distance, travel time and duration (Lee et al., 2023; Lomax and Schrank, 2002; Wang and Renne, 2023). In this regard, Bahir Dar residents made moderate daily travels (2.4), and 6.3% of residents made complex trips per day. Concerning the regularity of travel habits, the majority of the respondents had a habit of making unplanned trips unlike the developed nations. The findings of some studies (such as Dumbliauskas and Grigonis, 2020) stated that the average number of trips in Vilnius city was also relatively similar to that of Bahir Dar city, with an average of 2.3 trips per weekday. Similarly, a study done by Salon and Gulyani (2010) discovered that Nairobi residents reported an average of 2.3 trips per day, while Kisumu residents averaged 1.2 trips. However, the average number of travels in the EU cities, UK and Russia was higher than Bahir Dar constituting 2.8, 2.7, and 3.1 daily trips per person, respectively (Saveleva and Lorens, 2019). The travel study of Germany has also shown that the average number of mobility rates was also higher, having 3.1 trips per person/day in 2017 (BMDV, 2017). In addition, the travel rates in Brussels have shown a significant divergence from those in Bahir Dar, with an average trip rate of 3.55 and a complex travel percentage of 13% in 2023 (Brussels Regional Public Service, 2023). From this, one can conclude that the frequency of trips varies among persons based on their characteristics regionally and globally.
There are notable gender and socio-economic disparities in travel patterns. Females make fewer trips and are less likely to travel by car but more likely to travel by walking and para-transit (Foley et al., 2022). In Bahir Dar, the findings of this study also showed that females have made 44.2% of trips with a daily trip rate of 2.33 which is lower than from males by 0.17. In this context, the experience of Brussels parallels that of Bahir Dar, where Brussels males engage in travel more frequently per day (averaging 3.01 trips) compared to women who made 2.83 trips (Brussels Regional Public Service, 2023). However, there were no remarkable gender differences in terms of travel rates among people between the ages of 20 and 60 years in Beijing (Zhang et al., 2008). According to Foley et al. (2022), there were broader societal influences on mobility, including household influences such as parents controlling children's mobility, across sub-Saharan Africa. This made females to carry out lower trips than males.
Regarding travel characteristics across age groups, research shows that older adults travel less than younger ones (Ozbilen et al., 2024; Rahman et al., 2019; Szeto et al., 2017). For instance, Dumbliauskas and Grigonis (2020) found that the most mobile groups were middle-aged (20–49) urban dwellers whereas elders (50 years and over) made almost one trip less during any given weekday. The result of this study has also supported the finding mentioned above that elders travel less frequently and shorter distances per day than other groups in Bahir Dar. Unlike other findings, the findings have disclosed that relatively younger age groups who were expected to make more frequent daily trips have also shown a tendency to travel less frequently and shorter distances per day.
Economic status and employment are also significantly influences travel behavior, as mobility decreases during economic downturns as a result of reduced employment and discretionary spending (Akabane et al., 2017; Meyer, 2016; Rahman, 2008). With increased income, the number of trips increases, and commensurately the percent of those taking public transportation decreases (Martin et al., 2016). Moreover, socio-economically disadvantaged families travel less in both developing and industrialized countries (Ahmad and Puppim de Oliveira, 2016; Chapman, 2007; Stead and Marshall, 2001). There is also some limited evidence that lower-income households make fewer trips (Foley et al., 2022). In the MENA and South Asian cities, low-income people have lower trip rates (2.4) than non-low-income individuals (2.56). Chaudhry et al. (2023) and Salon and Gulyani (2010) also supported that individuals with lower economic status make fewer trips and travel shorter distances. In contrast to these findings, the majority of the trips in Bahir Dar were made by residents whose gross monthly income was less than ETB 15,000, making it different from other studies. This was occurred due to the reason that low-income groups were undertaking multiple short to medium trips to various destinations, and a significant share of them were engaged in the informal economy to meet their financial needs.
When looking at the temporal patterns of traveling, commuter trips generally peak between 7:00 to 9:00 AM and 4:00 to 7:00 PM (Meyer, 2016). Likewise, the most intensive hours during the A.M. peak period were between 7:00 and 9:00 and 17:00–19:00 during the P.M. period in Bahir Dar. A study carried out by Tetsuro et al. (2005) also showed that Tripoli and Cairo had the most pronounced AM peak, with about 30% of all trips departing around 7 AM. And, there was an earlier morning peak (6 AM) for Jakarta, Managua, and Manila, owing perhaps to sprawl or congested or unpredictable traffic. The time spent by travelers to complete their travel is also different across countries. The average travel duration in Bahir Dar was 35 min, 23.7 min in Brussels (Brussels Regional Public Service, 2023), and 44 min for public transportation and 24 min for private transportation in the US (US Census Bureau, 2014 cited in Saveleva and Lorens, 2019). This shows the level of heterogeneity of the average trip durations in cities of different geographical settings.
Concerning travel distances, individuals travel long distances in order to access resources, opportunities and valued destinations in Eastern Africa (Foley et al., 2022). The findings of this study showed that the average distance traveled by Bahir Dar residents was 2.9 km per trip, which is a relatively moderate distance. In contrast to this study, individuals cover longer distances in other cities within developed countries such as the United States, the United Kingdom, and many European cities. For example, the average travel distance in Brussels was 7.7 km (Brussels Regional Public Service, 2023), approximately 20 km in Russia (Blinkin and Muleev, 2016), and in the United Kingdom and the United States around 29 and 58 km, respectively (Saveleva and Lorens, 2019). Based on gender, females were comparatively dominant on short trips, while males were characterized by longer travels both in Bahr Dar and Brussels. This suggests that there are significant disparities in the mobility characteristics of people between countries and even within urban areas.
A variety of socio-demographic, economic, spatial, and transport system-related factors influence the frequency and behavior of trips that individuals or households undertake. Due to the complex interactions between these factors, there are significant disparities among trip-makers. In order to explore these relationships and identify the most influential factors, structural equation modeling (SEM) was employed. The result revealed that there were significant associations (P < 0.05) between travel behavior and respondents' socio-demographic, economic, spatial, and transport system attributes. Moreover, the travel behavior of Bahir Dar was highly influenced by the transport system attributes of the city (β = 0.98), economic characteristics of households (β = 0.96), household size (β = 0.96) and number of workers in households (β = 0.94). In addition, age and vehicle ownership also had a significant impact on the frequency of trips. Likewise, a study carried out by Okeke et al. (2021) also supported that socio-economic characteristics, car availability and ownership, affordable price of transport, and waiting time were among the determinants that affected travel behavior of commuters in Enugu urban. Another study done by Mwale et al. (2025) identified that trip purpose, travel time, cost and willingness to pay were the primary determinants of trip making and mode choice in Lusaka, Zambia. In Kenyan cities like Nairobi and Kisumu, travel behavior was also significantly influenced by income levels, vehicle ownership, and employment status (Salon and Gulyani, 2010). This shows that socio-economic and transport-related characteristics have a strong impact on urban mobility in cities of developing countries. However, person attributes such as gender (β = −0.43) and possession of a driving license (β = 0.40) did not show a strong impact on travel behavior. Other studies such as Ma et al. (2014) and Alizadeh and Sharifi (2023) also disclosed that the effect of gender on mobility patterns was relatively low. This is due to the reason that travel was related to gendered cultural, religious and social expectations in sub-Saharan Africa. Specifically, women were seen as predominantly immobile homemakers who structured their travel around household responsibilities, while men were idealized as mobile breadwinners (Foley et al., 2022).
In emerging cities of developing countries, transport system attributes are also essential factors influencing travel behavior. In this regard, the results of this study have demonstrated a strong association between trip-making patterns and both access to public transportation options and the frequency and reliability of public transport services in Bahir Dar city. Furthermore, Fondzenyuy et al. (2024) discovered that public transport attributes such as affordability, travel time, and comfort/convenience were the main factors influencing mobility and mode choice. Except for availability and reliability factors, these factors were also similar in metropolitan areas of Bangkok, Kuala Lumpur, Manila, and Nagoya (Dissanayake et al., 2012). In Petaling Jaya, Malaysia, factors such as attitude, subjective norms (including social pressure from family, friends, and colleagues), station distance, and travel time play a great role in determining the decision to make trips by rail transit (Madha et al., 2016).
Concerning residential influence, the study conducted by Okeke et al. (2021) and Ma et al. (2014) stated that urban form-related factors have significant impacts on the travel behavior of residents. Similarly, a study by Foley et al. (2022) indicated that among low-income households, those living in peripheral areas experienced more travel difficulties than those residing in central locations. However, the relationship and effect of land use features in Bahir Dar were not strong compared to other factors.
5 Conclusions and recommendations
This study has focused on investigating the mobility behavior and its relationships with individuals and household characteristics in emerging cities by taking Bahir Dar as a case. Therefore, this research is expected to provide academic and practical contributions by addressing the literature gap regarding travel behaviors and its influencing factors in the Sub-Saharan countries.
The results have demonstrated that the travel behavior of the residents varies among persons based on their characteristics both locally and globally. In general, the average trip rate of Bahir Dar residents was 2.4 daily trips per person, and the majority of them did not have a habit of undertaking pre-planned trips. Additionally, the average travel time per trip was 35 min within the City. The residents made trips mainly for work, shopping and educational purposes. In contrast to earlier studies conducted in developed countries, trips for social affairs and religious worship were also major factors that pushed residents to make trips.
The research revealed that people's travel characteristics vary in terms of the socio-economic and demographic characteristics of residents. Notable disparities in travel frequencies and activity engagements were seen between gender categories, with females exhibiting a lower rate (2.33) compared to males (2.5). Females were more likely to travel for shopping, family, and social obligations, whereas males were more likely to travel for work and business-related activities. Furthermore, females and the elderly have made fewer and shorter-distance travels compared to other groups. Unlike other studies, as noted in the discussion section, a relatively young group of populations in Bahir Dar has primarily engaged in less frequent and shorter-distance travels. This finding deviates from the actual population statistics, underscoring the need for additional investigation to explain the reason, as both the country and the City are characterized by a predominantly young population. In economic terms, the travel behavior of Bahir Dar residents was highly characterized by inconsistency. However, it can be suggested that those households with a monthly income of less than ETB 15,000 (more specifically, low-income groups) have recorded the highest trip rates. This suggests that the City requires the provision of affordable, accessible, and equitable transportation options.
A structural equation model was employed to investigate the effect of personal attributes, economic characteristics, transport system attributes, land use characteristics and vehicle ownership on travel behavior. The SEM findings have shown that transport system attributes, economic characteristics, household size, and number of workers in households had strong effects in determining the travel behavior of residents. Nevertheless, gender and possession of a driving license were found to be less significant in influencing the travel behavior of persons. In addition, despite the research results that residential location and other urban form attributes are significant factors in defining travel characteristics in the majority of Western nations, the model hypothesis did not prove the expected high impact of land use variables on the trip-making behavior of individuals.
Therefore, this study suggests the following recommendations based on its findings. (i) The City has to consider the travel variations that arise as a result of differences in socio-demographic, economic and person's attributes when preparing spatial and transport plans and developing transport policies. (ii) Considering the low level of car ownership and the majority of participants were relying significantly on public transportation modes, specifically Bajaj and Minibus services for their daily journeys, it is crucial to enhance the public transport services available in the City. Therefore, expanding access to transportation across both central and peripheral areas of the city, enhancing the existing public transport infrastructures, and increasing service quality of the public transport system are suggested to meet the mobility needs of the residents. (iii) In order to adequately meet the travel requirements of women, the elderly, and those in low-income groups, it is necessary to provide transport options that are not only equitable but also easily accessible and cost-effective. Accordingly, incorporating the travel needs of these demographic groups into transport planning and land-use decision-making is essential for addressing urban mobility challenges and fostering the development of livable cities in emerging cities. Furthermore, it is important to provide affordable public transport schemes, including subsidies or fare reductions, specifically targeting the elderly, women and low-income populations.
Statements
Data availability statement
The raw data supporting the conclusions of this article will be made available by the authors, without undue reservation.
Ethics statement
The studies involving humans were approved by Ethiopian Institute of Architecture, Building Construction and City Development, Addis Ababa University. The studies were conducted in accordance with the local legislation and institutional requirements. Written informed consent for participation in this study was provided by the participants' legal guardians/next of kin.
Author contributions
TK: Writing – review & editing, Software, Methodology, Supervision, Conceptualization, Investigation, Writing – original draft, Funding acquisition, Visualization, Data curation, Resources, Project administration, Validation, Formal analysis. BW: Funding acquisition, Conceptualization, Validation, Writing – review & editing, Supervision, Methodology, Data curation, Project administration. WE: Supervision, Methodology, Writing – review & editing, Data curation, Validation, Conceptualization. JU: Methodology, Validation, Formal analysis, Writing – review & editing, Visualization, Software, Data curation, Resources, Conceptualization. SS: Resources, Data curation, Validation, Funding acquisition, Project administration, Supervision, Writing – review & editing, Methodology. MB: Resources, Funding acquisition, Validation, Data curation, Writing – review & editing, Supervision, Conceptualization, Methodology. PS: Funding acquisition, Validation, Project administration, Supervision, Writing – review & editing, Methodology, Data curation, Resources.
Funding
The author(s) declare that financial support was received for the research and/or publication of this article. The authors acknowledge that the household travel survey data used in this study was funded by the Integrated Urban Mobility (INUMO) project, which is financed by Bauhaus-Universität Weimar (BUW), Germany.
Acknowledgments
The authors express their gratitude to the participants of the household travel survey conducted in Bahir Dar. The authors thank Addis Ababa University for providing a research fellowship through the Swedish International Development Agency (SIDA) fund and the University of Hasselt in Belgium for hosting the corresponding author's 3-month study visit. We also acknowledge the Ethiopian Civil Service University for sponsoring the corresponding author's study as an employer.
Conflict of interest
The authors declare that the research was conducted in the absence of any commercial or financial relationships that could be construed as a potential conflict of interest.
Generative AI statement
The author(s) declare that no Gen AI was used in the creation of this manuscript.
Any alternative text (alt text) provided alongside figures in this article has been generated by Frontiers with the support of artificial intelligence and reasonable efforts have been made to ensure accuracy, including review by the authors wherever possible. If you identify any issues, please contact us.
Publisher’s note
All claims expressed in this article are solely those of the authors and do not necessarily represent those of their affiliated organizations, or those of the publisher, the editors and the reviewers. Any product that may be evaluated in this article, or claim that may be made by its manufacturer, is not guaranteed or endorsed by the publisher.
Supplementary material
The Supplementary Material for this article can be found online at: https://www.frontiersin.org/articles/10.3389/frsc.2025.1687436/full#supplementary-material
References
1
Abeje W. (2020). Urban Clean Mobility and Transit in Ethiopia. Washington, DC: Center for Strategic & International Studies.
2
Abrahamse W. Steg L. Gifford R. Vlek C. (2009). Factors influencing car use for commuting and the intention to reduce it: a question of self-interest or morality? Transport. Res. Part F Traffic Psychol. Behav.12, 317–324. doi: 10.1016/j.trf.2009.04.004
3
Ahmad S. Puppim de Oliveira J. A. (2016). Determinants of urban mobility in India: Lessons for promoting sustainable and inclusive urban transportation in developing countries. Transport Policy50, 106–114. doi: 10.1016/j.tranpol.2016.04.014
4
Ajzen I. (1991). The theory of planned behavior. J. Org. Behav. Hum. Decision Process.50, 179–211. doi: 10.1016/0749-5978(91)90020-T
5
Akabane A. T. Gomes R. L. Pazzi R. W. Madeira E. R. M. Villas L. A. (2017). “APOLO: a mobility pattern analysis approach to improve urban mobility,” in Proceedings - IEEE Global Communications Conference, GLOBECOM 2018-January, 1–6. doi: 10.1109/GLOCOM.2017.8253942
6
Alizadeh H. Sharifi A. (2023). Analyzing urban travel behavior components in Tehran, Iran. Future Transport.3, 236–253. doi: 10.3390/futuretransp3010014
7
Amanor W. K. Adanu E. K. Adams C. A. Eric A. (2025). Exploring the influence of dispositional factors on travel behaviour in Accra Metropolis, Ghana. J. Afr. Transport Stud.3:100024. doi: 10.1016/j.aftran.2025.100024
8
Arbuzova A. Getahun T. Malik A. A. Karra M. (2023). Gendered Differences in Mobility and the Demand for Transport in Ethiopia. Available online at: https://www.theigc.org/sites/default/files/2023-11/Arbuzova%20et%20al%20Policy%20brief%20October%202023.pdf
9
Bahir Dar City Administration City Service Office (2021). Three-Year Capital Investment Plan (2014/15- 2016/17). Bahir Dar: Bahir Dar City Administration City Service Office.
10
Bahir Dar City Socio-economic and Finance Department (2023). Bahir Dar City 2023 Population Forecast Data.
11
Bahir Dar City Structure Plan (2020). Road and Transport Network Study for Structure Plan preparation of Bahir Dar Regio-politan City. Bahir Dar: Bahir Dar City Structure Plan.
12
Bahir Dar City Urban Development and Construction Department (2021). Infrastructure Asset Management Plan of Bahir Dar City (2014-2016E.C). Bahir Dar: Bahir Dar City Urban Development and Construction Department.
13
Bamberg S. Ajzen I. Schmidt P. (2003). Choice of travel mode in the theory of planned behavior: the roles of past behavior, habit, and reasoned action. Basic Appl. Soc. Psychol.25, 175–188. doi: 10.1207/S15324834BASP2503_01
14
Banister D. (2008). The sustainable mobility paradigm. Transp. Policy15, 73–80. doi: 10.1016/j.tranpol.2007.10.005
15
Bassolas A. Barbosa-Filho H. Dickinson B. Dotiwalla X. Eastham P. Gallotti R. et al . (2019). Hierarchical organization of urban mobility and its connection with city livability. Nat. Commun.10, 1–10. doi: 10.1038/s41467-019-12809-y
16
Bentler P. M. Bonett D. G. (1980). Significance tests and goodness of fit in the analysis of covariance structures. Psychol. Bull.88, 588–606. doi: 10.1037/0033-2909.88.3.588
17
Bertolini L. (2012). Integrating mobility and urban development agendas: a manifesto. disP Plann. Rev.48, 16–26. doi: 10.1080/02513625.2012.702956
18
Blinkin M. Muleev E. (2016). “Russian cities mobility culture: international comparison, transportation research, economics and policy,” in Transport Systems of Russian Cities, eds M. Blinkin and E. Koncheva (Springer), 259–272. doi: 10.1007/978-3-319-47800-5_9
19
BMDV (2017). Mobility in Germany 2017: study summary. BMDV.
20
Boarnet M. Crane R. (2001). Travel by Design: The Influence of Urban Form on Travel. Reg. Sci. Urban Econ.32. doi: 10.1093/oso/9780195123951.001.0001
21
Browne M. W. Cudeck R. (1993). “Alternative ways of assessing model fit,” in Testing Structural Equation Models, 136−162.
22
Brussels Regional Public Service (2023). Travel Behaviour Survey Brussels Capital Region (2023): Summary Report. Brussels Regional Public Service.
23
Bryceson D. F. Mbara T. C. Maunder D. (2003). Livelihoods, daily mobility and poverty in sub-saharan Africa. Transp. Rev. 23, 177–196. doi: 10.1080/01441640309891
24
Byrne B. M. (2010). Structural Equation Modeling with AMOS: Basic Concepts, Applications and Programming.
25
Byrne B. M. (2016). Structural Equation Modeling with AMOS: Basic Concepts, Applications, and Programming. doi: 10.4324/9781315757421
26
Caballero R. Franco P. Tosi J. D. Ledesma R. D. Jakovcevic A. (2019). Use of the planned behavior theory to explain bicycle use. Avances Psicol. Latinoamericana37, 283–294. doi: 10.12804/revistas.urosario.edu.co/apl/a.6972
27
Cao X. Mokhtarian P. L. Handy S. L. (2007). Do changes in neighborhood characteristics lead to changes in travel behavior? A structural equations modeling approach. Transportation34, 535–556. doi: 10.1007/s11116-007-9132-x
28
Chapman L. (2007). Transport and climate change: a review. J. Transport Geogr.15, 354–367. doi: 10.1016/j.jtrangeo.2006.11.008
29
Chaudhry A.-G. Masoumi H. Dienel H.-L. (2023). A systematic literature review of mobility attitudes and mode choices: MENA and South Asian cities. Front. Sustain. Cities4:1085784. doi: 10.3389/frsc.2022.1085784
30
Cheung G. W. Cooper-Thomas H. D. Lau R. S. Wang L. C. (2024). Reporting reliability, convergent and discriminant validity with structural equation modeling: a review and best-practice recommendations. Asia Pac. J. Manage.41, 745–783. doi: 10.1007/s10490-023-09871-y
31
Choi C. C. Loh N. (2013). Transport policies and patterns: a comparison of five Asian cities. Journeys69–78.
32
Choi J. Lee W. D. Park W. H. Kim C. Choi K. Joh C. H. (2013). Analyzing changes in travel behavior in time and space using household travel surveys in Seoul Metropolitan Area over eight years. Travel Behav. Soc.1, 3–14. doi: 10.1016/j.tbs.2013.10.003
33
Costa P. B. Neto G. C. M. Bertolde A. I. (2017). Urban mobility indexes: a brief review of the literature. Transport. Res. Procedia25, 3645–3655. doi: 10.1016/j.trpro.2017.05.330
34
Cui Y. He Q. Khani A. (2018). Travel behavior classification: an approach with social network and deep learning. Transp. Res. Rec.2672, 68–80. doi: 10.1177/0361198118772723
35
Deutsch K. Yoon S. Y. Konstadinos G. (2013). Modeling travel behavior and sense of place using a structural equation model. J. Transport Geogr.28, 155–163. doi: 10.1016/j.jtrangeo.2012.12.001
36
Dissanayake D. Kurauchi S. Morikawa T. Ohashi S. (2012). Inter-regional and inter-temporal analysis of travel behaviour for Asian metropolitan cities: case studies of Bangkok, Kuala Lumpur, Manila, and Nagoya. Transport Policy19. 36–46. doi: 10.1016/j.tranpol.2011.07.002
37
Dresser G. B. Gattis J. L. (1990). Household Travel Surveys. College Station, TX: Texas Transportation Institute; The Texas A&M University System.
38
Duan Y. Wang J. Li H. Yan Y. Zhang X. (2023). A comparison in travel characteristics of bike-sharing between college students and office workers based on theory of planned behavior. Behav. Sci. 13:329. doi: 10.3390/bs13040329
39
Dumbliauskas V. Grigonis V. (2020). An empirical activity sequence approach for travel behavior analysis in Vilnius city. Sustainability12, 1–22. doi: 10.3390/su12020468
40
EFDRE Ministry of Urban Development & Housing (NUDSP). (2016). National Urban Development Spatial Plan: National Urban Systems Study Final Report.
41
Ejes C. Marquez L. (2000). Structural Equation Approach to Understanding Weekend Travel Behavior in Metro Manila. CSIRO Manufacturing and Infrastructure Technology and University of the Philippines.
42
Ewing R. Cervero R. (2001). Travel and the built environment: a synthesis. Transp. Res. Rec. 1780, 87–114. doi: 10.3141/1780-10
43
FDRE Ministry of Transport and Logistics (2024). Statistical Report of Vehicles in Ethiopia. Addis Ababa.
44
Foley L. Brugulat-Panés A. Woodcock J. Govia I. Hambleton I. Turner-Moss E. et al . (2022). Socio-economic and gendered inequities in travel behaviour in Africa: mixed-method systematic review and meta-ethnography. Soc. Sci. Med.292, 1–16. doi: 10.1016/j.socscimed.2021.114545
45
Fondzenyuy S. K. Jackai II, I. N. Feudjio S. L. T. Usami D. S. Gonzalez-Hernández B. Wounba J. F. et al . (2024). Assessment of Sustainable Mobility Patterns of University Students: Case of Cameroon. J. Sustain.16:4591. doi: 10.3390/su16114591
46
Galán A. Ruiz-Apilánez B. Macdonald E. (2024). Built environment and active transportation to school in the west: latest evidence and research methods. Discover Cities 1. doi: 10.1007/s44327-024-00003-9
47
Garling T. Steg L. (2007). Threats from Car Traffic to the Quality of Urban Life: Problems, Causes, and Solutions. doi: 10.1108/9780080481449
48
Gim T. H. T. (2011). Influences on trip frequency according to travel purposes: a structural equation modeling approach in Seoul, South Korea. Environ. Plann. B Plann. Design38, 429–446. doi: 10.1068/b36061
49
Hair J. F. Jr. Black W. C. Babin B. J. Anderson R. E. (2019). Multivariate Data Analysis, 8th Edn. Cengage.
50
Heinen E. Maat K. van Wee B. (2013). The effect of work-related factors on the bicycle commute mode choice in the Netherlands. J. Transport.40, 23–43. doi: 10.1007/s11116-012-9399-4
51
Hu L. Bentler P. M. (1999). Cutoff criteria for fit indexes in covariance structure analysis: conventional criteria versus new alternatives. Struct. Equ. Model.6, 1–55 doi: 10.1080/10705519909540118
52
Hyodo T. Fujiwara A. Montalbo Jr. C SoehodhoS. (2005). Urban travel behavior characteristics of 13 cities based on household interview survey data. J. Eastern Asia Soc. Transport. Stud.6, 23–38.
53
Kamuhanda R. Schmidt O. (2009). Matatu: a case study of the core segment of the public transport market of Kampala, Uganda. Transport Rev.29, 129–142. doi: 10.1080/01441640802207553
54
Kasraian D. Raghav S. Yusuf B. Miller E. J. (2022). A longitudinal analysis of travel demand and its determinants in the Greater Toronto-Hamilton Area. Environ. Plann. B Urban Anal. City Sci.49, 2230–2249. doi: 10.1177/23998083221082109
55
Kline R. B. (2016). Principles and Practice of Structural Equation Modeling, 4th Edn. Guilford Press.
56
Kumar A. Barrett F. (2008). Stuck in Traffic: Urban Transport in Africa. AICD Background Paper No. 1. Africa Infrastructure Country Diagnostic.
57
Lanzini P. Khan S. A. (2017). Shedding light on the psychological and behavioral determinants of travel mode choice: a meta-analysis. Transport. Res. Part F Traffic Psychol. Behav.48, 13–27. doi: 10.1016/j.trf.2017.04.020
58
Lee S. Ko E. Jang K. Kim S. (2023). Understanding individual-level travel behavior changes due to COVID-19: trip frequency, trip regularity, and trip distance. Cities135:104223. doi: 10.1016/j.cities.2023.104223
59
Levin M. W. Boyles S. D. (2015). Effects of autonomous vehicle ownership on trip, mode, and route choice. Transp. Res. Rec.2493, 29–38. doi: 10.3141/2493-04
60
Lois D. Moriano J. A. Rondinella G. (2015). Cycle commuting intention: a model based on theory of planned behaviour and social identity. Transp. Res. Part F32, 101–113. doi: 10.1016/j.trf.2015.05.003
61
Lomax T. Schrank D. (2002). Using Travel Time Measures to Estimate Mobility and Reliability in Urban Areas. Texas Transportation Institute; Texas A&M University. Available online at: https://rosap.ntl.bts.gov/view/dot/86502
62
Ma J. Mitchell G. Heppenstall A. (2014). Daily travel behaviour in Beijing, China.An analysis of workers' trip chains, and the role of socio-demographics and urban form. Habitat Int.43, 263–273. doi: 10.1016/j.habitatint.2014.04.008
63
Maca'rio R. (2001). Upgrading quality in urban mobility systems: managing service quality. Int. J.11, 93–98. doi: 10.1108/09604520110387211
64
Madha A. Salman A. D. Hussain H. D. Borhan N. Rahmat R. A. O. (2016). Analysis of travel behaviour in Petaling Jaya, Malaysia: an application of the theory of planned behaviour. Arch. Transport38, 29–38. doi: 10.5604/08669546.1218791
65
Martin E. Shaheen S. Zohdy I. (2016). Understanding travel behavior: research scan. UC Berkeley Transport. Sustain. Res. Center15, 250–260.
66
Meyer M. D. (2016). Transportation Planning Handbook, 4th Edn. Hoboken, NJ: John Wiley and Sons, Inc.
67
Mohd Shariff N. Shah M. Z. (2008). Factors influencing travel behaviour and their potential solution: a review of current literatures. J. Alam Bina11, 19–28.
68
Moses M. Rose L. Noleen P. (2022). Factors that affect travel behaviour in developing cities: a methodological review. Transp. Res. Interdiscipl. Perspect. 16:100683. doi: 10.1016/j.trip.2022.100683
69
Mwale M. Ho C. Luke R. Pisa N. (2025). Forecasting road-based public transport needs of developing cities: a case of Lusaka City. Res. Transport. Bus. Manage. 63:101473. doi: 10.1016/j.rtbm.2025.101473
70
Okeke F. O. Echendu I. F. Nnaemeka-Okeke R. C. (2021). Determinants of intra-urban travel in Southeast Nigeria, evidence from the City of Enugu. Transport Probl.16, 185–198. doi: 10.21307/tp-2021-070
71
Ozbilen B. Akar G. White K. Dabelko-Schoeny H. Cao Q. (2024). Analysing the travel behaviour of older adults: what are the determinants of sustainable mobility?Ageing Soc. 44, 1964–1992. doi: 10.1017/S0144686X22001180
72
Pas E. I. (1980). Toward the understanding of urban travel behavior through the classification of daily urban travel/activity patterns. (Ph.D Dissertation). Northwestern University.
73
Rahman M. M. Deb S. Strawderman L. Smith B. Burch R. (2019). Evaluation of transportation alternatives for aging population in the era of self-driving vehicles. IATSS Res.44, 30–35. doi: 10.1016/j.iatssr.2019.05.004
74
Rahman M. S. (2008). Understanding the linkages of travel behavior with socio-economic characteristics and spatial environments in Dhaka city and urban transport policy applications (Master's Thesis). Hiroshima University, Japan.
75
Ramírez H. G. Leclercq L. Chiabaut N. Becarie C. Krug J. (2021). Travel time and bounded rationality in travellers' route choice behavior: A computer route choice experiment. J. Travel Behav. Soc.22, 59–83. doi: 10.1016/j.tbs.2020.06.011
76
Raunio J. M. (2014). Understanding the travel behavior of generation Y (Master's thesis). MID Sweden University.
77
Rode P. Hoffmann C. Kandt J. Graff A. Smith D. (2015). Toward new urban mobility: the case of London and Berlin. LSE Cities InnoZ. Jens Kandt1–49.
78
Salon D. Gulyani S. (2010). Mobility, poverty, and gender: travel “choices” of slum residents in Nairobi, Kenya. Transport Rev.30, 641–657. doi: 10.1080/01441640903298998
79
Saveleva E. O. Lorens P. (2019). Comparative analysis of mobility patterns in Russia and other countries. Вестник Пермского национального исследовательского политехнического университета. Прикладная экология. Урбанистика3, 79–94.
80
Scheiner J. Holz-Rau C. (2007). Travel mode choice: affected by objective or subjective determinants?Transportation34, 487–511. doi: 10.1007/s11116-007-9112-1
81
Schwanen T. Dijst M. Dieleman F. M. (2004). Policies for urban form and their impact on travel: the Netherlands experience. Urban Stud.41, 579–603. doi: 10.1080/0042098042000178690
82
Silva A. A. P. Lopes A. A. D. S. Silva J. S. B. Prado C. V. Reis R. S. (2020). Characteristics of the schools' surrounding environment, distance from home and active commuting in adolescents from Curitiba, Brazil. Rev. Brasil. Epidemiol.23, 1–15. doi: 10.1590/1980-549720200065
83
Soliani R. D. (2021). Brazilian road freight transportation sector: the challenge of sustainability. J. Traffic Logistics Eng.9, 32–41. doi: 10.18178/jtle.9.2.32-41
84
Stark J. Berger W. J. Hössinger R. (2018). The effectiveness of an intervention to promote active travel modes in early adolescence. Transport. Res. Part F55, 389–402. doi: 10.1016/j.trf.2018.03.017
85
Stead D. Marshall S. (2001). The relationships between urban form and travel patterns. an international review and evaluation. Euro. J. Transport Infrastruct. Res. 1, 113–141. doi: 10.18757/EJTIR.2001.1.2.3497
86
Steg L. Gifford R. (2007). “Sustainable transport and quality of life,” in Building Blocks for Sustainable Transport, 183–202. doi: 10.1108/9780857245168-011
87
Szeto W. Y. Yang L. Wong R. C. P. Li Y. C. Wong S. C. (2017). Spatio-temporal travel characteristics of the elderly in an ageing society. Travel Behav. Soc.9, 10–20. doi: 10.1016/j.tbs.2017.07.005
88
Tai T. Ngah R. Shah M. Z. Ali Y. M. Al . (2016). Modelling travel demand management measurements towards travel behaviour with psycho-social, trip chain attributes and quality of life: a conceptual paper. J. Traffic Logistics Eng.4, 141–146. doi: 10.18178/jtle.4.2.141-146
89
Tatah L. Foley L. Oni T. Pearce M. Lwanga C. Were V. et al . (2023). Comparing travel behaviour characteristics and correlates between large and small Kenyan cities (Nairobi versus Kisumu). J. Transport Geogr.110:103625. doi: 10.1016/j.jtrangeo.2023.103625
90
Tetsuro H. Akimasa F. Cresencio M. Jr. Soehodho S. (2005). Urban travel behavior characteristics of 13 cities based on household interview survey data. Eastern Asia Soc. Transp. Stud.6, 23–38.
91
Van Acker V. Witlox F. (2010). Car ownership as a mediating variable in car travel behaviour research using a structural equation modelling approach to identify its dual relationship. J. Transport Geogr.18, 65–74. doi: 10.1016/j.jtrangeo.2009.05.006
92
Wang D. Law F. Y. T. (2007). Impacts of Information and Communication Technologies (ICT) on time use and travel behavior: a structural equations analysis. Transportation34, 513–527. doi: 10.1007/s11116-007-9113-0
93
Wang X. Renne J. L. (2023). Socioeconomics of urban travel in the U.S.: evidence from the 2017 NHTS. Transp. Res. Part D Transp. Environ. 116:103622. doi: 10.1016/j.trd.2023.103622
94
Wegener M. (2013). The future of mobility in cities: challenges for urban modelling. Transport Policy29, 275–282. doi: 10.1016/j.tranpol.2012.07.004
95
Wey W. M. Huang J. Y. (2018). Urban sustainable transportation planning strategies for livable City's quality of life. Habitat Int.82, 9–27. doi: 10.1016/j.habitatint.2018.10.002
96
Yao M. Wang D. (2018). Mobility and travel behavior in urban China: the role of institutional factors. Transport Policy69, 122–131. doi: 10.1016/j.tranpol.2018.05.012
97
Zhang M. Sun Q. X. Chen J. C. Guo J. F. (2008). Travel behavior analysis of the females in Beijing. J. Transport. Syst. Eng. Information Technol.8, 19–26. doi: 10.1016/S1570-6672(08)60015-X
98
Zhao P. Lu B. amd de Roo G. (2019). Understanding urban travel behavior in developing countries: A latent variable approach. Transp. Geogr.78, 45–55.
Summary
Keywords
urban mobility, travel behavior, travel factors, structural equation modeling, Bahir Dar
Citation
Kassaye TY, Woldetensae B, Ectors W, Uhlmann J, Schneider S, Bielik M and Schmidt P (2025) Characterization of urban mobility behavior in emerging cities of Ethiopia: the case study of Bahir Dar using structural equation modeling. Front. Sustain. Cities 7:1687436. doi: 10.3389/frsc.2025.1687436
Received
17 August 2025
Accepted
15 October 2025
Published
06 November 2025
Volume
7 - 2025
Edited by
Jaeyoung Jay Lee, Central South University, China
Reviewed by
Moses Mwale, World Health Organization, Zambia
Madhu Ka, REVA University, India
Updates
Copyright
© 2025 Kassaye, Woldetensae, Ectors, Uhlmann, Schneider, Bielik and Schmidt.
This is an open-access article distributed under the terms of the Creative Commons Attribution License (CC BY). The use, distribution or reproduction in other forums is permitted, provided the original author(s) and the copyright owner(s) are credited and that the original publication in this journal is cited, in accordance with accepted academic practice. No use, distribution or reproduction is permitted which does not comply with these terms.
*Correspondence: Tafere Yalew Kassaye, yalew86@gmail.com
Disclaimer
All claims expressed in this article are solely those of the authors and do not necessarily represent those of their affiliated organizations, or those of the publisher, the editors and the reviewers. Any product that may be evaluated in this article or claim that may be made by its manufacturer is not guaranteed or endorsed by the publisher.