Abstract
Introduction:
Urban areas are widely recognized as key hubs of economic activity and cultural diversity, playing a vital role in both national and local economies. Improved mobility within cities has the potential to foster greater efficiency, environmental sustainability, and resource optimization, thereby promoting a more inclusive society. As a result, efforts to ensure fair access to transportation, housing, among others often necessitate policy reforms aimed at improving the mobility patterns of urban residents. Smart mobility involves transitioning from the conventional transportation systems and evolving toward mobility as a service, where intelligent infrastructure though the adoption of technology links multiple stakeholders and entities to provide an efficient, smart, and sustainable solution. This has found a niche in transportation policy, thus, impacting residential self-selection of households to live farther or closer to work and other non-work destinations such as parks, enclaves, shopping centers among others. Hence, this study examined the impact of smart mobility technologies on trip making behavior and housing choice of respondents.
Methods:
This study adopted a rigorous research design, gathering primary data through the use of structured questionnaires. In total, 408 questionnaires was administered using a systematic sampling method, with the survey being conducted by research assistants. The Likert scale method for response ranking was utilized for ranking of factors influencing trip making behavior and housing choice of respondents, while the multiple regression analysis was used to validate the Likert scale results.
Discussion:
Findings indicated that the most significant factors (P < 0.05) influencing choice of residential location include proximity to work, transport cost, availability of public transport, good neighborhood and land/housing rent and telecommuting. Based on the above, it was discovered that the role of transportation in residential location choice plays a vital role in household's decision making, hence, improved mobility can lead to participative, and cohesive society.
1 Introduction
As global conditions shift, the dynamics of urban mobility are undergoing significant transformation, redefining the movement of individuals and freight within metropolitan spaces. Accelerating urban growth and population increases have intensified the challenge of meeting ever-greater mobility requirements in crowded cities. Conventional transportation approaches, once relied upon to alleviate congestion and infrastructure deficits, are increasingly inadequate for contemporary urban demands. Consequently, there is a clear necessity for innovative, efficient, and sustainable transport solutions capable of addressing the complex realities of modern cities. In Africa, especially country like Nigeria, where there is incessant mobility and housing problems ranging from congestion, inadequate urban infrastructure, high rent among others, calls for an innovative approach such as the adoption of smart mobility which has the potential of driving social transformation in cities and transforming our cities into a smart and sustainable one through the technological adoption (Luke et al., 2025).
The concept of smart and sustainable cities is increasingly regarded as a key component of the urban future, integrating technological innovation, multi-sectoral collaboration, and dynamic open markets with strategic goals and ambitions aimed at fostering sustainable urban development. Within this framework, smart mobility which involves integrating advanced technologies and data-driven solutions in transportation systems to enhance efficiency, accessibility, and safety emerges as a crucial element of the smart city paradigm, with telecommunications—an integral technique of smart mobility—playing a significant role in advancing the goals of a smart and sustainable city (Aderibigbe and Gumbo, 2025). Increase access and mobility can foster more efficient, environmentally sustainable cities, promote better use of resources, and ultimately support a society that is more inclusive, participatory, and cohesive.
Housing, being one of the three basic necessities of life, holds a crucial place in individuals' lives. It serves not only as a major consumption item but also as a source of security and stability, and as a nationally promoted avenue for wealth accumulation. It also shapes where people access different activities such as education, health, recreational centers (parks, museums, claves etc.) and pursue employment (Blumenthal and McGinty, 2015). According to Blanchard and Wanddel (2017), mobility-related decision-making is often driven by evidence derived from various accessibility metrics. As a result, accessibility indicators are commonly incorporated as explanatory variables within urban models, spanning applications from location choice models to transportation models (Van Heerden et al., 2022).
Harrison and Todes (2012) characterize accessibility as the extent to which an individual at a specific site can reach and engage in a particular activity or group of activities. According to Park and Goldberg (2021), three interrelated input variables were identified that form the basis for calculating spatial accessibility: supply, demand, and mobility. Supply pertains to the geographic distribution of opportunities or infrastructure that urban residents seek to access, such as employment and social services, whereas demand relates to the locations of residents who are likely to pursue these opportunities or make use of the infrastructure. These variables emphasize the importance of spatial proximity; however, a persistent mismatch often exists between household residential locations and the availability of appropriate employment opportunities (Van der Merwe and Krygsman, 2020).
For instance, Aderibigbe et al. (2024a) asserted that land rent are much higher in location closer to job centers while it decreases in places farther away from job centers as a result of transportation. Kgwedi and Krygsman (2019) further opined that this is not only related to cost but other factors such as the length of parking, delays while waiting, and total travel time. Ibrahim and Masoumi (2018) in their study revealed that various types of neighborhoods can influence the self-selection process within both formal and informal housing markets. For example, residents' preferences and perceptions, combined with budget constraints, shape their priorities when selecting housing locations. The most significant factors influencing these choices include walkability, access to local employment opportunities, and the availability of public transport infrastructure related to different modes.
From the foregoing, it can be said that there is an interaction between choice of housing location and urban mobility as there are consideration such as availability of public transport as one of the factors in housing selection. Based on this, it is pivotal that policies that considers the provision of essential facilities to ease mobility of people is given attention in all the residential neighborhoods irrespective of the status of the dwellers. This will reduce the unbiased and unusually high rent in some specific location, hence, depriving others such as the low-income earners in enjoying equal opportunities as their high income counterparts living in some neighborhoods with the financial prowess to afford such housing/dwelling units.
In conclusion, to ensure that policy interventions designed to achieve net-zero goals help to reduce, rather than widen, existing inequalities, it is important to engage communities in the process and provide them with targeted support to address and overcome mobility barriers that could be introduced by policy changes, including by investing more in telecommunication use combined with accessible transport options, hence, achieving a smart and sustainable city. The effective integration smart technologies into both transportation systems and housing choices is vital for the future of urban mobility. This study aims to enrich the discourse on how cities can harness technology to build transportation networks that are more efficient, safe, and sustainable by offering a comprehensive assessment of current trends, associated benefits, existing challenges, and future directions to achieving a smart city through the adoption of technology. It also highlights the effect of smart mobility adoption in other key aspects of the society such as housing choice, as well as provide new insights into the socio-economic impact of smart mobility in emerging cities, especially in Nigeria. In the end, smart technologies have the capacity to reshape urban environments, improve quality of life, and foster cities that are resilient and adaptable to future challenges. Although studies have addressed the impact of smart mobility in mobility related and housing decisions in developed countries, few have explored the context of a medium-sized city in Nigeria, where unique infrastructure and diverse socio-economic challenges can alter these dynamics.
1.1 Literature review
To achieve an inclusive, equitable and healthy city, there is a need for Urban Innovation. This highlights the need for innovative ways to address the social, economic, environmental, and governance challenges faced by urban areas. It involves integrating new practices, solutions, and services into the evolving processes of urban change, providing the momentum for cities and governments to enhance both citizens' quality of life and environmental wellbeing. Residential mobility is viewed as a natural part of the human life cycle, with life events such as aging, changes in marital status, and family expansion often prompting households to relocate in order to better meet their needs and improve their welfare (Fattah et al., 2015).
1.1.1 Technology as a catalyst for building an inclusive, smart, and sustainable city
According to Kumar and Verma (2025) and Aderibigbe and Gumbo (2025), the emergence of smart technologies is poised to transform urban transportation systems at a pivotal moment. Integrating these technologies offers a promising approach to challenges such as traffic congestion, environmental pollution, and the growing need for efficient mobility solutions, thereby advancing the goal of smart and sustainable cities. Rapid developments in smart traffic management and autonomous vehicles are already reshaping the administration and optimization of transport networks through real-time data analytics, advanced management systems, and Internet-of-Things (IoT)–enabled infrastructure. The anticipated benefits of smart transport frameworks are wide-ranging: they can reduce travel times, ease congestion, and improve overall traffic flow by enhancing the efficiency of urban mobility. Advanced systems for accident prevention and rapid response further contribute to public safety by lowering both the frequency and severity of road incidents. The adoption of electric vehicles complements these efforts by enabling route optimization and lowering emissions, helping cities meet their sustainability targets. As Alotalbi et al. (2025) observe, smart mobility also supports improved traffic management, provides alternative routing during congestion or emergencies, and facilitates specialized navigation for critical services such as ambulances, government vehicles, and other official movements. Collectively, these innovations create congestion-free, environmentally friendly, and sustainable transportation options for residents and municipal authorities alike.
1.1.2 Technological innovations in smart transportation
Rapid technological progress has driven significant advances in urban transport systems. Aderibigbe et al. (2024b) highlights some of the Important advancement in technology includes as follows:
-
Telecommunication: The adoption and use of mobile phones and other Information and Communication Technologies such as Personal Computers among others plays a vital role in reducing physical movement and have impact on residential location. This is due to the fact that people who telecommute or adopt the use of telecommunication for other activities may not consider transportation cost to work or other activity centers, hence, barrier in distance may not be a significant factor in the choice of location.
-
Autonomous vehicles (AVs): By reducing reliance on human drivers, autonomous vehicles have the potential to transform urban mobility, lowering accident rates, easing traffic congestion, and cutting transportation costs. Pilot AV programs are currently underway in cities such as Phoenix and San Francisco to assess their benefits and integration into existing transport networks.
-
Smart traffic management systems: These systems use advanced algorithms and real-time data to shorten travel times, decrease congestion, and optimize overall traffic flow. Adaptive signal control and intelligent traffic lights that respond dynamically to traffic conditions have already been deployed in cities like London and Los Angeles.
-
Real-time data analytics: Through the application of big-data techniques and continuous analytics, cities can more effectively monitor and manage transportation networks. For example, New York City tracks traffic patterns with sensors and cameras to inform decisions on traffic management and infrastructure improvements.
-
Internet of things (IoT): IoT-enabled infrastructure—such as connected roadways and smart parking systems—enhances the efficiency and user experience of metropolitan transport. Cities including Barcelona and Amsterdam are implementing IoT solutions to create cohesive, intelligent urban environments. Based on the above, several factors should be given uttermost consideration in relation to transportation and housing location.
Factors such as travel mobility and the widespread accessibility of urban mass transit influence many aspects of daily life, with social interactions playing a vital role in fostering inclusion for individuals with reduced mobility, such as the elderly (Wong et al., 2018). In addition, Pojani and Stead (2015) noted that the development of an efficient and intelligent transport sector can significantly lower the environmental footprint of transportation, noting that nearly 20% of CO2 emissions stem from road traffic. From an economic standpoint, the link between access to smart transportation and the competitiveness of businesses—regardless of the industry—holds considerable importance. In shaping transport policy, it is also critical for authorities to consider factors affecting work accessibility, particularly telecommuting (Johnson et al., 2017; Chwiałkowski and Zydron, 2022).
1.1.3 Impact of transportation on housing choice
The accessibility of high-quality urban transport systems impacts the real estate market and plays a key role in determining property values. Urban transport infrastructure can greatly influence the appeal of properties near transit hubs and enhance location accessibility. According to Edionwe and Ogunba (2023), property values are influenced by numerous individual and property-specific factors, which can be broadly categorized into physical and economic dimensions. Physical factors include elements such as dwelling size and land topography, while economic factors encompass aspects like market demand and supply and the employment profile of the local property market. Among urban residential properties, location—along with its associated features, such as the immediate neighborhood—is of particular significance (Cordera et al., 2019; Chen et al., 2019). Location is typically a critical consideration for potential buyers, often evaluated based on accessibility to service infrastructure (such as shopping centers and cultural venues), social infrastructure (such as kindergartens and childcare facilities), and transport infrastructure (such as bus stops and tram lines). Potoglou et al. (2019) further emphasized that neighborhood quality is also shaped by factors such as the availability of green spaces that support recreation and active leisure, while also contributing to reduced pollution from road traffic. In view of the above, the role of transportation and smart mobility in households' trip making behavior as well as residential self-selection cannot be overlooked as people consider factors such as travel cost, rent, urban design and infrastructure in their choice of housing.
1.2 Conceptual framework
This section explains the relationship between the associated variables. It explains the factors influencing housing choice, trip making behavior of households as well as adoption of smart mobility.
This conceptual framework explains the indicators for measuring each of the variables (socio-economic characteristics, travel characteristics, smart mobility adoption and housing location) and relationship which exist between the demographic characteristics of individuals, travel pattern, smart mobility and housing choice of people. As depicted in Figure 1, socio-economic attributes—such as age, income, and education—affect both residential location choices and trip-making behavior of individuals and households (Fadare and Alade, 2009; Aderibigbe and Gumbo, 2025). For instance, it has been widely researched that household income, travel cost among other factors play a role in the choice of transport mode as well as locational choice. Hence, there is a link between socio-economic characteristic, travel characteristics, smart mobility adoption and locational choice. Likewise, land/housing rent, trip distance, travel cost play a role in determining residential self-selection and adoption of smart mobility. This framework further revealed how ones demographic such as age, income among other factors influences the travel characteristics and the choice of residential location. As seen in Figure 1, these factors have a role to play in the trip making behavior of individuals and well as their choice of location. Oftentimes, it has been proven that income level of people determines their trip frequencies, rent, their location, thus, having a role to play in their mobility pattern and housing choice. Likewise, the adoption of smart mobility depends on factors such as travel cost, trip frequency, proximity, urban design among others. These factors determines the extent of adoption of smart mobility as an option to physical movement and housing choice, hence, its, inclusion in this study.
Figure 1
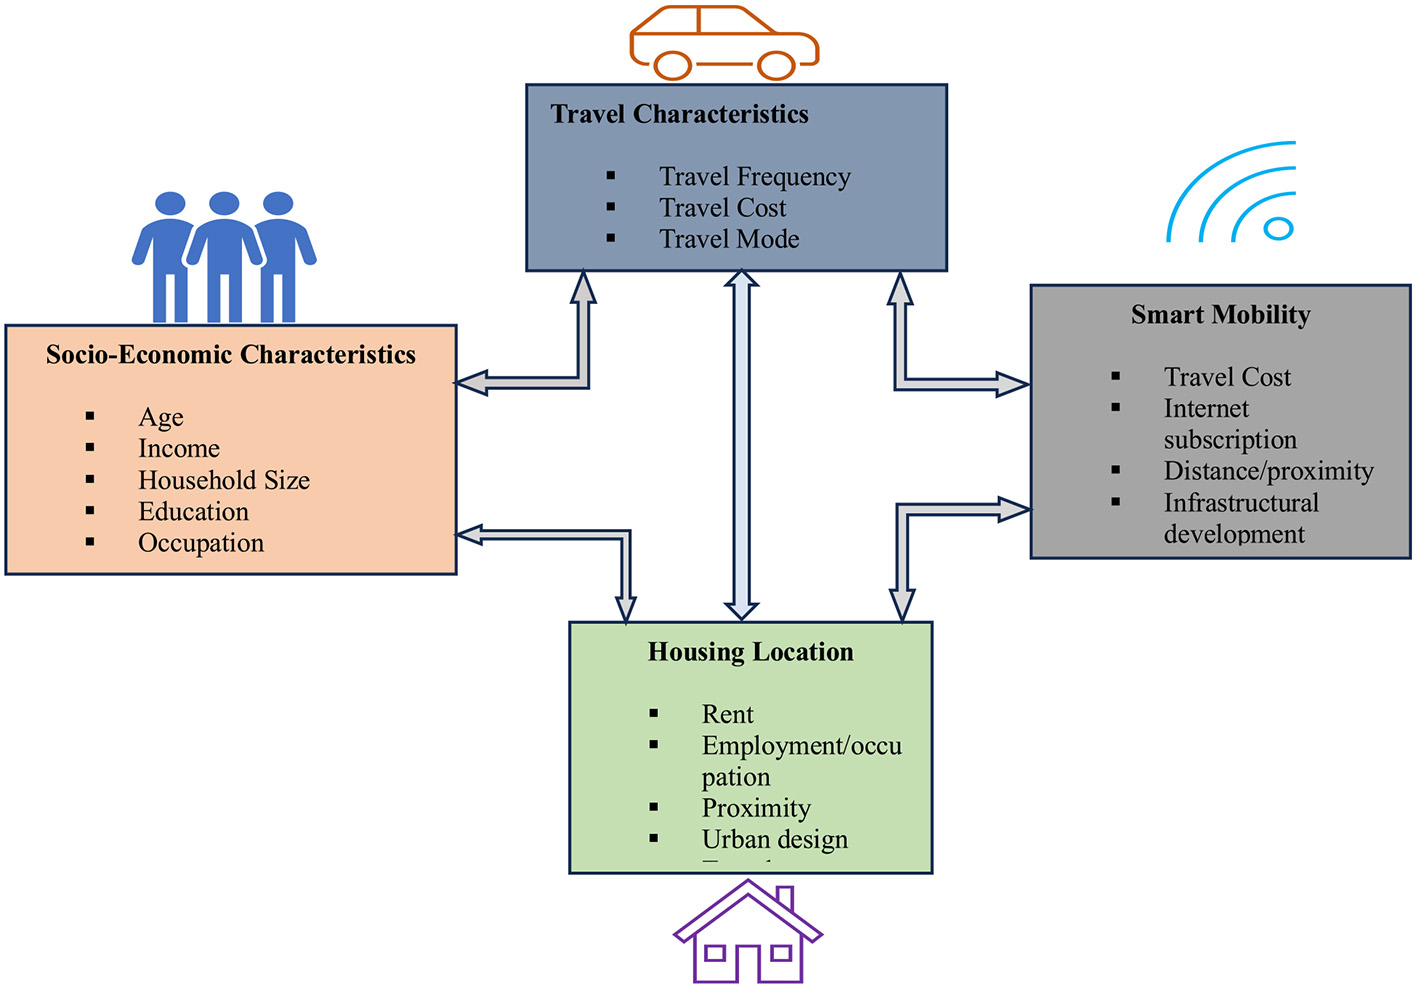
Relationship between the socio-economic characteristics, travel characteristics and housing choice of respondents.
2 Materials and methods
This section gives details description of the study location and the methodology employed in this research. It explains the variables adopted in this study, the method of data collection and the method of data analysis adopted for the study.
2.1 Study area
Akure, the study area has served as the capital of Ondo State since 1976 and also functions as the headquarters of Akure South Local Government Area. The city is located ~700 kilometers southwest of Abuja, Nigeria's Federal Capital Territory, and about 350 kilometers from Lagos, the country's former capital, though still the current economic capital. Geographically, Akure lies at approximately 7°16′48″ N latitude and 5°14′41″ E longitude. The city's land area expanded significantly over the years, growing from 36.55 square kilometers in 1966 to 274.93 square kilometers in 1986, and reaching 531.09 square kilometers by 2002 (Ogunbodede, 2007), a growth driven by the town's diverse economic and administrative activities. Akure's dual role as both state capital and local government headquarters has attracted a substantial influx of people. Projections by the Department of Research and Statistics (2009) estimated the city's population at 163,764, highlighting the relevance of this study.
2.2 Methodology
A multi-stage sampling approach was employed for this study. The first involves residential areas within the study location been first stratified by political wards. The area comprises 11 wards in total. From these, 50% were randomly selected, resulting in six wards for the survey.
Furthermore, within the chosen wards, all streets and buildings were identified using records from the Akure South Local Government headquarters and the Town Planning Office. The records show 189 registered streets; 20% (38 streets) were randomly selected. These areas contain 4,968 registered buildings, of which 10%—a total of 496 buildings—were randomly chosen. Questionnaires were distributed to households within these buildings, and 408 completed surveys were deemed valid for analysis, representing an 82% response rate.
The third and final stage involves the systematic random sampling was applied to select households within the sampled buildings. Starting with the first building on the first street, every 10th building (i.e., one in every nth building, where n = 10) was selected. Within each selected building, one adult respondent aged 18 years or older was surveyed on each floor.
This multi-stage procedure ensured that ~10% of the total building stock was sampled, providing a representative cross-section of the study population.
This is presented below
1 out of every nth building/household was systematically selected, thus,
Where, K = sample size,
N = Number of households/buildings in the study location,
n = represents (%) of all households per dwelling unit.
A random selection of registered streets, constituting 20% of the streets in selected wards. Subsequently, 10% of the 4,968 registered buildings in the chosen wards were systematically sampled, resulting in a total of 496 buildings for further investigation. Within each selected building, the household head was chosen for questionnaire administration, consistent with prior studies justifying the focus on household heads due to their representative nature. In cases where the intended respondent was unavailable, the subsequent building was sampled. The criteria for selection ensured that household heads, aged 18 years or older, residing on the first floor of each building were included, culminating in a total of 496 respondents, of which 408 questionnaires (82%) were deemed analyzable.
The questionnaire was structured into three thematic sections. The first section addressed the socio economic characteristics of respondents (age, income, education occupation, car ownership) and the second section focused on the travel characteristics (travel time, travel distance, predominant mode of transport, trip purpose, travel cost) while the last section involved questions on the availability of transport infrastructure and challenges in utilization of smart mobility technologies. SPSS software was utilized to analyze the collected data.
Based on the study of Olojede et al. (2017), the likert scale method has been identified as one of the formulas for ranking factors in order of their relative importance, hence, its adoption for this study. Participants were tasked with rating the importance of each factor using the Likert Scale, ranging from 1 to 5 in ascending order of significance, from Very Low to Very High.
A multiple-regression analysis was adopted to determine the factors influencing respondent's choice of smart mobility technology and housing selection. The multiple regression model has been identified by scholars such as Kyeremeh and Fiagborlo (2016), Ogunsanya (2002), Olojede et al. (2017), and Olawole (2013); for generating predictive models, hence, its adoption.
The formula is presented below
In the model, Y is the dependent variable (walking), and x1, x2, x3 … xn correspond to the independent variables (age, income, travel time, travel cost, availability of pedestrian facilities, safety, travel distance, avoidance of traffic congestion, healthy living and the number of cars available for the household).
a, b: constants/slope of the regression line
e: error term
This represents the relationship between the average number of times respondents walk to their respective activities and other independent variables (predictors) or other factors as x1, x2,....... xn.
The following variables as seen in the variables description table on Table 1 was employed in this study. Based on earlier studies and previous research by Alotalbi et al. (2025), Aderibigbe and Gumbo (2025), Olojede et al. (2017), and Olawole (2015), the following variables have been found to significantly influence the trip making behavior, residential self-selection and technology adoption, hence, its adoption in this study.
Table 1
| Variable | Data type and description |
|---|---|
| Gender | Male, female |
| Age | Age in years |
| Marital status | Are you singe, married, divorce, widowed |
| Income | What is your average monthly income in naira |
| Education | What is your highest level of education (not educated, primary, secondary, tertiary) and the numbers of years spent in achieving tertiary education (1–2, 3–5, 5 years and above) |
| Occupation | Self-employed, artisan/farming, civil servant |
| Cars in the household | What is the number of cars in your household (1, 2, 3, 4-above) |
| Trip frequency | What is the average round trip you make on a daily basis (1, 2, 3, 4, 4-above) |
| Trip purpose | What trip do you make more often (work, school, recreational, commercial/shopping etc.) |
| Transport mode | What is your dominant transport mode [private car, public transport, active travel/non-motorized transport (walk/cycling)] |
| Travel distance | What is the average travel distance to your most dominant trip destination |
| Travel cost | What is the average travel cost you spend on your trip |
| Impact of smart mobility on trip | Do you utilize ICT as a replacement for trips or does it complement your trip; (telework, e-shopping etc.) Does the use of smart mobility reduces travel distance; Does the use of smart mobility reduces or increases travel cost Does its affect travel time Rate this on a scale of 1–5 (no impact-very high impact) |
| Smart mobility and housing choice | Does the use of smart mobility affect the following; locational choice in terms of distance, rent, public service etc. Rate this on a scale of 1–5 (no impact-very high impact) |
Data types and variables description.
Source: Author's field work.
3 Results
This section discussed in detail the summary of the results from the survey. It focussed on the socio-economic characteristics of the people, travel characteristics, smart mobility adoption and utilization for trip making and housing choice, as well as factors influencing the adoption of smart mobility.
3.1 Socio-economic characteristics of respondents
This section explores the demographic characteristics of respondents and this is pivotal to this study as it has been discovered that the demographic characteristics of people with respect to their age, gender, income level, education, occupation has a role to play in their trip making behavior and housing choice, hence, its necessity in this survey. An analysis of the respondents' socio-economic characteristics revealed that 62.8% were male, while 38.2% were female. The age distribution of respondents further revealed that majority (58.2%) are aged 40–49 years. 15.6% of the respondents are 70 years and above, constituting the minority within the age category. The education distribution revealed that a larger proportion (54.8) had tertiary education compared to the 12.8% with no formal education. This may be due to the fact that the study location is slightly urbanized with majority of household head having one form of formal education. Respondents residing in the transition and peripheral zones were generally more educated. In the periphery, 96.8% of respondents had attained tertiary education, in contrast to only 9.1% of respondents in the core area who had a tertiary education. Income distribution also revealed that majority (61.9%) earned between 60,000 and 70,000 which is above the approved minimum wage of 20, 000 Naira in the study area. Our findings further showed that income distribution varied across the residential zone. An analysis of variance confirmed the income variation (F = 9.241, P = 0.000). Additionally, 72.1% of respondents were employed with the government sector, with a lot of them being civil servants. This is not surprising though since majority of them earlier confirmed having tertiary education, which may position them to be employed in government sectors. Only few (8.1%) were unemployed and 12.6% were engaged in farming activities or occupation. Household car ownership was found to be income-dependent, with 42.1% of households owning at least one private vehicle. Distinct differences in socio-economic factors—including education, occupation, income, and car ownership—were observed across the residential zones.
3.2 Travel characteristics of respondents
This section explores the travel characteristics of respondents, including trip frequency, travel costs, modes of transport, trip purposes, and waiting times. This is highly necessary as this study explores the impact of transportation and mobility on the housing/location choice of respondents. Likewise, the impact of transportation technology has been found to play a key role in the mobility of people, with particular emphasis on their transport mode, travel cost among others. From our findings, we discovered that 76.5% of the respondents made an average of 1–2 round trips daily while the larger percentage (50.7%) of these trips do not extend beyond 1 km. this was attributed to the fact that majority of the activities are clustered together in the city and most people could easily access most essential services within the city center. Likewise, information on the travel mode showed that majority (49.6%) relied on the use of private vehicles while 38.2% attested to the use of public transport. The use of active mobility such as walking/cycling was significantly low among participants as only 9.8% of those surveyed attested to its use. However, this is not surprising as the condition of transport infrastructure necessary to support the use of non-motorized transport has been found to be poor and inadequate in most African cities, thus, limiting the use of active form of mobility as a form of movement.
3.3 Adoption of smart mobility and level of awareness
Kashorda and Waema (2014) and Aderibigbe et al. (2024b) highlight the global rise in using information and communication technology (ICT) to reduce physical travel. Based on the above, it was important to know the level of awareness and adoption of smart mobility option in trip making and implication on housing choice of household. It was discovered that 95% of the respondents attested to the awareness of smart mobility technologies such as telecommunication, personal computer, ride sharing app (uber/bolt) among others. However, only 45.6% of them adopt the usage of some of these smart mobilities in trip making. Majority attested to the conduct of physical mobility/movement with the use of their personal vehicles. Additionally, participants were asked to assess the user-friendliness of technologies associated with Smart Mobility Solutions (e.g., ride-sharing app, e-shopping app, e-banking app). The study reveals a low/negative perception as the mean score of 1.98 indicates that respondents are not familiar or do not use some of these applications in frequently conducting their physical movement.
The participants were requested to evaluate the importance of Smart Mobility on trip making and housing choice selection using a scale of 1–5, where 1 indicates “Not Important” and 5 indicates “Very Important.” As shown in Table 2, the survey results demonstrate broad consensus among respondents concerning the significance of Smart Mobility. The mean score of 4.51 of the impact of smart mobility adoption on travel time management of participants (out of 5) indicates a high level of perceived importance, while the median score of 5.00 suggests that most respondents agree with the influence of smart mobility technology at reducing traffic congestion. The standard deviation (SD) of 0.872 indicates relatively low variability in the responses, suggesting that participants' views were largely consistent. The findings on smart mobility adoption and traffic management reflects a widespread recognition of the role technology can play in improving urban transportation in the study location. Thus, reflecting an optimistic view of their eventual adoption and implementation. Table 2 further reflects the impact of smart mobility on housing location. The participants were asked about the impact of Smart Mobility Solutions on the choice of housing location. The survey results (mean score 2.15; median 3.00) indicate a neutral perception among participants regarding their effectiveness in the choice of housing location. This can be attributed to the fact that majority of the respondents do not telecommute, hence, little consideration may be given to smart mobility adoption in housing location as there might still be consideration for either private cars or public transport in conducting physical movement. However, the comparatively high standard deviation (SD) of 1.062 reveals substantial variability in participant responses, indicating that perceptions ranged from viewing the impact as minimal to considering it significant.
Table 2
| Variables | Scale (1–5) | Mean | Median | Standard deviation |
|---|---|---|---|---|
| Smart technology and trip reduction (substitution) | 1 = strongly disagree and 5 = strongly agree | 2.56 | 3.00 | 1.102 |
| Smart technology and travel distance reduction | 1 = No impact and 5 = very high impact | 3.15 | 4.00 | 1.203 |
| Smart mobility and travel time management | 1 = No impact and 5 = very high impact | 4.51 | 5.00 | 0.872 |
| Smart mobility and travel cost reduction | 1 = strongly disagree and 5 = strongly agree | 3.61 | 4.00 | 0.913 |
| Smart mobility and adoption of telework | 1 = No impact and 5 = very high impact | 2.81 | 3.00 | 0.805 |
| Smart mobility and housing location | 1 = No impact and 5 = very high impact | 2.15 | 3.00 | 1.062 |
| Smart mobility and ride sharing apps adoption | 1 = strongly disagree and 5 = strongly agree | 2.42 | 3.00 | 0.918 |
Descriptive statistics of the impact of smart mobility on trip making and housing choice.
Source: Author's field work 2025.
Likewise, the median and mean score of 3.00 and 2.42, respectively, for smart mobility impact on ride sharing reflects that smart mobility adoption as slightly influential on ride sharing. The finding is further supported by a median score of 3.00, which represents the central response. The mean score of 2.42 suggests that, on average, respondents perceive Smart Mobility Services as only slightly influential in shaping ride-sharing choices. The neutral median score of 3.00 reflects a balance of opinions—some respondents view these services as important and significant for encouraging ride-sharing, while others do not. Additionally, the standard deviation (SD) of 0.918 indicates a relatively high degree of variability in responses, pointing to differing experiences and perceptions among participants.
The value of VIF is 1 < VIF < 5 in Table 3 reveals that the variables are moderately correlated to each other. The small values of VIF corresponding to the variables show that there is no problem of collinearity. A condition index > 5 denotes a probable problem of multicollinearity. This result shows that there is no evidence of collinearity among majority of the variables as majority of the socio-economic variables such as income, age, car ownership as well travel characteristics such as trip frequency of respondents which have often been found to have or suspect multicollinearity does not exist in our work.
Table 3
| Variables | Standardized coefficient | T | Tolerance | VIF | Significant level |
|---|---|---|---|---|---|
| Constant | 2.021 | 0.01 | |||
| Income level | 1.102 | 1.115 | 0.112 | 1.303 | 0.42 |
| Age | −0.318 | −0.820 | 0.103 | 1.913 | 0.64 |
| Travel time | 2.154 | −2.402 | 0.169 | 1.765 | 0.01 |
| Travel distance | 0.815 | 0.941 | 0.201 | 2.306 | 0.03 |
| Car ownership | −1.103 | −1.862 | 0.602 | 1.571 | 0.38 |
| Trip frequency | 1.503 | 1.962 | 0.102 | 1.532 | 0.01 |
| Ride sharing | 2.002 | 2.901 | 0.023 | 2.012 | 0.00 |
Collinearity test for the relationship between some independent variables on smart mobility impact on trip making behavior and residential-self-selection of household.
VIF, variance inflation factor. Significant at the 0.05 level.
Source: Author's field work 2025.
The stepwise regression was employed to enter the predictor variables into the model and out of the seven predictors determining the impact of smart mobility on trip making and housing location in the study area (see Table 4), four (4) variables were significant while the remaining three were excluded as they were found insignificant. The significant variables are: Trip Distance; Travel time, Trip Frequency and Ride sharing. As presented in Table 4, trip distance was found to be the strongest predictor of adoption of smart mobility option with R and R2 values of 0.712 and 0.625, respectively (p < 0.005). This implies that over 60% of the variability in smart mobility adoption could be explained by the trip distance. Further, the addition of travel time and number of trips being (trip substitution or reduction) increased the R2 value to 0.687 and 0.701, respectively, implying that both travel time and trip substitution explain about 68.7 and 70.1% of the total variation in the decision of the respondents to adopt smart mobility in trip making behavior and residential self-selection. In the same way, the impact of ride sharing option in smart mobility adoption constitutes about 75.8% (R2 values of 0.758). The final model explained 75.8 % of the variance in respondents' decisions to walk and embrace smart mobility technologies.
Table 4
| S/N | Factor | Beta | R | R2 | F ratio | Sig |
|---|---|---|---|---|---|---|
| 1 | Travel distance | 0.218 | 0.712 | 0.625 | 9.876 | 0.02 |
| 2 | Travel time | 0.314 | 0.782 | 0.687 | 9.012 | 0.01 |
| 3 | Trip frequency | 0.214 | 0.809 | 0.701 | 8.765 | 0.01 |
| 4 | Ride sharing | 0.187 | 0.842 | 0.758 | 6.985 | 0.03 |
Multiple regression analysis for the impact of smart mobility on trip making behavior and residential self selection.
Source: Author's field work 2025.
*Constant = 2.021.
Regression coefficients for the four significant predictors were 0.218, 0.314, 0.214, and 0.187, with a constant term of 2.093. These estimates were used to construct the regression equation/model
y = 2.093 + 0.218 (travel distance) + 0.314 (travel time) + 0.214 (Trip Fre) + 0.187 (Ride sharing)
where y = Number of Time respondents adopt/consider smart mobility for trip making and housing selection, x1 = travel distance, x2 = travel time, x3 = trip frequency, x4 = ride sharing and ε = error term. Highlight of the model is that a unit increase in travel distance, travel time, trip frequency and ride sharing will stimulates respondents' adoption of smart mobility for trip making and housing selection by 0.218, 0.314, 0.214, and 0.187, respectively. This shows that respondents will consider the usage of smart mobility for trips or residential selection if they realized that distance to respective activities or housing location will increase. This is also the same for other factors. The combined influence of the four significant variables at influencing the decision to use smart mobility accounted for 75.8%, this implies that the coefficient of determination (R2) is 75.8%.
4 Discussions
This section presents the summary of the findings of the results in relation to previous studies. It presents detailed description of our findings and how it aligns with related studies.
One of the major findings of this study is that majority of the respondents were educated and middle age as seen from our result. This may be partly due to the fact that the study area is slightly urbanized, and forms the major hub of economic activities, where the youth and young adult resides. This aligned with the findings of Fadare and Oniya (2013) and Olawole (2013) which asserted that those with low level of education are often times found in the rural areas and traditional core centers of major cities while the educated and younger members of the society resides in the urban areas. The fact that majority of the respondents were employed with the government also reflects the demographic characteristics of the respondents as highly educated which may have implication on the use of smart mobility. The proportion of government-employed respondents also aligns with previous studies suggesting that individuals' educational attainment influences both their occupational choices and income levels (Ahn, 2001; Badiora, 2012; Stead and Marshall, 2001). The earlier observation of larger number of respondents with tertiary education may directly influence the type of jobs they engage in. So, due to the fact that significant portion of respondents are employed, their input provides critical context to the study. This indicates a strong employment base in the population, suggesting the conclusions are particularly relevant to the utilization and adoption of smart mobility. This difference reflects disparities in socio-economic status and policy support between developed and developing countries.
The fact that majority of the respondents do not make much trips is not surprising as studies by Ajani and Fakunle (2018) and Aderibigbe et al. (2024b) have also found that most slightly urbanized cities in most developing countries are easily accessed by respondents due to the clustering of activities. hence, limiting the number of trips being embarked on. It was also discovered that majority of households relied more on the use of private cars as their dominant mode of transportation. This is particularly common with most household in Nigeria as scholars Aderibigbe and Gumbo (2025) and Olojede et al. (2017) have asserted that most household in the developing countries like Nigeria rely more on the use of private automobiles due to the poor condition of the public transportation system which limits its patronage. Meanwhile, the use of active mobility such as walking has been found to be low due to the fact that transport infrastructure which supports active travel are either in sufficient or in poor condition in Nigeria, hence, affirms studies by Busari (2019) and Aderibigbe and Gumbo (2025).
Our findings on the adoption of smart mobility in conducting or making trips such as teleworking, e-shopping among others contradicted findings by Alotalbi et al. (2025) in Saudi Arabia where a significant proportion (77.8%) utilize smart mobility for commuting. Even though 95% of those surveyed are aware of smart mobility option such as the use of telecommunication, ride-sharing apps among others. Less than 50% of them utilize their platforms in conducting trips or for complementing their trips. The findings of Olawole (2013), which asserted that although, most people are aware of telecommunication usage due to the fact that Nigeria teledensity is high, only few explores its usage beyond call linkages to other uses such as e-shopping, e-banking among others. According to Nyazabe et al. (2025), adoption of technology by cities depends on several factors which include environmental factors, infrastructural development among others. Internet connectivity which can also be classified under this can influence the adoption of smart mobility. This may be due to the fact that internet connectivity in most African cities are poor and people often consider the cost of subscription which is has been deemed high by the low-income earners, hence, limiting the adoption of smart mobility as a favorable and alternative consideration in mobility and residential-self-selection. This further affirms the findings of Kumar and Verma (2025) and Bıyık et al. (2021); which opined that infrastructure cost which internet connectivity falls into is one of the barriers limiting the adoption of smart mobility. Most of the participant also attested to the neutrality effect of smart mobility on housing choice as people do not consider this option in residential self-selection. This is still a reflection of the little consideration or adoption of smart mobility option in their day-to day activities. This action can be attributed to the fact that majority of the respondents do not telecommute, hence, little consideration may be given to smart mobility adoption in housing location as they rely on the use of private vehicles for their daily commute.
Respondents asserted that factors which stimulates the adoption of smart mobility option in residential self-selection as well as trip making ranges from trip distance, trip frequency, travel time and ride sharing options. This implies that proximity could play a pivotal role in respondence adoption of smart mobility, hence, emphasizing the importance of good urban design and provision of adequate transportation infrastructures and facilities in residential locations. As reported by Mavlutova et al. (2023), perceptions regarding inclusivity and accessibility suggest opportunities remain to improve services for a wide range of demographic groups, which is consistent with the present findings. This implies that the design of our urban environment should ensure equitable access to infrastructures aimed at improving livelihood and also ensure that efforts are being made by government and stakeholders to train and enlighten citizens on the importance of these technologies. These findings further aligns with the study of Wang et al. (2022) which emphasized the importance of inclusive design in ensuring equitable access to smart transportation systems especially in medium-sized cities. Overall, residents generally hold favorable views of smart mobility; however, significant investments in infrastructure, cost reduction, and public awareness are required to realize its full potential.
5 Conclusion and recommendations
Our study examined the impact of smart mobility on trip-making behavior and residential self-selection in a medium-sized Nigerian city. Specifically, the study focused on the potential of Smart Mobility Solutions to influence both household travel patterns and decisions about where to live. Central to smart mobility is the goal of offering excellent service to citizens while limiting environmental impacts through initiatives such as real-time information systems, sophisticated traffic control, smart monitoring, and road safety enhancements. It was discovered that a significant majority indicated a readiness to use smart mobility options for commuting, reflecting strong interest in these emerging technologies. However, its adoption could be influenced by urban design, cost, and awareness on the potential of these technologies on trip making behavior and housing choice.
Hence, improving infrastructure is essential for the successful implementation of smart transportation systems that enhance both sustainability and economic efficiency. This includes expanding and upgrading public transport services, pedestrian pathways, and cycling facilities. Public awareness campaigns should also be introduced to educate citizens on the benefits of smart mobility solutions and promote their effective use, thereby increasing adoption rates. Efforts must focus on improving affordability and accessibility by reducing transport and internet costs, subsidizing public transportation as cost remains a significant barrier for many respondents. Furthermore, promoting eco-friendly transportation options can help address environmental concerns and encourage a shift toward more efficient travel behaviors. By adopting these strategies, policymakers and city planners can help ensure that smart mobility solutions correspond to community needs while promoting sustainable and efficient urban growth.
6 Limitations and agenda for future research
This study did not fully represent the broader population as well as consider the vulnerable populations which may face major barriers and challenges in accessing smart mobility technologies, thus, leading to skewed results. Hence, further research should give consideration to the marginalized or disadvantaged population such as aged, disabled, rural dwellers. Likewise, Future research should examine the long-term effects of smart mobility solutions and explore the behavioral factors that influence their adoption. Subsequent studies are encouraged to employ more randomized methodological designs than those used here. Addressing these gaps will help capture the nuanced factors that shape stakeholder perceptions of smart mobility.
Statements
Data availability statement
The raw data supporting the conclusions of this article will be made available by the authors, without undue reservation.
Author contributions
O-OA: Writing – review & editing, Writing – original draft, Methodology, Conceptualization. TG: Supervision, Writing – review & editing, Software, Writing – original draft, Resources, Validation.
Funding
The author(s) declare that no financial support was received for the research and/or publication of this article.
Conflict of interest
The authors declare that the research was conducted in the absence of any commercial or financial relationships that could be construed as a potential conflict of interest.
Generative AI statement
The author(s) declare that no Gen AI was used in the creation of this manuscript.
Any alternative text (alt text) provided alongside figures in this article has been generated by Frontiers with the support of artificial intelligence and reasonable efforts have been made to ensure accuracy, including review by the authors wherever possible. If you identify any issues, please contact us.
Publisher’s note
All claims expressed in this article are solely those of the authors and do not necessarily represent those of their affiliated organizations, or those of the publisher, the editors and the reviewers. Any product that may be evaluated in this article, or claim that may be made by its manufacturer, is not guaranteed or endorsed by the publisher.
References
1
Aderibigbe O. Gumbo T. (2025). Residential location and trip making behaviour of the elderly in a developing country, Nigeria: towards an inclusive and equitable society. Transport. Res. Proc.89, 16–29. 10.1016/j.trpro.2025.05.044
2
Aderibigbe O. Gumbo T. Deji J. (2024a). Transport system planning: interaction between capacity utilization and traffic congestion in Nigeria. Transport Probl.2024:19. 10.20858/tp.2023.19.2.04
3
Aderibigbe O. Gumbo T. Fadare S. O. (2024b). “Transportation technologies and transportation management,” in Emerging Technologies for Smart Cities: Sustainable Transport Planning in the Global North and Global South (Switzerland: Springer Nature), 43–77.
4
Ahn H. A. (2001). Nonparametric method of estimating the demand for mobile telephone network: an application to the Korean mobile telephone market. Inf. Econ. Policy13, 95–106. 10.1016/S0167-6245(00)00035-4
5
Ajani O. A. Fakunle S. O. (2018). Mobile phone use and travel behaviour of adult residents Ile-Ife, South- Western Nigeria. Res. Human. Soc. Sci.8, 71–77.
6
Alotalbi A. Almasoudi A. Alqurashi A. (2025). Investigation of the impact of smart mobility solutions on urban transportation efficiency in Saudi Arabian Cities. J. UmmAl-Qura Univ. Eng. Architect. 16, 379–394. 10.1007/s43995-025-00114-3
7
Badiora O. (2012). Spatial Pattern of Crime and Deliquency in Ile-Ife. An M.Sc Thesis Submitted to the Department of Urban and Regional Planning Ile Ife.
8
Bıyık C. Abareshi A. Paz A. Ruiz R. A. Battarra R. Rogers C. D. et al . (2021). Smart mobility adoption: a review of the literature. J. Open Innovat. Technol. Market Comp.7:146. 10.3390/joitmc7020146
9
Blanchard S. Wanddel P. (2017). UrbanAccess: generalized methodology for measuring regional accessibility with an integrated pedestrian and transit network. Transport. Res. Recors. 2653, 35–44. 10.3141/2653-05
10
Blumenthal P. M. McGinty J. R. (2015). Housing Policy Levers to Promote Economic Mobility. A Research Report for the Urban Institute. Available online at: https://www.urban.org/sites/default/files/alfresco/publication-pdfs/2000428-Housing-Policy-Levers-to-Promote-Economic-Mobility.pdf (Assessed January 15, 2023).
11
Busari A. A. (2019). Non-motorized trip pattern in sub-Saharan Africa: assessment of walk trip. Open Transport. J.13, 194–202. 10.2174/1874447801913010194
12
Chen Y. Yazdani M. Mojtahedi M. Newton S. (2019). The impact on neighbourhood residential property valuations of a newly proposed public transport project: The Sydney Northwest Metro case study. Transport. Res. Interdiscipl. Perspect.3:100070. 10.1016/j.trip.2019.100070
13
Chwiałkowski C. Zydron A. (2022). The impact of urban public transport on residential transactionprices: a case study of Poznan, Poland. Int. J. Geoinf.10.3390/ijgi11020074
14
Cordera R. Chiarazzo V. Ottomanelli M. dell'Olio L. Ibeas A. (2019). The impact of undesirable externalities on residential property values: spatial regressive models and an empirical study. Transport. Policy80, 177–187. 10.1016/j.tranpol.2018.04.010
15
Department of Research and Statistics (2009). Draft Digest of Demography and Vital Statistics Ondo State. Akure: Ministry of Economic Planning and Budget.
16
Edionwe O. Ogunba O. (2023). Enhancing accuracy and consistency in the valuation of plant and equipment through cubic regression models of physical deterioration. J. Afr. Real Estate Res.8, 62–87. 10.15641/jarer.v8i2.1434
17
Fadare O. Alade W. (2009). Intra urban variation of household's trip generation in Lagos metropolis. J. Nigeria Inst. Town Plann.12, 78–87.
18
Fadare S. O. Oniya O. B. (2013). Travel behaviour of the aged in Akure South Local Government, Area. Int. J. Contemp. Urban Reg. Dev. Multidiscipl. Perspect.4, 83–96.
19
Fattah H. A. Salleh A. G. Badarulzaman N. Ali K. (2015). Factors affecting residential mobility among households in Penang, Malaysia. Soc. Behav. Sci.170, 516–526. 10.1016/j.sbspro.2015.01.077
20
Harrison P. Todes A. (2012). Spatial Considerations in the Development of Urban Policy in South Africa: A Research Paper as Input into the Preparation of the Integrated Urban Development Framework (IUDF).
21
Ibrahim M. R. Masoumi H. E. (2018). The nuances of the supplied urban fabric in the MENA region: Evidence from Alexandria, Egypt. Land Use Policy73, 385–399. 10.1016/j.landusepol.2018.01.044
22
Johnson D. Ercolani M. Mackie P. (2017). Econometric analysis of the link between public transport accessibility and employment. Transport. Policy60, 1–9. 10.1016/j.tranpol.2017.08.001
23
Kashorda M. Waema T. (2014). E Readiness Survey of Kenyan Universities 2013. Nairobi: KENET.
24
Kgwedi R. Krygsman S. (2019). “Accessibility of public transport - with focus on access, egress and the line haul travel time,” in Proceedings of the 38th Annual Southern African Transport Conference.
25
Kumar M. Verma R. K. (2025). Transforming city transport: the impact of smart technologies on urban mobility. Int. J. Res. Publ. Rev.6, 7733–7736.
26
Kyeremeh C. Fiagborlo J. D. (2016). Factors influencing mobile telecom service access and usage in Cape Coast, Ghana. Microecon. Macroecon.4, 17–27.
27
Luke R. Mageto J. Twinomurinzi H. Bokaba T. Mhlongo S. (2025). Smart mobility in Africa: where are we now?Cities166:106212. 10.1016/j.cities.2025.106212
28
Mavlutova I. Atstaja D. Grasis J. Kuzmina J. Uvarova I. Roga D. (2023). Urban transportation concept and sustainable urban mobility in smart cities: a review. Energies16:3585. 10.3390/en16083585
29
Nyazabe S. Gracia G. R. T. Jaepyo P. J. Biong M. Bob N. Grace S. (2025). Investigating factors influencing the adoption of intelligent public transport systems for congestion reduction in developing cities. Transport. Dev. Econ.11:30. 10.1007/s40890-025-00253-1
30
Ogunbodede E. F. (2007). “Telecommuting and travel pattern. A Preliminary Assessment of the state of the practice of the use of GSM in Lagos State,” in A Paper Presented at the 45thAnnual Conference of the Nigerian Geographical Association held at the University of Ilorin, Ilorin 28th May and 4th June 2002.
31
Ogunsanya A. A. (2002). Maker and Breaker of Cities. 59th. Inaugural Lecture, University of Ilorin. Uni-Ilorin Press.
32
Olawole M. O. (2013). Exploring mobile phone uses and rural travel behaviour in Ijesaland, South Western Nigeria. Ife Res. Publ. Geogr.12, 29–44.
33
Olawole M. O. (2015). Analysis of intra-urban mobility of the elderly in a medium-size city in Southwestern Nigeria. Mediterr. J. Soc. Sci.6, 90–104. 10.5901/mjss.2015.v6n3s2p90
34
Olojede O. Yoade A. Olufemi B. (2017). Determinants of walking as an active travel mode in a Nigerian city. J. Transport Health6, 327–334. 10.1016/j.jth.2017.06.008
35
Park J. Goldberg D. W. (2021). A review of recent spatial accessibility studies that benefitted from advanced geospatial information: multimodal transportation and Spatiotemporal disaggregation. Int. J. Geoinf.10:532. 10.3390/ijgi10080532
36
Pojani D. Stead D. (2015). Sustainable urban transport in the developing world: beyond megacities. Sustainability7, 7784–7805. 10.3390/su7067784
37
Potoglou D. Maoh H. Wang Y. Orford S. (2019). “The impact of public transport infrastructure on residential land value: using spatial analysis to uncover policy-relevant processes,” in The Practice of Spatial Analysis (Cham: Springer), 275–293.
38
Stead D. Marshall S. (2001). The relationship between urban form and travel patterns. An Int. Rev. Eval.1, 113–141. 10.18757/EJTIR.2001.1.2.3497
39
Van der Merwe J. Krygsman S. (2020). The Relationship between Transport Accessibility and Employment Duration. WIDER Working Paper 2020/56. Helsinki: UNU-WIDER. Available online at: https://www.wider.unu.edu/publication/relationship-between-transport-accessibility-and-employment-duration (Accessed June 6, 2022).
40
Van Heerden Q. Karsten C. Holloway J. Petzer E. Burger P. Mans G. (2022). Accessibility, affordability, and equity in long-term spatial planning: perspectives from a developing country. Transport Policy120, 104–119. 10.1016/j.tranpol.2022.03.007
41
Wang J. Liu C. Zhou L. Xu J. Wang J. Sang Z. (2022). Progress of standardization of urban infrastructure in smart city. Standards2, 417–429. 10.3390/standards2030028
42
Wong R. C. P. Szeto W. Y. Yang L. Li Y. C. Wong S. C. (2018). Public transport policy measures for improving elderly mobility. Transport Policy63, 73–79. 10.1016/j.tranpol.2017.12.015
Summary
Keywords
mobility, residential self selection, travel behavior, transportation planning, smart cities
Citation
Aderibigbe O-OB and Gumbo T (2025) The impact of smart mobility on household's travel behavior and residential self selection in a medium sized city in Nigeria. Front. Sustain. Cities 7:1687580. doi: 10.3389/frsc.2025.1687580
Received
17 August 2025
Accepted
06 October 2025
Published
28 October 2025
Volume
7 - 2025
Edited by
Richard Kotter, Northumbria University, United Kingdom
Reviewed by
Sara Tarek, Cairo University, Egypt
Dahlan Tampubolon, Government Studies Department Universitas Riau, Indonesia
Updates
Copyright
© 2025 Aderibigbe and Gumbo.
This is an open-access article distributed under the terms of the Creative Commons Attribution License (CC BY). The use, distribution or reproduction in other forums is permitted, provided the original author(s) and the copyright owner(s) are credited and that the original publication in this journal is cited, in accordance with accepted academic practice. No use, distribution or reproduction is permitted which does not comply with these terms.
*Correspondence: Oluwayemi-Oniya Bosede Aderibigbe oboniya@uj.ac.za; oniyaob@gmail.com
†ORCID: Oluwayemi-Oniya Bosede Aderibigbe orcid.org/0000-0002-8914-323X
Disclaimer
All claims expressed in this article are solely those of the authors and do not necessarily represent those of their affiliated organizations, or those of the publisher, the editors and the reviewers. Any product that may be evaluated in this article or claim that may be made by its manufacturer is not guaranteed or endorsed by the publisher.