Abstract
With the rapid pace of urbanization and the subsequent dominance of private vehicle usage, cities are under increasing pressure to offer sustainable alternatives to public transportation. Demand-responsive transport (DRT) systems provide flexible, technology-enabled services that bridge first- and last-mile connectivity gaps. This study assesses the operational and financial viability of Dubai's Bus-on-Demand (DBOD) service using Daganzo's continuum approximation framework, calibrated with empirical data from two service areas in Dubai. From the agency perspective, the Alternating Priorities routing strategy (i.e., alternating between nearest pickup and drop-off) was identified as optimal, balancing distance optimization with service consistency and contributing to shorter travel and waiting times. Cost efficiency is highest in compact service areas with moderate demand, with optimal vehicle occupancy of 10–15 passengers to minimize agency costs. To incorporate the user perspective, value of time (VOT) was calibrated for DBOD and integrated with agency costs. Based on the calibrated VOT, fleet size and operational parameters were optimized within a system framework. Moreover, a comparative analysis of three routing strategies across occupancy levels confirmed the superior cost-effectiveness of the Alternating Priorities approach, as implemented in DBOD. The study recommends that transit agencies refine vehicle dispatching, routing, and scheduling strategies to achieve optimal occupancy levels, and emphasizes the necessity of balancing agency and user costs for sustainable DRT implementation. These findings provide transit agencies with an empirical, data-driven framework to evaluate and optimize DRT services, supporting informed decision-making for sustainable urban mobility.
1 Introduction
Given the steady rise in urbanization projected by the United Nations (United Nations, Department of Economic and Social Affairs, 2019) and the subsequent increase in urban transport passengers to the tune of 60–70% by 2050 (Chandakas, 2020), urban transport planning systems play a critical role in fostering sustainable cities. Although public transport serves as the backbone of transportation systems in densely populated cities (Hörcher and Tirachini, 2021), private cars continue to maintain their dominance as the primary mode of transportation today.
There is a need for alternative public transportation options that offer a viable and sustainable alternative to these private vehicles (Zheng et al., 2024). Demand-responsive transport (DRT) has emerged as a complementary solution to the existing public transportation infrastructure with tailored services that can meet the demands of the population. In recent years, the DRT has gained attention as an effective solution for enhancing public transit services (Lu et al., 2023; Azadeh et al., 2022; Dytckov et al., 2022; Mulley and Nelson, 2009; Coutinho et al., 2020). In contrast to the conventional transit with fixed routes, the DRT system stands out for its flexible service model with virtual routes and virtual stops, on-demand scheduling and dynamic route adjustments (Dang et al., 2021; Huang et al., 2020). The DRT system serves as a pivotal element in enhancing larger multimodal transit networks, efficiently bridging first- and last-mile (FLM) gaps. By also catering to intra-community transport and reducing reliance on private cars (Mouratidis et al., 2021; Chen and Wang, 2025), the DRT services clearly address two pillars of sustainability, namely, social and environmental. While promoting the use of battery-operated electric vehicles to reduce greenhouse gas emissions, DRT services further contribute to environmental sustainability through their flexible services (Deka et al., 2023). However, despite their potential acceptability, a number of DRT deployments globally have struggled with commercial sustainability and operational optimality (Currie and Fournier, 2020).
The current research study investigates the Dubai Bus-on-Demand (DBOD) system, which has demonstrated notable success in dense urban settings with mixed land use patterns. By analyzing real-world data from DBOD, the study aims to identify routing strategies and assess performance efficiency, particularly the commercial sustainability of DBOD. The goal is to provide public transport agencies with actionable insights for growth-oriented DRT implementation. The focus of this article is, therefore, to develop models that can be adopted by practitioners as budgeting tools, before the full-scale implementation of these DRT services, i.e., at the level of the pilot project. The literature review, therefore, focuses on identifying the various modeling techniques that have been adopted by researchers to assess the commercial feasibility of DRT services. The motivation of the study is then presented, followed by the study objectives. The rest of the article has been organized as follows: In Section 2, the methodology is detailed, describing the models used to estimate the agency and user costs. Section 3 describes the case study characteristics, followed by the calibration of the models using empirical data in Section 4. In Section 5, a detailed analysis of DBOD characteristics is carried out using the agency cost model to study the effect of changes in demand density (or service area) on the cost incurred by the agency. As focusing only on the parameters influencing the agency costs may result in increased time spent in the system by the users, the user cost models are defined and calibrated in Section 6. This is followed by the optimization of the system performance to determine the optimal operating capacity and fleet size, as well as the optimal routing strategy.
1.1 A literature review
In earlier decades, DRT services have received less attention in terms of monitoring and understanding their performance compared to fixed-route services (Currie and Fournier, 2020), due to a shorter history of observation and inherent variabilities (Spielberg and Pratt, 2004). However, in the recent past, DRT systems (Li and Quadrifoglio, 2009) have gained widespread recognition as an effective solution for addressing FLM connectivity challenges in urban areas (Chen and Wang, 2025). Harnessing the power of technologies like real-time traffic information and dynamic routing (Dytckov et al., 2022; Rich et al., 2023; Schlüter et al., 2021), this flexible service model provides a guaranteed expected time of arrival (ETA). This makes it a convenient, cost-effective, and environmentally friendly alternative to private cars and traditional public transportation (Kim et al., 2022; Deka et al., 2023).
While the DRT offers convenience, it comes with trade-offs, too. The DRT systems (Campisi et al., 2023) are characteristically more complex than fixed-route services, as they involve factors such as trip scheduling, waiting times, and deviations for passenger pickup and drop-off (Shang et al., 2019). Passengers may experience wait times for vehicle pickups (Zhao et al., 2024), and once on board, the vehicle may detour to accommodate other passengers, impacting the quality of service. The service quality (Džupka et al., 2025) can be assessed based on factors like waiting times, in-service times, and punctuality concerning passengers' desired arrival times at their destinations (Alonso-González et al., 2018).
The National Transit Database (NTD) statistics indicate that although DRT services make up only 5–7% of the overall transportation agency demand, they contribute substantially, accounting for 20–25% of the service owner's operational expenses. This has resulted in only a handful of successful DRT implementations across the world (Enoch et al., 2006; Baier et al., 2024; Currie and Fournier, 2020). These failures are often linked to overestimated budgets, limited field insights, and reliance on complex simulation models (Campisi et al., 2023; Bastarianto et al., 2023). Additionally, DRT services often struggle with low farebox recovery due to limited ridership and high per-trip costs (Mulley and Nelson, 2009). Despite these challenges, DRT systems continue to be explored as flexible and innovative transportation solutions, particularly in low-density or FLM contexts (Chen and Wang, 2025).
Modern DRT analysis utilizes diverse systematic approaches, each with unique benefits and limitations. Simulation-based models, such as SUMO and MATSim, offer detailed performance-based insights and can represent sophisticated response-oriented dynamics (Markov et al., 2021; Bastarianto et al., 2023) but require extensive data and resources (Markov et al., 2021). Agent-based models provide a micro-level understanding of individual passenger and vehicle interactions (Marković et al., 2016), while machine learning approaches can enhance routing and demand prediction through algorithmic learning (Wang et al., 2023). More recently, hybrid approaches combining multiple approaches have gained momentum for their ability to capitalize on positive attributes across different analytical frameworks.
In recent times, many of the DRT deployments have faltered (Currie and Fournier, 2020) and have not been commercially viable. From a practitioner's viewpoint, the main reasons for this are the overestimated budgets created without practical field insights, coupled with the challenges transit agencies face in developing complex simulation-based models (Markov et al., 2021). These models demand extensive data and resources, often proving infeasible for real-world applications. As a result, there is an increasing necessity to develop models and estimates for the performance (Westerlund, 2016) and cost of DRT services (Militão and Tirachini, 2021), with a particular emphasis on identifying practical strategies to enhance system efficiency (Alonso-González et al., 2018; Jang et al., 2025). While some researchers (Amirgholy and Gonzales, 2016; Rahimi et al., 2018) have advocated the use of analytical models due to their simplicity, efficiency, and practicality, others (Rich et al., 2023; Markov et al., 2021) have preferred statistical and machine learning models as they are computationally inexpensive and yield predictions instantaneously. The analytical modeling approach provides valuable data-driven insights and practical recommendations for optimizing transit operations, making them accessible and cost-effective for a wide range of practitioners and policymakers.
The analytical modeling approach provides valuable data-driven insights and practical recommendations for optimizing transit operations, making them accessible and cost-effective for a wide range of practitioners and policymakers, though the application of these models as budgeting tools remains relatively underexplored. The CA models were effectively used by Rahimi et al. (2018), Amirgholy and Gonzales (2016), and Connors et al. (2025) to evaluate the efficiency of implementing different policies that change the demand density for DRT services in New Jersey. In addition to demand density, the model was also adopted to analyze the effect of changes in service area because of policy changes, or the result of normal socio-economic processes that pattern or settlement and demand. In this study, the analytical model is taken a step further and adopted as a simple budgeting tool that can be adopted by public transit agencies before full-scale launch of these DRT services, i.e., after launching the pilot project. In the light of past DRT failures (Enoch et al., 2006), these models take on much significance, enabling the agencies to make informed decisions about expanding to other service areas using data that is easily available at the pre-launch stage. Once the DRT system is up and running, it is imperative to ensure that the services are commercially sustainable. The continuum approximation models (Rahimi et al., 2018; Amirgholy and Gonzales, 2016) can be adopted to approximate the operating cost for three prevalent loading-unloading operating strategies. Rahimi et al. (2018) adopted the strategy recommended by Daganzo (1978), which provided lower riding and waiting times for users for a given fleet size in detailed simulation models. However, a comparison of the three routing strategies was not carried out for the ADA paratransit service in New Jersey adopted in the study.
1.2 Motivation for the study
The Dubai Bus-on-Demand (DBOD) system offers a unique case for analysis of an up-and-running DRT system. A major factor for the success of DBOD is its targeted approach to serving smaller geographic regions compared to other global cities. This approach presents unique challenges and opportunities for analysis. Smaller service areas enable optimized routing and reduced travel times, which can lead to higher vehicle occupancy rates and lower operational costs. In addition to this, compact service areas help maintain a high level of service consistency and minimize overall travel time for passengers.
The service has been extended to additional areas, including Al Barsha, Dubai Silicon Oasis, Business Bay, and Al Nahda. These expansions have been fueled by the necessity to provide flexible and efficient transportation options in rapidly developing urban areas. These smaller areas also need strategic planning and optimization to ensure that the service remains cost-effective and meets the needs of the users. The unique characteristics of Dubai's service areas require a detailed analysis of demand patterns, vehicle occupancy levels, and routing strategies to optimize the balance between service coverage and operational efficiency.
The choice of Daganzo's (1978) continuum approximation framework for this study requires justification within the broader context of contemporary DRT modeling approaches. While considerable methodological advances have emerged in the field over the past four decades, including state-of-the-art simulation-based models, agent-based systems, and machine learning algorithms, the selection of Daganzo's CA framework is purposeful and systematically motivated. Due to their parsimonious property, they offer simple and often closed-form solutions to determine the optimal occupancy levels and fleet size. Moreover, they offer a theoretical framework for understanding the impact of agency and user costs on the routing strategy.
Amirgholy and Gonzales (2016) demonstrated that the efficiency of the DRT system can be improved by optimizing the operating capacity of the system, which is one of the parameters that define the agency's operating decision. However, the optimization strategies proposed were validated only with a numerical example, adopting an assumed value of the value of time (VOT) attributed by the DRT users. To the best of the authors' knowledge, the VOT of users has not been calibrated elsewhere in the literature. In this study, a practical approach to calibrate the VOT from empirical data is proposed to assess the feasibility of these services in terms of occupancy levels, fleet size and routing strategies. In this way, these models can be adopted as relatively simple budgeting tools that can be implemented at the pilot stage with only a few input parameters.
The unique attributes of Dubai's service areas, such as the concentrated service areas and balanced demand levels, highlight the importance of customized approaches to DRT systems. The success of DBOD in compact service areas suggests that strategic routing and demand management can enhance efficiency. To validate this, empirical data available from the DBOD running in Dubai, United Arab Emirates (UAE), is adopted to calibrate the components of the operating cost models, and thereby, identify the routing strategy adopted in Dubai. By calibrating CA models with DBOD data, this study aims to bridge the gap between theoretical modeling and real-world implementation, offering actionable insights for transit planners. Once the continuum approximation models have been calibrated for the service areas, they allow transit planners to study trade-offs between costs and levels of service through quick sensitivity analyses. Despite the case-specific nature of the results for Dubai's BOD, the understandings gained from this study will provide guidelines and/or recommendations for similar cities or service areas. Other cities with similar urban transport challenges can draw lessons from Dubai.
1.3 Objectives of the study
The study adopts an analytical modeling approach to evaluate the commercial sustainability in different service areas in Dubai, UAE. The objective of this study is as follows:
-
To calibrate analytical models using Daganzo's continuum approximation methods with empirical data from Dubai's Bus-on-Demand (DBOD) system to ensure precise performance estimation, which can be adopted to undertake comprehensive cost analysis.
-
To determine the vehicle occupancy levels that benefit improve system efficiency, in terms of cost and time.
-
To identify the optimal number of requests served per unit time to minimize the total cost (agency plus user costs), calibrated by the VOT.
-
To analyze different routing methods to identify the most effective one for Dubai's DRT system, to improve efficiency and/or reduce costs.
2 Methodology
In order to approximate the performance of the DRT system, various analytical (Amirgholy and Gonzales, 2016; Rahimi et al., 2018; Mehran et al., 2020; Huang et al., 2020; Papanikolaou and Basbas, 2021; Lu et al., 2011; Connors et al., 2025) and statistical models have been developed (Marković et al., 2016; Sultana et al., 2018; Wang et al., 2023), allowing transportation agencies to roughly estimate the cost of introducing the service. These models establish functional relations between the capacity of a DRT system and characteristics of the service region, level-of-service requirements and operator constraints (Pavanini et al., 2023). Analytical models based on real-world field operational parameters capture both operator and user-side variables (cost function, network design variables, and user cost).
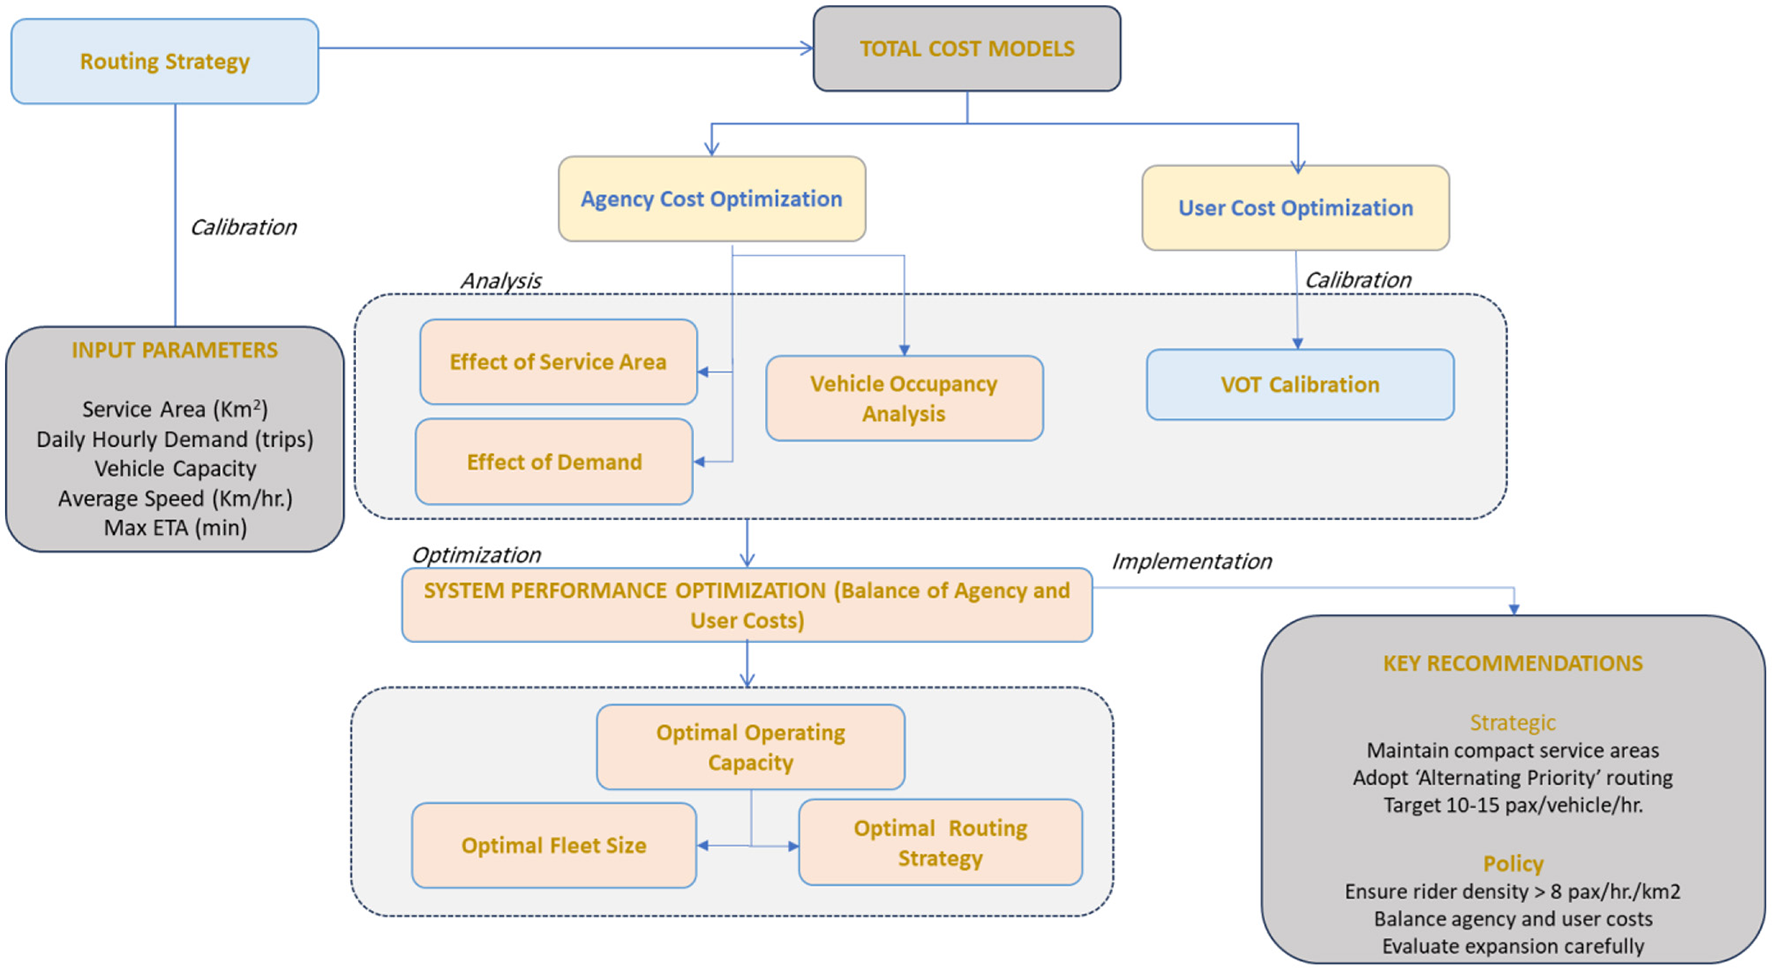
The methodology adopted to calibrate the agency cost models and develop the models to predict the system performance, by considering the user cost models, is depicted in the flowchart presented in Figure 1.
Figure 1
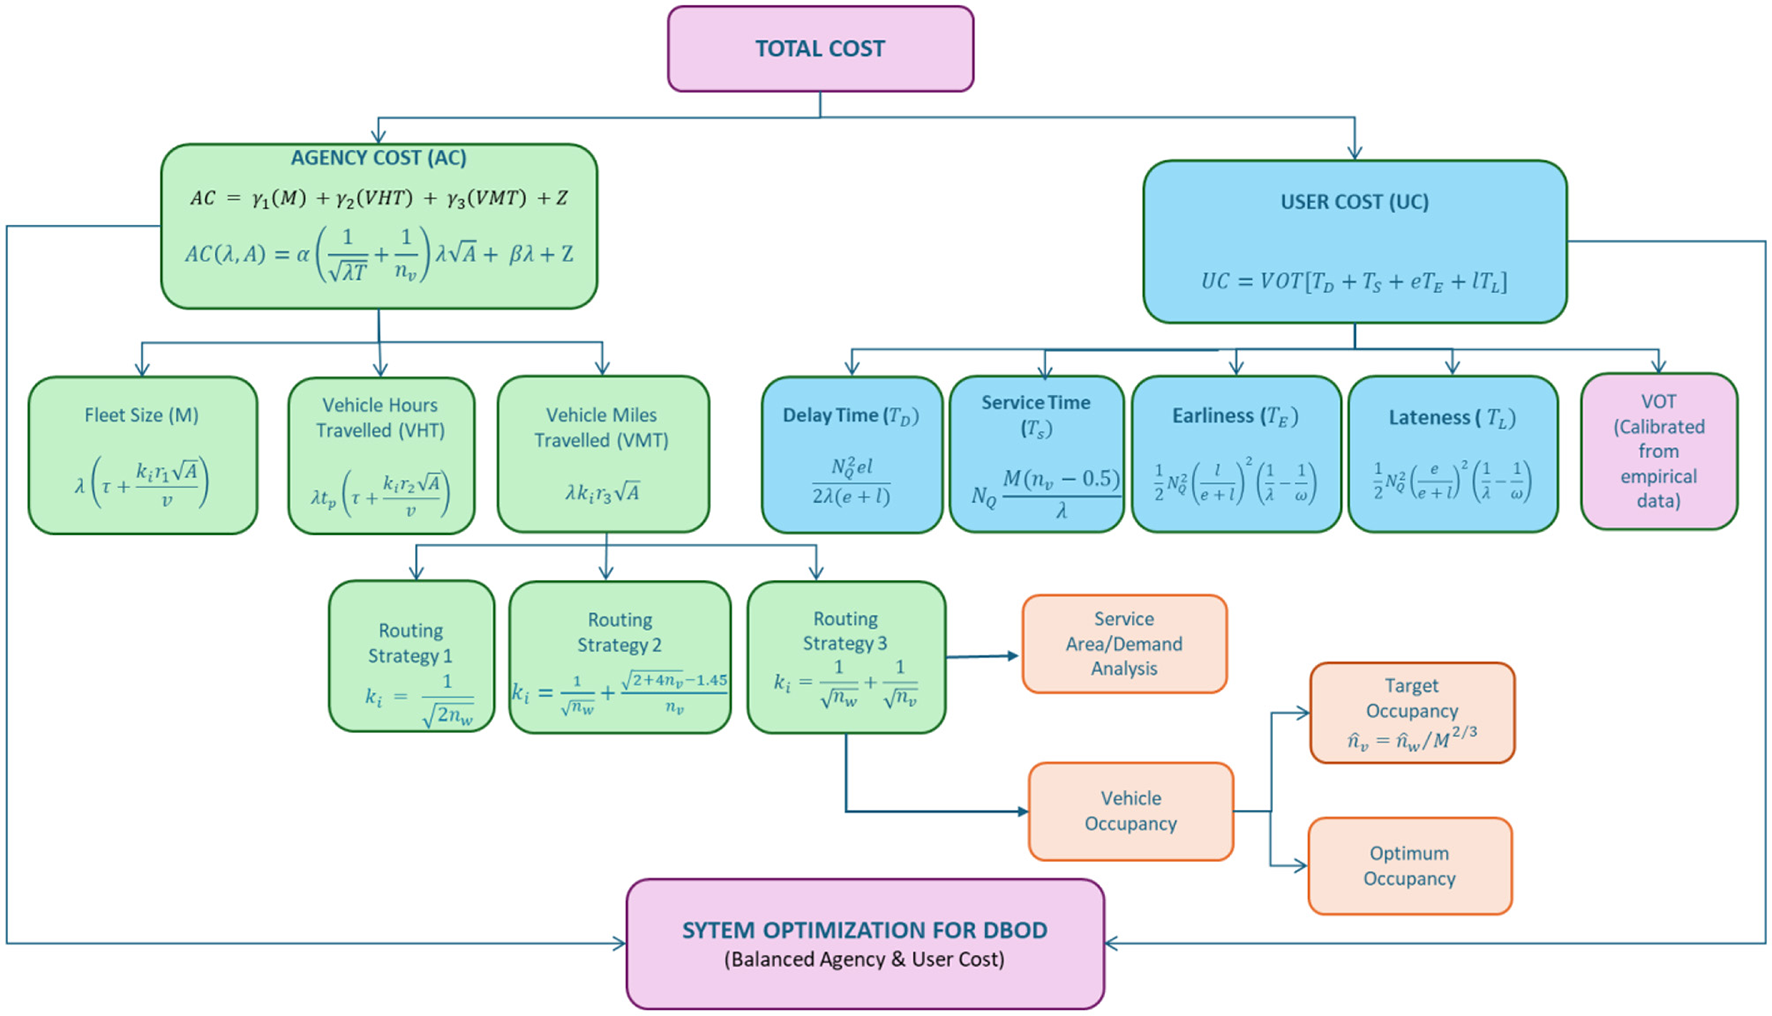
Methodology for system optimization.
2.1 Agency cost models
The analytical models proposed by Daganzo (1978) are adopted in this study to approximate the agency operating cost for three prevalent loading-unloading operating strategies (Rahimi et al., 2018; Amirgholy and Gonzales, 2016). The cost of operating a DRT system is influenced by factors such as demand patterns, quality of service, and various operating parameters, both operational and geographical (Rahimi et al., 2018). The agency (service owner's) costs can be divided into three main categories: fleet size (M), vehicle hours traveled (VHT), and vehicle miles traveled (VMT), along with some fixed costs. The complete agency cost (Rahimi et al., 2018) can be determined by aggregating the expenses linked to each category, in addition to the fixed costs (Z). Thus, the total agency cost (AC) is presented as a function of variables that are related to service owner's and fixed expenditures.
γ1, γ2, and γ3 symbolize the added cost for each extra vehicle, vehicle-hour, and vehicle-mile, respectively. The coefficients γi can be determined by carrying out a multiple regression analysis for various actual observed data sets with annual total cost as the dependent variable and the estimated M, VHT, and VMT as the independent variables.
The components of the operating cost of the DRT system are briefly described below for the sake of completeness, and more details can be found in previous studies (Rahimi et al., 2018; Amirgholy and Gonzales, 2016). These models are based on the assumption of uniformly distributed demand in each service region, and the operating algorithm adopted by the driver to serve the requested trips aggregates the performance of the system.
wherein ki represents the following three DRT operations strategy (Amirgholy and Gonzales, 2016) as defined below.
-
(i) The Nearest Point Strategy: In this strategy, the vehicle moves to the closest available pickup/drop-off point. Thus, the strategy is tied to optimize for the minimum total distance traveled, and moves between the (virtual) stops, irrespective of whether it is origin or destination, with no fixed sequence between pickups and drop-offs.
-
(ii) Batch Processing Strategy: This strategy separates the operations into distinct pickup and delivery phases and collects nv requests first (pickup phase) and then delivers all collected requests (delivery phase).
-
(iii) Alternating Priority Strategy: In this strategy, the vehicle collects initial nv requests and then alternates between the nearest pickup and drop-off. The strategy tries to balance distance optimization with service consistency.
wherein “r” is the circuity factor in a DRT system, which measures how much longer the actual travel path is compared to the shortest (straight-line) distance between a passenger's origin and destination. In other words, the circuity factor captures the inefficiencies introduced by shared routing, such as detours for picking up or dropping off other passengers. Thus, models provide an analytical formula that physically relates explanatory factors, such as the service area (A), the demand (λ), and the quality of service measure (r), to operational outcomes.
2.2 User cost (UC) models
In addition to the expenses incurred by the agency for a DRT service like the Dubai BOD, it is necessary to account for the costs incurred by the users. The user costs include higher delays, in-service travel time, earliness and lateness penalty that arise due to inadequate system capacity (Amirgholy and Gonzales, 2016). While some passengers may adapt their request times by adjusting their request time, the passenger already aboard the vehicle will experience a delay as the vehicle makes the detour (Huang et al., 2020). The cumulative effect of these individual results could result in equilibrium conditions, where Vickrey's (1969) congestion model can be adopted to approximate the general user cost. Accordingly, the user cost model has been adopted in this paper to study the impact of the DBOD parameters on the total cost (Amirgholy and Gonzales, 2016).
where VOT is the value of time for the users, TD is the delay, TS is the in-service time, TE is the earliness, TL is the lateness, and e and l represent the relative cost of earliness and lateness times in equivalent units of travel time. ω denotes the peak demand rate. From the user equilibrium queueing diagram, the components of the user cost are derived as:
where NQ is the total demand within a time period. The factors for earliness and lateness delay have been adopted from literature (Amirgholy and Gonzales, 2016; Huang et al., 2020) as 0.5 and 1.5, respectively.
3 Case study description and service characteristics
Dubai, located in the UAE, is renowned for its modern infrastructure and efficient public transportation system. The city has experienced rapid urban development and population growth, resulting in a significant demand for reliable and convenient transportation options for residents and visitors alike. To meet these needs, Dubai has implemented a comprehensive public transportation network that includes various modes of transportation.
The pilot project in Al Barsha (Service Area 1) and Dubai Internet City (DIC) catalyzed meaningful progress toward the Roads and Transport Authority's (RTA's) ridership growth goals. The project's expansion to three additional service areas, namely Dubai Silicon Oasis (Service Area 2), The Greens, International City, and (with inter zonal connectivity to the Dubai Academic City), provided additional FLM access to fixed-route services, particularly for those who live in areas difficult to serve with traditional fixed-route bus and metro services (see Figure 2). Although services in DIC and The Greens were discontinued due to the COVID-19 pandemic, the BOD initiative has since evolved, and it remains operational in select areas, including expansions into new areas (Business Bay and Al Nahda), supported by continuous enhancements in digital booking, routing algorithms, and service coverage.
Figure 2
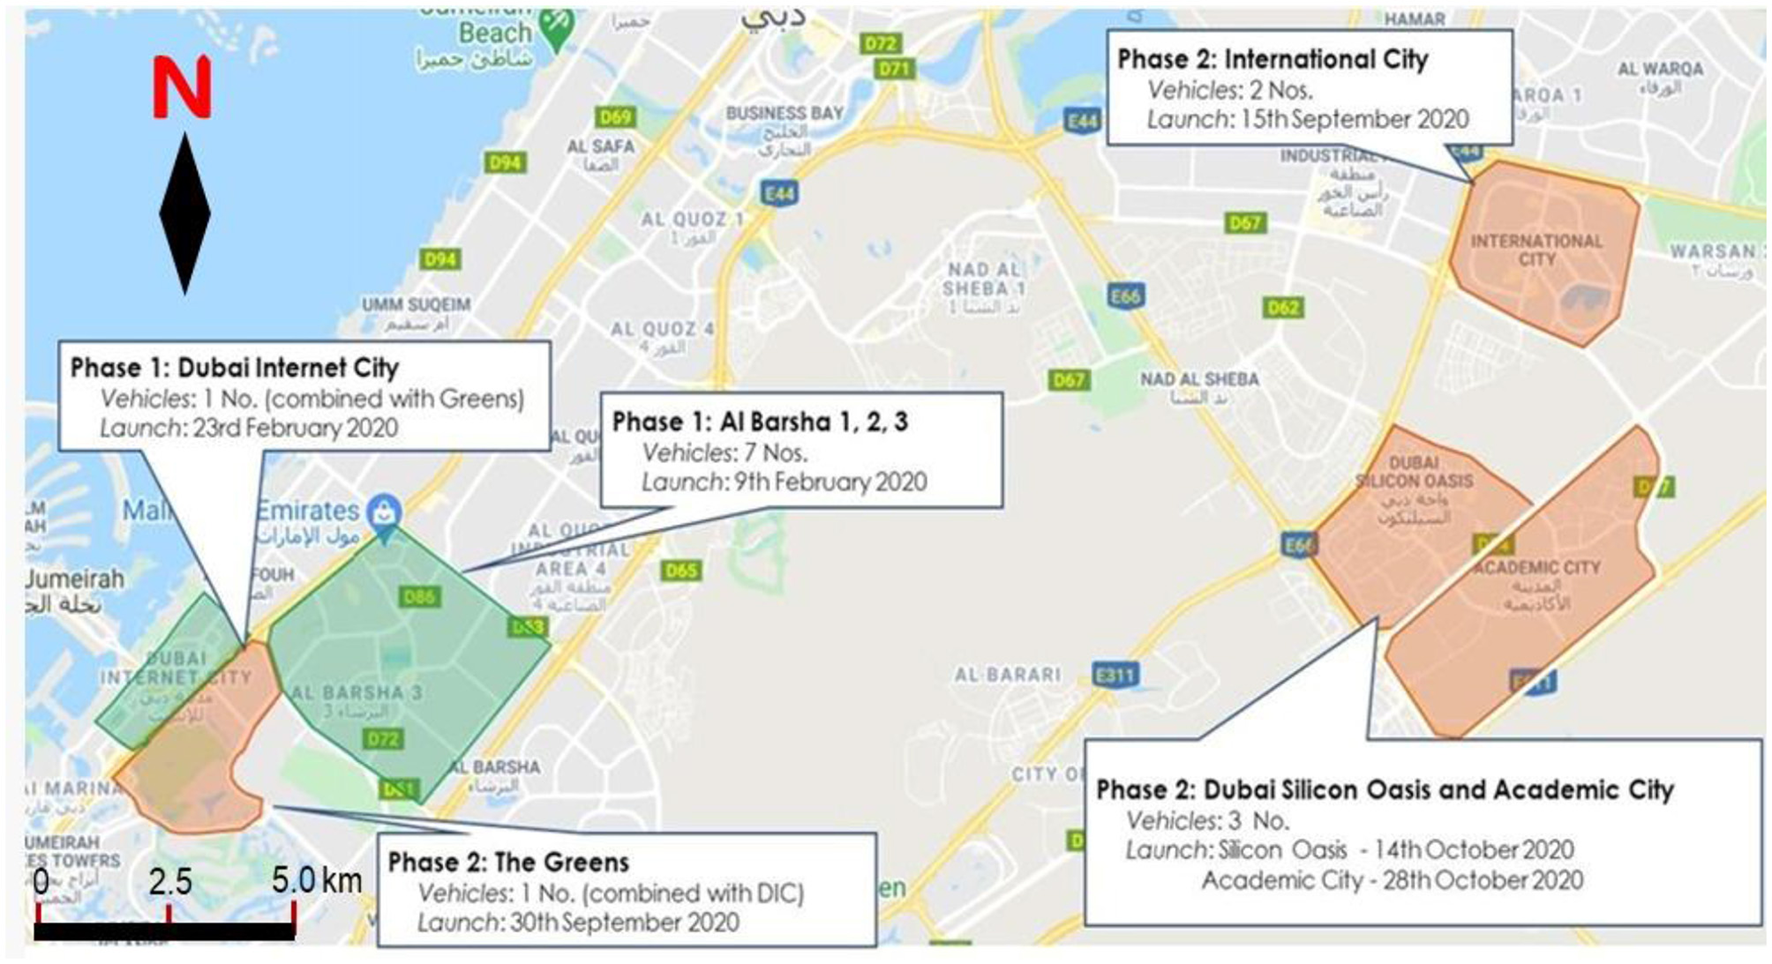
Dubai Bus-on-Demand initial service areas.
In 2024, RTA further advanced its smart mobility agenda by launching the Smart Bus Pooling project—an AI-driven initiative that dynamically groups passengers with similar routes into shared buses. The Smart Bus Pooling service is designed to cover major areas of Dubai, with a focus on improving accessibility, reducing underutilized stops, and enhancing service reliability through intelligent scheduling and stop placement. Together, these initiatives reflect RTA's commitment to integrating intelligent, demand-responsive solutions into the city's broader public transport ecosystem.
In this study, the empirical data for Service Areas 1 and 2 (see Table 1) are used for further analysis. The Service Area 1 comprises a 15.3 km2 area that provides FLM connection to the metro stations; many users also travel between home and leisure/work locations within the mixed-use zone, making it the most preferred reference community for further detailed analysis. Service Area 2, the Dubai Silicon Oasis, covering an area of 7.8 km2, also consists of intra-community travel without a metro head connection. The real-world operation data set from Service Area 1 has been utilized for the base-case scenarios, and the agency cost models developed in this study have been tested for Service Area 2 parameters.
Table 1
| No. | Parameter | Service Area 1 | Service Area 2 | Comments |
|---|---|---|---|---|
| 1. | Area of the community, A | 15.30 km2 | 7.87 km2 | Actual |
| 2. | Average speed of vehicle, v | 27.21 km/h | 33.26 km/hr. | Calculated |
| 3. | Average Boarding and alighting time, τ | 35 s per passenger | 35 s per passenger | |
| 4. | No. of equally distributed virtual stops, n | 383 | 197 | Calculated based on the community area and pickup walk distance parameters |
| 5. | Maximum pickup walk distance (PU Walk) | 200 m | 200 m | Assumption based on operation KPI |
| 6. | Maximum ETA (Estimated Time of Arrival), i.e., Waiting Period, T | 15 min | 15 min | Assumption based on DBOD KPI |
| 7. | Vehicle Capacity, C | 10 | 10 | Actual |
| 8. | Daily demand (average) λ | 796 | 312 | Actual |
DBOD service area characteristics.
The actual operational data set for Service Area 1 in Dubai is available for over a period of 3 months, from morning 5 am to midnight 12 depicting the variation in hourly operation.
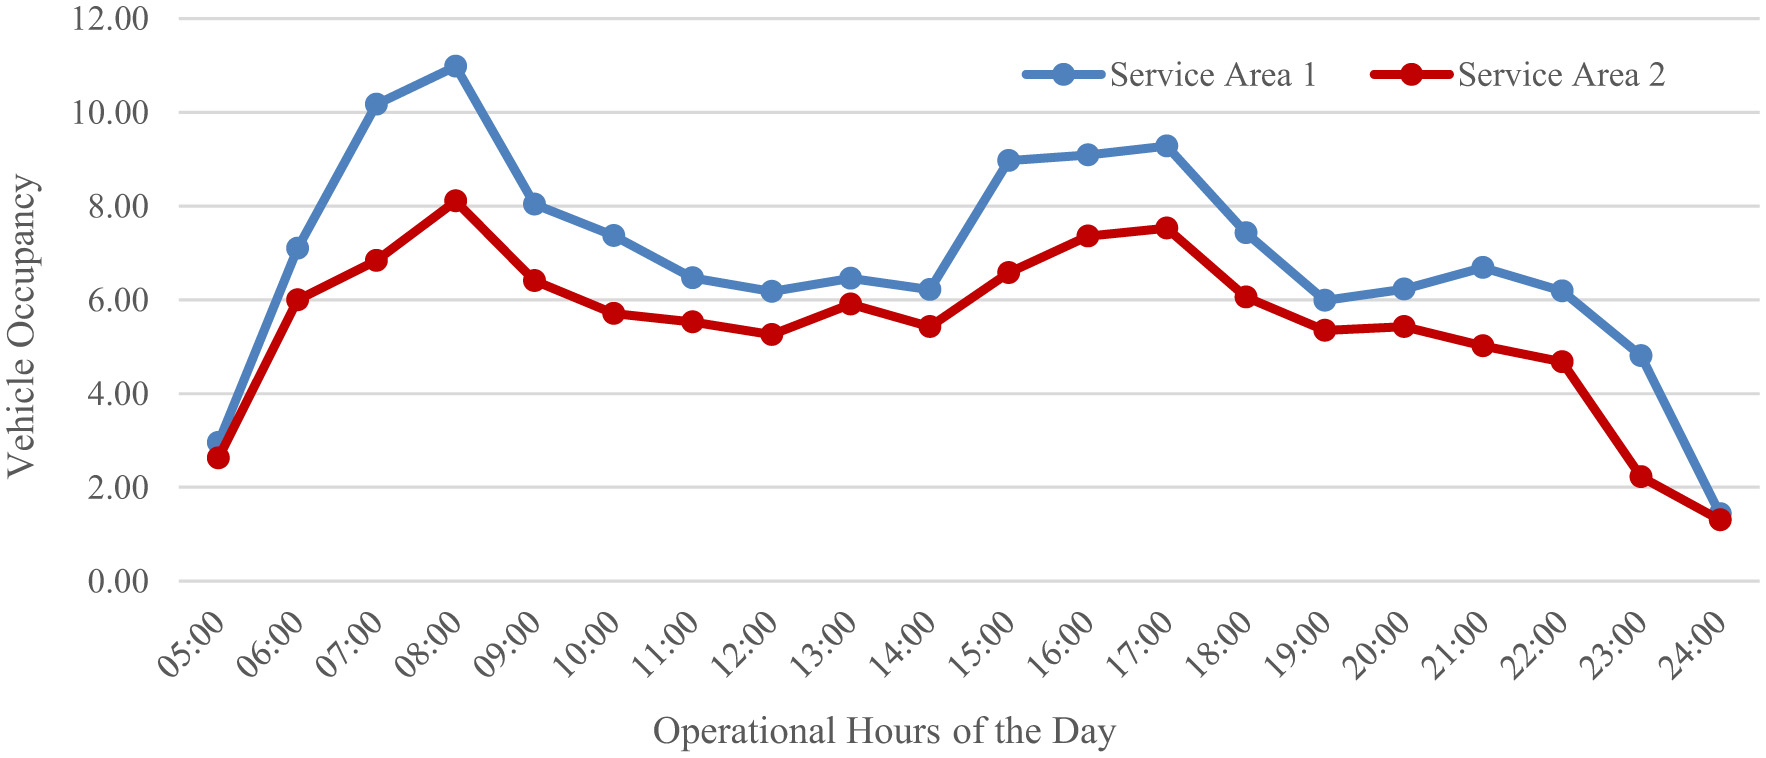
3.1 Demand and occupancy by time-of-day
The other service characteristics for the two areas are presented in Figure 3, depicting the total demand and vehicle occupancy by time of day, averaged over the dataset available. The total demand in Figure 4 includes the completed rides as well as the demand that is not met, due to cancellations or other reasons. For both areas, as the demand varies by the hour, each day is broken down into 1-h time periods to capture the varying demand characteristics. The morning peak is observed approximately at 8 am, while the evening peak is captured between 5 and 6 pm.
Figure 3
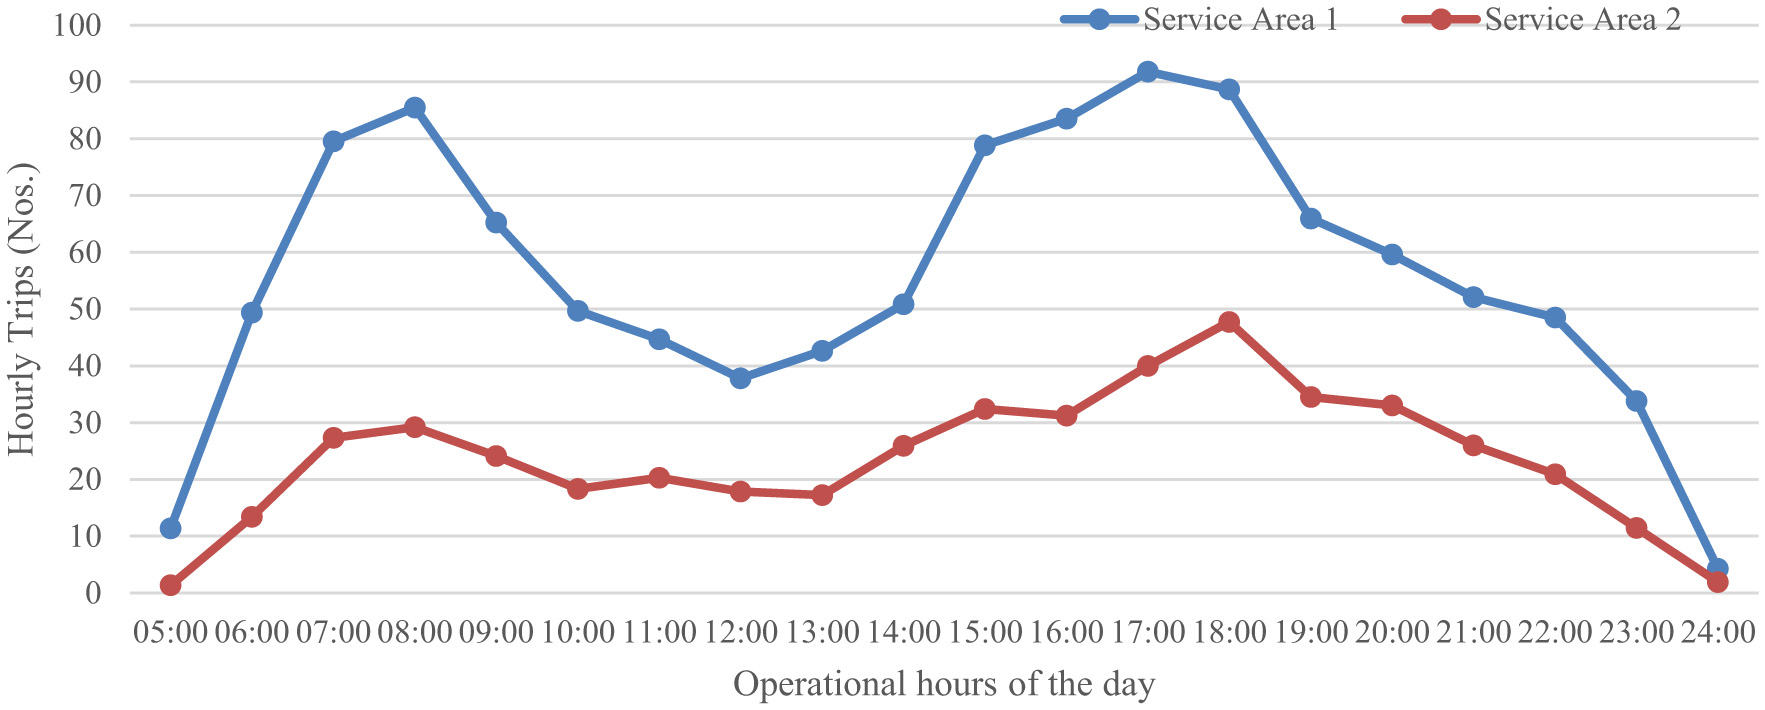
Service characteristics.
Figure 4
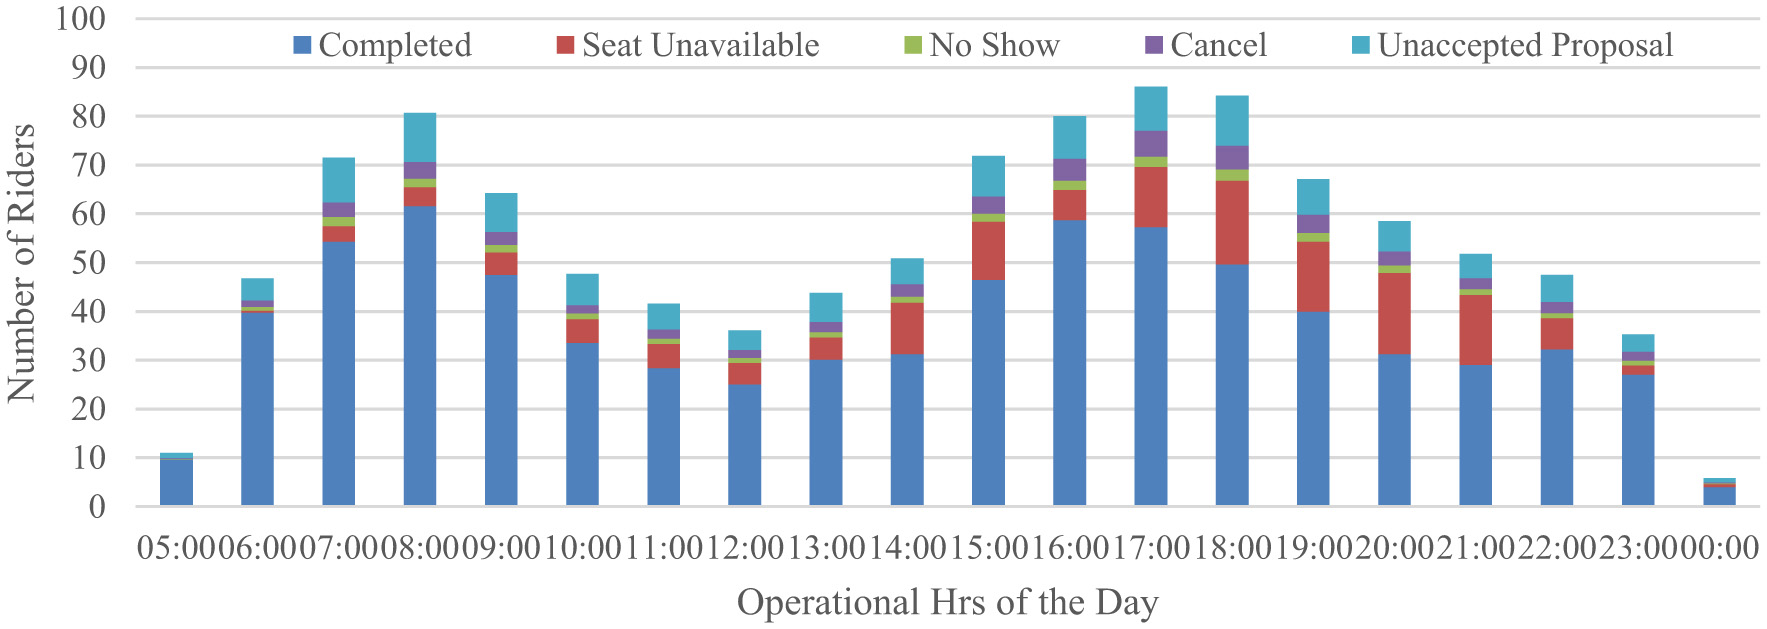
Completed trips vs. not completed trips.
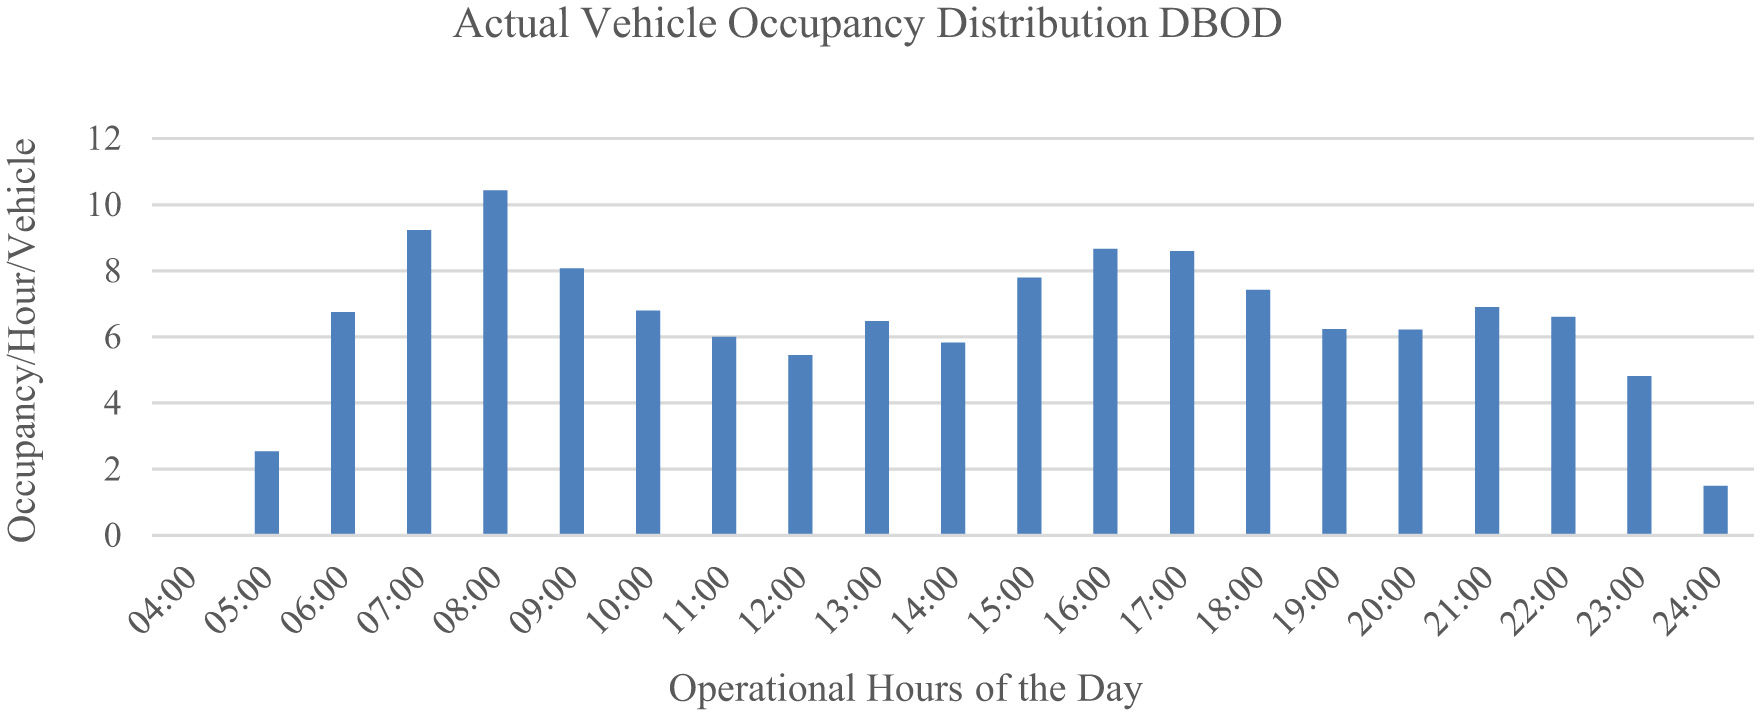
The vehicle occupancy trends reveal a consistent clustering of passengers throughout the day, with average occupancy levels exceeding six passengers per vehicle in Service Area 1 and over 4 in Service Area 2 during most operational hours (see Figure 5). These figures indicate a relatively efficient utilization of vehicle capacity, particularly during peak periods. Despite differences in area size and connectivity to metro stations, both service areas exhibit similar temporal patterns in demand distribution and occupancy levels, with pronounced peaks approximately 8:00 AM and between 5:00 and 6:00 PM. This alignment suggests that user travel behavior in both areas is influenced by common urban activity cycles, such as work and school commutes, highlighting the potential for standardized service planning across different zones.
Figure 5
Vehicle occupancy (utilization).
3.2 Met-demand by time-of-day
In undersaturated systems, the demand rate will always remain below the system capacity (Amirgholy and Gonzales, 2016). However, as seen in Figure 4, the demand rate for Service Area 1 often exceeds the capacity, particularly during the evening peak period between 5 pm and 9 pm. For instance, the met-demand at 8.00 pm is approximately 67% (and the observed number of vehicles is approximately 4.88), representing a situation of oversaturated conditions. Moreover, the data indicate that nearly 32% of the daily ride requests could not be completed.
4 Calibration of analytical models
The aggregate model builds on the basic operating assumptions for DRT services, where demand is uniformly distributed within a roughly circular region, and conditions do not change significantly within an analysis time period. For this study, we break each day into time periods of length tp = 1 h, within which the demand rate, λ, and network traffic speed, ν, are assumed to be constant. At any time, all of the demand within a pickup window of duration potential T are customers to pickup. In order to calibrate the models using Daganzo's model, Equations 2–4 are rewritten as follows (see Rahimi et al., 2018, for more details):
4.1 Determination of routing strategy for DBOD
Earlier simulation models using hypothetical data (Daganzo, 1978) and the empirical data for New Jersey's paratransit system (Rahimi et al., 2018) showed that for a given fleet size, the Alternating Priority strategy (3) provides lower ride and waiting times, outperforming the other two algorithms, especially as the service area gets larger. As the Dubai BOD system is currently serving much smaller areas with a small fleet size (less than 10), the routing strategy adopted by the DBOD is determined from the available data.
Using the observations from Dubai's BOD, the travel adjustment factors r1 for the fleet and VHT models, and r2for the VMT models are calibrated using ordinary least squares linear regression for all three routing algorithms. The results presented in Table 2, along with the adjusted R2 values, indicate that observed (aggregated) data appear to be a good fit for all routing strategies, with R2 values above 0.9 for both service areas. However, the travel adjustment factors are significantly different, with values higher than 5 for Strategy 1 and hovering closer to 2 for the other two strategies. As this factor is indicative of the efficiency of the DRT service performance and network circuity, it is imperative to identify the actual strategy adopted by the drivers from available data.
Table 2
| Service area | Model coefficients | |||||||||||
|---|---|---|---|---|---|---|---|---|---|---|---|---|
| Fleet size (M) and VHT | VMT | |||||||||||
| Strategy 1 | Strategy 2 | Strategy 3 | Strategy 1 | Strategy 2 | Strategy 3 | |||||||
| r 1 | R 2 | r ′1 | R 2 | r ″1 | R 2 | r 2 | R 2 | r ′2 | R 2 | r ″2 | R 2 | |
| Service Area 1 | 7.15 | 0.94 | 1.93 | 0.93 | 2.49 | 0.94 | 5.92 | 0.94 | 1.54 | 0.93 | 1.98 | 0.94 |
| Service Area 2 | 8.42 | 0.93 | 2.7 | 0.94 | 3.3 | 0.94 | 8.13 | 0.92 | 2.56 | 0.89 | 3.15 | 0.9 |
Model calibration results for the three operating strategies (aggregated).
As the aggregated models do not capture the detailed pattern of the pickups and drop-offs, by averaging out the system performance, the models are now calibrated for the disaggregated data available. Moreover, the root-mean-square error (RMSE) is also calculated to quantify the average squared difference between the actual data, yi and the predicted values using,
where n is the size of the dataset.
The average circuity factor determined through the best-fit regression equation by plotting the actual ride distances determined by using Google Maps key with the straight-line distances between the pickup and drop-off coordinates for each of the completed rides for the data set works to be 2.08 (regression coefficient 0.85). The circuity factor for routing strategy 3 closely resembles the travel adjustment factor for both the VMT and fleet size (M) model. Moreover, the RMSE is calculated to quantify the average squared difference between the observed data and predicted data, which is minimal for routing strategy 3 as compared to routing strategy 2 (see Table 3).
Table 3
| Service area and RMSE | Model coefficients | |||||||||||
|---|---|---|---|---|---|---|---|---|---|---|---|---|
| Fleet size (M) and VHT | VMT | |||||||||||
| Strategy 1 | Strategy 2 | Strategy 3 | Strategy 1 | Strategy 2 | Strategy 3 | |||||||
| r 1 | R 2 | r ′1 | R 2 | r ″1 | R 2 | r 2 | R 2 | r ′2 | R 2 | r ″2 | R 2 | |
| Service Area 1 | 6.98 | 0.92 | 1.67 | 0.92 | 2.18 | 0.93 | 6.66 | 0.85 | 1.57 | 0.80 | 2.05 | 0.82 |
| RMSE | 1.70 | 1.75 | 1.66 | 49.85 | 98.39 | 54.72 | ||||||
Model calibration results for the three operating strategies (disaggregate).
4.2 Development of agency cost models
The applications of the agency cost model shed light on ways in which demand and operation characteristics of the DRT system affect the agency cost in terms of fleet size, vehicle hours traveled, and vehicle miles traveled. Since the time period tp is adopted as 1 h in this study, the VHT will be equal to the fleet size (M). In this case, Equation 1 will be reduced to:
For Service Area 1, the agency cost models developed using the aggregated data are obtained as follows:
The higher value of the fleet size (M) coefficient, particularly observed in the case of the disaggregate model, highlights the need of operating the right number of vehicles to reduce the agency's operating costs (Rahimi et al., 2018).
5 Analysis of DBOD characteristics using the agency cost model
In order to analyze the service characteristics of DBOD, the agency cost model is expressed in terms of the service area parameters as follows:
where and β = (b1 + b2)(γ1) are fixed parameters independent of demand, service area and occupancy.
5.1 Effect of service area changes at varying levels of demand density
The effects of the service area and the demand density on agency costs are depicted in Figure 6, indicating that for smaller areas, the influence of the demand density on the agency costs is not significant. However, the influence of the demand density grows with the area, and for larger communities where the demand is more spread out and for longer riding distances, the agency costs can increase significantly.
Figure 6
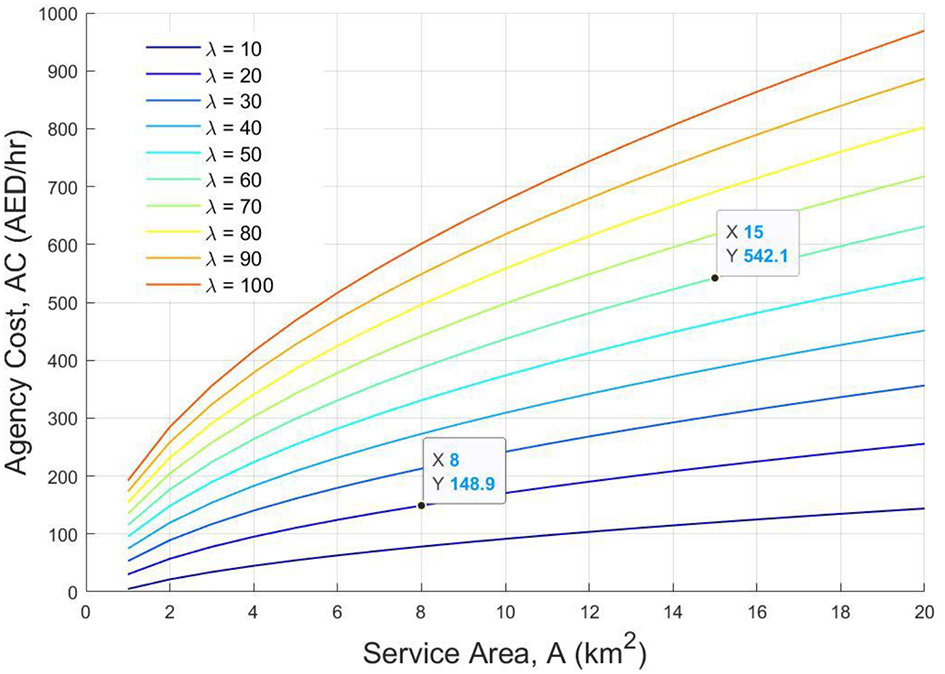
Agency cost vs. service area.
While the agency cost model was developed using the aggregated data from Service Area 1 (area of 15.31 km2), these analytical models can be used for quick estimations of other areas with similar service characteristics. For instance, for a service area of 8 km2, the costs incurred by the agency are estimated to be approximately AED 148/h when the demand density is expected to be approximately 20 pax/veh. From the empirical data available for Service Area 2 (area of 7.87 km2), the agency cost was approximately AED 134/h, which is reasonably close to the estimated costs.
From Figure 7, for nearly equal values of rider density (approximately 5 pax/km2/h as shown in the figure), when the density is achieved by increasing the demand from 60 to 100 pax/h, the agency cost is nearly two times that when the same density is achieved in a smaller area. A similar conclusion can be drawn from Figure 8 (depicting the effect of both demand and area together) as well, i.e., an increased density as a result of increased demand growth (pax/h) will lead to a greater increase in agency cost than when the same density is reached by reducing the service area. This suggests that while expanding service coverage or accommodating higher demand may be necessary, doing so without strategic optimization can significantly burden operating budgets. Notably, the most cost-efficient operations occur in compact service areas with moderate demand levels, reinforcing the importance of rider density-focused planning in transport service design.
Figure 7
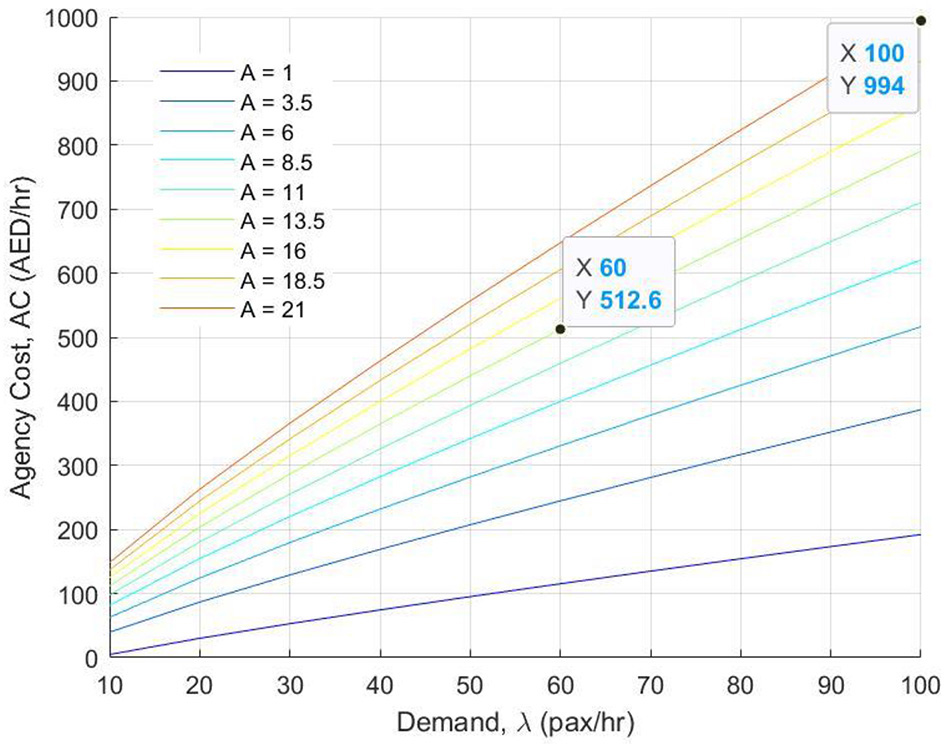
Agency cost vs. passenger demand.
Figure 8
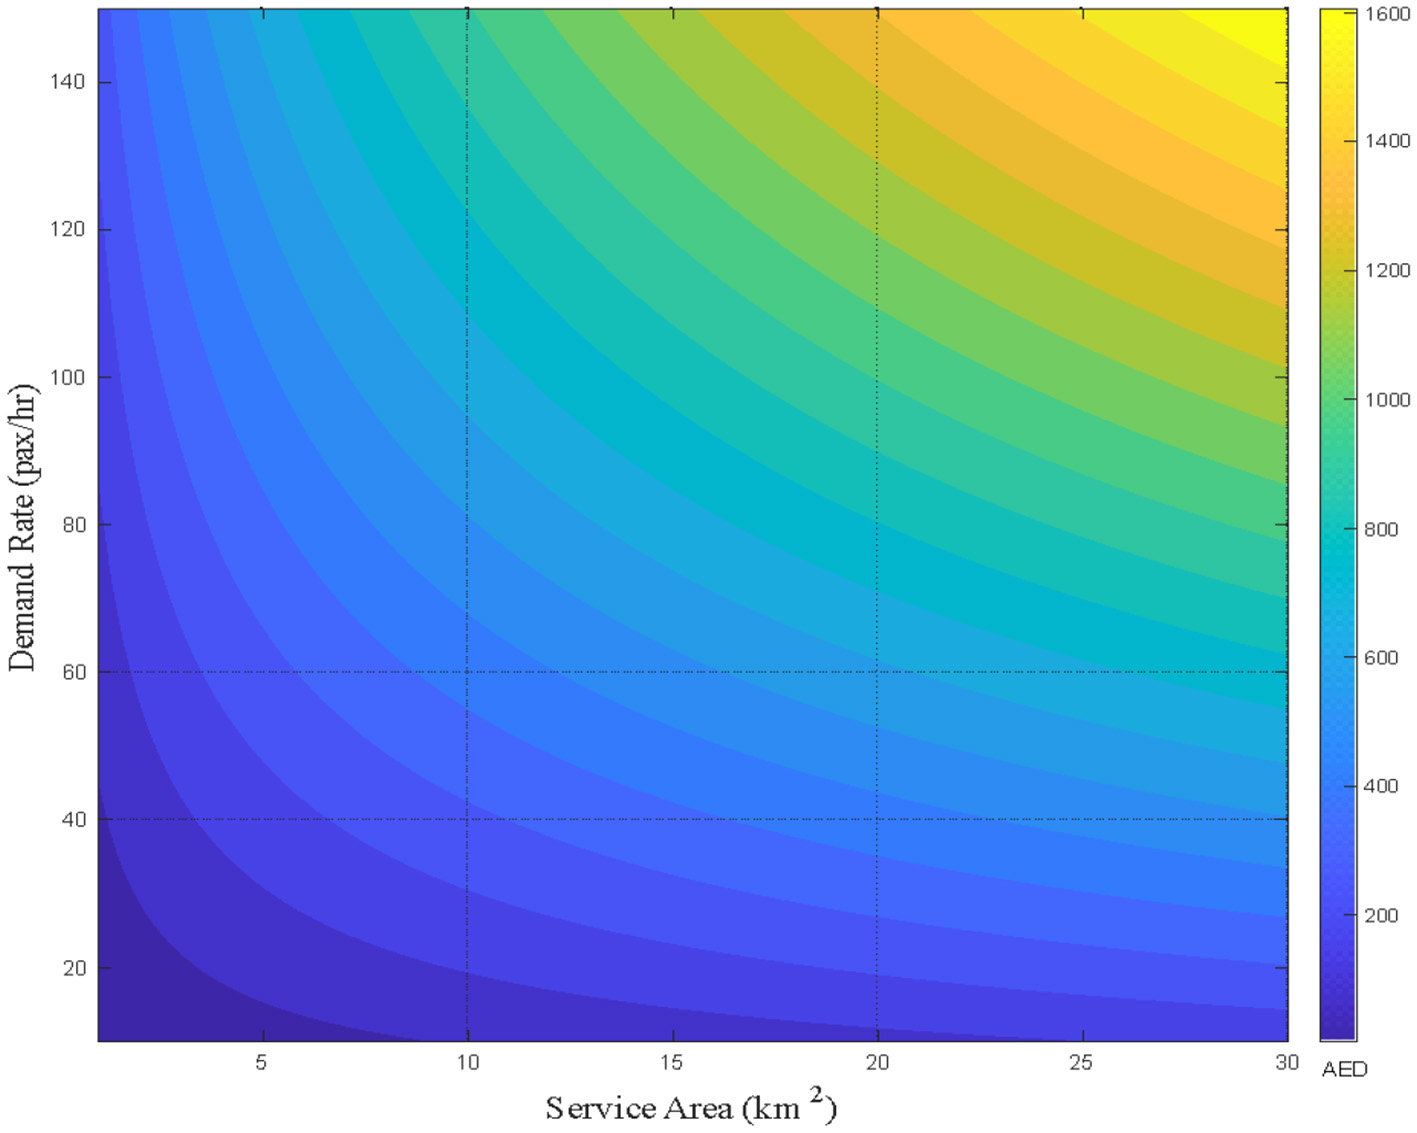
Effect of service area on the agency cost.
5.2 Effect of changes in demand density (or service area)
In order to determine how any change in the service area or demand affects the costs, the average cost per trip is computed by dividing the agency cost in Equation 19 by λ, which is plotted in Figure 9, showing all combinations of demand and service areas. As it is desirable to implement changes only if they cause a shift to a lower cost contour (or at least remain on the same contour), the slope of the average cost contour is computed as follows (Rahimi et al., 2018):
When a policy is implemented that changes the rider density to δnew (hourly pax/area), the DBOD service becomes more cost-effective only if . In other words, the system scales efficiently only if the demand outpaces the critical slope of the average cost contours. For example, if the service area is expanded from 20 to 25 km2, then, to maintain cost-effectiveness at constant occupancy levels, the demand must increase from 38 to at least 78 passengers per hour. If, on the other hand, the maximum rider density that is expected with the increased service area is only 68, the (slightly) increased agency costs will have to be justified. For this particular scenario, any new policy must yield a rider density greater than 8 pax/h/km2 (i.e., 78–38/25–20) in this region to be cost-effective. If demand grows more slowly than this threshold, the average cost per trip increases, making the expansion inefficient.
Figure 9
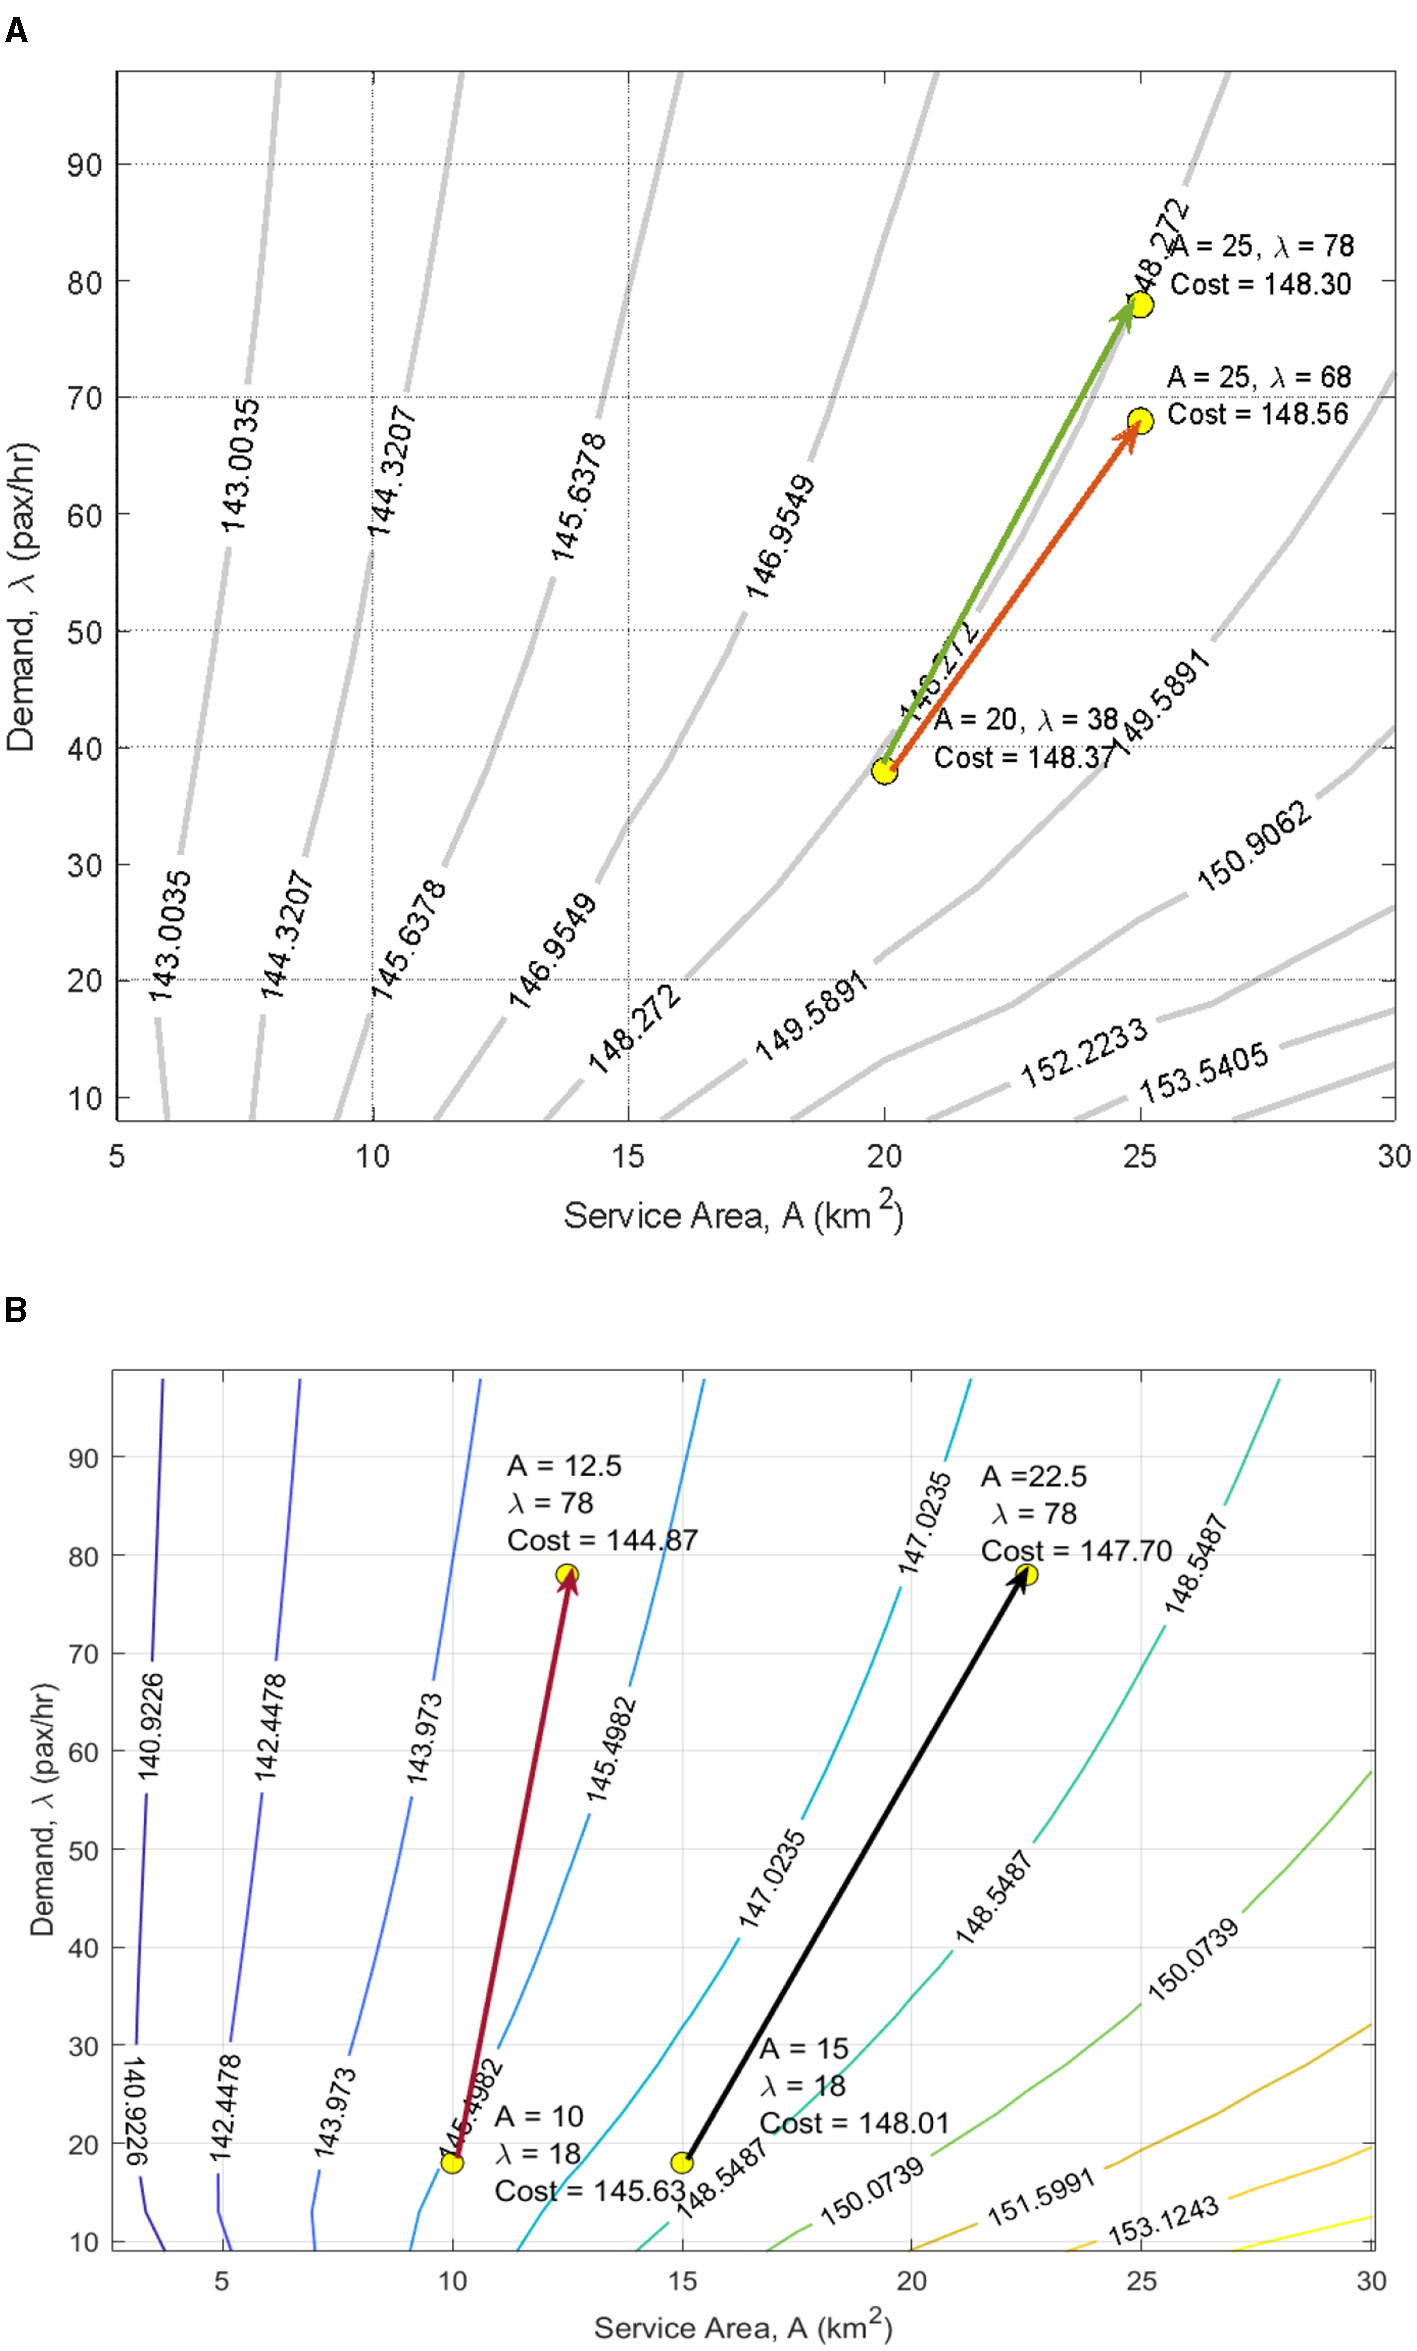
(A) Agency cost for combinations of demand and service areas. (B) Agency cost for combinations of demand and smaller service areas.
Another observation that can be made from Figure 9B is that the contours are steeper in the case of the expansion of smaller areas. For instance, in the case of Scenario A (red arrow), the rider density needs to be increased from 1.8 to approximately 6.2 hourly pax/area, while in the case of Scenario B (black arrow), the rider density is expected to increase from 1.2 to 3.5 for the policy to be cost-effective.
5.3 Analysis of vehicle occupancy
As the vehicle occupancy (or the vehicle utilization) is one of the significant variables affecting the costs, this section examines two related parameters, namely the target occupancy level, (to reduce the agency cost) and the optimal occupancy level, (to minimize the time spent in the system).
5.3.1 Target occupancy level
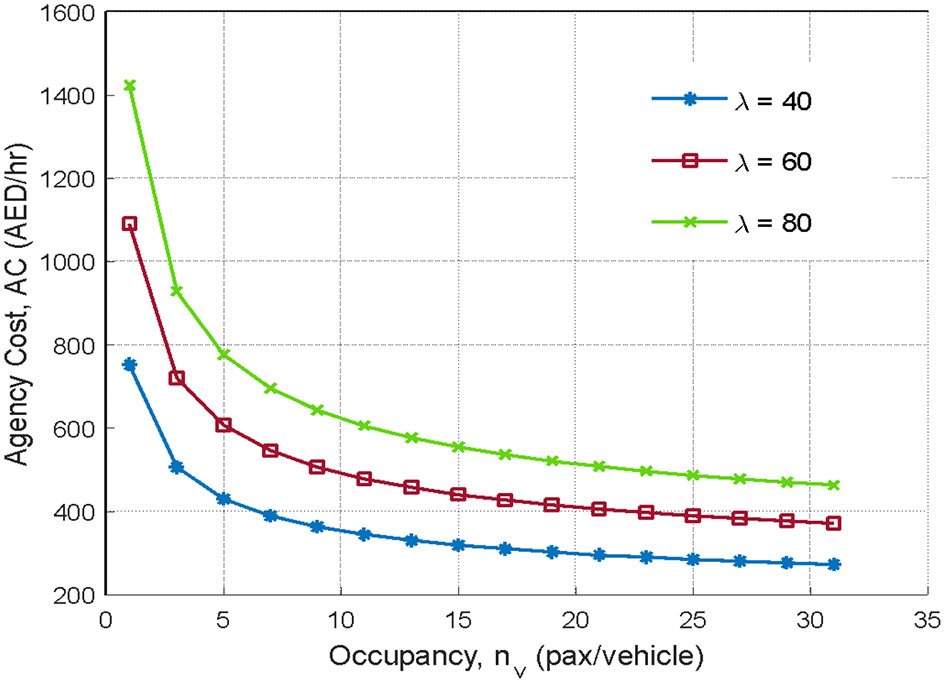
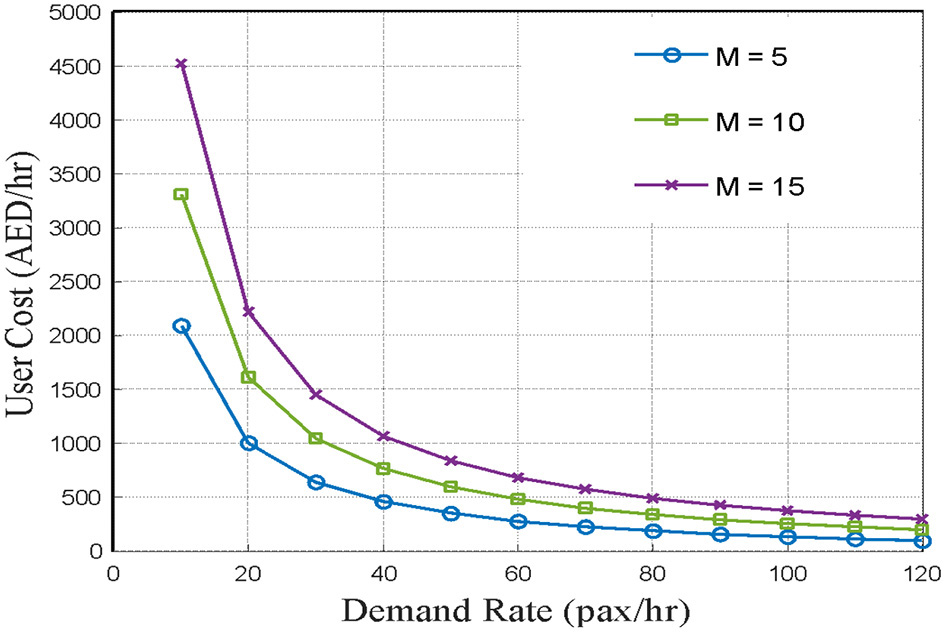
The effect of occupancy on the agency cost at constant demand levels, keeping all other parameters constant, is depicted in Figure 10. For demand levels (λ) of 40, 60, and 80 requests/h, the agency costs drop significantly between the occupancy levels of 10 and 15 pax/vehicle. This indicates that the DBOD, despite being a flexible transportation mode, still retains the “economies of scale” characteristics of the public transit system. When the occupancy levels are below 5, the DBOD can be considered as a typical ride-sharing service, i.e., the taxi service (Huang et al., 2020). As the agency costs become steady above 20, the operating costs cannot be further reduced by deploying larger vehicles with higher capacities.
Figure 10
Effect of occupancy on the agency cost.
For Service Area 1, with an average occupancy of 6.9 pax/vehicle, the DBOD system operates closer to the ride-sharing (taxi-like) region rather than the high-efficiency public transit-like zone. This implies that the economy of scale is not being achieved, and the cost per trip is still quite high. In order to achieve the benefits of the “economies of scale” (where costs drop due to higher utilization), the target occupancy level should be 10–15 pax/vehicle. This can be achieved through vehicle dispatching, routing, or scheduling strategies that need refinement. On the other hand, deploying larger vehicles with higher capacity would not help unless occupancy also rises.
5.3.2 Optimal occupancy level
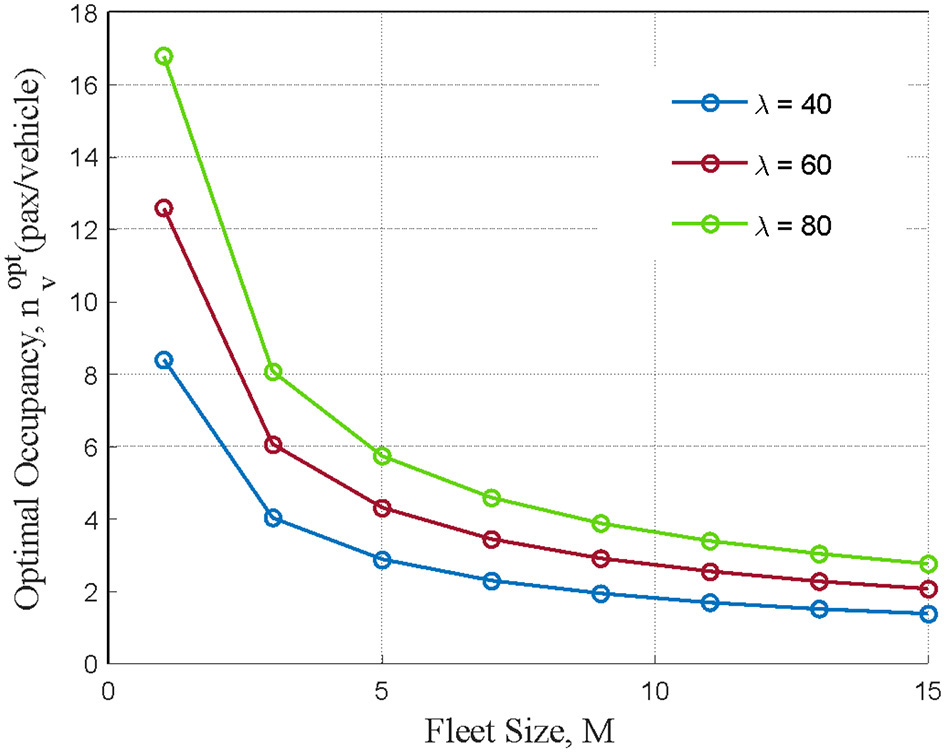
In order to determine the optimal occupancy level, the number of requests awaiting service nw (for Strategy 3) can be computed from Equation 21 as follows (for more details, refer to Daganzo, 1978):
and the total time spent in the system is
The occupancy level that minimizes t subject to Equation 21 is the optimal number of passengers on each vehicle and is given by . Thus, the optimal occupancy level that minimizes the time spent in the system is shown in Figure 11.
Figure 11
Fleet requirement for achieving optimal occupancy.
The figure indicates the optimal occupancy levels for different fleet sizes (M) that will reduce the time a rider spends in the system. For Service Area 1, with a fleet size (M) of 7, it can be seen that optimal occupancy levels are estimated to be below 6.
Thus, the for the DBOD is estimated to be in the range of 10–15 pax/vehicle to achieve economies of scale, while the occupancy levels that optimize the total spent in the system t are below 6. For Service Area 1, the average occupancy level is 6.9; the occupancy levels vary from 6 to 11 in the peak periods, as depicted in Figure 12. From this analysis, it is clear that the DBOD service in Area 1 tries to achieve a balance between reducing the total time spent in the system and the agency costs (i.e., by trying to increase occupancy levels at peak times). The total time spent in the system reflects the VOT of the Bus-on-Demand users, and in addition to the evaluation of the agency costs, it is crucial to consider the consequences of user costs on passenger experience.
Figure 12
Fleet requirement for achieving optimal occupancy.
User costs, such as delays, in-service travel time, earliness, and lateness penalties, directly impact the overall satisfaction and reliability of the DRT system. In case the user costs are higher, it may lead to longer waiting times, rendering the service less reliable, thereby affecting the passenger satisfaction and service fulfillment levels. By optimizing the number of booking requests served per unit time and stabilizing both agency and user costs, we can optimize the efficiency and reliability of the DRT system. This, in turn, will improve the reliability of the service offerings, enhancing the passenger experience, and hence the user costs need to be duly considered in this study.
6 Optimization of system demand
While the study so far has been focused on the agency costs, there is an inherent trade-off between the operation costs and the quality of service, as observed through the discussion of the optimal occupancy level. To account for the quality of service, there should be a balance between the agency costs and user costs.
In oversaturated system conditions, it is infeasible to serve all the users at the requested times, so users will experience some delay. This is particularly noted in the evening peak times for DBOD, as discussed earlier. To account for this, the user cost (UC) model is adopted from Amirgholy and Gonzales (2016) as follows:
N Q represents the total demand (including not-completed rides) and , where ω is the slope of the Wished Curve, which indicates how quickly the cumulative number of wished request times increases in a DRT system. A steeper slope means that users' desired request times are concentrated within a shorter time frame, leading to higher demand peaks. Also, the value of ω affects the total earliness and lateness experienced by users. When ω is high, the wished request times are more concentrated, potentially increasing the discrepancy between actual and wished delivery times.
VOT denotes the user's value of time factor, TD(λ) is the delay factor, TS(λ, nw) is the in-service time for the adopted operating strategy, TE is the earliness, TL is the lateness, and e and l represent the relative cost of earliness and lateness times in equivalent units of travel time. Earliness and lateness are defined as the time gap between the actual and wished delivery of users to their destinations.
For Strategy 3, the service delay is given by:
The earliness time factor e and lateness time factor l are scalars that satisfy e ≤ 1 ≤ l (Small, 1982), by which the cost of arriving too early or too late is accounted for. The total cost incurred includes the agency and user costs, which are increasing and decreasing functions, respectively, of the demand level λ (i.e., the number of requests served per unit time). To illustrate this, consider a fixed service area, where the travel characteristics are captured by the speed v and r1 (and r2), the agency cost is a function of the demand and the number of users awaiting service, nw. Equation 19 can be rewritten as follows:
For the system optimization problem, the agency cost model was developed for the disaggregate dataset available for 3 months in Service Area 1 because disaggregate-level data captures detailed variations and patterns that might be lost in averaged aggregate data, providing a more accurate and nuanced understanding of the system's performance.
For the average values of ETA, T and occupancy nv, the agency cost is an increasing function of λ as shown in Figure 6.
On the other hand, the user cost model is a decreasing function of λ as seen from Equations 22, 23. The computation of the user cost in Equation 22 requires the VOT factor. While previous studies (Amirgholy and Gonzales, 2016) used assumed VOT values in hypothetical settings, a realistic estimate is crucial for computing user costs in Dubai's DBOD system. This has been addressed by determining the optimal operating capacity λ*, as seen in the next section:
6.1 Optimal operating capacity
The operating capacity of the system is the maximum rate at which requests can be served, depending on the fleet size and other system characteristics. The efficiency of the system can be enhanced by determining the optimal operating capacity, λ* which minimizes the sum of user and agency costs. This necessitates that the number of requests to be served, nw should be held constant (Amirgholy and Gonzales, 2016). Theoretically, the average requests awaiting service can be approximated by:
where C1 represents the coefficient of λ and C2 represents the combined coefficients of .
It is important to have a realistic estimate of the VOT in order to compute the user costs for the service areas in Dubai. To achieve this, a time approximately 7 am, when Met Demand is ~85%, is used to calibrate VOT under near-optimal conditions. At this time, the demand is 42 pax/h, with six vehicles deployed. The calibrated VOT is tested using the demand level at 8 am, when the demand is 60 pax/h, but the Met Demand rate is only 75%.
6.1.1 Calibrating VOT for aggregated data
A trial-and-error method is employed to calibrate the VOT from the data. For a VOT of 4.5 AED/h, and an earliness factor of 0.31 and a lateness factor of 1.5, the optimal demand λ*is 39.96, and the optimal fleet size M* (obtained by substituting λ* instead of λ in Equation 2) is 5.9. While the lateness factor l has been adopted from literature (Shang et al., 2019), the earliness factor of 0.31 was calibrated along with the VOT. Testing this VOT at 8 am (when demand rises to 61 pax/h) shows that λ* = 63.1 and 8 (~7.91) vehicles would be optimal. However, only six were deployed, resulting in a Met Demand rate of 75%, indicating under-provision and validating 4.5 AED/h as a realistic VOT estimate that can be adopted for further analysis.
6.1.2 Calibrating VOT for disaggregated data
A similar calibration procedure was carried out for the disaggregated dataset (i.e., for a circuity factor of 2.18). Again, a VOT of 4.5 AED/h meets the near-optimal and under-optimal conditions of 7 am and 8 am, respectively, with an earliness factor of 0.265.
6.1.3 Determination of optimal operating capacity
The user cost values have been computed as a function of the demand λ at three levels of fleet size, keeping the total demand fixed, as depicted in Figure 13.
Figure 13
Optimum operating capacity.
As seen from Figure 13, the user cost is a decreasing function of λ, and the agency cost is an increasing function of λ (Figure 7). Thus, for a fixed value of the VOT, the operating capacity λ* (i.e., optimal number of requests served per unit time). The service can be considered as the decision variable of the system. Figure 14 shows the optimal number of requests that need to be served per unit time, to minimize the total costs (user plus agency costs) when NQ is 50 at 7 am and 80 at 8 am, respectively. From Figure 14A, it can be seen that at 7 am (before the peak), the optimal number of requests is approximately 30 pax/h, with a corresponding fleet size of 5. At the peak time of 8 am, the optimal number is closer to 50 pax/h (Figure 14B) and requires at least seven vehicles to fulfill this demand. These numbers translate to occupancy levels of 6 and 8 (~7.15) pax/veh/h, respectively. Comparing these to the average occupancy levels (from Figure 12) of 9 and (around) 10 tells us that, given the demand levels, there is room for improving the costs through vehicle dispatching, routing, and scheduling strategies.
Figure 14
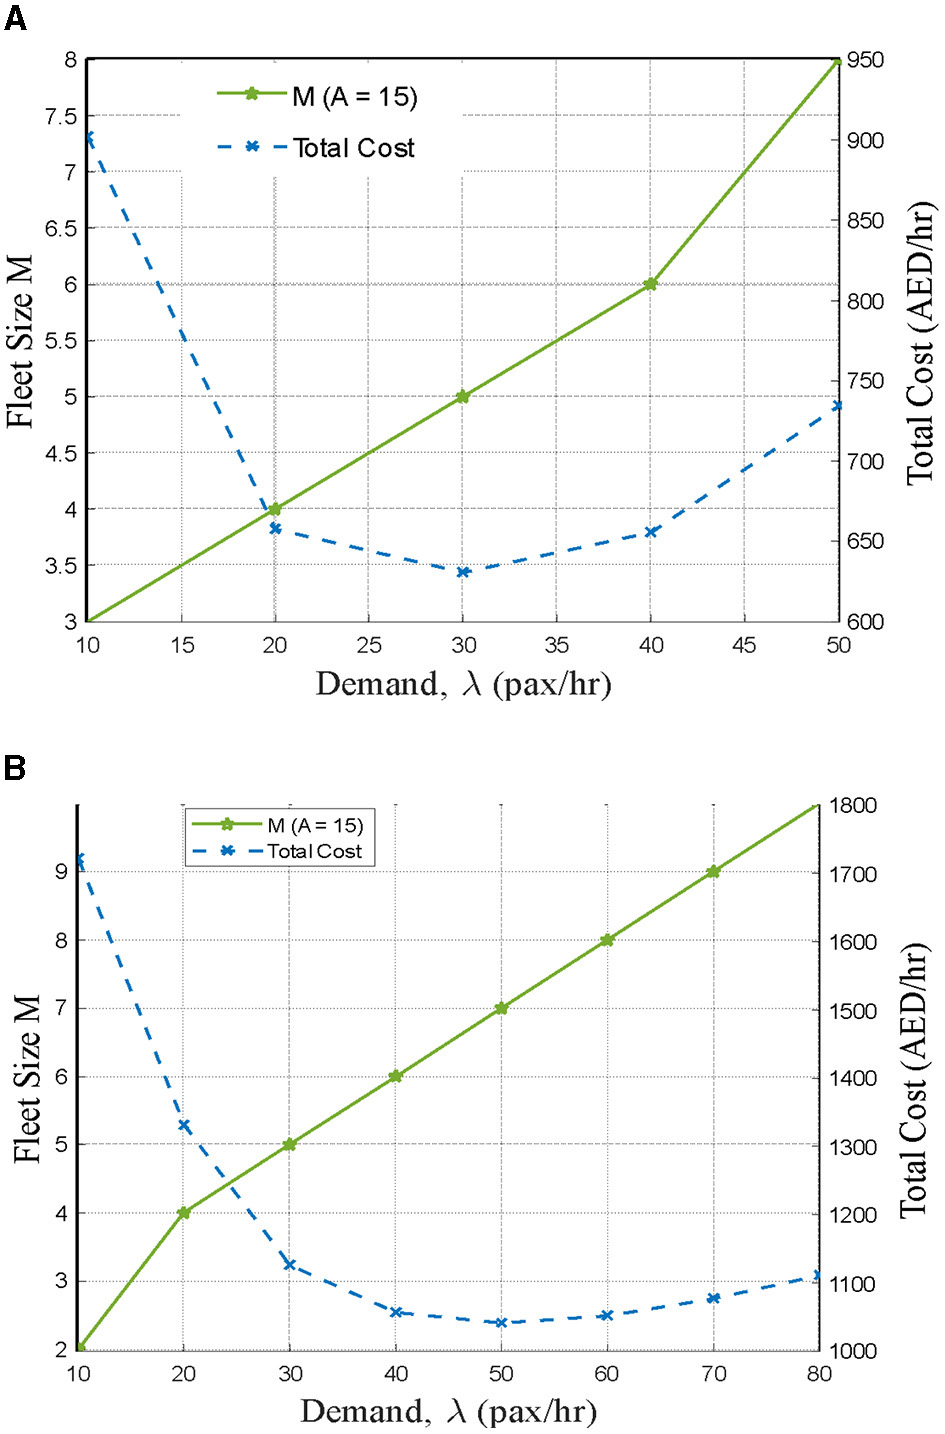
(A) Impact on total costs at 7 am. (B) Impact on total costs at 8 am.
6.2 Optimal fleet size
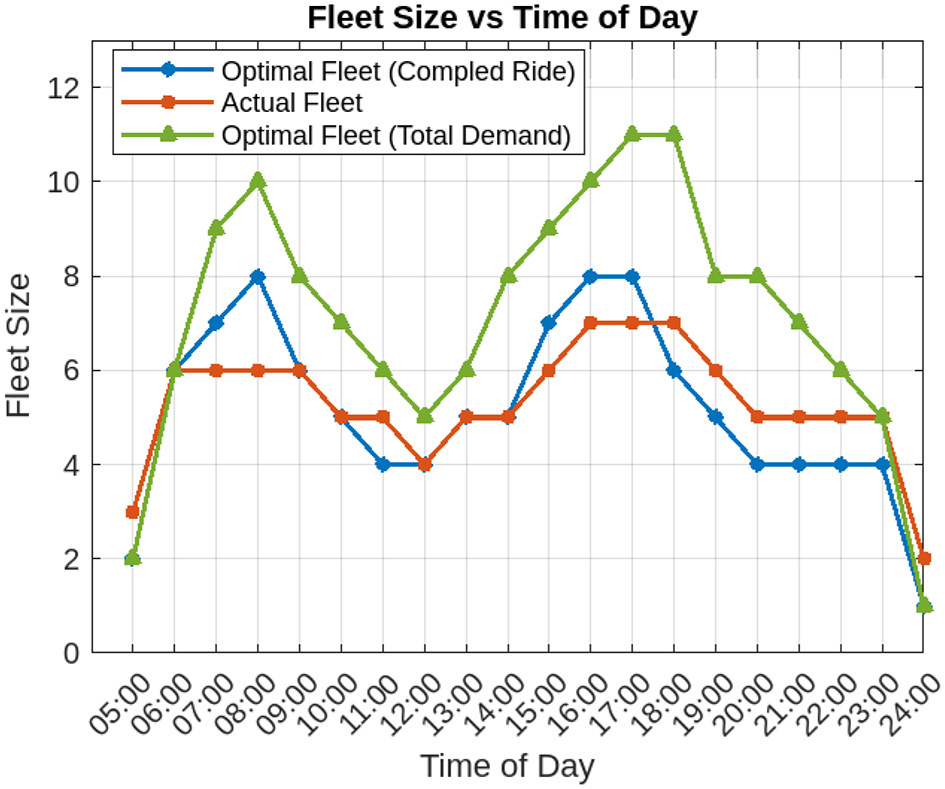
From a practical point of view, the optimal operating capacity λ* can be used to approximate the optimal fleet size using Equation 2. The optimal fleet size (with occupancy levels varying according to the time of day) is compared with the actual fleet size in Figure 15. It can be seen that the actual fleet size generally trails below the optimal fleet for three-quarters of the day, particularly during the peak periods like approximately 08:00 and 17:00–18:00, suggesting potential under-provisioning during high-demand hours. This is also corroborated by the number of unaccepted proposals in Figure 4. During off-peak times, such as 11:00–14:00 and 21:00–23:00, the actual fleet remains within a reasonable range of the optimal fleet. The comparison highlights the value of aligning fleet allocation with time-dependent occupancy-based optimization to improve service efficiency and reduce idle vehicle time.
Figure 15
Comparison of optimal fleet size with actual fleet size.
Figure 15 also depicts the optimal fleet size required to meet the total demand at different times of day. However, since the occupancy levels used in the estimation are based on those observed for the actual fleet, the resulting optimal fleet size may be slightly higher than what could be achieved under optimized occupancy conditions.
6.3 Analysis of the three routing strategies for DBOD
Having calibrated the VOT for DBOD, the total cost model (AC+UC) is adopted to analyze the three different routing strategies described through Equations 5–7. The objective of this exercise is to identify the most effective routing strategy from the perspective of minimizing the total cost. For Service Area 1, the user cost and agency cost models, including the fare, Pi for strategy i, is depicted as follows:
For a demand level of 40 pax/h, the optimal design variables and the optimal cost estimates are presented in Table 4, for the three routing strategies presented in Equations 5–7. The circuity factors assumed for this analysis are taken from Table 3. The major disparity is seen in the values of the cost due to VMT and the in-service costs. This can be attributed to the circuity factors for the three strategies, which are 6.98, 1.7, and 2.2, respectively.
Table 4
| Strategy no | Optimal design variables | Optimal cost (AED) | |||||||
|---|---|---|---|---|---|---|---|---|---|
| Agency cost | User cost | ||||||||
| I | (Pax/hr) | γ3 | Fleet | VMT | Delay | In-service | Earliness | Lateness | |
| 1 | 36.31 | 6 | −9.60 | 44.65 | 371.66 | 22.33 | 48.04 | 1.75 | 0.31 |
| 2 | 37.77 | 5 | −9.60 | 42.93 | 341.46 | 21.47 | 18.50 | 1.02 | 0.18 |
| 3 | 37.48 | 6 | −9.60 | 43.26 | 347.14 | 21.63 | 34.89 | 1.16 | 0.20 |
System optimization for DBOD.
Amirgholy and Gonzales (2016) have formulated the minimum cost as follows:
where Ci, 3 denotes the terms in the objective function that are independent of λ.
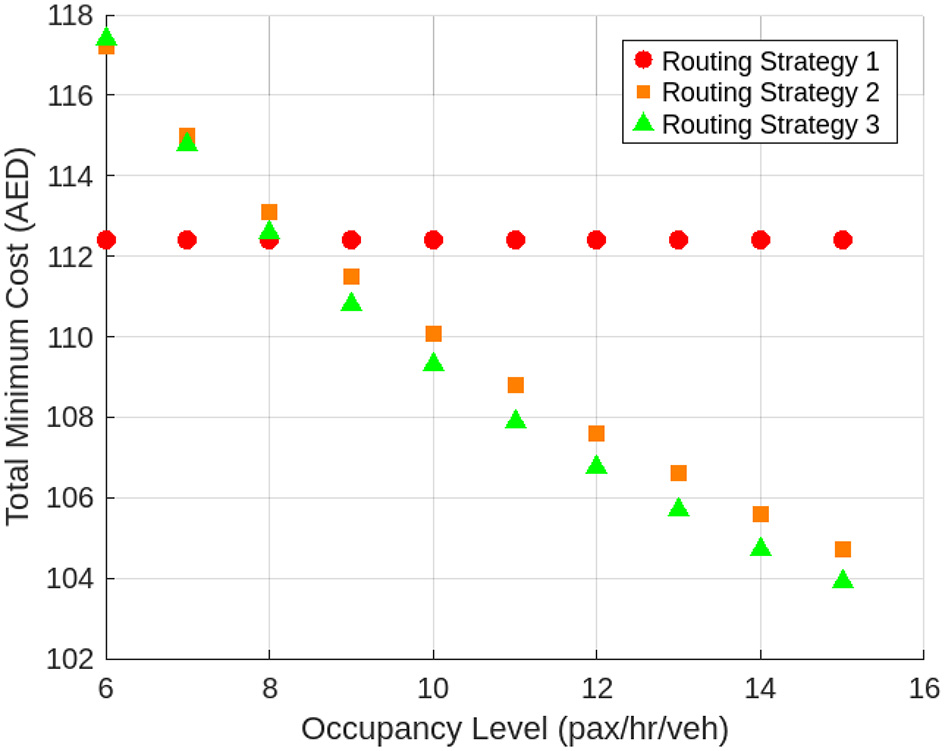
The relationship between occupancy level and total minimum cost for three different routing strategies is illustrated in Figure 16. As occupancy increases, both routing strategy 2 and routing strategy 3 show a noticeable decline in total minimum cost, with Strategy 3 offering the most substantial cost savings. In contrast, routing strategy 1 maintains a constant cost across all occupancy levels, as it is independent of this parameter. At lower occupancy levels, the costs of all three strategies are comparable. However, as occupancy rises, the advantages of dynamic routing become more apparent. Strategy 3 consistently achieves the lowest cost at higher occupancy levels, highlighting its superior efficiency and scalability. These results emphasize the value of adopting adaptive routing strategies, particularly in high-utilization scenarios, to optimize operational costs.
Figure 16
Comparison of routing strategies.
7 Contributions of the study
This study presents a comprehensive, multi-faceted optimization framework that collectively establishes a systematic approach for assessing and achieving commercial sustainability in Dubai Bus-On-Demand (DBOD) transit services. These evaluations are interlinked and collectively contribute to a structured methodology for assessing the commercial rigor of the DBOD, as depicted in Figure 17. The emphasis on balancing agency and user costs represents a holistic approach to commercial sustainability. This optimization exercise recognizes that sustainable operations require managing the trade-offs between operational efficiency and service quality, as demand growth can reduce user costs while potentially increasing agency costs.
Figure 17
Dubai Bus on Demand (DBOD) optimization synthesis framework.
In summary, the article presents a data-driven approach with practical applications for transit agencies to optimize operational performance of DRT services, translating theory into practice. However, we acknowledge the constraints of this study's reliance on real-world data from only two service areas over a 3-month period. This limitation may affect the applicability of the results at a microscale, as the findings are case specific to the unique attributes of the selected service areas in Dubai. However, at the pilot and planning stages of DRT implementation, these models offer actionable insights as detailed below.
-
(i) Assessment of operational and financial viability of DBOD: This study conducts a comprehensive assessment of the operational and financial viability of the DBOD service. This analysis holds significant relevance as many previous DRT initiatives have struggled to achieve commercial sustainability (Currie and Fournier, 2020) across world cities. This facilitates the transit agencies for a systematic assessment and enhancement of DRT performance through a data-driven approach to evaluation, thus supporting informed, data-driven decision-making contributing to sustainable urban mobility planning.
-
(ii) Application and calibration of Daganzo's Continuum Approximation Framework with empirical data: The study applies and optimizes Daganzo's Continuum estimation framework using empirical data from two different service areas in Dubai. This methodology presents evidence-based insights and practical guidance for optimizing transit operations, particularly in the context of FLM accessibility to high-capacity transit systems like metro services. The simplicity and cost-effectiveness of the method make it accessible to a wide range of practitioners and policymakers globally. In addition, by offering a simpler alternative to traditional but complicated simulation models, the study addresses a key challenge faced by transit agencies aiming to improve service design and operational efficiency in a dynamic format.
-
(iii) Identification of the most effective routing strategy: A significant contribution of this study is the identification of the Alternating Priority Routing strategy as the most efficient for the DBOD system. This alternating strategy, which is designed systematically between the nearest pickup and drop-off locations, effectively balances distance reduction with service consistency, resulting in reduced travel and waiting times for users. The findings are substantiated through an empirical analysis study that the circuity factor associated with the Alternating Priority strategy closely aligns with the travel adjustment factors in both VMT and fleet size (M) models. In addition, it yields the lowest RMSE when compared to alternative routing strategies, indicating the best fit to observed operational data. The strategy also regularly achieves the lowest total minimum cost at higher occupancy levels, highlighting its superior efficiency and scalability for operational use.
-
(iv)
Determination of Optimal Operational Parameters for cost-efficiency: The research also presents systematic solutions on how to achieve cost-effective operations by optimizing resources for the DBOD services:
a) Compact service areas and moderate demand: The study suggests that the most cost-effective operations are achieved in compact service areas with balanced demand. This efficiency is driven by lower trip counts and higher vehicle utilization rates, resulting in significant reductions in overall operational expenses. The research suggests that transit agencies should maintain efficiency and thoughtfully extend service areas, where demand growth offsets the added operational expenses.
b) Optimal vehicle occupancy levels: The study finds that agency costs are minimized with 10–15 passengers per vehicle per hour of service operation for a vehicle with 10–12 seating capacity. It observes that Dubai's DBOD system, with an average occupancy of 6.9 passengers per vehicle per hour (vehicle utilization factor) in Service Area 1, operates closer to a ride-sharing service rather than a high-efficiency public transit system, highlighting potential optimization to realize greater economies of scale. Refined operational strategies, including vehicle dispatching, routing, scheduling, and terminal location optimization can help reach target occupancy with lesser VMT.
-
(v) Emphasis on balancing agency and user costs: This research highlights the need to balance agency costs and user costs in urban shared mobility planning and operational decisions. It emphasizes that as demand grows, the user costs (delays, in-service travel time, earliness, and lateness penalties) typically decline, stressing the importance of optimizing requests served per unit time to reduce overall system costs.
-
(vi) Recommendation for continuous monitoring and adjustment: The study recommends continuous monitoring and dynamic adjustments of service parameters to optimize performance and increase operational efficiency during the operational hours with varying demand patterns. This involves a thorough evaluation of dynamic policy modifications that affect rider density or service area to align with cost-effectiveness standards.
The integration of these optimization exercises offers transit agencies a systematic, evidence-based approach to assess, implement, and maintain commercially sustainable DBOD services. Considering previous DRT initiatives that have failed too often, this framework addresses the multidimensional nature of commercial sustainability, providing a reproducible methodology for achieving viable demand-responsive transit operations in urban contexts. This systematic approach directly responds to the global challenge of DRT commercial failures by providing transit agencies with an integrated toolkit that transforms theoretical optimization into practical, sustainable operations.
In this age of digitization, providing actionable insights based on real-world data also requires the accurate prediction of future passenger requests that will help operate and pre-allocate resources (vehicles and drivers) to meet the demand. The integration of advanced data analytics can significantly improve the efficiency of DRT systems, ultimately benefiting both operators and users by reducing waiting times and costs (Liyanage et al., 2022). Moreover, leveraging machine learning algorithms can further refine demand predictions, allowing for more responsive adjustments to service offerings and enhancing overall user satisfaction. Moreover, leveraging machine learning algorithms can further refine demand predictions, allowing for more responsive adjustments to service offerings and enhancing overall user satisfaction. As Artificial Intelligence (AI) continues to evolve, it may facilitate the development of more intelligent routing systems, enabling real-time adjustments based on passenger demand and traffic conditions. This evolution could lead to a more seamless integration of demand-responsive transit with existing urban transportation networks, ultimately enhancing the overall rider experience.
8 Conclusion and recommendations
The research article presents a comprehensive assessment of the commercial sustainability of DRT systems, particularly focusing on DBOD service. The study adopts an analytical modeling approach based on Daganzo's continuum approximation framework, calibrated with empirical data from two service areas in Dubai. The research offers valuable insights into improving the efficiency and sustainability of DRT services in Dubai by integrating user cost models to balance delays, travel time, and penalties, ensuring sustainable DRT operations. The findings identified that compact service areas with moderate demand levels generate the most cost-efficient operations. This efficiency is the result of reduced trip lengths and higher vehicle occupancy rates, which lower overall operational costs. From the comparative analysis of three routing strategies, the Alternating Priority strategy was found to be the most effective for Dubai's DBOD system. This strategy balances distance optimization with service consistency, leading to lower ride and waiting times. In addition to this, the research underscores the importance of achieving optimal vehicle occupancy levels to realize economies of scale. For the DBOD system, the target occupancy level should be between 10 and 15 passengers per vehicle to minimize agency costs.
An in-depth cost evaluation indicates that agency costs increase substantially with larger service areas and higher demand densities. Thus, strategic planning around service area size and demand density is significant for maintaining cost-efficiency. The research further integrates user cost models to account for delays, travel time, and penalties. It shows that user costs decrease with higher demand levels and highlights the necessity for balancing agency and user costs to optimize overall system performance.
Taking these findings into account, several recommendations are proposed to enhance the financial sustainability and operational efficiency of DRT systems like Dubai's DBOD. Transit agencies should focus on maintaining compact service areas with moderate demand levels to achieve cost-efficient operations. Expanding service areas should be done cautiously, ensuring that demand growth justifies the increased operational costs. Efforts should be made to increase vehicle utilization levels to the target range of 10–15 passengers per vehicle. This can be achieved through refined vehicle dispatching, routing, and scheduling strategies. The Alternating Priority strategy should be adopted for routing, as it strikes a balance between reducing travel distances and ensuring consistent service delivery.
Transit systems should consider both agency and user costs in their planning and operational decisions. This involves optimizing the number of requests served per unit time to minimize total system costs. Regular monitoring of operational data and continuous adjustment of service parameters are important for enhanced operational output. This includes recalibrating cost models and adjusting service strategies based on real-time data. Any policy changes that affect rider density or service area should be carefully evaluated to ensure they lead to cost-effective operations. Policies should seek to align increased rider density with the cost efficiency thresholds defined by average cost contours.
Statements
Data availability statement
The dataset was generated and belongs to the Roads and Transport Authority, Dubai. The authors do not have permission to share the data. Requests to access the datasets should be directed to https://www.rta.ae.
Author contributions
UD: Conceptualization, Methodology, Writing – original draft, Writing – review & editing. DD: Conceptualization, Methodology, Supervision, Visualization, Writing – original draft, Writing – review & editing.
Funding
The author(s) declare that no financial support was received for the research and/or publication of this article.
Acknowledgments
The authors would like to express our sincere gratitude to the Roads and Transport Authority (RTA) Dubai for permitting the use of the necessary dataset from the Dubai Bus-on-Demand operations in two service areas over 3 consecutive months. Their support was instrumental in achieving the data analytics and results presented in this study. We also appreciate the continuous collaboration and valuable feedback provided by RTA Dubai throughout the research process.
Conflict of interest
The authors declare that the research was conducted in the absence of any commercial or financial relationships that could be construed as a potential conflict of interest.
Generative AI statement
The author(s) declare that Gen AI was used in the creation of this manuscript. To enhance the readability and clarity. After using these tools, the author(s) have reviewed and edited the content.
Any alternative text (alt text) provided alongside figures in this article has been generated by Frontiers with the support of artificial intelligence and reasonable efforts have been made to ensure accuracy, including review by the authors wherever possible. If you identify any issues, please contact us.
Publisher’s note
All claims expressed in this article are solely those of the authors and do not necessarily represent those of their affiliated organizations, or those of the publisher, the editors and the reviewers. Any product that may be evaluated in this article, or claim that may be made by its manufacturer, is not guaranteed or endorsed by the publisher.
References
1
Alonso-González M. J. Liu T. Cats O. Van Oort N. Hoogendoorn S. (2018). The potential of demand-responsive transport as a complement to public transport: an assessment framework and an empirical evaluation. Transp. Res. Rec.2672, 879–889. doi: 10.1177/0361198118790842
2
Amirgholy M. Gonzales E. J. (2016). Demand responsive transit systems with time-dependent demand: user equilibrium, system optimum, and management strategy. Transport. Res. Part B Methodol.92, 234–252. doi: 10.1016/j.trb.2015.11.006
3
Azadeh S. S. Van der Zee J. Wagenvoort M. (2022). Choice-driven service network design for an integrated fixed line and demand responsive mobility system. Transp. Res. A Policy Pract.166, 557–574. doi: 10.1016/j.tra.2022.10.016
4
Baier M. J. Sörensen L. Schlüter J. C. (2024). How successful is my DRT system? A review of different parameters to consider when developing flexible public transport systems. Transport Policy159, 130–142. doi: 10.1016/j.tranpol.2024.09.006
5
Bastarianto F. F. Hancock T. O. Choudhury C. F. Manley E. (2023). Agent-based models in urban transportation: review, challenges, and opportunities. Eur. Transport Res. Rev.15:19. doi: 10.1186/s12544-023-00590-5
6
Campisi T. Cocuzza E. Ignaccolo M. Inturri G. Tesoriere G. Canale A. et al . (2023). Detailing DRT users in Europe over the last twenty years: a literature overview. Transport. Res. Procedia69, 727–734. doi: 10.1016/j.trpro.2023.02.229
7
Chandakas E. (2020). On demand forecasting of demand-responsive paratransit services with prior reservations. Transport. Res. Part C Emerg. Technol.120:102817. doi: 10.1016/j.trc.2020.102817
8
Chen Y. Wang H. (2025). Why are fairness concerns so important? Lessons from a last-mile transportation system. Transport. Res. Part A Policy Pract.192:104361. doi: 10.1016/j.tra.2024.104361
9
Connors R. Nakao H. Ma T-. Y. Viti F. (2025). “Continuous approximation model for a demand responsive feeder service with meeting points,” in Proceedings of the 12th Triennial Symposium on Transportation Analysis conference (TRISTAN XII): Okinawa, Japan. Available online at: https://tristan2025.org/proceedings/TRISTAN2025_ExtendedAbstract_96.pdf (Accessed June 22–27, 2025).
10
Coutinho F. M. van Oort N. Christoforou Z. Alonso-González M. J. Cats O. Hoogendoorn S. et al . (2020). Impacts of replacing a fixed public transport line by a demand responsive transport system: Case study of a rural area in Amsterdam. Res. Transport. Econ.83:100910. doi: 10.1016/j.retrec.2020.100910
11
Currie G. Fournier N. (2020). Why most DRT/Micro-Transits fail – What the survivors tell us about progress. Res. Transport. Econ.83:100895. doi: 10.1016/j.retrec.2020.100895
12
Daganzo C. F. (1978). An approximate analytic model of many-to-many demand responsive transportation systems. Transport. Res.12, 325–333. doi: 10.1016/0041-1647(78)90007-2
13
Dang L. von Arx W. Frölicher J. (2021). The impact of on-demand collective transport services on sustainability: a comparison of various service options in a rural and an urban area of Switzerland. Sustainability13:3091. doi: 10.3390/su13063091
14
Deka U. Varshini V. Dilip D. M. (2023). The journey of demand responsive transportation: towards sustainable services. Front. Built Environ.8:942651. doi: 10.3389/fbuil.2022.942651
15
Dytckov S. Persson J. A. Lorig F. Davidsson P. (2022). Potential benefits of demand responsive transport in rural areas: a simulation study in Lolland, Denmark. Sustainability14:3252. doi: 10.3390/su14063252
16
Džupka P. Gróf M. Dráb R. Štofa T. (2025). Beyond the bus: unraveling DRT's potential—An ex ante WTP evaluation for replacing ineffective fixed route regional lines. Res. Transport. Bus. Manage.60:101361. doi: 10.1016/j.rtbm.2025.101361
17
Enoch M. Potter S. Parkhurst G. Smith M. (2006). “Why do demand responsive transport systems fail?,” in Proceedings of the Transportation Research Board 85th Annual Meeting. Washington, DC: Transportation Research Board (TRB).
18
Hörcher D. Tirachini A. (2021). A review of public transport economics. Econ. Transport.25:100196. doi: 10.1016/j.ecotra.2021.100196
19
Huang D. Tong W. Wang L. Yang X. (2020). An analytical model for the many-to-one demand responsive transit systems. Sustainability12:298. doi: 10.3390/su12010298
20
Jang M. Lee S. Kim J. Kim J. (2025). Dynamic minimum service level of demand–responsive transit: a prospect theory approach. Sustainability17:3171. doi: 10.3390/su17073171
21
Kim H. Choi J. Cho S. Liu F. Jin H. Lim S. et al . (2022). Identifying different sources of the benefit: simulation of DRT operation in the heartland and hinterland regions. Sustainability14:16519. doi: 10.3390/su142416519
22
Li X. Quadrifoglio L. (2009). Optimal zone design for feeder transit services. Transport. Res. Record2111, 100–8. doi: 10.3141/2111-13
23
Liyanage S. Abduljabbar R. Dia H. Tsai P. W. (2022). AI-based neural network models for bus passenger demand forecasting using smart card data. J. Urban Manage.11, 365–380. doi: 10.1016/j.jum.2022.05.002
24
Lu C. Maciejewski M. Wu H. Nagel K. (2023). Demand-responsive transport for students in rural areas: a case study in Vulkaneifel, Germany. Transport. Res. Part A Policy Pract.178:103837. doi: 10.1016/j.tra.2023.103837
25
Lu W. Xie Y. Wang W. Quadrifoglio L. (2011). “An analytical model to select the fleet size for MAST systems,” in IEEE Forum on Integrated and Sustainable Transportation Systems, Vienna, Austria, 152–158.
26
Markov I. Guglielmetti R. Laumanns M. Fernández-Antolín A. de Souza R. (2021). Simulation-based design and analysis of on-demand mobility services. Transport. Res. Part A Policy Pract.149, 170–205. doi: 10.1016/j.tra.2021.01.004
27
Marković N. Kim M. E. Schonfeld P. (2016). Statistical and machine learning approach for planning dial-a-ride systems. Transport. Res. Part A Policy Pract.89, 41–55. doi: 10.1016/j.tra.2016.05.006
28
Mehran B. Yang Y. Mishra S. (2020). Analytical models for comparing operational costs of regular bus and semi-flexible transit services. Public Transport12, 147–169. doi: 10.1007/s12469-019-00222-z
29
Militão A. M. Tirachini A. (2021). Optimal fleet size for a shared demand-responsive transport system with human-driven vs automated vehicles: a total cost minimization approach. Transport. Res. Part A Policy Pract.151, 52–80. doi: 10.1016/j.tra.2021.07.004
30
Mouratidis K. Peters S. van Wee B. (2021). Transportation technologies, sharing economy, and tele activities: implications for built environment and travel. Transport. Res. Part D Transport Environ.92:102716. doi: 10.1016/j.trd.2021.102716
31
Mulley C. Nelson J. D. (2009). Flexible transport services: A new market opportunity for public transport. Res. Transport. Econ.25, 39–45. doi: 10.1016/j.retrec.2009.08.008
32
Papanikolaou A. Basbas S. (2021). Analytical models for comparing demand responsive transport with bus services in low demand interurban areas. Transport. Lett.13, 255–262. doi: 10.1080/19427867.2020.1716474
33
Pavanini T. Liimatainen H. Sievers N. Heemsoth J. P. (2023). The role of DRT in European urban public transport systems—A comparison between Tampere, Braunschweig and Genoa. Future Transport.3, 584–600. doi: 10.3390/futuretransp3020034
34
Rahimi M. Amirgholy M. Gonzales E. J. (2018). System modeling of demand responsive transportation services: evaluating cost efficiency of service and coordinated taxi usage. Transport. Res. Part E Logist. Transport. Rev.112, 66–83. doi: 10.1016/j.tre.2018.02.005
35
Rich J. Seshadri R. Jomeh A. J. Clausen S. R. (2023). Fixed routing or demand-responsive? Agent-based modelling of autonomous first and last mile services in light-rail systems. Transport. Res. Part A Policy Pract.173:103676. doi: 10.1016/j.tra.2023.103676
36
Schlüter J. Bossert A. Rössy P. Kersting M. (2021). Impact assessment of autonomous demand responsive transport as a link between urban and rural areas. Res. Transport. Bus. Manage.39:100613. doi: 10.1016/j.rtbm.2020.100613
37
Shang H. Huang H. J. Wu W. (2019). Vehicle scheduling optimization considering the passenger waiting cost. J. Adv. Transp.2019:4212631. doi: 10.1155/2019/4212631
38
Small K. A. (1982). The scheduling of consumer activities: work trips. Am. Econ. Rev.72, 467–479.
39
Spielberg F. Pratt R. H. (2004). Demand Responsive/ADA Traveller Response to Transportation System Changes, Chap. 6, Report 95.Washington, DC: TCRP, Federal Transit Administration.
40
Sultana Z. Mishra S. Cherry C. R. Golias M. M. Jeffers S. T. (2018). Modeling frequency of rural demand response transit trips. Transport. Res. Part A Policy Pract.118, 494–505. doi: 10.1016/j.tra.2018.10.006
41
United Nations Department of Economic and Social Affairs. (2019). World Urbanization Prospects: The 2018 Revision. New York, NY: United Nations.
42
Vickrey W. S. (1969). Congestion theory and transport investment. Am. Econ. Rev.59, 251–260.
43
Wang J. Liu K. Yamamoto T. Wang D. Lu G. (2023). Built environment as a precondition for demand-responsive transit (DRT) system survival: evidence from an empirical study. Travel Behav. Soc.30, 271–280. doi: 10.1016/j.tbs.2022.10.008
44
Westerlund Y. (2016). “Key performance indicators for DRT: Scandinavian experience,” in Presentation at the International Conference on Demand Responsive Transport, Breckenridge, CO, USA.
45
Zhao C. Xue M. Hamidi Z. (2024). Potential of demand responsive transport for young people in Sweden. Transport. Res. Part A Policy Pract.184:104093. doi: 10.1016/j.tra.2024.104093
46
Zheng Y. Deng A. Yin Z. Li W. (2024). Assessing travelers' preferences for online bus-hailing service across various travel distances: insights from Chinese metropolitan areas. Transport. Res. Part A Policy Pract.187:104159. doi: 10.1016/j.tra.2024.104159
Appendix
Table A1
| Symbol | Definition | Category |
|---|---|---|
| A | Service area (km2) | Geographic function |
| AC | Average cost per passenger (AED/trip) using disaggregated data points | Cost function |
| AC agg | Average cost per passenger (AED/trip) using hourly aggregated data points | Cost function |
| τ | i.e., (b1+b2) Average boarding time/alighting time (hours) | Time function |
| M | Fleet Size | Fleet function |
| C | Vehicle capacity | Fleet function |
| MC | Marginal cost (AED/trip) | Cost function |
| n | No. of equally distributed virtual stops | Operations function |
| ni | Avg. number of passengers on board vehicle i | Operations function |
| n v | Target occupancy, i.e., capacity utilization of the vehicle | Operations function |
| n w | Total demand per window time (T) | Demand function |
| N | Number of passenger requests waiting | Demand function |
| r, r1, r2 | Travel adjustment factors (network, fleet size model, VMT model) | Operations function |
| ki | DRT operations strategy | Operations function |
| T | Time window (hours), Maximum ETA (Estimated Time of Arrival) | Time function |
| TC | Total annual agency cost | Cost function |
| v | Average moving speed (km/hour) | Operations function |
| VMT | Vehicle miles traveled | Distance function |
| VHT | Vehicle hours traveled | Time function |
| x1, x2 | Independent variables for fleet size and VMT model calibration | Calibration factor |
| y1, y2 | Dependent variable of fleet size and VMT model calibration | Calibration factor |
| Z | Total agency fixed cost | Cost function |
| a and β | Fixed parameter of the cost function independent of demand, service area and occupancy level | Calibration factor |
| δ | Demand density (hourly pax/km2) | Demand function |
| Y1 | Incremental cost per additional vehicle | Cost function |
| Y2 | Incremental cost per additional vehicle-hour | Cost function |
| Y3 | Incremental cost per additional vehicle-mile | Cost function |
| λtaxi | Average cost of a taxi trip | Cost function |
| λ | Daily demand (no. of trips/day) | Demand function |
| λmin | Minimum number of trips for efficient DRT system | Demand function |
| λmax | Maximum number of trips DRT system can serve efficiently | Demand function |
| UC | Total User Cost | Cost function |
| VOT | Value of time for the users | Cost function |
| T D | Service delay time to user | Time function |
| T S | In-service time to user | Time function |
| T E | Earliness time to user | Time function |
| T L | Lateness time to user | Time function |
| e | Relative cost of earliness times (in equivalent unit of travel time) | Cost function |
| l | Relative cost of lateness times (in equivalent unit of travel time) | Cost function |
| ω | Peak demand rate | Calibration factor |
| N Q | Total demand within a time period | Demand function |
| t p | Time window | Time function |
| P i | Fare level for strategy i | Cost function |
Glossary of symbols.
Summary
Keywords
demand-responsive transport (DRT), Bus-on-Demand, alternating priorities routing strategy, value of time (VOT), commercial sustainability
Citation
Deka U and Dilip DM (2025) Rethinking shared mobility: analyzing the commercial sustainability of demand-responsive transport in Dubai. Front. Sustain. Cities 7:1688672. doi: 10.3389/frsc.2025.1688672
Received
19 August 2025
Accepted
13 October 2025
Published
17 November 2025
Volume
7 - 2025
Edited by
Haoyu Hu, The Chinese University of Hong Kong, China
Reviewed by
Antonio Russo, Kore University of Enna, Italy
Jun Chu, The Chinese University of Hong Kong, China
Updates
Copyright
© 2025 Deka and Dilip.
This is an open-access article distributed under the terms of the Creative Commons Attribution License (CC BY). The use, distribution or reproduction in other forums is permitted, provided the original author(s) and the copyright owner(s) are credited and that the original publication in this journal is cited, in accordance with accepted academic practice. No use, distribution or reproduction is permitted which does not comply with these terms.
*Correspondence: Deepthi Mary Dilip, deepthimary@dubai.bits-pilani.ac.in
Disclaimer
All claims expressed in this article are solely those of the authors and do not necessarily represent those of their affiliated organizations, or those of the publisher, the editors and the reviewers. Any product that may be evaluated in this article or claim that may be made by its manufacturer is not guaranteed or endorsed by the publisher.