 Emad Alzubi
 Balqis Almomani
 Abdallah Albashir
- 1Transportsysteme und -logistik, Fakultätsingenieurswissenschaften, Universität Duisburg–Essen, Duisburg, Germany
- 2ProgressSoft, Amman, Jordan
- 3School of Applied Technical Sciences, German Jordanian University, Amman, Jordan
Introduction: The decarbonization of urban transportation is a central pillar of sustainable city development. While hydrogen offers a promising pathway, its integration into urban and regional infrastructure faces significant spatial and safety challenges.
Methods: To address this, we developed a novel geospatial optimization model that designs hydrogen supply chain networks (HSCNs) for clean transportation. The model's key novelty is its grid-based optimization framework, which integrates real pipeline and station data to simultaneously optimize hub locations for both proximity to refueling stations and access to the main pipeline network. Applied to Germany's Hydrogen Core Network (HCN), the model was formulated with distance-minimizing objective functions and solved using a clustering algorithm.
Results and discussion: When applied to Germany's operational stations, the model achieved a 23.4% reduction (2,719.6 km) in total distribution distance within optimized grids, while also capping the longest single delivery route. Furthermore, it introduces a station density threshold to determine the need for decentralized sub-storage facilities. This work provides a scalable decision-support framework for planners and policymakers, facilitating the strategic deployment of hydrogen infrastructure and accelerating its adoption for sustainable urban mobility.
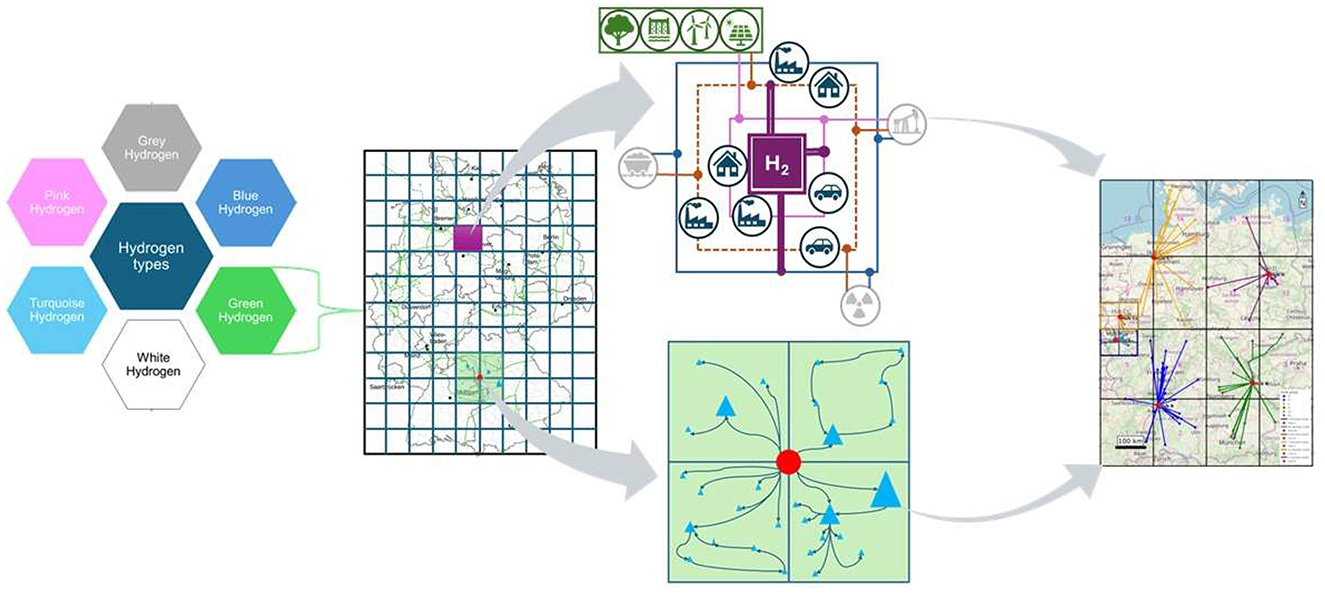
Graphical Abstract
1 Introduction
Energy transformation is vital to global sustainability, prompting countries to implement supportive policies. Germany represents this trend through its National Hydrogen Strategy (NHS), launched in 2020 to establish leadership in hydrogen (H2) technologies. The NHS aims to double electrolysis capacity from 5 to at least 10 GW by 2030 (Federal Ministry for Economic Affairs and Climate Action, 2023). A keystone of this strategy is the Hydrogen Core Network (HCN), a planned 9,040 km pipeline infrastructure (FNB, 2024) for decarbonizing industrial processes. However, achieving decarbonization targets requires more than production and transmission; it critically depends on building a last-mile distribution network. This network must safely and efficiently connect hydrogen supply to end-users, particularly in the transportation sector (Sapnken et al., 2024).
Hydrogen can be produced from various renewable and non-renewable sources, including natural gas reforming, water electrolysis, biomass gasification, and thermochemical water-splitting cycles (Ochoa Bique and Zondervan, 2018). Figure 1 illustrates these different hydrogen types based on their energy source. While green hydrogen holds significant promise for decarbonizing industrial processes (Zaiter et al., 2024), power generation (Risco-Bravo et al., 2024), and building heat (Badakhsh and Mothilal Bhagavathy, 2024), its adoption in transportation faces distinct hurdles (Sapnken et al., 2024). Key challenges include the high cost of renewable energy-based production, energy efficiency concerns, and, most critically for public acceptance, safety risks associated with storage and transport (Balat, 2008). Hydrogen's low ignition energy, high diffusivity, and potential for material embrittlement pose significant hazards. These properties necessitate infrastructure that meets the highest safety standards, as transportation distance is a major risk factor (Markert et al., 2005).
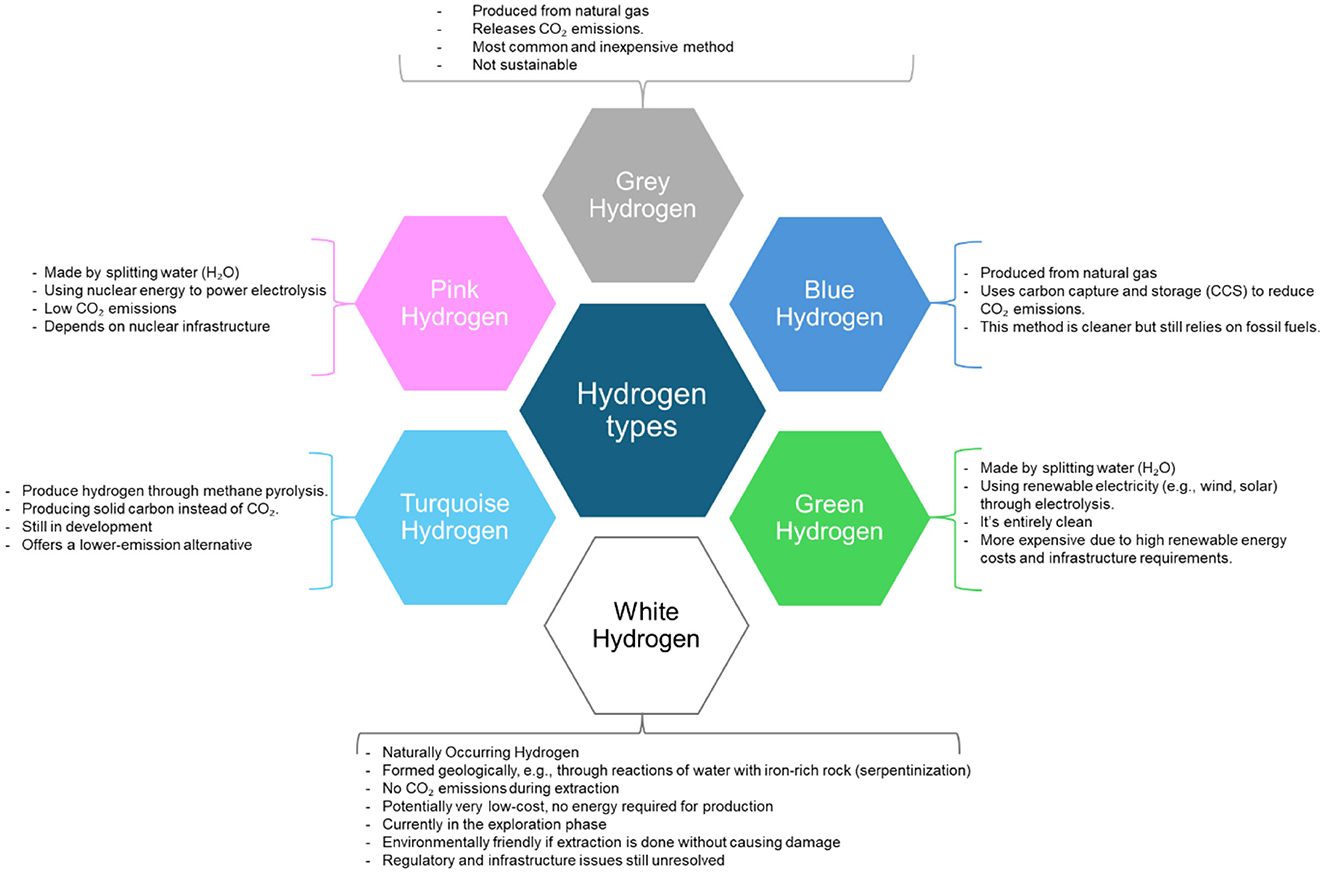
Figure 1. Types of hydrogen their differences based on the energy sources used for hydrogen production.
A typical green Hydrogen Supply Chain Network (HSCN) consists of several interconnected nodes: production, storage, distribution, and transportation (IRENA, 2020). Efficient design of these networks is essential for successfully implementing green hydrogen applications. Still, the decision-making process is often influenced by geopolitical factors (Pflugmann and De-Blasio, 2020), which necessitates robust infrastructure to balance economic and environmental sustainability (Chinello et al., 2025).
Existing research has developed valuable foundational models for HSCN design. These often focus on cost minimization (Almansoori and Shah, 2006) or incorporating uncertainties in demand and renewable energy availability (Fazli-Khalaf et al., 2020). Other studies have compared centralized (Feng et al., 2024) and decentralized (Stockl et al., 2020) configurations, or explored international transport corridors (Fúnez Guerra et al., 2020). Despite these advancements, a critical gap remains in the spatial integration of infrastructure within a real-world geographical context. Many existing models are high-level and lack the spatial resolution to provide actionable planning insights for urban and regional authorities. Consequently, there is a pressing need for a practical framework that explicitly optimizes physical infrastructure locations to minimize transportation distances, thereby addressing economic, safety, and deployment efficiency challenges simultaneously.
This study proposes a novel geospatial optimization model for HSCN design to bridge this gap. Tailored to the transportation sector, the model is grounded in real-world data, including the precise locations of Germany's planned HCN pipelines and its existing refueling stations. The primary objective is to design a network that minimizes the distances from central hubs to refueling stations, as well as the distances from these hubs to the primary pipeline network. This dual-minimization approach directly targets the reduction of both costs and safety risks associated with hydrogen transportation.
The remainder of this paper is structured as follows. Section 2 provides a concise overview of the relevant literature. Section 3 details the methodology, including the grid construction model and the optimization model developed to identify optimal locations for storage and production facilities. Section 4 presents, analyzes, and discusses the optimization results, including avenues for future research. Finally, Section 5 concludes with the study's overarching contributions and implications.
2 Literature review
Research on HSCN design has evolved significantly, addressing various dimensions of this complex problem. Existing literature can be broadly categorized into several key thematic areas, which collectively highlight both the progress made and the persistent gaps this study aims to address.
2.1 Pioneered HSCN optimization models
Early research established the mathematical groundwork for HSCN optimization, predominantly focusing on economic objectives. Almansoori and Shah (2006) pioneered this effort with a mixed-integer linear programming (MILP) model to determine optimal infrastructure costs for Great Britain during the steady-state phase. They later extended this work to a multi-period model that minimized operational costs while accounting for energy resources and long-term uncertainties (Almansoori and Shah, 2009). Similarly, Kim et al. (2015) employed a hybrid genetic algorithm to design an HSCN with multiple transportation modes (pipelines and tank trucks), focusing on minimizing total costs. While these foundational models provide essential economic frameworks, their primary focus on cost often excludes other critical factors such as safety and spatial constraints.
2.2 Integrating sustainability dimensions and uncertainty
Subsequent research moved beyond pure cost analysis to incorporate environmental and operational risks. For instance, Dayhim et al. (2014) integrated emissions, energy consumption, and associated risks into their optimization model. A parallel line of inquiry has focused on managing system uncertainties. Ochoa Bique et al. (2023) developed a stochastic model to address demand uncertainty in Germany's transportation sector, while Fazli-Khalaf et al. (2020) analyzed a broader set of uncertainties, including investment costs, operating costs, and facility capacities. More recently, Xu et al. (2025) examined the uncertainty of renewable energy availability for green hydrogen production in China.
On the other hand, international HSCNs have also been explored for their potential to enhance sustainability. For example, Lee et al. (2022) studied intercontinental hydrogen production, transportation, and storage, finding that methylcyclohexane-based supply chains are the most sustainable option for long-distance transport. Similarly, Fúnez Guerra et al. (2020) conducted a techno-economic analysis of transporting green hydrogen from Chile to Japan, while Heuser et al. (2019) evaluated the feasibility of exporting green hydrogen from Patagonia to Japan. Niermann et al. (2021) explored the option of exporting hydrogen from Algeria to Germany via tanker ships. Yet, these models enhance practicality but are often computationally complex and may lack the spatial explicitness needed for concrete infrastructure planning.
2.3 HSCN configuration
International HSCNs have also been explored for their potential to enhance sustainability through global supply chains. Xu et al. (2025) considered the structural configuration of HSCNs is a critical factor for their sustainability and efficiency. For example, Feng et al. (2024) argued that centralized hydrogen storage improves economic viability of HSCNs by reducing associated costs. In contrast, Stockl et al. (2020) found decentralized HSCNs more feasible for small-scale, on-site production, offering greater load flexibility and resilience. Such decentralized HSCN strongly depends on the financial supports to enhance the readiness for adopting hydrogen as promising for decarbonize the difference industrial applications Abuzayed et al. (2025), such as heavy duty industries and transportation Tapan and Günay (2025). Furthermore, Mittelsteadt et al. (2015) highlighted other advantages of decentralized supply chains in reducing carbon footprints, while Alzubi (2024) emphasized their adaptability and handling flexibility. While these models and assessments provide valuable insights into literature, their primary focus on technical assessment with focus on at least one sustainability dimension and lack critical factors related to distance minimization for safety consideration.
2.4 Safety and risk considerations
A critical cross-cutting theme in HSCN design is safety, particularly during transportation. Risks of material failure, leakage, and expulsion escalate with transportation distance, directly linking safety to network topology (Qin et al., 2025; Li et al., 2022; Muhsen et al., 2025; Markert et al., 2005). However, risk and safety are rarely acknowledged, and they are often treated as a secondary constraint rather than a primary objective in optimization models. Consequently, the direct minimization of transport distances, a key proxy for mitigating safety risks, has not been a central focus in the design of last-mile distribution networks.
2.5 Research gap identification
The existing body of work provides a strong foundation in economic optimization, uncertainty management, and structural trade-offs. International studies further illustrate the potential of global supply chains (e.g., Lee et al., 2022; Fúnez Guerra et al., 2020). Despite these advancements, a significant gap remains in the development of integrated models that combine these aspects into a practical, spatially explicit framework. Most existing models are high-level and do not leverage real geospatial data to provide actionable plans for infrastructure deployment.
To address this critical gap, this study introduces a novel optimization model featuring geospatial grid framework. Its approach uniquely integrates real-world data to optimize hub locations with the dual objective of minimizing distances to both refueling stations and pipeline access points. This methodology directly tackles the interwind challenges of economic efficiency, infrastructure rollout, and transportation safety through minimizing the transportation distance within grids clusters.
3 Methodology
The Methodology adopted in this paper for designing an optimized HSCN consists of four sequential stages, integrating geospatial analysis with mathematical optimization. The overall workflow is illustrated in Figure 2. The first stage involved gathering and preparing all necessary geospatial and operational data. The data collected includes the geographical coordinates (latitude and longitude) for (a) all existing and planned hydrogen refueling stations in Germany from European Hydrogen Observatory (2024), and (b) all access points and routes of the planned HCN pipelines by uploading the pipeline network on Google Earth Pro, align the Germany boarders, and then extract the coordinates of 350 points on HCN. The HCN pipeline was downloaded from Fernleitungsnetznetreiber (FNB 2024).
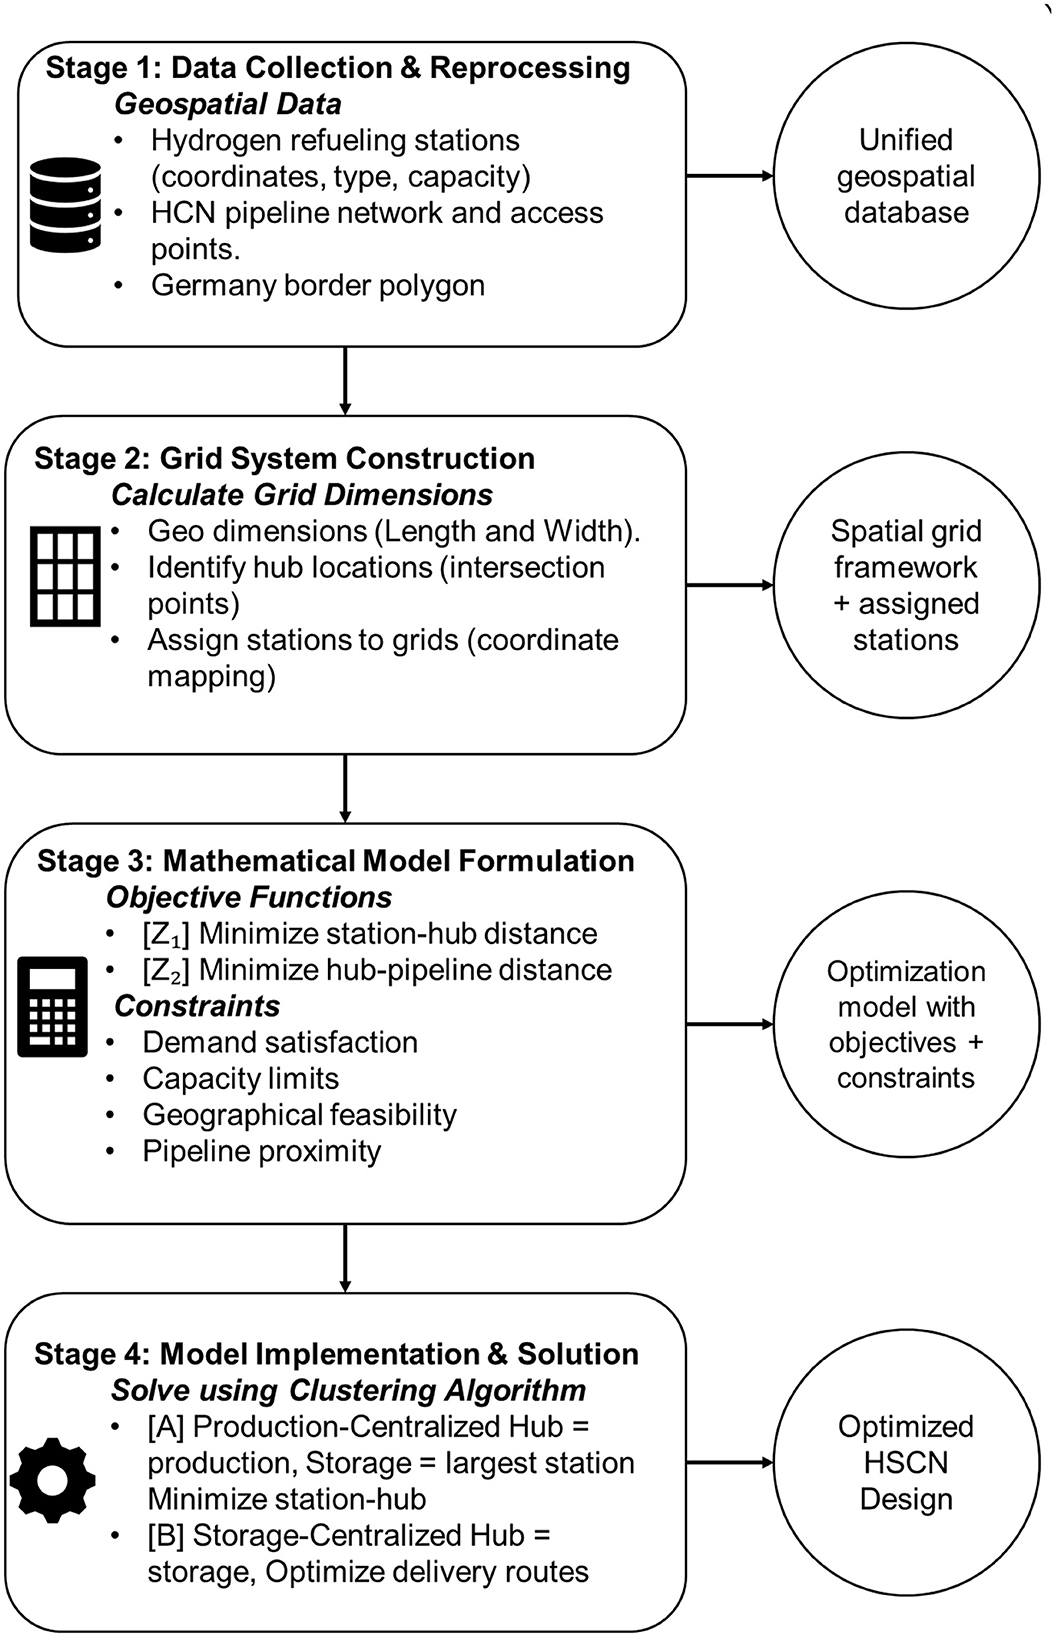
Figure 2. Flowchart of the proposed HSCN optimization methodology.
For each refueling station, we gathered data on its type (e.g., passenger vehicle, heavy-duty truck), capacity, and current operational status (European Hydrogen Observatory, 2024). All data were compiled into a unified geospatial database. The national border of Germany was downloaded from Simplemaps database, and used as a bounding polygon to constrain all subsequent analysis.
The second stage is grid system construction to systematically organize the analysis, grid dimensions were determined, which were used to calculate the number and size of the girds. This was followed by identifying strategic hub locations. For instance, for every set of four neighboring grids, the intersection point was identified as a potential location for a central hydrogen storage or production facility. This helps to assign stations to grids, where each refueling station was reasonably assigned to its corresponding grid based on its coordinates.
Third stage includes mathematical model formulation to determine the optimal configuration of the HSCN. The model's elements are defined in Table 1. However, the model was formulated with two primary objectives: Objective 1 (Z1) that minimizes the total distance between active storage hubs and the refueling stations they supply, while objective 2 (Z2). Z2 minimizes the total distance between active storage hubs and the nearest access point on the pipeline network. These objectives were controlled by several constraints including demand satisfaction, each station must be supplied by exactly one active hub, which cannot supply more hydrogen than its capacity. In addition, all hub locations must reside within the country's borders. Pipeline Proximity must also be considered as follows: Active hubs must be located within a specified distance (μ) of the pipeline network.
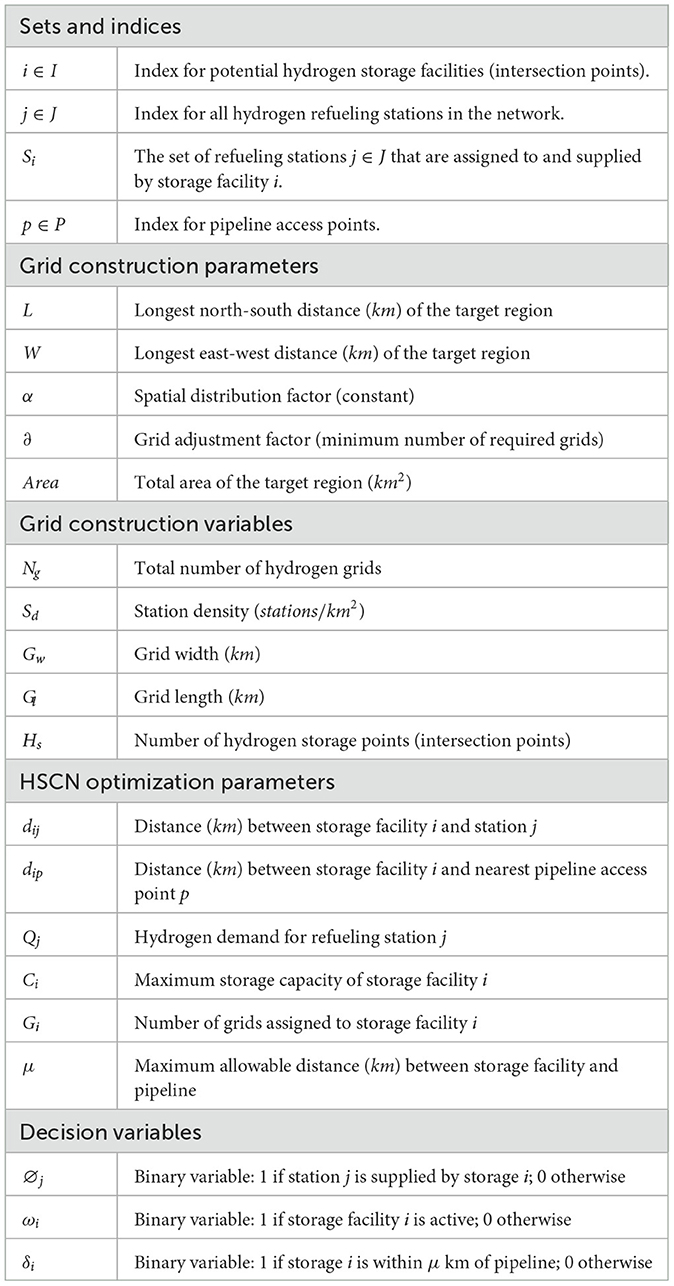
Table 1. Sets, parameters, variables and decision variables for the HSCN design.
Fourth stage is the implementation of the model and solution to generate the optimized network design. For this purpose, the model was solved using a clustering algorithm to efficiently assign stations to hubs and determine the optimal hub locations. Two primary scenarios were proposed; scenario A (Production-Centric): The intersection point serves as a production facility, with storage delegated to the highest-capacity station in the grid. Scenario B (Storage-Centric): The intersection point serves as a central storage facility, with optimal delivery routes determined to all stations in its assigned grids. For grids where the station density exceeded a predefined threshold, a sub-grid with half the dimensions might be created, and a sub-storage facility will be sited to further reduce local distribution distances.
3.1 Optimizing hydrogen networks
The mathematical model for the HSCN design is formulated using the following sets, parameters, and decision variables, which are categorized In Table 1. This arrangement applies to both the grid construction (Section 3.1) and network optimization (Section 3.2) phases.
3.1.1 Grid construction
To best optimize hydrogen network infrastructure in a specific region, the paper proposes a systematic grid-based approach. The model divides the target region into uniform grids of equal size and shape, with hydrogen applications varying according to technological readiness levels (Figure 3). This grid system serves two primary purposes: minimizing delivery time (thereby reducing transportation risks) and optimizing infrastructure costs through strategic storage placement.
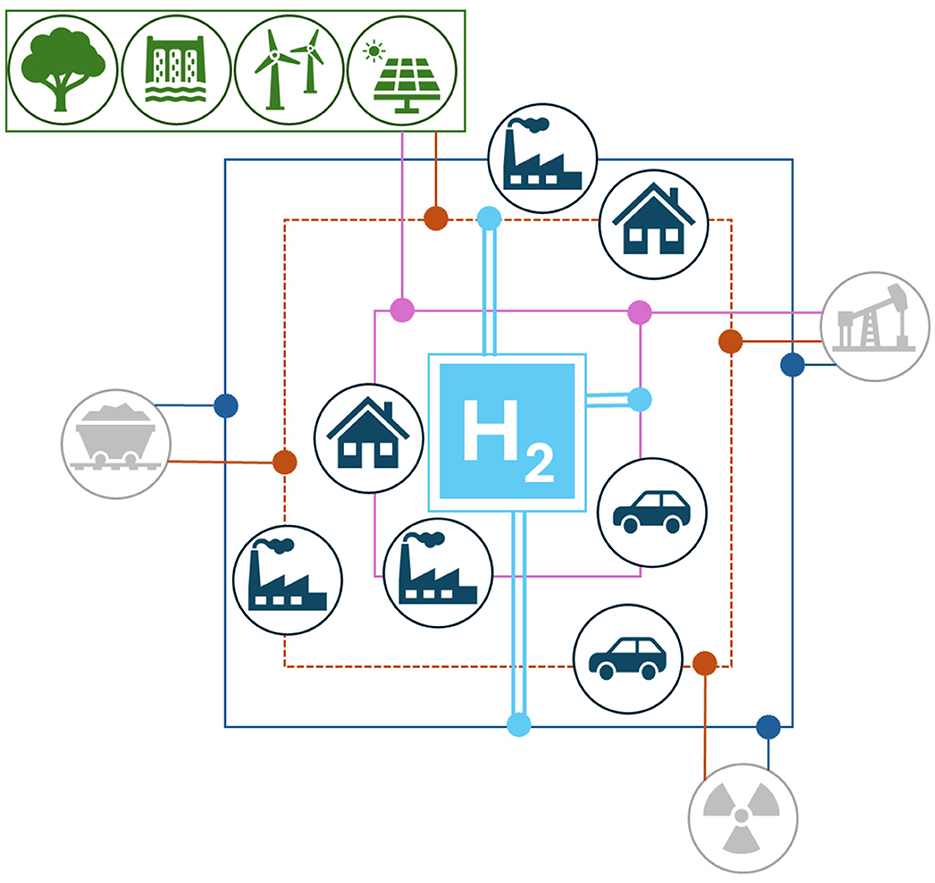
Figure 3. Integrating hydrogen for different applications in a grid.
The model identifies optimal location for central storage facilities at the intersection points between four neighboring grids (represented by red points in Figure 4). This strategic placement significantly cuts hydrogen network costs. Each central storage facility's capacity is determined by combined demand of its four assigned grids.
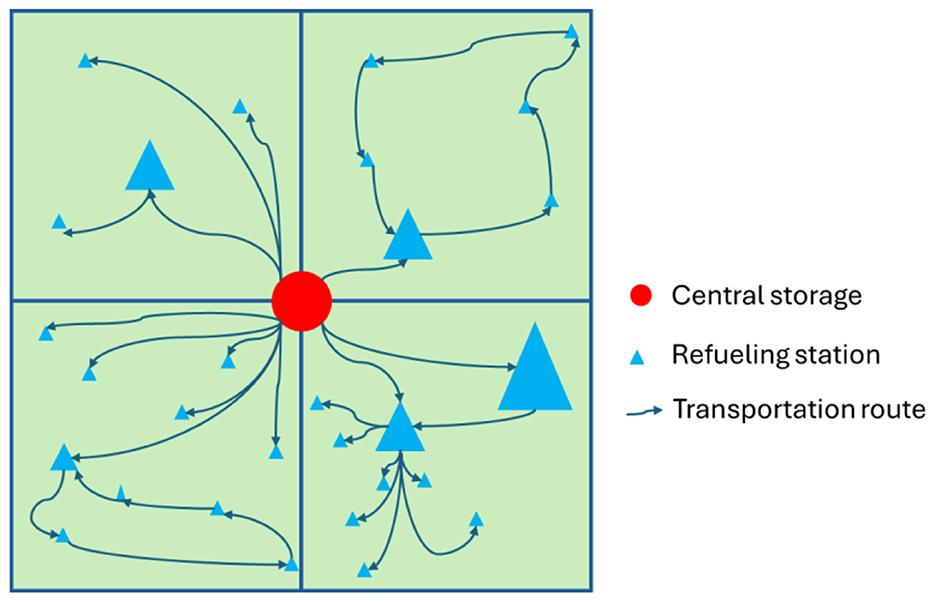
Figure 4. Central storage, refueling stations, and the different routing scenarios in four neighboring hydrogen-grids.
The system accounts for varying refueling station requirements through several key features: (i) Refueling stations capacity is represented by blue triangle size in Figure 4. (ii) Sub-storage facilities may be required depending on station density and capacity. (iii) Optimal sub-storage locations consider distance from central storage points. (iv) Delivery routes are optimized for efficient hydrogen distribution.
The capacity of the red point depends on the demand of the neighboring grids as it is expected to be satisfied. The number of grids is controlled by the total area of hydrogen network within a specific region. The number of hydrogen storages (Hs) (intersection points) can be calculated as in Equation 1:
Where Ng is the number of hydrogen grids, which depends on the density of the refueling stations as suggested in Equation 2
Accordingly, Ng should be calculated by multiplying the station's density by grids adjusting factor (∂) that represents the minimum number of required grids (Equation 3):
Based on that the grid dimensions Gw and Gl are calculated in Equations 4 and 5, respectively.
Where L is the longest distance between two points in the north and south of a specific region, while W is the longest distance between two points in east and west. Figure 5 depicts the structure of grids, including the illustrations of those variables.
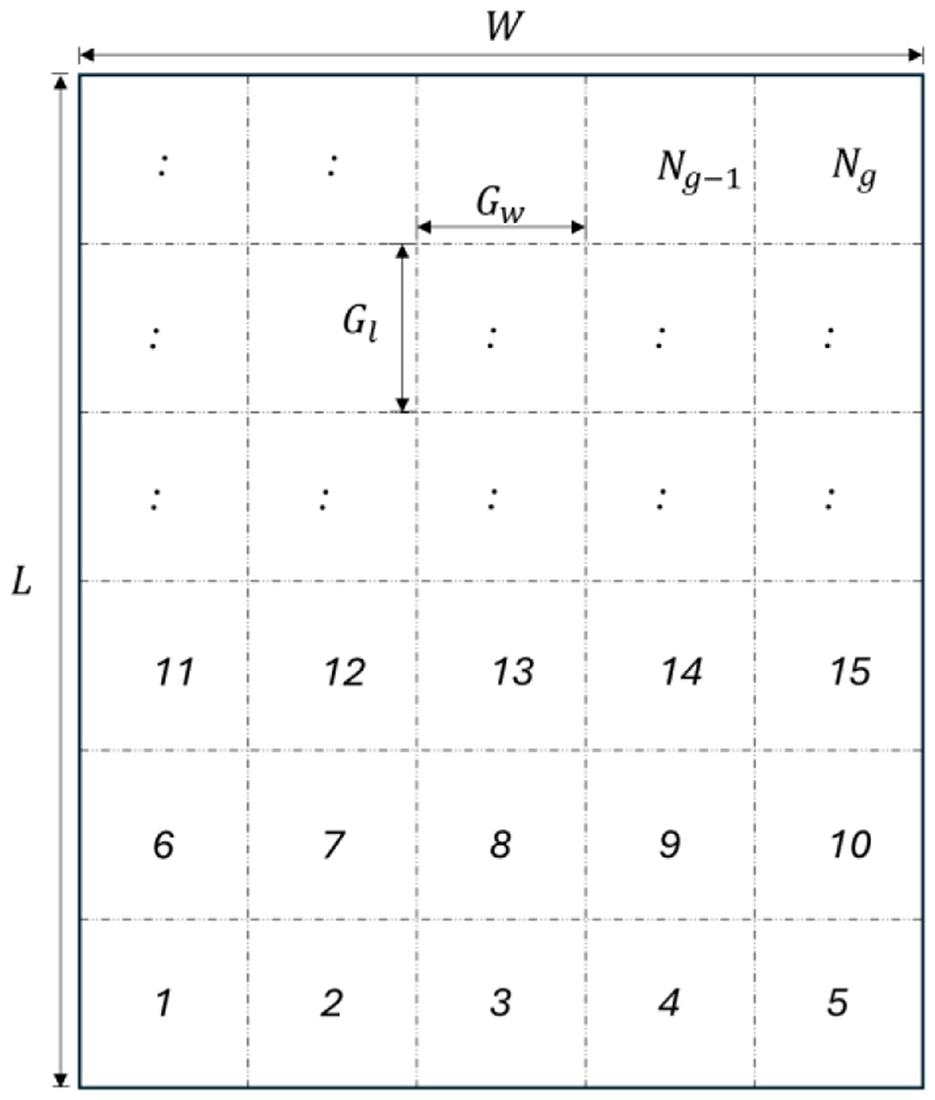
Figure 5. Grids structure, including the area and grids dimensions, as well as grids number.
3.1.2 Optimizing HSCN
To operationalize the primary goal of designing a safe and efficient HSCN, the optimization model is formulated around two key spatial objectives derived from the problem statement. The first objective addresses the core challenge of “last mile” distribution safety by minimizing the total distance between hydrogen hubs and the refueling stations they supply. This directly reduces transportation time, associated risks, and operational expenses. The second objective ensures the strategic integration of the network with the primary hydrogen transmission infrastructure by minimizing the distance from each storage hub to the nearest pipeline access point. This dual-minimization approach ensures the resulting HSCN design is not only internally efficient but also logistically feasible within the broader national energy system. These objectives are formally expressed in Equations 6 and 8.
Once hydrogen grids are available, HSCN should optimize the distance between the different nodes of the same network. Therefore, the first objective here is to minimize the transportation distance between nodes inside the same grids (Equation 6):
while ∅ji is a binary variable explained as (Equation 7):
While the second objective is to minimize the distance between storage facilities and access points to the pipelines (Equation 8):
And ωi is a binary variable explained as (Equation 9)
Taking into consideration the following constraints (Equations 10–15):
• In order to satisfy the demand, each refueling station j must be supplied by at most one storage facility. Therefore,
• Capacity constraint needs to be fulfilled as follows:
The following constraint ensures that each storage facility i can serve up to 4 grids only.
• Since the specified location must be within the borders of a specific region or country, the coordinates of storage facility i should be:
• For safety consideration and to prioritize the integration of the pipeline network, the selected storage facilities must be close to pipelines access points and should be within a distance (μ) km as follows:
Where
3.2 Hydrogen infrastructure in Germany
In October 2024, the construction of the Hydrogen Core Network (HCN) in Germany was approved (Figure 6), representing a landmark initiative in EU energy transition. By the end of 2032, HCN is expected to span approximately 9,040 km, making it the largest hydrogen network in Europe. Around 60% of the HCN will be converted from the existing natural gas pipeline network, with an estimated investment of e18.9 billion. Additionally, the private sector is expected to construct another 468 km of pipelines (FNB, 2024).
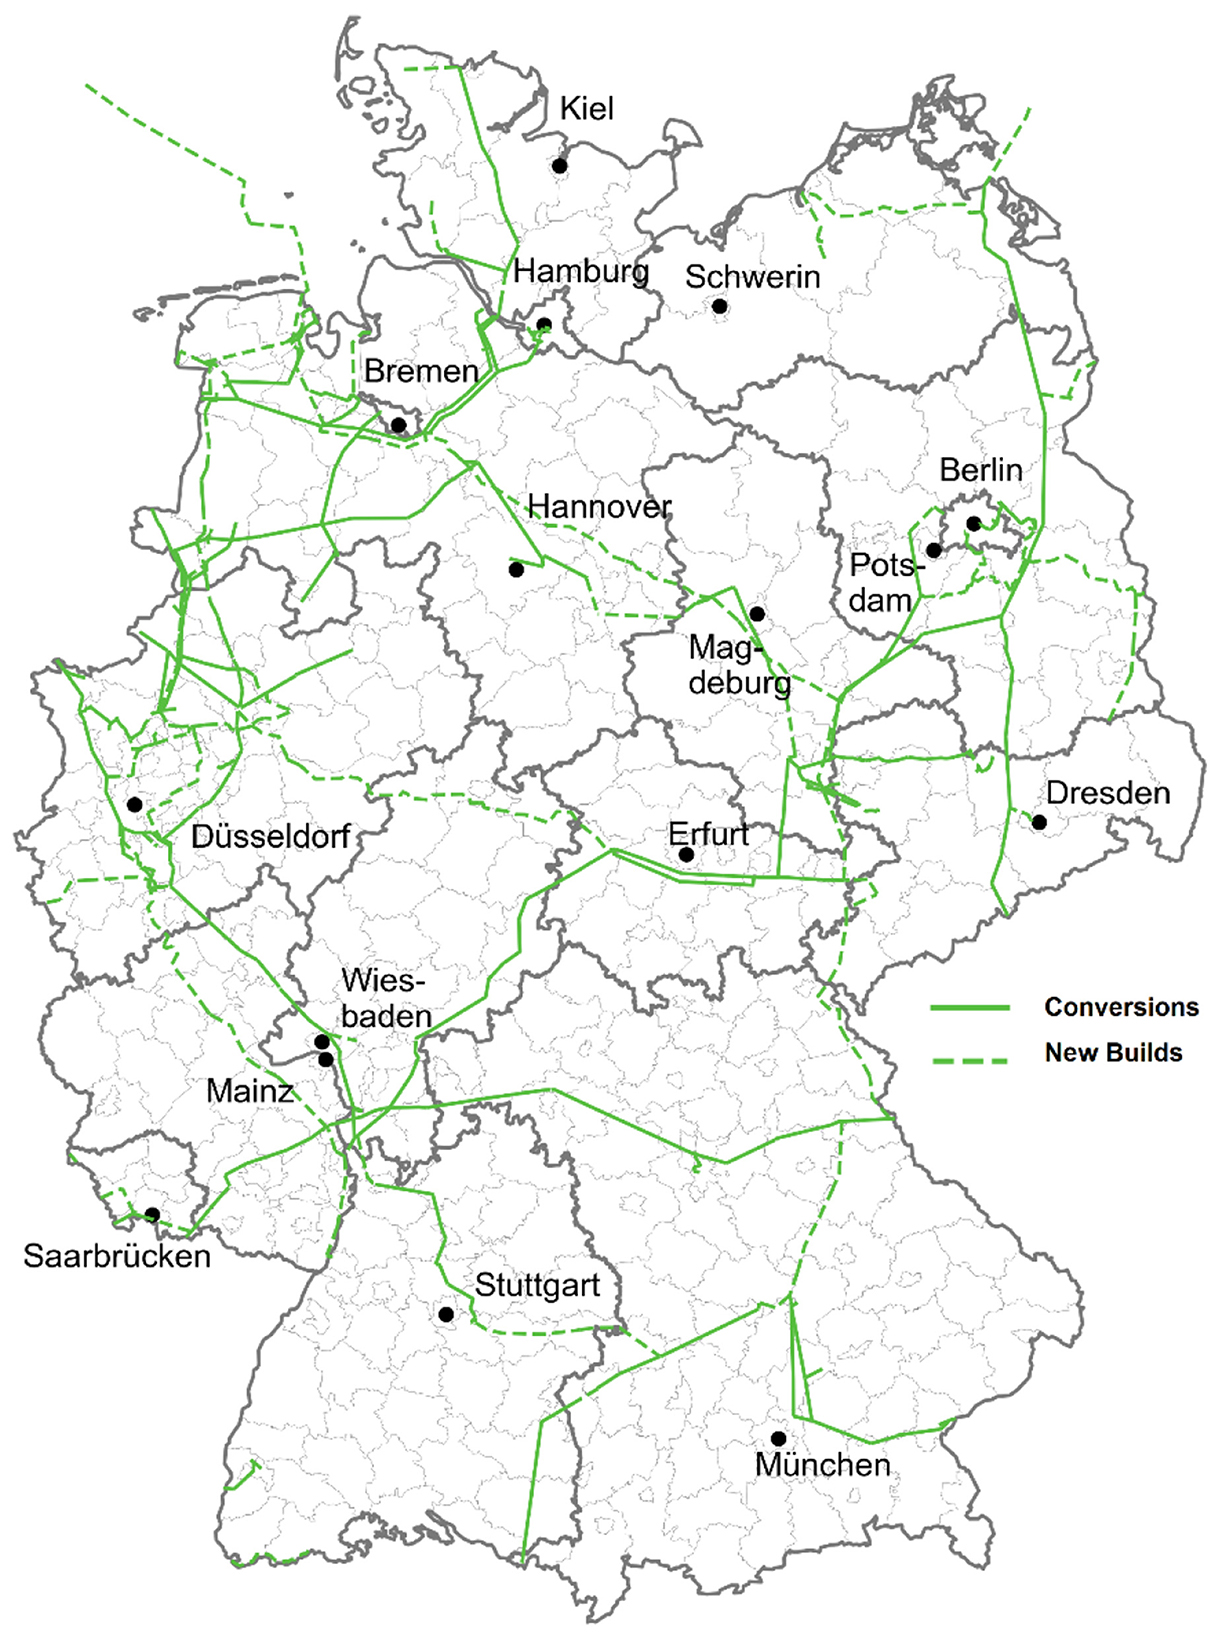
Figure 6. Approved pipeline network for hydrogen core network to be implemented by 2032 (FNB, 2024).
A key feature of the HCN is its strategic deployment of hydrogen refueling stations at 200 km intervals, primarily catering to commercial vehicles including buses and trucks (Pfeifer, 2021). Accordingly, an assumption made here for grids dimensions to be 200 km x 200 km. By 2032, the network plans to include a total of 300 refueling stations for heavy-duty transportation (HDT) (Pfeifer, 2021), though the current implementation remains in early stages, with just 17 stations for HDT operational as of May 2024. Across the EU-27, Germany hosts a significant majority of hydrogen infrastructure, accounting for approximately 52% of the total 166 stations across all dispenser types. Figure 7 provides a visual representation of the geographical distribution for 86 stations in Germany (European Hydrogen Observatory, 2024).
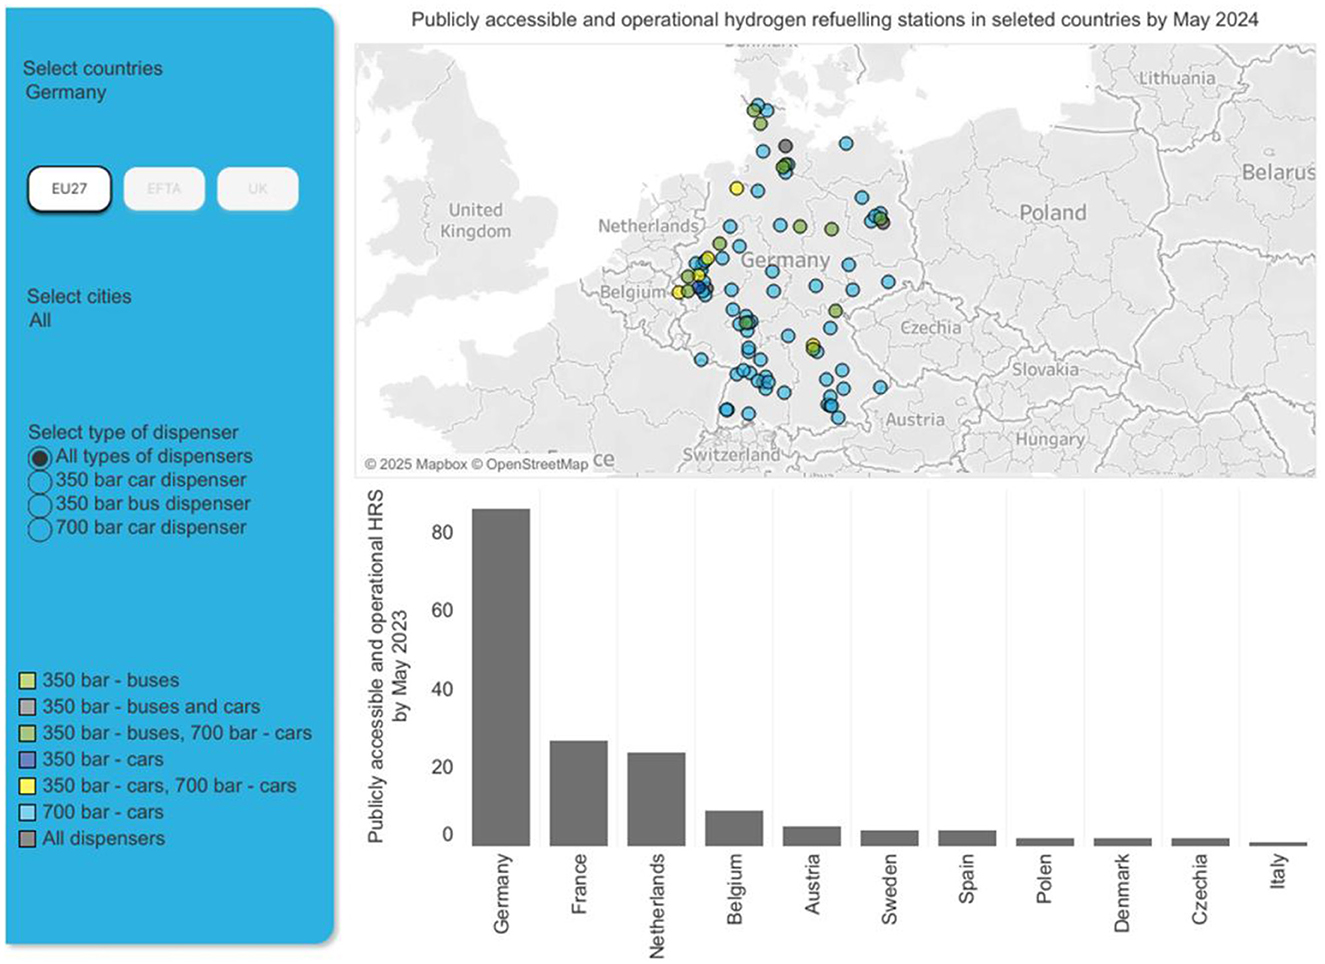
Figure 7. In operation Hydrogen refueling stations in Germany, status May 2024 (European Hydrogen Observatory, 2024).
According to data from the European Hydrogen Observatory, 86 hydrogen refueling stations are currently operational in Germany. Of these, 17 stations are equipped to serve HDT (e.g., trucks and buses). For passenger vehicles, 85 stations are compatible with 700-bar dispensers, with 10 of these stations also supporting 350-bar dispensers. Additionally, there is 1 standalone station exclusively for 350-bar dispensers. Notably, only 4 stations are compatible with all dispenser types, making them versatile for both passenger vehicles and HDT (European Hydrogen Observatory, 2024). The data also includes the coordinates of all these stations, as scattered in Figure 7.
The expected hydrogen demand in the coming decades necessitates a reliable and comprehensive infrastructure network design. This network should integrate key nodes, including production facilities, storage systems, and distribution channels to refueling stations. Furthermore, the infrastructure must align with HCN, as illustrated in Figure 6. Data extracted from Fernleitungsnetznetreiber (FNB Gas) provides detailed information on all pipeline projects, including those to be converted or newly constructed. This data encompasses important parameters such as pipeline length, starting and end locations, diameter, and the targeted decarbonization sector (FNB, 2024).
While Germany is making significant progress by converting existing pipelines for hydrogen transport, additional actions are required to achieve the goals of HCN. These actions include expanding infrastructure to support refueling stations for passenger vehicles and HDT. To ensure a reliable supply, sufficient production and storage locations must be strategically determined.
For constraint 13, Germany polygon was downloaded from Simplemaps-database. In addition, constraint (10) will be automatically satisfied if refueling stations are pre-assigned to a certain grid, which is the case for Germany, since the coordinates for all potential stations are known. In this approach, every four neighboring grids share a production or storage location, which will supply hydrogen to the refueling stations within these grids. This decentralized structure aims to optimize hydrogen distribution, reduce transportation distances, and enhance overall network efficiency. However, to better forecast hydrogen demand, an additional assumption was made, which considers the current gas stations in Germany as an indicator to manage the demand for hydrogen as a source of energy for transportation. For this purpose, data related to the location coordinates of the gas station was extracted from the Kaggle database (Ole et al., 2023).
To operationalize the approach, a Python workflow was developed that clusters refueling stations within each four-cell grid set, then connects each cluster to its corresponding central storage site using road-constrained paths within Germany's land borders from OpenStreetMap data (Welzheimerwald, 2025), and also computes station–storage distances in kilometers and other main parameters. In grid sets where many refueling stations are assigned to a single central storage, a sub grid was introduced with half the original cell length and width; within each of them a sub-storage facility is sited near the sub-grid center and linked to the stations it serves, further shortening routes and balancing loads.
4 Results and discussion
The spatial optimization model determined Germany requires 16 hydrogen grids with the following dimensions: grid length (L) (north–south) is 215 km and grid width (W) (east–west) is 160 km. These dimensions were calculated using Germany's maximum geographical spans (860 km north-south, 640 km east-west) with constants α = 4 and ∂ = 16 applied to Equations 1–5. Figure 8 illustrates the resulting grid structure together with existing hydrogen refueling stations across different applications.
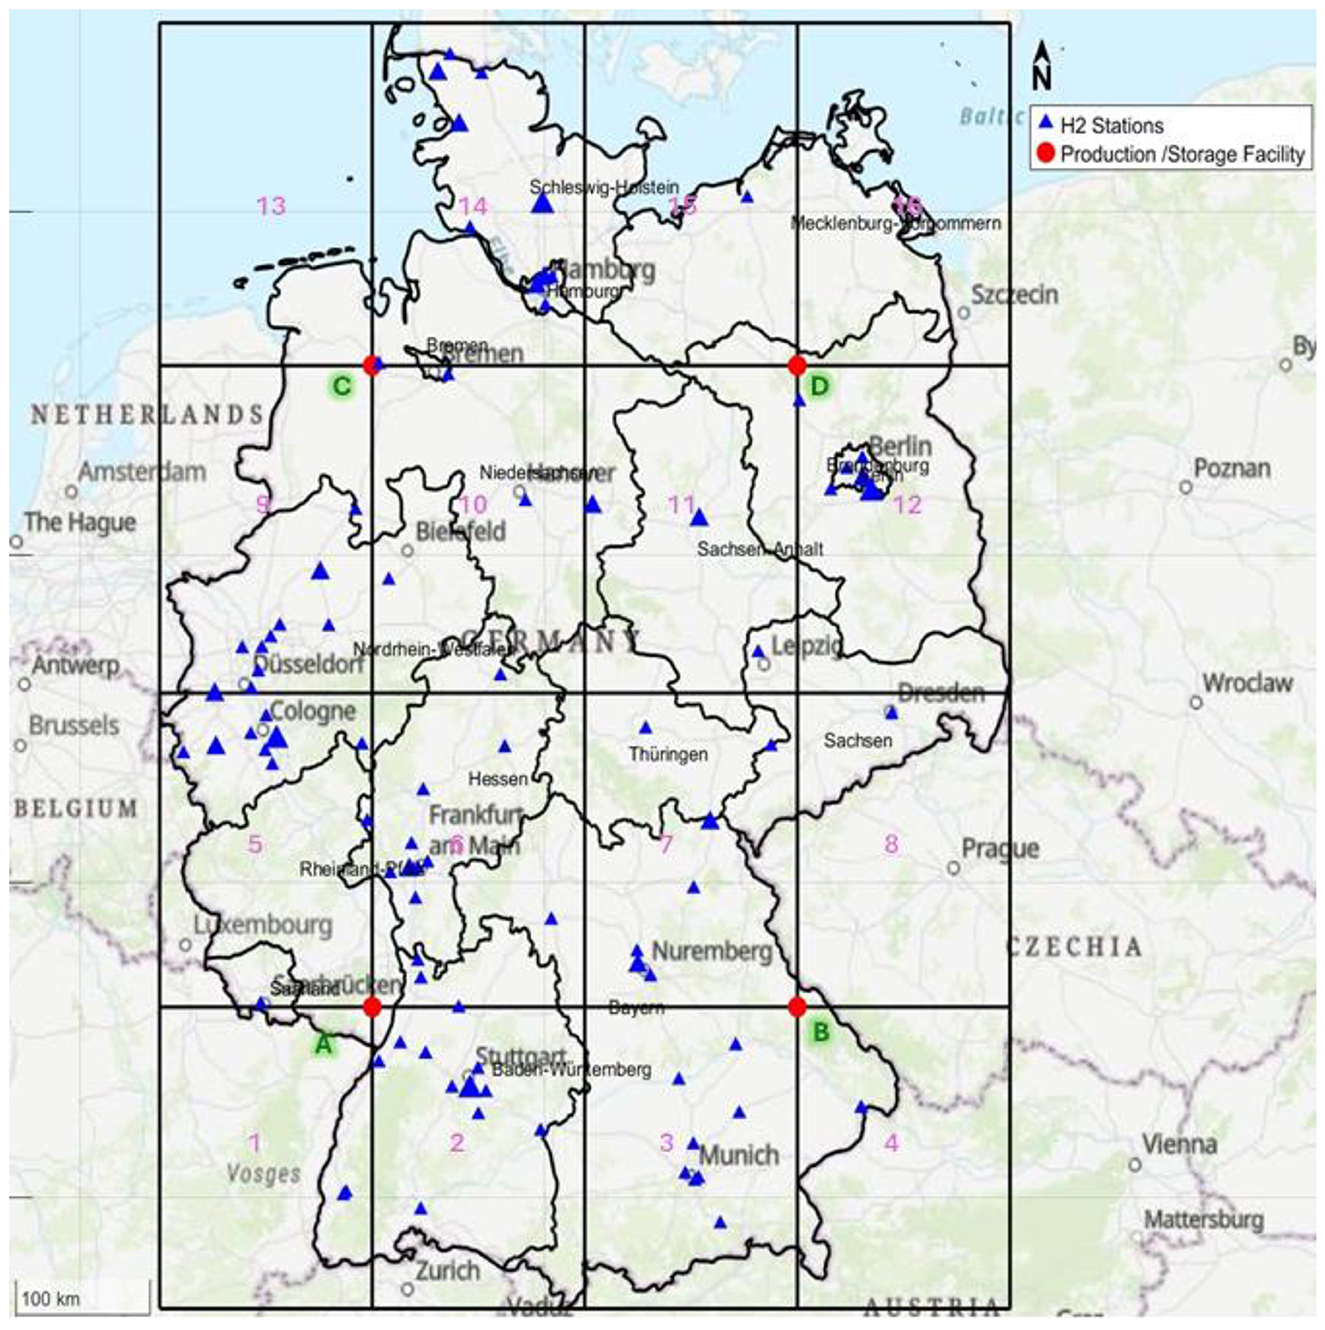
Figure 8. Hydrogen grids in Germany, highlighting currently active refueling stations and potential production or storage locations, grid identification number, and intersection points identification letters (A–D).
The grid system demonstrates strong compatibility with Germany's Hydrogen Core Network (HCN), particularly in optimizing pipeline access points (Figure 8). Each red point in both Figures 8, 9 presents a potential location for a storage facility or, in case the intersection points are far away from the pipeline network, a production facility to minimize transportation distance and enhance responsive. Furthermore, blue triangles are the operational hydrogen stations in Germany, among them 17 stations serve HDT. These stations are of bigger triangle size depending on how many dispensers they have. With only four stations currently equipped to serve all dispenser types (350-bar HDT dispensers, 350-bar, and 700-bar passenger vehicles dispensers).
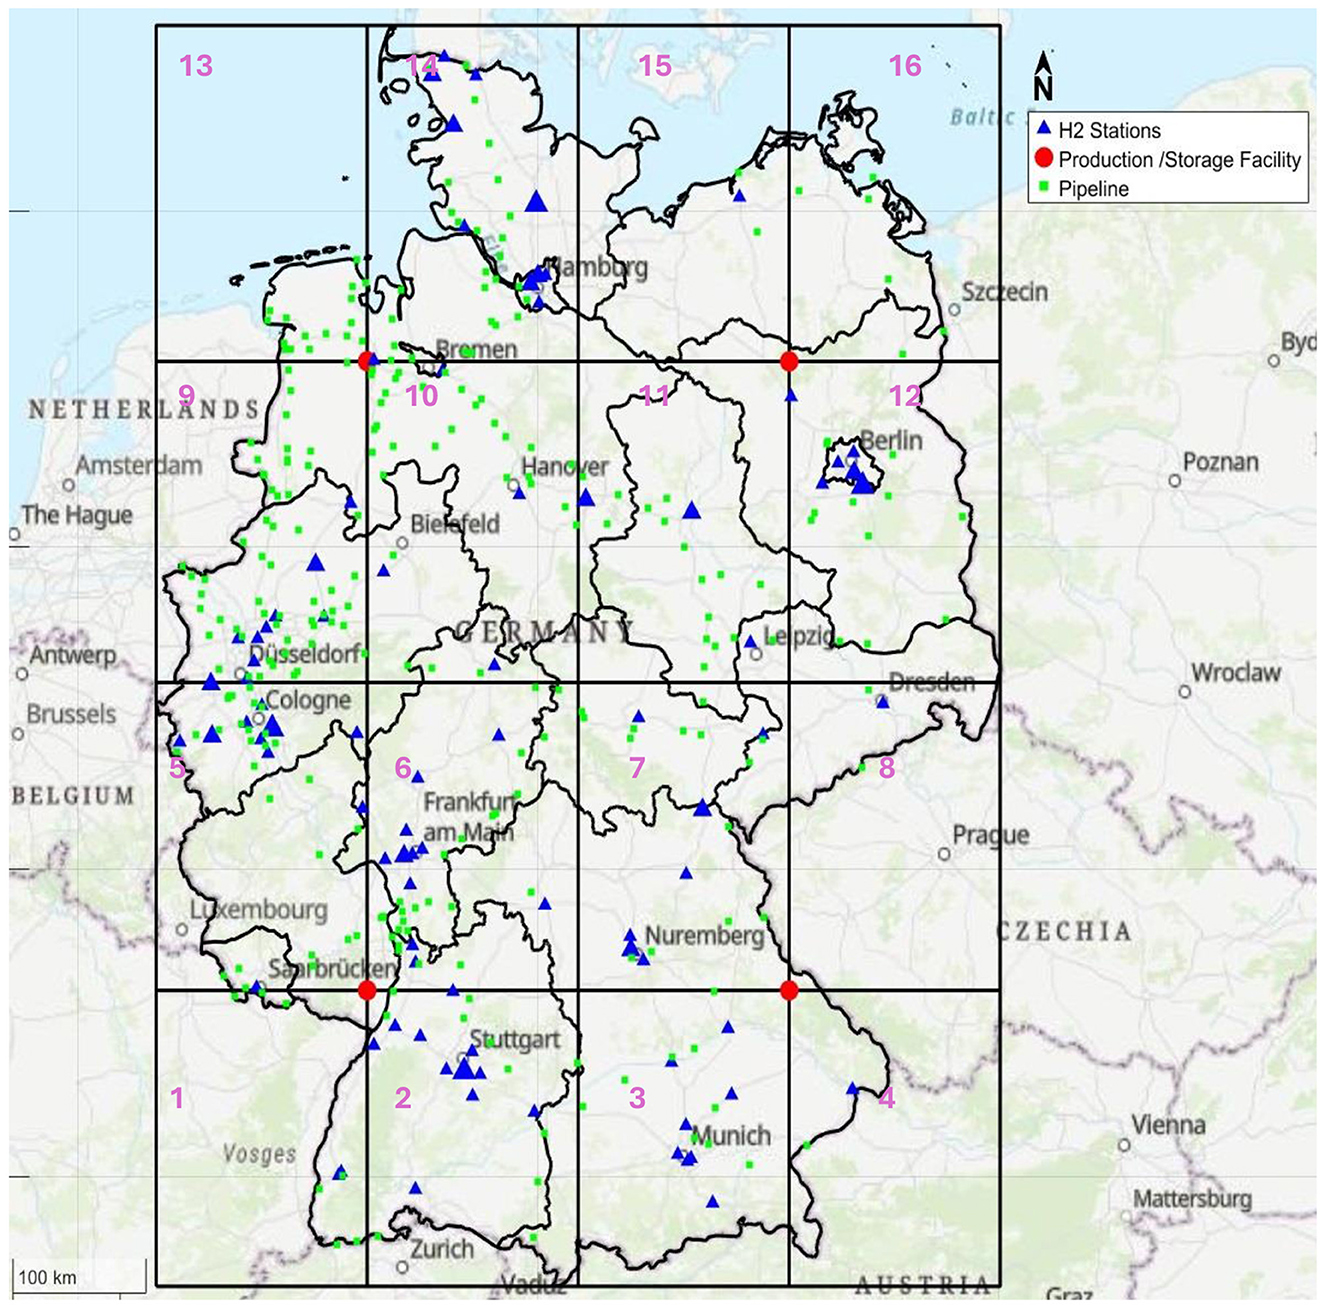
Figure 9. Integrating HCN into grids in Germany, highlighting currently active refueling stations and potential production or storage locations.
To minimize transportation distances, the red points were shifted to fulfill the objective function to the nearest access point on the pipelines network, as highlighted in open red circles. Figure 10 visually validates the model's effectiveness by showing the optimized relocation of hub locations to minimize distance to the pipeline network. These shifts resulted in eliminating around 166.34 km divided as follows: Point A shifted by 29.74 km, point B shifted by 59.34 km, point C by 8.00 km, and point D by 69.27 km.
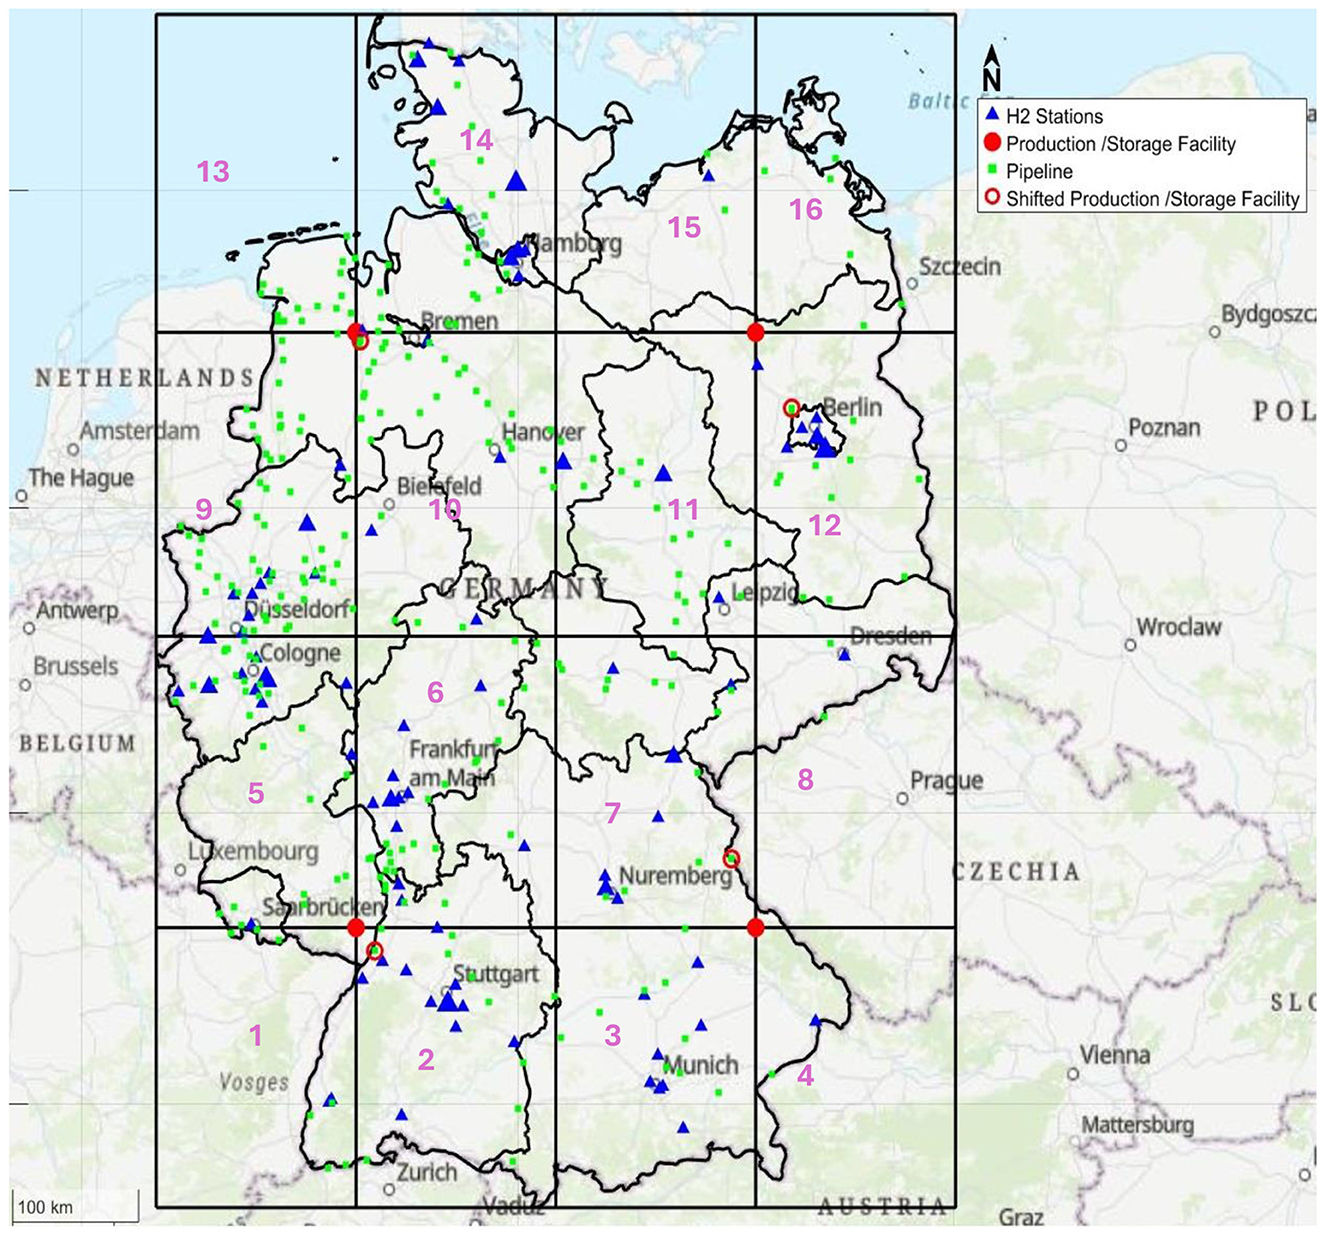
Figure 10. Shifted storage locations to the nearest pipeline points.
Using the Python workflow described earlier, the 86 operational stations were clustered into four hub regions (A–D), and straight-line paths within Germany's land borders OpenStreetMap were computed from each station to its assigned central storage. Figure 11 presents the baseline network, which yields a cumulative station-hub distance of 11,630 km with an average of 135.2 km per station (shortest 6.7 km, longest 270.6 km). Per-cluster averages are A: 133.4 km, B: 141.3 km, C: 157.1 km, and D: 78.9 km.
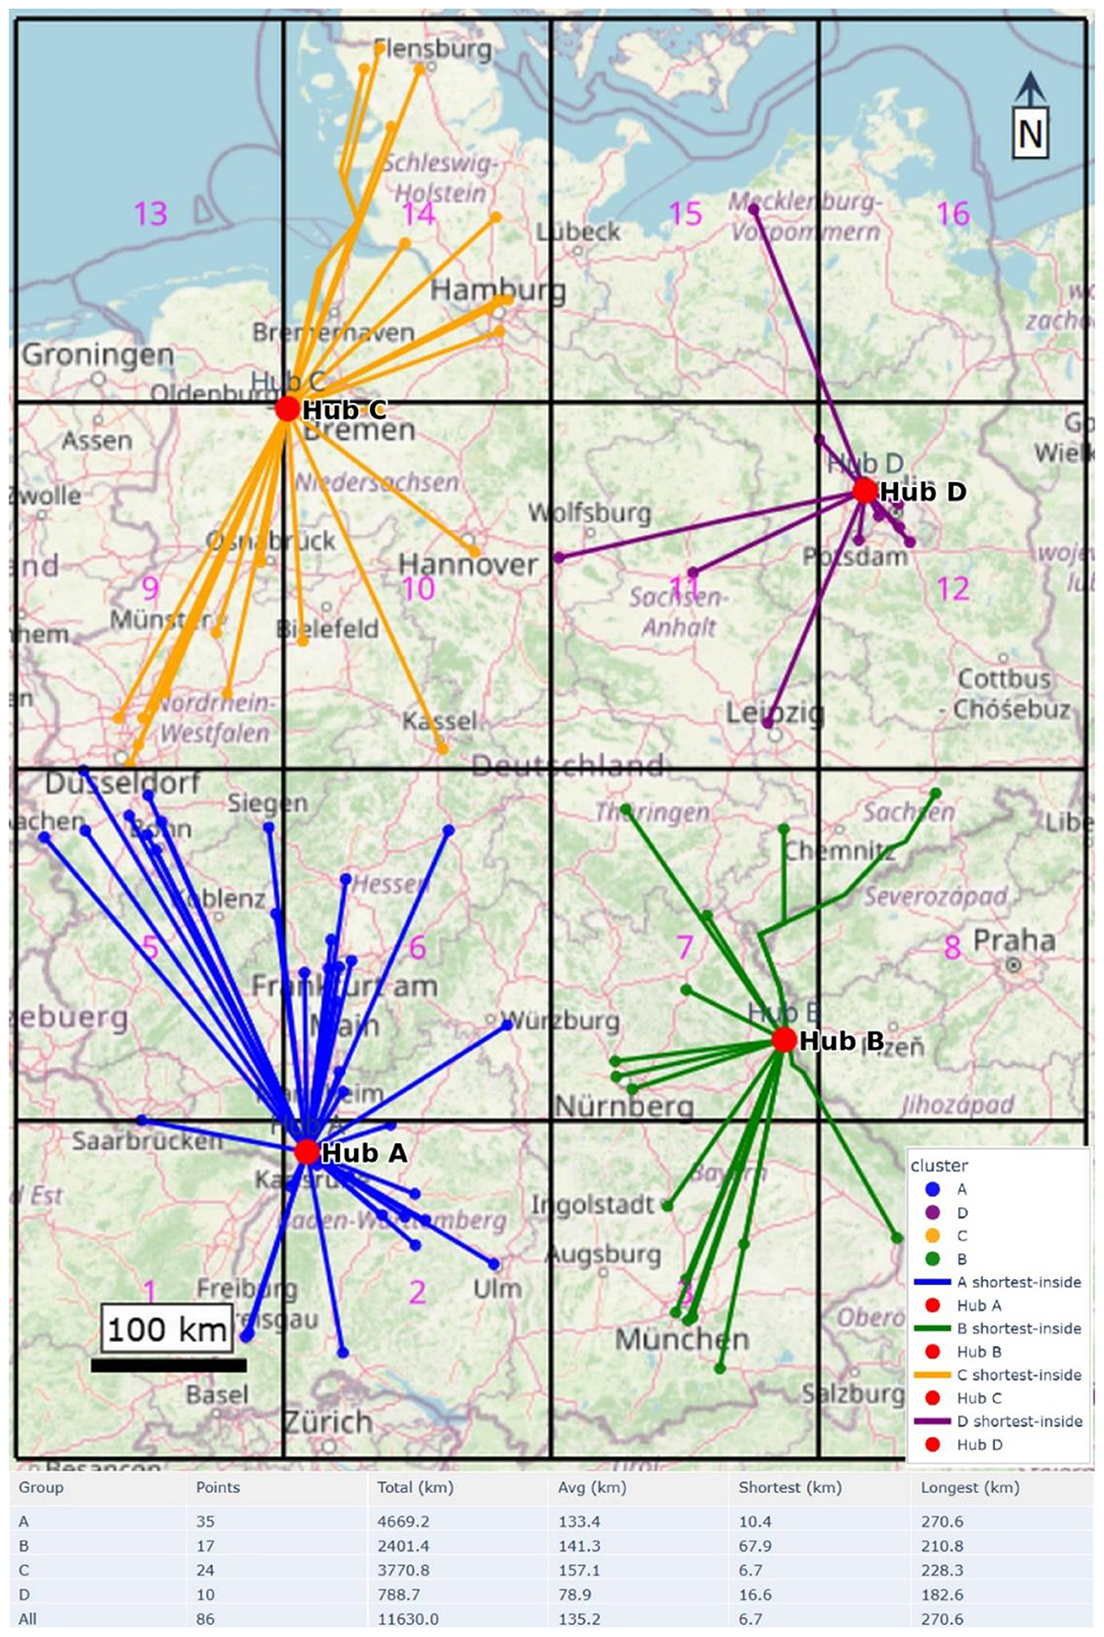
Figure 11. Baseline clustering of 86 stations to central storages (hubs A–D) with road-constrained routes overlaid on the model grid. The table summarizes per-cluster route statistics.
In two high-density areas, sub-grids were introduced with half the original cell side length and a sub-storage near each sub-grid's center were sited. Figure 12 illustrates the sub-hubs, identified based on density threshold. This created sub-hubs As (within cluster A) and Cs (within cluster C), to which nearby stations were reassigned. The refined layout reduces total routed distance to 8,910.4 km (−2,719.6 km, −23.4%) and lowers the average per-station distance to 103.6 km (−31.6 km, −23.4%). The maximum leg also drops from 270.6 km to 219.3 km (−51.3 km, −19.0%), indicating a tangible reduction in exposure on the longest routes.
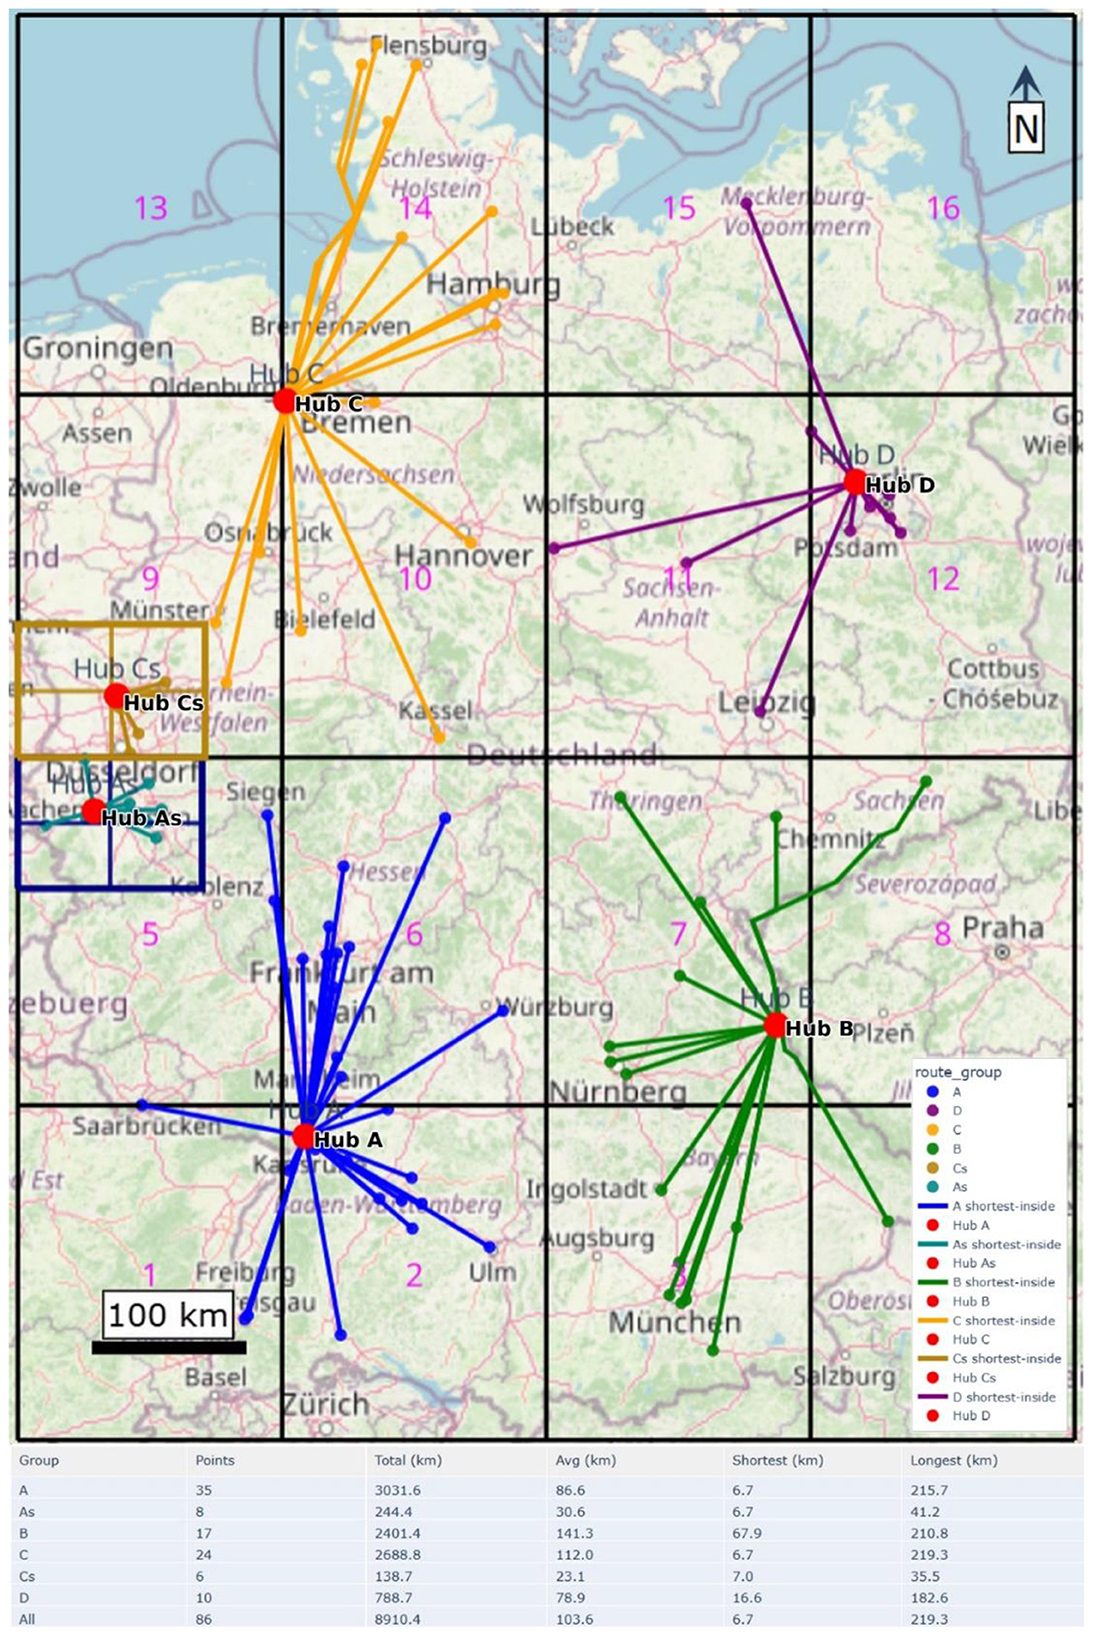
Figure 12. Refined network with half-size sub-grids and added sub-storages (As, Cs); nearby stations are reassigned, shortening routes. The table shows updated route statistics.
This success in reducing total distribution distance by 23.4% (2,719.6 km) directly addresses a core challenge highlighted in prior research. For instance, Li et al. (2022) identified that transportation risks, including leakage and expulsion, escalate with distance. The result provides a quantitative demonstration of how spatial optimization can directly mitigate this well-established risk factor. Furthermore, while early models like Almansoori and Shah (2006, 2009) focused primarily on cost minimization, this work demonstrates that a spatial model can simultaneously achieve both economic and safety objectives by making distance minimization a primary goal.
The model's ability to determine the need for sub-storage based on a density threshold offers a data-driven compromise in the debate between centralized and decentralized network configurations. Feng et al. (2024) promoted centralized storage to improve economic viability, while Stockl et al. (2020) found decentralized networks more feasible for small-scale production. The findings merge these perspectives by demonstrating that a hybrid approach is optimal; a centralized structure (the main hub) is efficient for regional distribution, but decentralization (sub-storage) becomes critical for managing localized high-density demand, thereby enhancing resilience as noted by Alzubi (2024).
The primary contribution of this spatial framework is its ability to bridge a gap between high-level strategic models and on-the-ground infrastructure planning. While studies like Ochoa Bique and Zondervan (2018) and Fazli-Khalaf et al. (2020) made significant advances in modeling demand and cost uncertainty, their models lack the spatial explicitness for concrete sitting decisions. Similarly, international feasibility studies (e.g., Lee et al., 2022 and Heuser et al., 2019) focus on long-distance transport, but the critical “last mile” distribution within a country remains less explored. This work fills this gap by providing a method that translates national strategies into actionable, spatially optimized infrastructure plans.
4.1 Limitations and future research
While the proposed model demonstrates significant potential for optimizing HSCN design, the findings of this study should be interpreted considering its limitations. These constraints also present clear avenues for future work.
First, the model's reliance on static demand data and straight-line distance calculations, while providing a robust initial spatial framework, may not capture the full complexity of real-world operations. The 23.4% reduction in distribution distance reported, for instance, represents a theoretical maximum under these simplified conditions. Future research should incorporate road network data and dynamic demand modeling to refine these efficiency estimates and enhance the model's practical applicability for logistics planning.
Second, the scope of this study was deliberately focused on spatial optimization, excluding economic factors such as construction, operation, and maintenance costs. Integrating a comprehensive cost-benefit analysis or life cycle cost analysis would be a critical next step to assess the financial viability of the proposed network configurations and provide a more holistic tool for policymakers. Finally, the model does not account for the temporal variability of renewable energy sources used for green hydrogen production. Aligning hydrogen production schedules with solar and wind availability could further optimize the supply chain's environmental and economic performance.
Addressing these limitations in future work will strengthen the model's utility and provide an even more powerful decision-support framework for the rollout of sustainable hydrogen infrastructure.
5 Conclusions
This study developed a novel grid-based optimization model to address the critical spatial planning challenges of hydrogen infrastructure deployment for urban and regional transportation. By integrating real geospatial data from Germany's HCN and refueling stations, the model successfully demonstrates that a systematic, spatially explicit approach can significantly enhance the efficiency and safety of hydrogen supply chains.
The core achievement of this work is the quantifiable improvement in network design. The results show that the optimized grid network reduced total intra-grid distribution distance by 23.4% (2,719.6 km) and decreased the maximum single delivery route, directly mitigating transportation risks and associated costs. This was achieved through a dual-objective optimization that strategically sited storage hubs to minimize distances to both demand nodes (refueling stations) and supply corridors (pipeline access points). Furthermore, the introduction of a station density threshold (0.032 stations/km2) provides a actionable, data-driven criterion for planners to decide when to deploy decentralized sub-storage, enhancing the network's resilience and responsiveness to local demand.
5.1 Implications for sustainable cities
The model provides a transformative tool for policymakers and urban planners, shifting hydrogen infrastructure planning from a theoretical exercise to a practical, data-driven process. The framework allows for: (1) Prioritizing infrastructure rollout in high-impact corridors, (2) explicitly minimizing transportation distances to improve public safety and reduce logistical hazards, and (3) the methodology is adaptable to other countries and regions, providing a blueprint for national hydrogen strategies.
The primary implication for sustainable urban development is the provision of a practical planning tool. For city administrators and regional planners, the model offers a data-driven methodology to strategically site hydrogen hubs, aligning infrastructure rollout with urban form, existing transport networks, and projected demand hotspots. This moves hydrogen planning beyond theoretical potential into actionable, spatially aware strategy, which is essential for managing the complex land-use and safety considerations inherent in dense urban environments.
The findings hold significant policy relevance. The grid-based framework can guide investment prioritization, zoning decisions, and inter-municipal cooperation, ensuring that hydrogen infrastructure development is coherent, efficient, and equitable across regions. It supports policy goals outlined in strategies like Germany's National Hydrogen Strategy by providing a tangible method to build resilient and scalable infrastructure.
In conclusion, this research contributes a critical spatial planning component to the discourse on sustainable cities. By providing a method to optimize the physical architecture of hydrogen networks, it helps de-risk investment and accelerate the adoption of this crucial technology, ultimately supporting the transition toward more sustainable and resilient urban mobility systems.
Data availability statement
The original contributions presented in the study are included in the article/supplementary material, further inquiries can be directed to the corresponding author.
Author contributions
EA: Conceptualization, Data curation, Formal analysis, Investigation, Methodology, Resources, Software, Supervision, Validation, Visualization, Writing – original draft, Writing – review & editing. BA: Formal analysis, Resources, Software, Validation, Visualization, Writing – review & editing. AA: Software, Validation, Visualization, Formal analysis, Writing – review & editing.
Funding
The author(s) declare that financial support was received for the research and/or publication of this article. The open-access publication fees were covered by the University of Duisburg-Essen.
Conflict of interest
BA was employed by ProgressSoft, Amman.
The remaining authors declare that the research was conducted in the absence of any commercial or financial relationships that could be construed as a potential conflict of interest.
Generative AI statement
The author(s) declare that no Gen AI was used in the creation of this manuscript.
Any alternative text (alt text) provided alongside figures in this article has been generated by Frontiers with the support of artificial intelligence and reasonable efforts have been made to ensure accuracy, including review by the authors wherever possible. If you identify any issues, please contact us.
Publisher's note
All claims expressed in this article are solely those of the authors and do not necessarily represent those of their affiliated organizations, or those of the publisher, the editors and the reviewers. Any product that may be evaluated in this article, or claim that may be made by its manufacturer, is not guaranteed or endorsed by the publisher.
References
Abuzayed, A., Liebensteiner, M., and Hartmann, N. (2025). Hydrogen-ready power plants: optimizing pathways to a decarbonized energy system in Germany. Appl. Energy 395:126228. doi: 10.1016/j.apenergy.2025.126228
Almansoori, A., and Shah, N. (2006). Design and operation of a future hydrogen supply chain. Chem. Eng. Res. Design 84, 423–438. doi: 10.1205/cherd.05193
Almansoori, A., and Shah, N. (2009). Design and operation of a future hydrogen supply chain: multi-period model. Int. J. Hydrogen Energy 34, 7883–7897. doi: 10.1016/j.ijhydene.2009.07.109
Alzubi, E. (2024). Integrating Circular Economy Strategies for Sustainable Citrus Supply Chains. Duisburg: DuEPublica. doi: 10.17185/duepublico/82607
Badakhsh, A., and Mothilal Bhagavathy, S. (2024). Caveats of green hydrogen for decarbonisation of heating in buildings. Appl. Energy 353:122152. doi: 10.1016/j.apenergy.2023.122152
Balat, M. (2008). Potential importance of hydrogen as a future solution to environmental and transportation problems. Int. J. Hydrogen Energy 33, 4013–4029. doi: 10.1016/j.ijhydene.2008.05.047
Chinello, G., de Kater, A., Sadri, M., Modrego, J., van Putten, D., Stiphout, W., et al. (2025). Calibration facilities and test results for gas network hydrogen and hydrogen enriched natural gas flow meters. Int. J. Hydrogen Energy 160:150431. doi: 10.1016/j.ijhydene.2025.150431
Dayhim, M., Jafari, M. A., and Mazurek, M. (2014). Planning sustainable hydrogen supply chain infrastructure with uncertain demand. Int. J. Hydrogen Energy 39, 6789–6801. doi: 10.1016/j.ijhydene.2014.02.132
European Hydrogen Observatory (2024). Hydrogen Refuelling Stations. European Hydrogen Observatory. https://observatory.clean-hydrogen.europa.eu/hydrogen-landscape/distribution-and-storage/hydrogen-refuelling-stations (Accessed January 17, 2025).
Fazli-Khalaf, M., Naderi, B., Mohammadi, M., and Pishvaee, M. S. (2020). Design of a sustainable and reliable hydrogen supply chain network under mixed uncertainties: a case study. Int. J. Hydrogen Energy 45, 34503–34531. doi: 10.1016/j.ijhydene.2020.05.276
Federal Ministry for Economic Affairs and Climate Action (2023). Berlin. Available online at: https://www.bmwk.de/Redaktion/EN/Publikationen/Energie/national-hydrogen-strategy-update.pdf?__blob=publicationFile&v=2 (Accessed December 3, 2025).
Feng, L., Manier, H., and Maniera, M-. A. (2024). Designing a centralized storage hydrogen supply chain network with multi-period and bi-objective optimization. Comput. Chem. Eng. 190:108820. doi: 10.1016/j.compchemeng.2024.108820
Fúnez Guerra, C., Reyes-Bozo, L., Vyhmeister, E., Jaén Caparrós, M., Salazar, J. L., Clemente-Jul, C., et al. (2020). Technical-economic analysis for a green ammonia production plant in Chile and its subsequent transport to Japan. Renew. Energy 157, 404–414. doi: 10.1016/j.renene.2020.05.041
Heuser, P-. M., Ryberg, D. S., Grube, T., Robinius, M., and Stolten, D. (2019). Techno-economic analysis of a potential energy trading link between Patagonia and Japan based on CO2 free hydrogen. Int. J. Hydrogen Energy 44, 12733–12747. doi: 10.1016/j.ijhydene.2018.12.156
IRENA (2020). Green Hydrogen A Guide to Policy Making. Available online at: https://www.irena.org/-/media/Files/IRENA/Agency/Publication/2020/Nov/IRENA_Green_hydrogen_policy_2020.pdf (Accessed June 02, 2025).
Kim, D., Woo, Y., Joo, C. M., and Kim, B. S. (eds)., (2015). “A genetic algorithm to design the hydrogen supply chain network with multi-transportation modes,” in Proceedings of the 28th Annual Conference of Biomedical Fuzzy System Association (BMFSA2015) 21–22. Nov (Kumamoto).
Lee, J.-S., Cherif, A., Yoon, H-. J., Seo, S-. K., Bae, J.-E., Shin, H.-J., et al. (2022). Large-scale overseas transportation of hydrogen: comparative techno-economic and environmental investigation. Renew. Sust. Energy Rev. 165:112556. doi: 10.1016/j.rser.2022.112556
Li, H., Cao, X., Liu, Y., Shao, Y., Nan, Z., Teng, L., et al. (2022). Safety of hydrogen storage and transportation: an overview on mechanisms, techniques, and challenges. Energy Rep. 8, 6258–6269. doi: 10.1016/j.egyr.2022.04.067
Markert, F., Nielsen, S. K., and Paulsen, J. L. Andersen, V., (2005). Safety Aspects of Land-Use Planning Scenarios for a Future Infra Structure with Hydrogen Refueling Stations. Available online at: https://h2tools.org/sites/default/files/2019-09/Safety%20Aspects%20of%20Land-Use%20Planning%20Scenarios%20for%20a%20Future%20Infra%20Structure%20with%20Hydrogen%20Re-Fueling%20Stations.pdf (Accessed December 31, 2024).
Mittelsteadt, C., Norman, T., Rich, M., and Willey, J. (2015). “PEM electrolyzers and PEM regenerative fuel cells industrial view,” in Electrochemical Energy Storage for Renewable Sources and Grid Balancing (Elsevier), 159–181. doi: 10.1016/B978-0-444-62616-5.00011-5
Muhsen, H., Allaham, A., Al-Mahmodi, M., Tarawneh, R., Alkhraibat, A., Al-Halhouli, A., et al. (2025). Fundamentals of Green Hydrogen Supply Chain and Power-to-X. Boca Raton, FL: CRC Press. doi: 10.1201/9781003639190
Niermann, M., Timmerberg, S., Drünert, S., and Kaltschmitt, M. (2021). Liquid Organic Hydrogen Carriers and alternatives for international transport of renewable hydrogen. Renew. Sust. Energy Rev. 135:110171. doi: 10.1016/j.rser.2020.110171
Ochoa Bique, A., Maia, L. K. K., Grossmann, I. E., and Zondervan, E. (2023). Design of hydrogen supply chains under demand uncertainty – a case study of passenger transport in Germany. Phys. Sci. Rev. 8, 741–762. doi: 10.1515/psr-2020-0052
Ochoa Bique, A., and Zondervan, E. (2018). An outlook towards hydrogen supply chain networks in 2050 — design of novel fuel infrastructures in Germany. Chem. Eng. Res. Design 134, 90–103. doi: 10.1016/j.cherd.2018.03.037
Ole, Meyer, P., and Dhahir, A.. (2023). German Petrol Station Data From 2014 - 2023 With Price Changes, Location. Available online at: https://www.kaggle.com/datasets/oles04/petrol-station-germany (Accessed January 18, 2025).
Pflugmann, F., and De-Blasio, N. (2020). The geopolitics of renewable hydrogen in low-carbon energy markets. Geopolit. Hist. Int. Relat. 12:7. doi: 10.22381/GHIR12120201
Qin, J., Xie, Y., Liu, J., Xu, Z., Meng, S., Zhu, J., et al. (2025). Research on leakage and diffusion of hydrogen-blended natural gas in a ship engine room. Int. J. Hydrogen Energy 160:150537.
Risco-Bravo, A., Varela, C., Bartels, J., and Zondervan, E. (2024). From green hydrogen to electricity: a review on recent advances, challenges, and opportunities on power-to-hydrogen-to-power systems. Renew. Sust. Energy Rev. 189:113930. doi: 10.1016/j.rser.2023.113930
Sapnken, F. E., Posso, F., Kibong, M. T., and Tamba, J. G. (2024). The potential of green hydrogen fuel as an alternative in Cameroon's road transport sector. Int. J. Hydrogen Energy 49, 433–449. doi: 10.1016/j.ijhydene.2023.08.339
Stockl, F., Schill, W-. P., and Zerrahn, A. (2020). Optimal supply chains and power sector benefits of green hydrogen. Sci. Rep. 11:3193. doi: 10.1038/s41598-021-92511-6
Tapan, N. A., and Günay, M. E. (2025). Multi-objective optimization of PEM electrolyzers using deep neural networks and gradient boost regressor-particle swarm optimization framework. Int. J. Hydrogen Energy 160:150622. doi: 10.1016/j.ijhydene.2025.150622
Welzheimerwald. (2025). Relation: Germany (51477). Available online at: https://www.openstreetmap.org/relation/51477 (Accessed November 13, 2025).
Xu, J., Li, Q., and Zheng, L. (2025). A robust model for hydrogen supply chain network design in china under renewable energy uncertainty. J. Comput. Inform. Sci. Eng. 25:4067214. doi: 10.1115/1.4067214
Keywords: green hydrogen, sustainable urban infrastructure, hydrogen supply network, spatial optimization, sustainable transportation, urban decarbonization, diffusion of innovation
Citation: Alzubi E, Almomani B and Albashir A (2025) Spatial optimization of green hydrogen infrastructure for sustainable urban mobility: a grid-based framework for Germany. Front. Sustain. Cities 7:1712578. doi: 10.3389/frsc.2025.1712578
Received: 24 September 2025; Revised: 14 November 2025;
Accepted: 20 November 2025; Published: 12 December 2025.
Edited by:
Sameh Al-Shihabi, University of Sharjah, United Arab EmiratesReviewed by:
Mohammed Obeidat, American University of the Middle East, KuwaitNibal Albashabsheh, The University of Jordan, Amman, Jordan
Copyright © 2025 Alzubi, Almomani and Albashir. This is an open-access article distributed under the terms of the Creative Commons Attribution License (CC BY). The use, distribution or reproduction in other forums is permitted, provided the original author(s) and the copyright owner(s) are credited and that the original publication in this journal is cited, in accordance with accepted academic practice. No use, distribution or reproduction is permitted which does not comply with these terms.
*Correspondence: Emad Alzubi, ZW1hZC5hbHp1YmlAdW5pLWR1ZS5kZQ==
†ORCID: Emad Alzubi orcid.org/0000-0003-1264-0518