 Cheikh Talla1*
 Maryam Diarra1
 Ibrahima Diouf2,3
 Mareme S. Thiam1
 Aboubacry Gaye1Mamadou A. Barry1
 Ehimario Igumbor4,5Corinne Simone Merle6Rosemary Audu4Cheikh Loucoubar1
- 1Institut Pasteur de Dakar, Epidemiology, Clinical Research and Data Science Department, Dakar, Senegal
- 2Faculty of Science and Technology, University of Labé, Labé, Guinea
- 3Laboratory of Physics of Atmosphere and Ocean - Siméon Fongang (LPAO-SF) at the Polytechnic Higher School, University Cheikh Anta Diop, Dakar, Senegal
- 4Microbiology Department, Nigerian Institute of Medical Research, Lagos, Nigeria
- 5School of Health Systems and Public Health, University of Pretoria, Pretoria, South Africa
- 6Special Programme of Research and Training in Tropical Diseases (TDR), World Health Organization, Geneva, Switzerland
Introduction: Malaria remains a major public health concern, particularly in sub-Saharan Africa, where climatic factors strongly influence its transmission dynamics. However, the delayed effects of these factors on malaria incidence remain poorly understood.
Methods: This study examines the relationship between meteorological variables (temperature, rainfall, and humidity) and malaria incidence in Senegal from 2015 to 2022, using a distributed lag non-linear model (DLNM). Daily malaria case data were obtained from the Senegal syndromic sentinel surveillance network (4S network), while daily climatic data were sourced from the Senegalese meteorology agency and NASA POWER DATA Access.
Results: The results reveal significant associations between climatic factors and malaria cases. High maximum temperatures were associated with increased malaria risk at lag periods of 2–6 days, whereas extreme rainfall initially reduced mosquito breeding but contributed to increased malaria cases after 10–15 days. Similarly, relative humidity displayed non-linear, time-dependent effects on malaria incidence, underscoring the importance of considering lag effects in climate-health modelling.
Discussion: These findings highlight the necessity of integrating climate variability into malaria control strategies. Adaptive interventions, such as predictive modelling and early warning systems, could enhance response efficiency by enabling proactive vector control and healthcare resource allocation. Future research should explore additional factors, such as socio-economic and behavioural influences, to refine prediction models and optimise malaria prevention efforts in the context of climate change.
Introduction
Malaria remains a significant public health threat, particularly in sub-Saharan Africa, where climate conditions influence its transmission dynamics (1). In 2022, malaria cases in endemic countries were estimated at 249 million, an increase of five million from 2021, with 608,000 associated deaths. The African region accounted for 93.6% of global malaria cases and 95.4% of malaria-related deaths (2).
In Senegal, malaria remains a major health burden, with an estimated 831,000 cases and 2,128 deaths reported in 2022 (3). The association between climatic factors and infectious diseases, particularly vector-borne diseases such as malaria, has been widely investigated (4). Transmission and distribution of malaria are substantially influenced by climate factors, including temperature, rainfall, and humidity (5–7). Mosquito vector abundance and life cycle dynamics are highly sensitive to climatic variations, particularly temperature, humidity, and rainfall patterns, which influence breeding conditions and parasite development rates (6, 8). Malaria outbreaks in East Africa have been associated with increases in mean monthly maximum temperatures and rainfall (9).
The distributed lag non-linear model (DLNM) addresses some limitations encountered by the generalised linear model to capture complex, time-varying relationships, including lagged climate factors on disease dynamics. DLNM offers a robust alternative and identifies the most important lag time period (10). Thus, many studies have investigated the monthly relationship between climate variables and malaria incidence, but few have examined their daily lag time impact (11, 12). Understanding the link between these daily climate variables and malaria incidence can provide useful information to guide public health decision-making and interventions.
Developing effective malaria control and prevention strategies requires a comprehensive understanding of the interactions between climatic factors, vector ecology, and human behaviour. A multidisciplinary approach incorporating climate science, epidemiology, public health, and socio-economic factors is crucial for designing targeted, sustainable interventions.
Methods
Data collection
The Senegalese Ministry of Health and the Dakar Pasteur Institute (IPD) have established an integrated sentinel surveillance system (4S) for syndromic monitoring, enhancing early outbreak detection and improving public health response capabilities. This system, called “4S”, not only tracks malaria but also monitors other emerging diseases such as suspected arbovirus, influenza-like illness and diarrhoea based on WHO case definitions (13). All 25 health centres involved in the surveillance provide daily aggregate data, including the total number of consultations, febrile cases, malaria-positive cases identified by the rapid diagnostic test tool (RDT), and suspected arbovirus cases. In this study, the daily new malaria cases from all sentinel sites from 2015 to 2022 have been used, reflecting the patterns observed at the national level. Climate data were obtained from the Senegalese National Civil Aviation and Meteorology Agency’s weather station located closest to the sentinel site. For points where weather stations were missing, data was collected from the NASA website on a daily basis with a resolution of 0.5 x 0.625 degrees of latitude and longitude. Climate data, including maximum and minimum temperatures and rainfall, were collected from weather stations. Data on relative humidity were obtained from the NASA POWER DATA Access site using satellite-estimated data (14). All climatic data and malaria cases were recorded on a daily basis during the same time period.
Statistical analysis
Initially, a Pearson correlation analysis was performed to assess the relationship between meteorological variables and malaria cases, addressing collinearity to ensure robust statistical analysis. This step was crucial to identify potential multicollinearity issues, which can lead to misleading interpretations of regression coefficients and compromise the reliability of the model (15). By assessing the strength and direction of associations between climate variables such as temperature, rainfall, and humidity, the analysis helped determine whether certain predictors needed to be excluded or transformed to reduce redundancy. Additionally, correlation analysis provided insights into the immediate versus lagged impacts of meteorological factors on malaria incidence, guiding the selection of variables for subsequent modelling. Variance inflation factor (VIF) was used to measure the multicollinearity among variables in a generalised linear model. The association between malaria incidences and meteorological variables was analysed using a distributed lag non-linear model (DLNM). This model was developed to study lagged effects and non-linear exposure-response relationships (16). We examined the effects of climate variables on daily malaria cases with varying lag days using a DLNM and considering all explanatory variables in the quasi-Poisson generalised linear regression as a link function. Data overdispersion was addressed using quasi-Poisson generalised linear regression as a link function (16).
The DLNM model was described as follows:
Where (E[Yt]) is the expected number of malaria cases on day t; Log is the natural log function, Alpha represents the model intercept, NS represents the natural spline function; RHt is the daily relative humidity on day t; TempMax and TempMin represent the daily maximum and minimum temperature; Time is the long-term temporal trend, and df is the degree of freedom. The df for each covariate was determined using sensitivity analysis, and the df for the best model was chosen by minimising the Quasi-Akaike information criterion (QAIC) (16). We used cross-basis functions for all covariates. All covariates are lagged with a maximum lag period of 15 days based on a previous study showing correlation with malaria incidence with a lag of two weeks (17). Contour plots that depend on lag times and values of meteorological variables were used to visualise the effects. All statistical analyses were performed by using R software (version 4.4.2) (18), and the “dlnm” package was used to fit the distributed lag nonlinear model.
Results
Descriptive analysis
Table 1 provides a summary of the climatic variables and malaria cases used in the model. During the study period, a total of 30,203 malaria cases were recorded, with a daily average incidence of 10 cases. Over 91% (27597) of malaria cases were reported during the rainy season. Figure 1 shows the spatial distribution of sentinel sites and the proportion of positive malaria cases among individuals tested between 2015 and 2022. Malaria exhibits strong seasonality in Senegal, with the highest number of cases reported during the rainy season, which typically extends from July to October (Figure 2). The transmission peak occurs in October with 131 cases, coinciding with the post-rainfall period when vector breeding conditions are most favourable. A declining trend in malaria incidence was observed over the study period, with the highest number of cases recorded in 2015 (6162 cases) and the lowest in 2020 (2502 cases) (Figure 2).
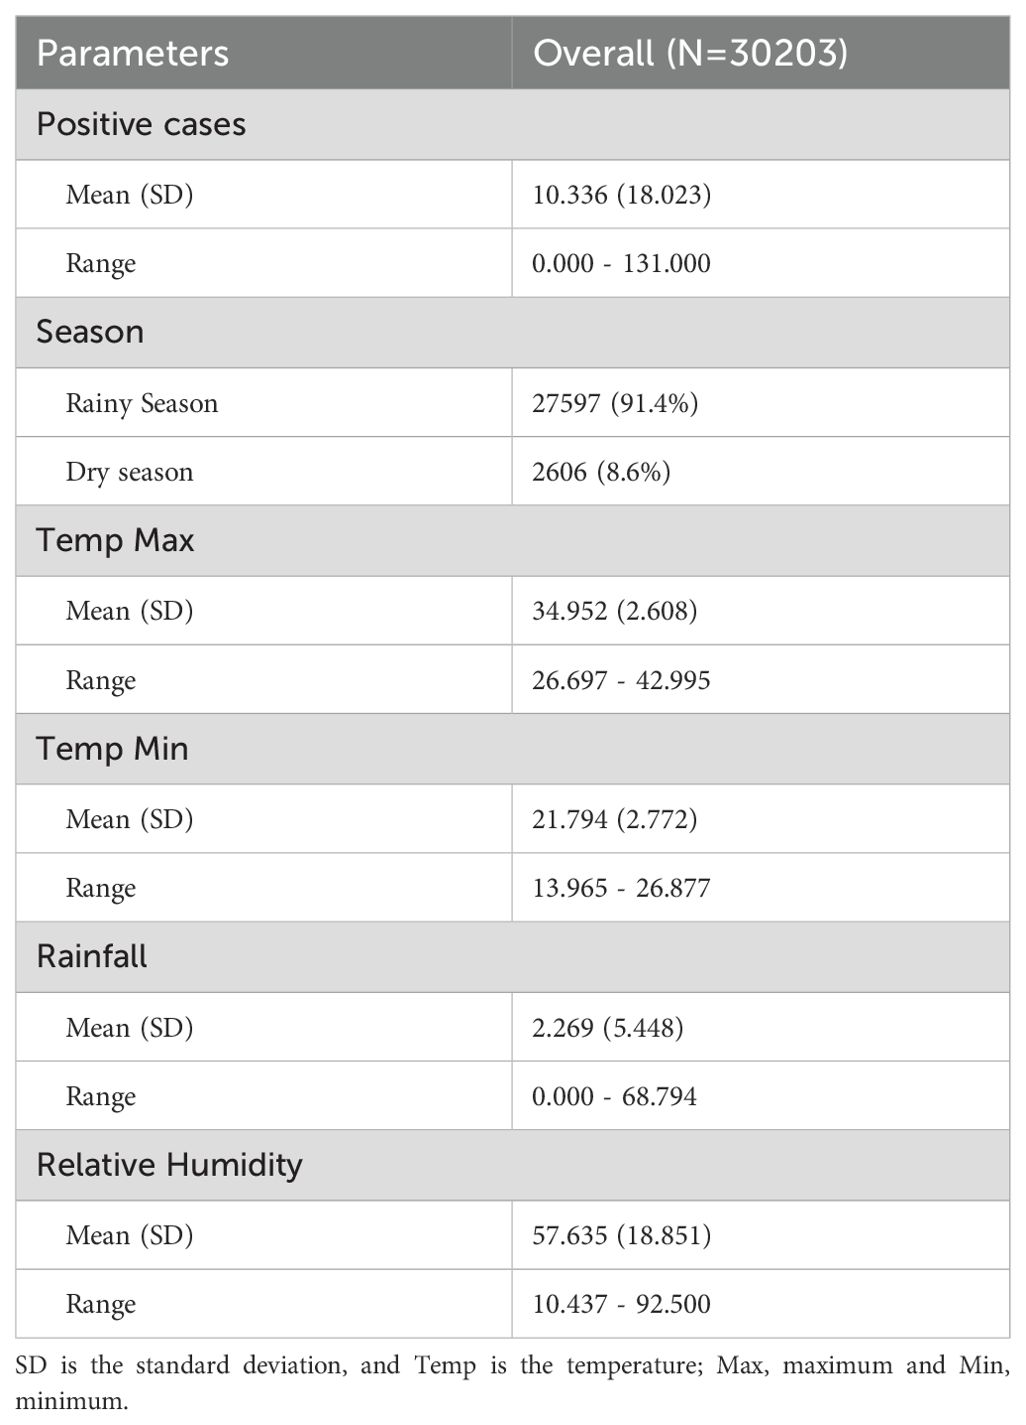
Table 1. Describe meteorological parameters used in this study and malaria cases recorded.
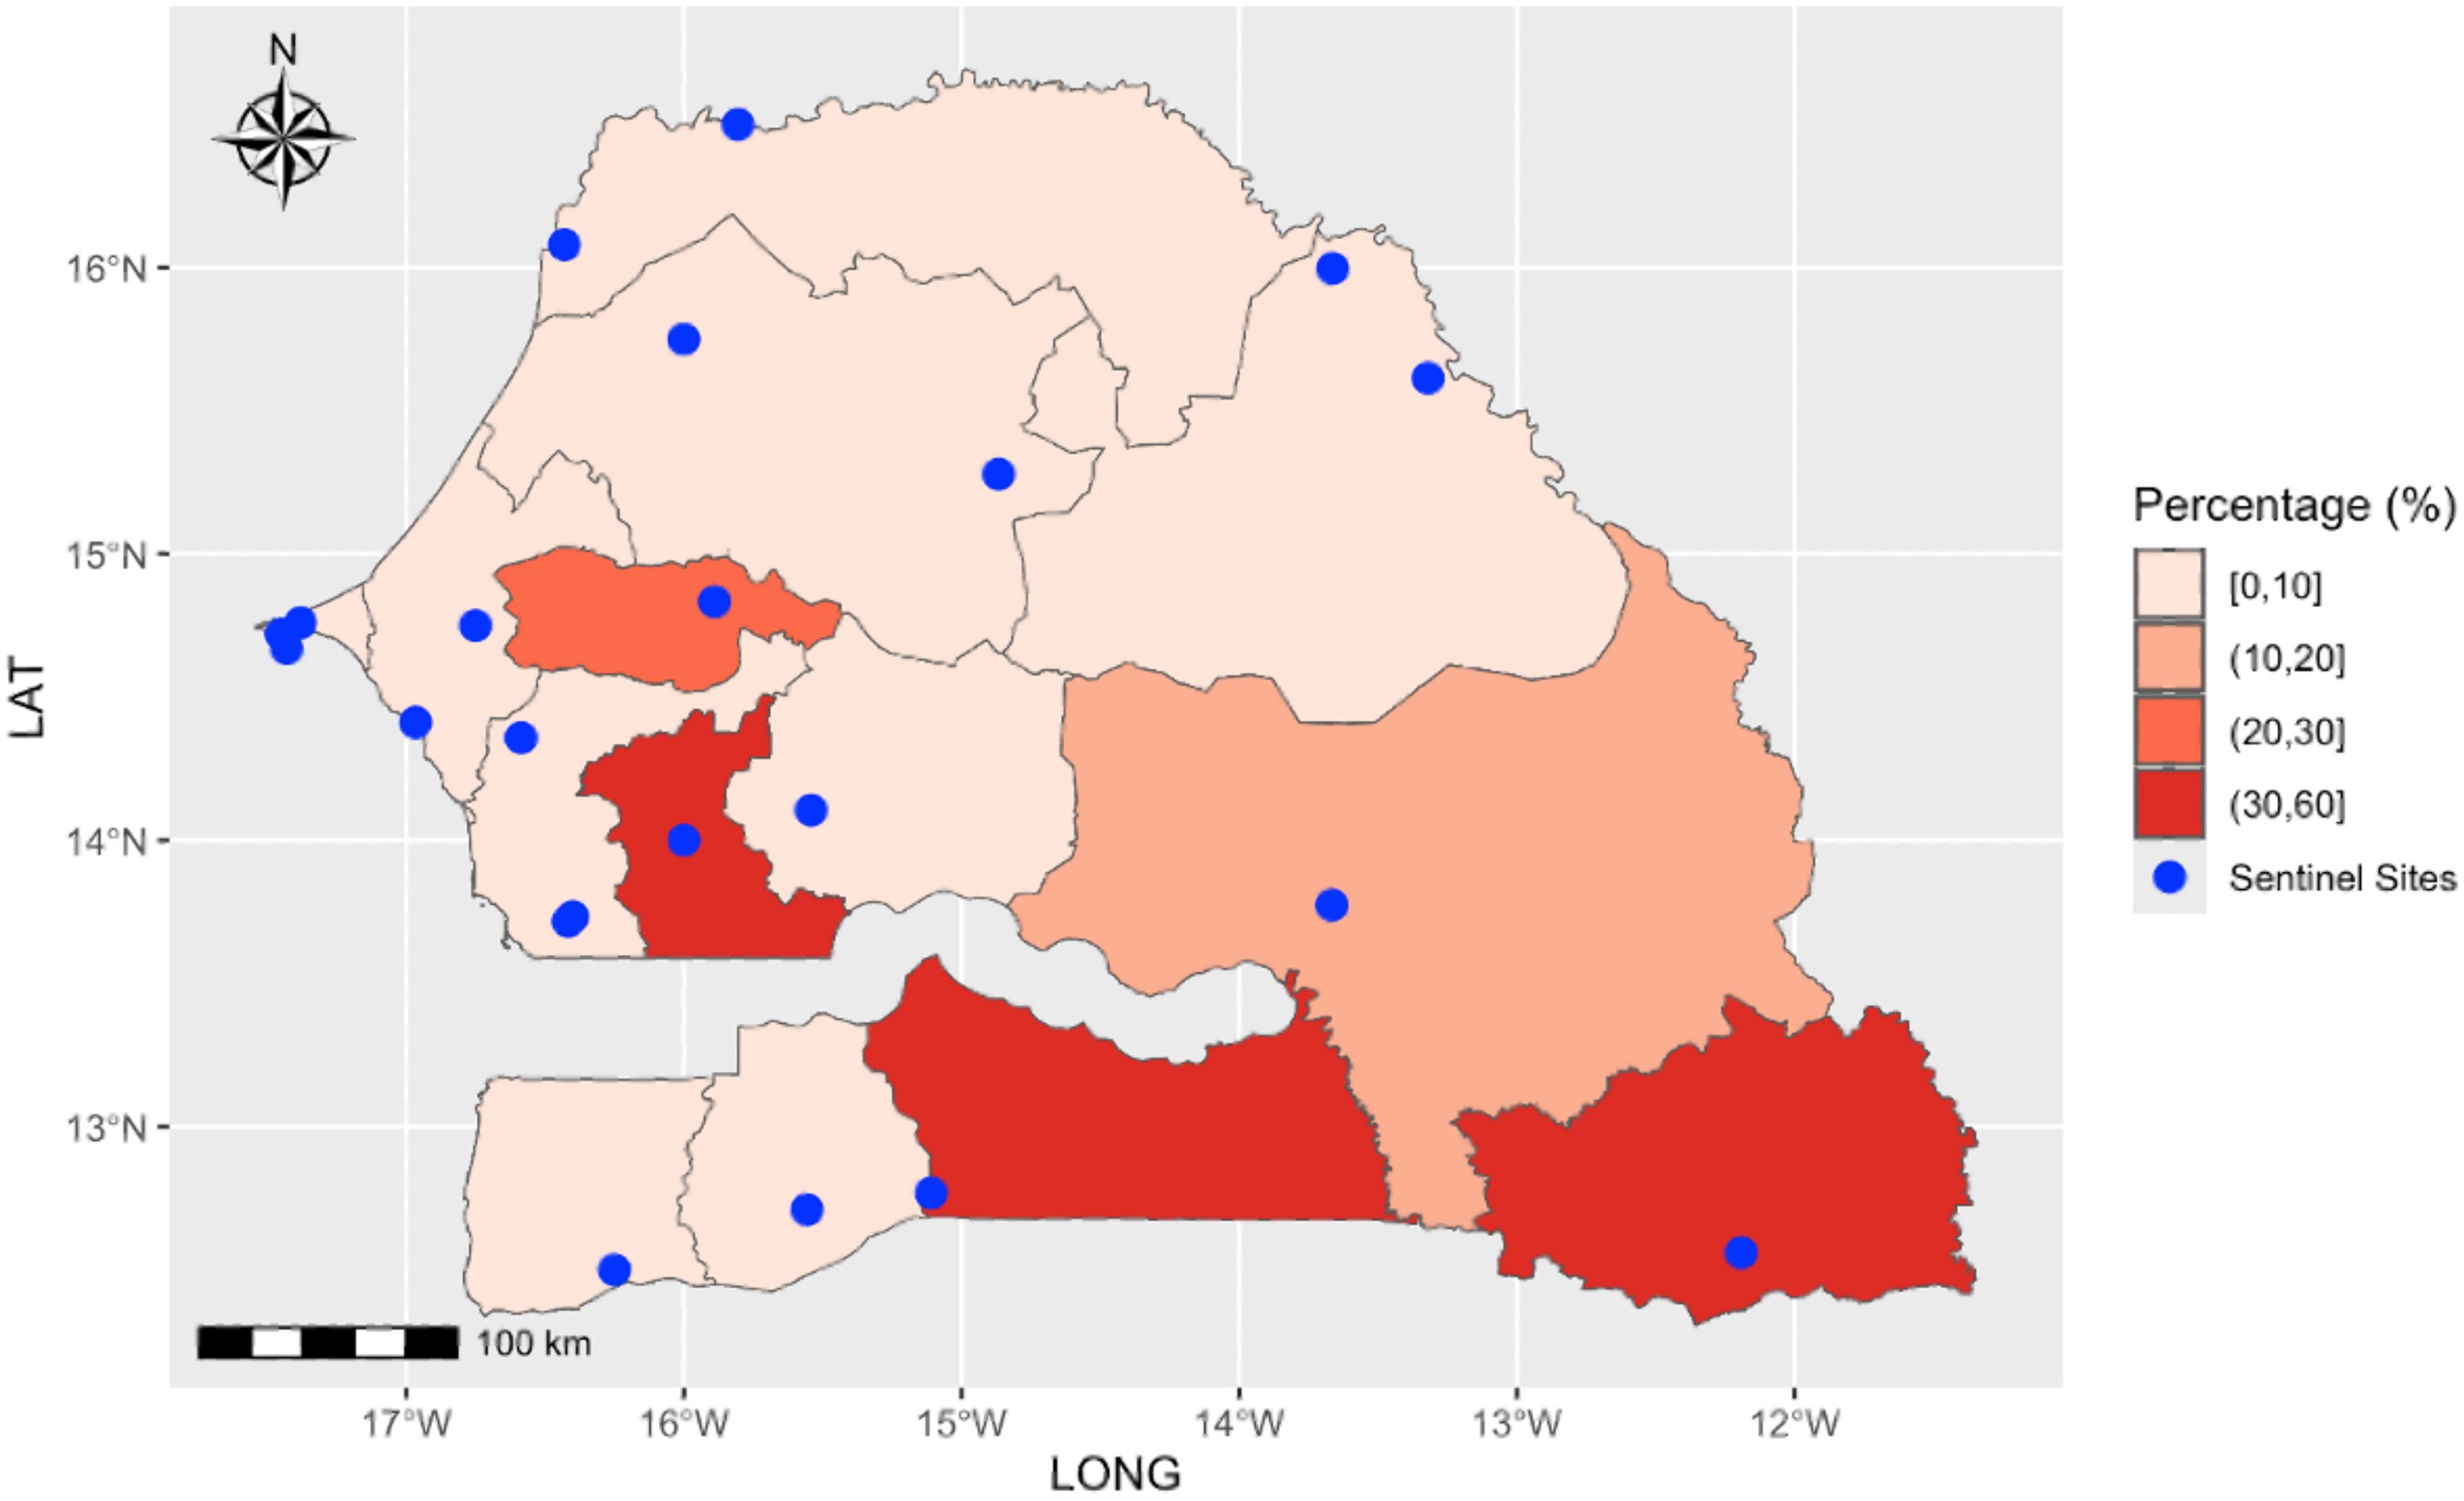
Figure 1. The spatial distribution of sentinel sites (blue points) and the proportion of positive malaria cases among individuals tested between 2015 and 2022.
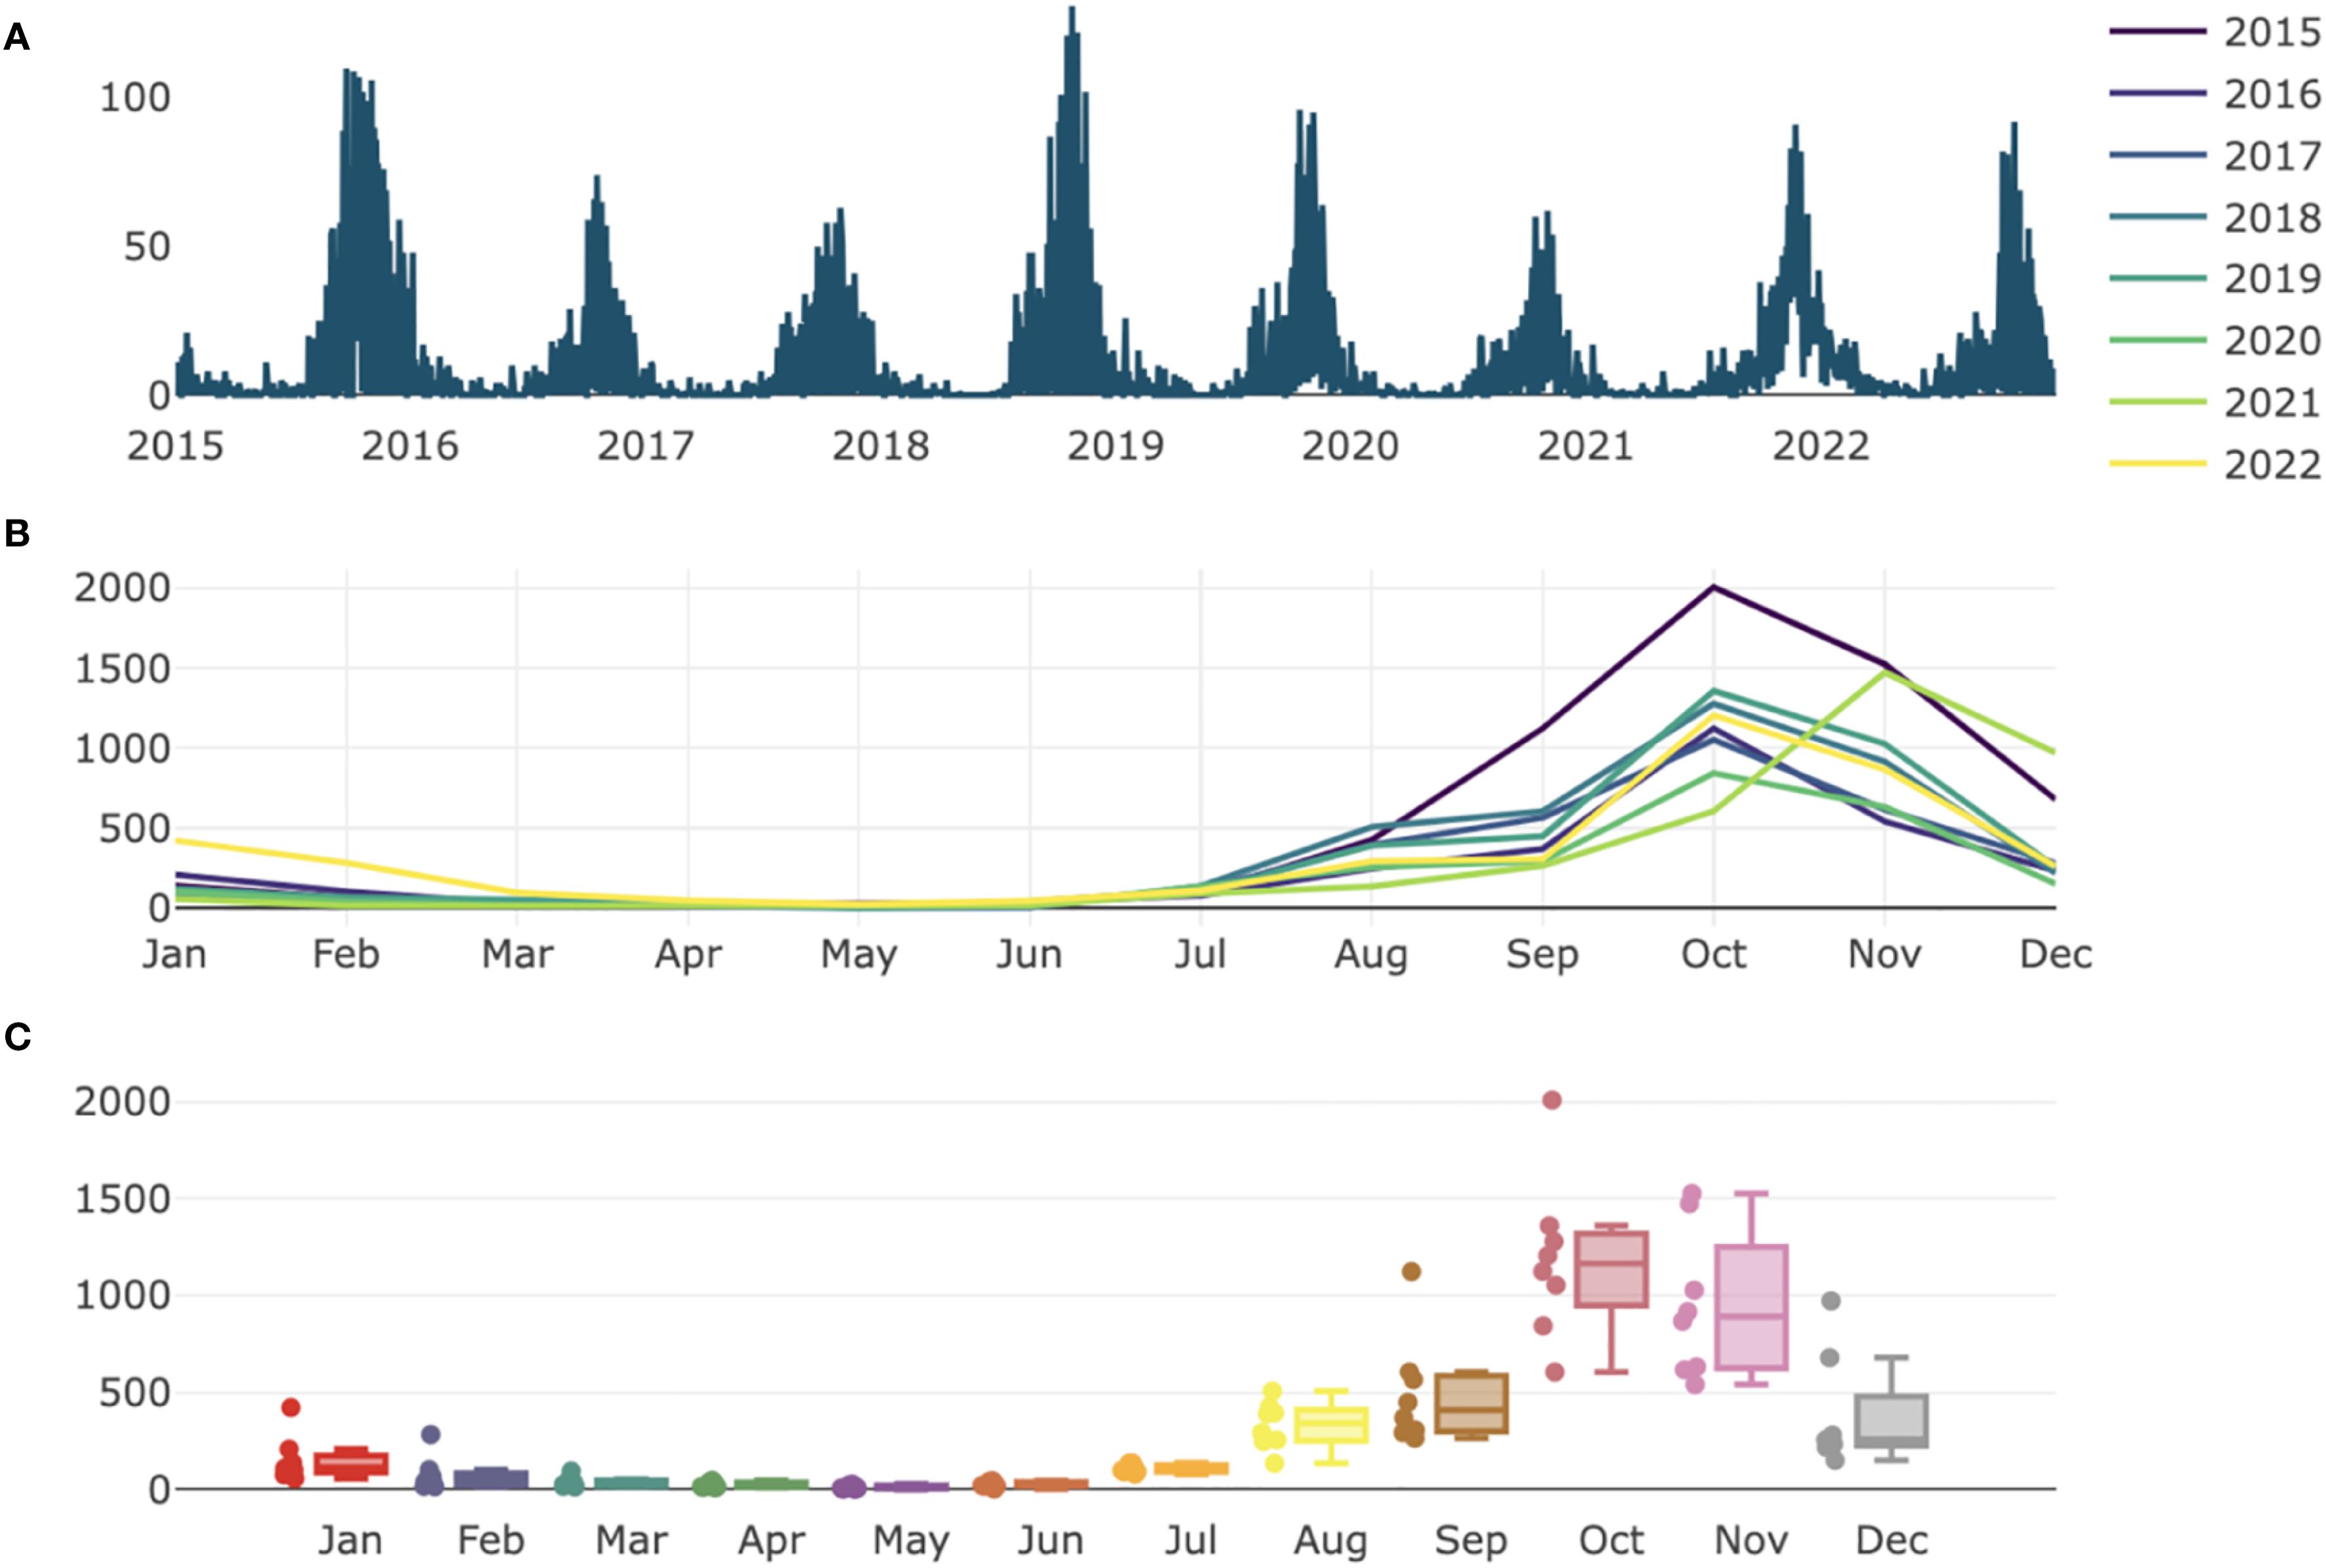
Figure 2. Daily distribution of malaria cases incidence (A) and monthly pattern in Senegal from 2015 to 2022 (B, C).
Maximum temperatures peaked between February and May, corresponding to the dry season, while minimum temperatures reached their highest values between May and November, aligning with the transition from the rainy season to the cooler months. The lowest minimum temperatures were recorded between January and April (Supplementary Figure S1). The Pearson correlation analysis indicated that minimum temperature (r = 0.10), rainfall (r = 0.04), and relative humidity (r = 0.31) were positively associated with malaria incidence, while maximum temperature exhibited a weak negative correlation (r = -0.10) (Table 2). Notably, the highest correlation was found between malaria cases and relative humidity, indicating an important role in the disease transmission. VIF results indicated no multicollinearity issues (Supplementary Figure S2).
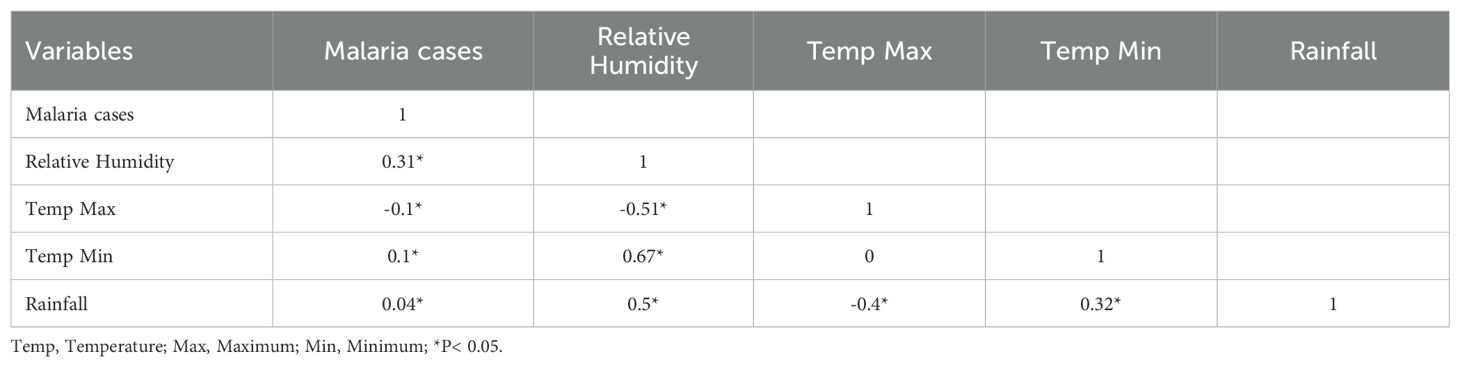
Table 2. Pearson correlation coefficients between meteorological factors and daily malaria cases.
DLNM analysis
The effects of meteorological variables on malaria cases were illustrated by Figure 3. This figure illustrates non-linear relationships, showing how different climatic variables influence malaria transmission over varying lag periods. The optimal model was selected based on the Quasi-Akaike Information Criterion (Q-AIC), which identified the best fit with four degrees of freedom for maximum temperature, rainfall, and relative humidity, and three degrees of freedom for minimum temperature.
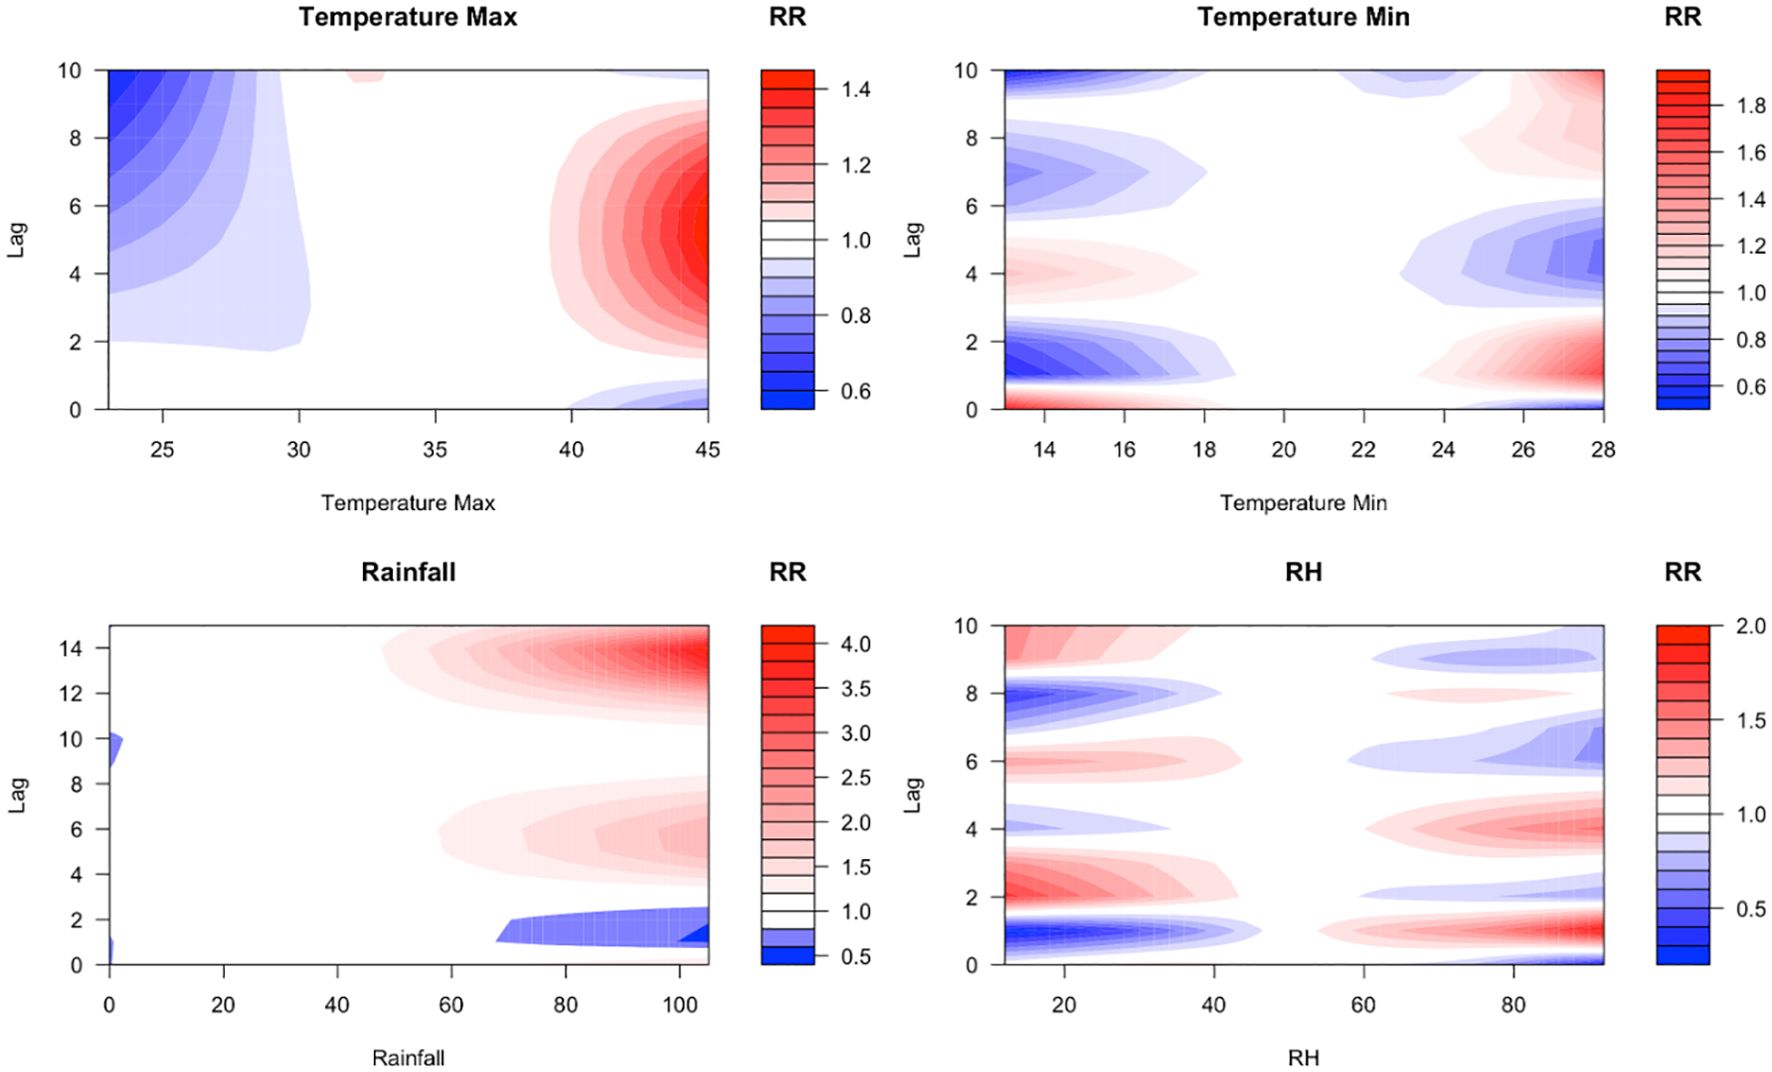
Figure 3. Contour plots illustrating the lagged effects of maximum temperature, minimum temperature, relative humidity, and rainfall on malaria incidence. The plots visualise non-linear relationships, showing how different climatic variables influence malaria transmission over varying lag periods. The colour represents the magnitude and direction of the correlation between climate factors and malaria cases at varying exposure levels and time lags. Red colour indicates a positive association (high risk), blue colour indicates a negative association, and white colour indicates no effect.
For maximum temperature, a significant effect was observed at a lag of two days for extremely high values (>38°C), persisting for up to six days. At extreme temperatures (40°C), the relative risk (RR) for malaria incidence was 1.03 (95% CI 0.94–1.23), indicating a slight but non-significant increase in risk. However, at lag 0, high temperatures had a suppressive effect on mosquito populations, likely due to thermal stress reducing vector survival and activity (19, 20). The estimated RR at lag 0 was 0.94 (95% CI 0.78–1.14), suggesting no direct relationship between high temperature and malaria incidence.
A strong direct effect of minimum temperature was observed at lag 0, with an increasing relative risk over subsequent day. Depending on the time lag, low and high minimum temperatures have varying impacts, with their effects lasting no more than four days. At lag one, minimum temperatures between 13°C and 18°C were associated with a reduction in malaria risk. In contrast, higher minimum temperatures increased malaria risk for the same lag time.
A similar pattern was observed for relative humidity, where high levels at lag one increased malaria risk, while low levels had a suppressive effect. The influence of relative humidity on malaria transmission was short-lived, persisting for a maximum of two days.
At lag one and lag two, heavy rainfall initially reduced malaria relative risk. However, from lag three to lag eight and from lag 10 to lag 15, the relative risk increased. Rainfall amounts between 60 mm and 100 mm were identified as the critical range influencing malaria incidence.
Figure 4 illustrates the climate variable-specific effects at different lag times. The effects of maximum temperature on malaria risk followed a similar pattern at lags of two, five, and seven days, indicating recurring short-term influences on transmission dynamics. For minimum temperature and relative humidity, trends varied across lag periods, with a central minimum temperature of 20°C playing a key role in determining malaria risk. Malaria incidence increased with rainfall from lag time five onwards, emphasising the delayed impact of rainfall on vector proliferation (Figure 4).
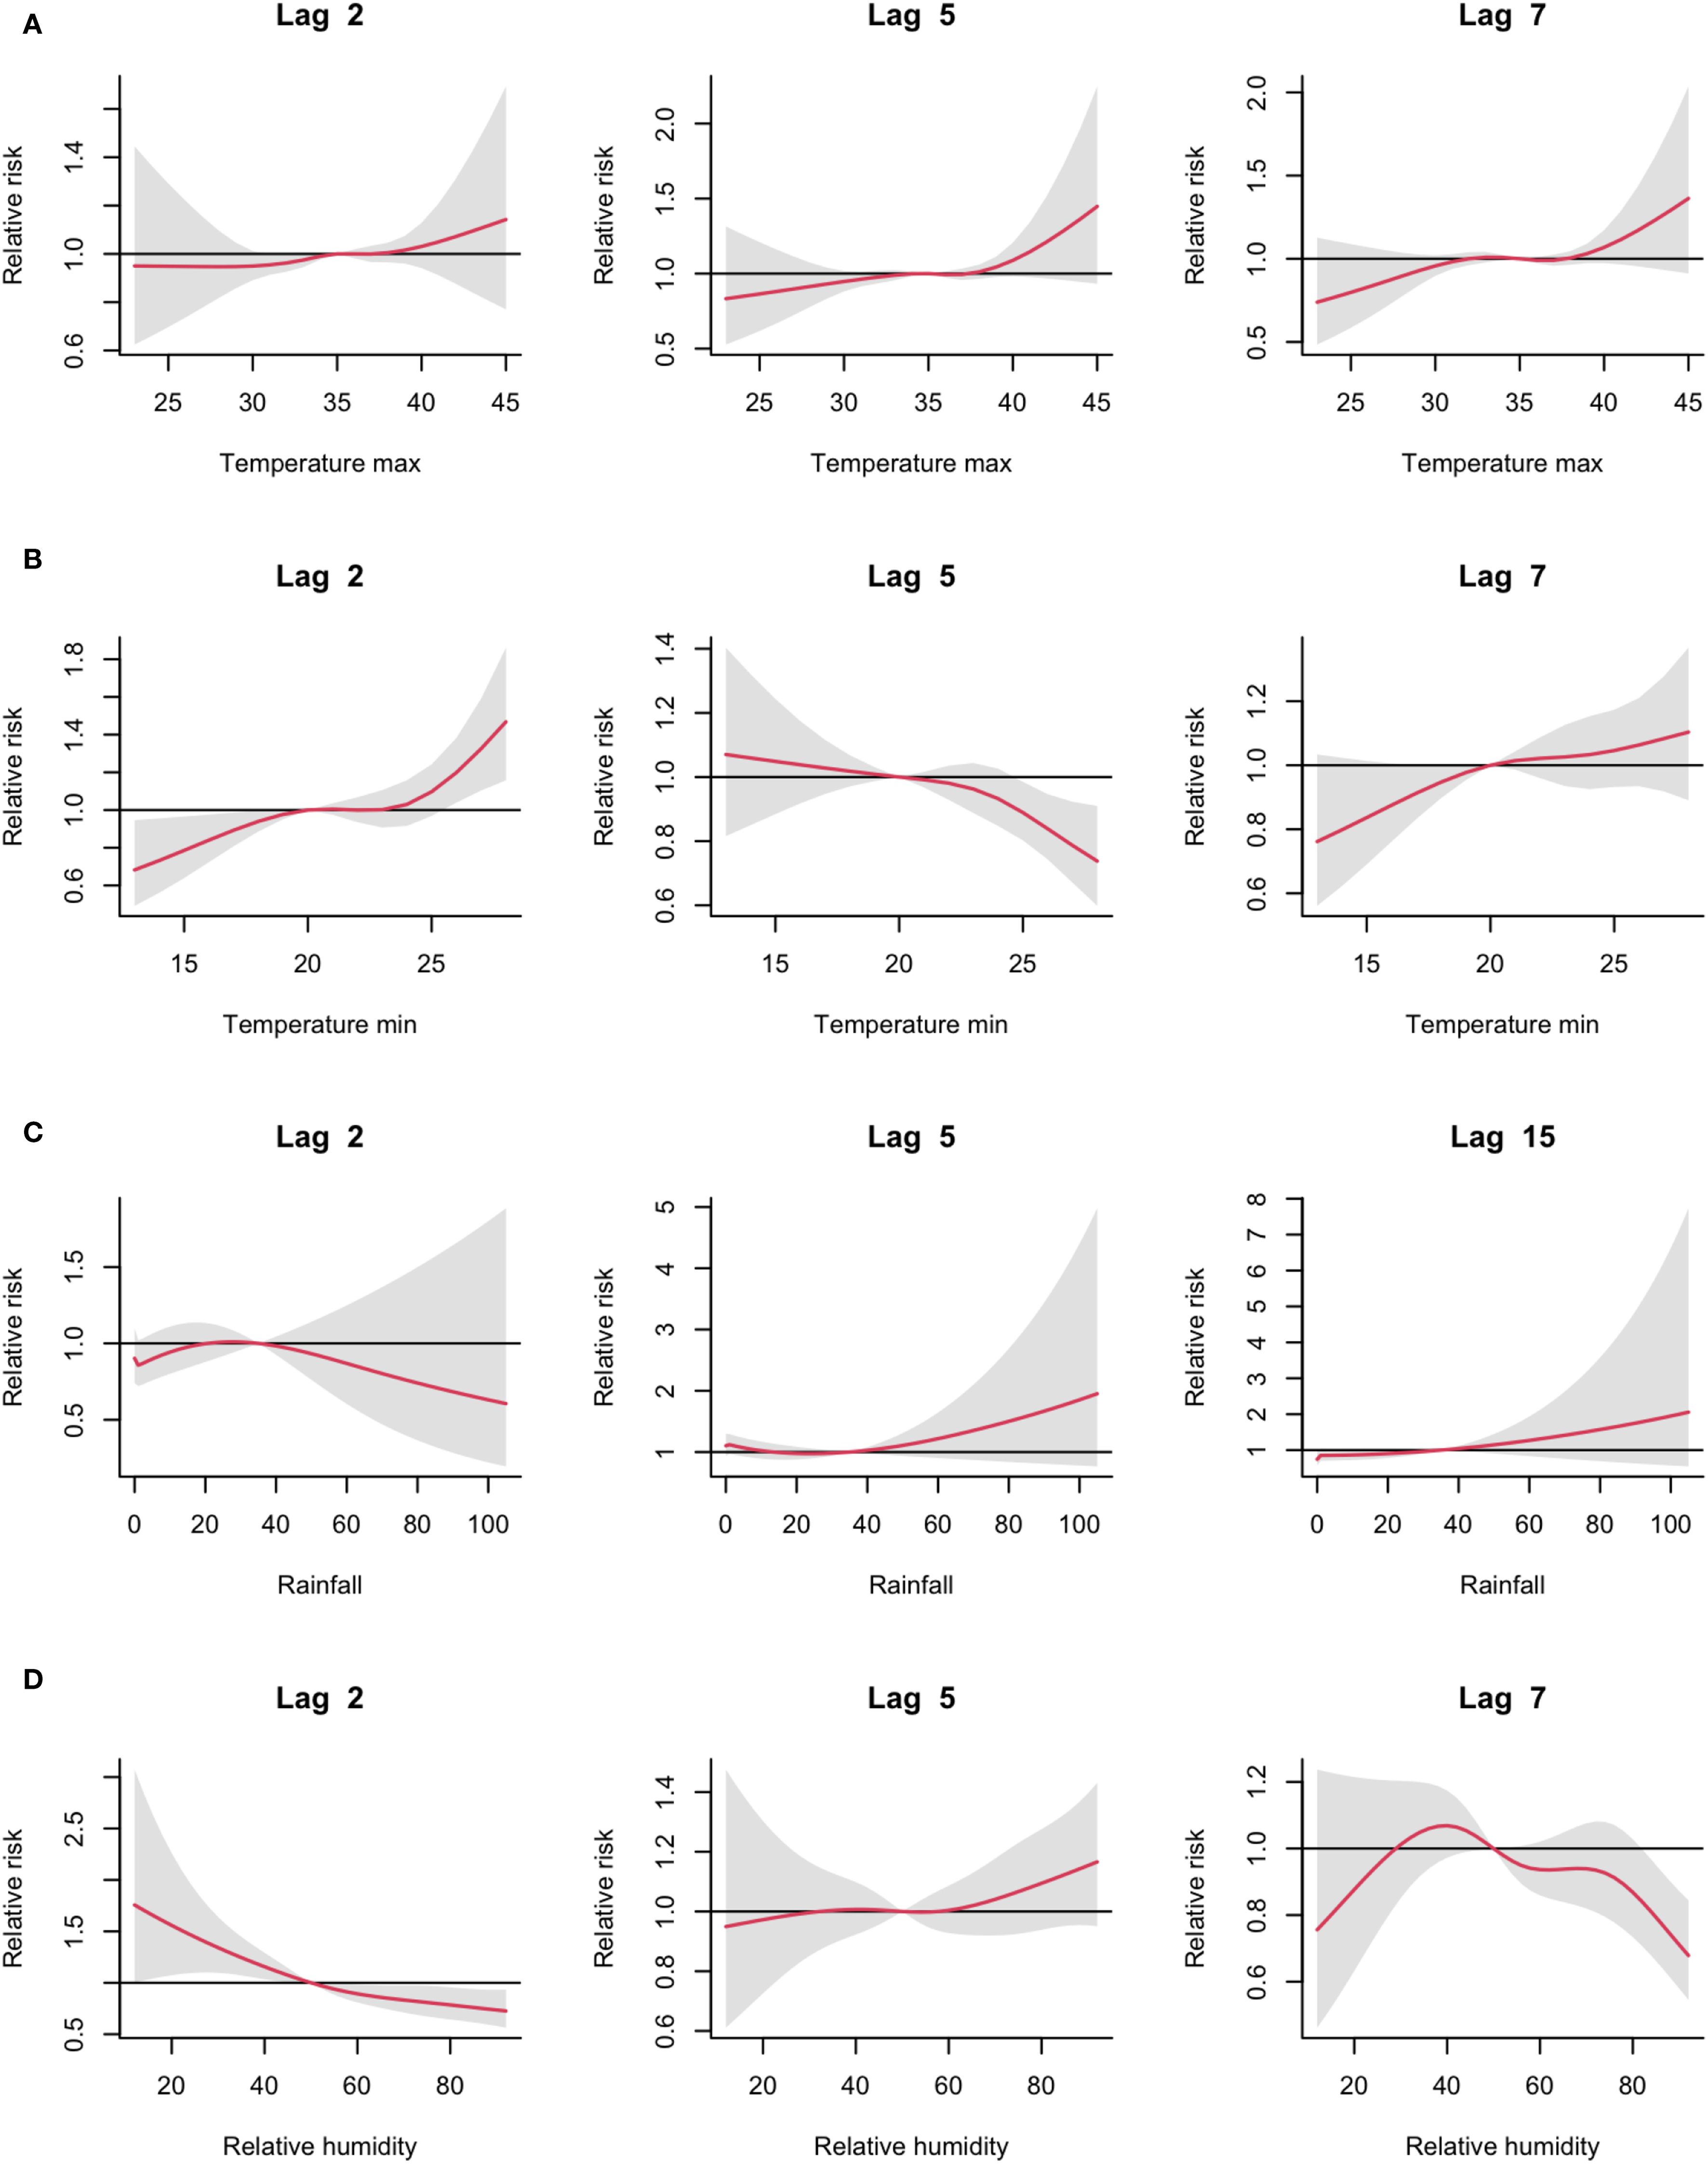
Figure 4. Estimated effects of climate variables on malaria cases at various specific lag times. (A) for maximum temperature, (B) for minimum temperature, (C) for rainfall and (D) for relative humidity. Red lines represent relative risks, and grey regions indicate 95% confidence intervals.
Discussion
In this study, we used DNLM models to examine how daily variations in humidity, temperature, and rainfall along with their lag effects impact malaria transmission. Our results indicate a significant association between climatic factors and malaria incidence.
High maximum temperatures (>38°C) were associated with an increase in malaria incidence starting at lag two, with the effect persisting for up to eight days. This suggests that elevated temperatures may accelerate mosquito development and parasite maturation, enhancing transmission risk over short-term lags. A negative correlation was observed between low temperatures and malaria incidence, with reductions in cases becoming evident from lag two onward. This decline likely reflects unfavourable conditions for mosquito survival and parasite development at lower temperatures. Previous studies have shown that Anopheles mosquitoes reach maturity more quickly and exhibit increased blood-feeding behaviour in response to rising temperatures (21). The optimal temperature range for vector-borne disease transmission is typically between 14°C–18°C and 35°C–40°C (11), corroborating the findings of this study. Specific studies have shown that temperature fluctuations can significantly affect the development of the Plasmodium parasite and the activity of Anopheles vector mosquitoes (22). Furthermore, the observed impacts between the maximum temperature, minimum temperature and malaria cases are confirmed by specific studies that have demonstrated that temperature fluctuations can significantly affect the development of the Plasmodium parasite and the activity of Anopheles vector mosquitoes (22). According to a study in South Africa and Botswana, temperature between 20–33°C may increase malaria transmission (23, 24). However, other research indicates that malaria transmission decreases at temperatures exceeding 25°C, with an optimal range of 25°C (25). This discrepancy may arise due to regional variations in mosquito species, parasite adaptation, or environmental conditions that modulate vector survival and transmission efficiency.
Rainfall plays a complex role in malaria transmission by influencing mosquito breeding site availability. Moderate rainfall enhances mosquito breeding by creating suitable water bodies for larval development, thereby increasing malaria transmission risk. However, heavy rainfall can disrupt breeding sites by flushing away larvae, while prolonged dry conditions may limit mosquito populations due to the absence of standing water (26).
Our findings indicate that malaria incidence decreases immediately following heavy rainfall (lag 0), likely due to the flushing of mosquito larvae and temporary habitat destruction (27, 28). Conversely, other studies have demonstrated a positive correlation between rainfall and malaria incidence, with a rainfall threshold between 70mm and 600mm required to trigger outbreaks, particularly in arid regions (28, 29). In Senegal, malaria transmission exhibits strong seasonality, reaching a peak of incidence during the rainy season. The northern regions, characterised by lower rainfall and ongoing elimination efforts, report fewer malaria cases. In contrast, humid regions with higher rainfall levels experience more intense transmission, highlighting the role of local climatic conditions in shaping malaria dynamics.
Humidity has a key role in malaria transmission, varying according to lag time. Low humidity values (<50%) at lags 0–2 were associated with a reduction in malaria incidence, while positive effects were observed at lags 2–3, followed by negative effects at lags 4–5. Similarly, when relative humidity exceeded 50%, an immediate increase in malaria incidence was observed at lag one. This variability suggests that humidity played a complex and short-lived role in malaria transmission. Research indicates that mosquito adaptation is strongly influenced by humidity and temperature, with high humidity promoting vector survival and feeding behaviour (30). Therefore, malaria prevention strategies must incorporate humidity-related factors to better predict transmission patterns and improve vector control efforts. Actions can be taken to anticipate epidemics, optimise the allocation of resources for vector control, and prepare for a possible future increase in the number of cases. The approach allows timely actions before a climate-driven malaria case increases, improving prevention and treatment.
Limitations
The transmission dynamics of vector-borne diseases are inherently complex, influenced by a combination of climatic, biological, socio-economic, and behavioural factors. Although distributed non-linear models effectively capture the lagged effects of climatic variables, they have inherent limitations in fully accounting for the multifaceted nature of malaria transmission.
While climate variables play a critical role in malaria transmission, they alone are insufficient to fully explain fluctuations in case numbers. Other key determinants such as human mobility, socio-cultural practices, economic disparities, and public health interventions also significantly influence disease dynamics. Human movement patterns, socio-economic conditions, healthcare accessibility, and the effectiveness of malaria control measures all play crucial roles in shaping transmission trends (31). Ignoring these factors may limit the accuracy of model-based predictions.
Despite these constraints, distributed nonlinear models remain valuable tools for quantifying the impact of climatic factors and assessing the time-lagged effects of environmental variables on malaria incidence. However, to enhance predictive accuracy, a multidisciplinary approach integrating climate data with epidemiological surveillance, socio-economic indicators, and vector control strategies is needed. Such an approach would contribute to the development of more robust and reliable early warning systems for vector-borne diseases, ultimately strengthening malaria control efforts in a changing climate.
Conclusions
Considering lag-time effects in distributed non-linear models enhances malaria forecasting accuracy, supports targeted intervention strategies, and helps mitigate the public health burden of malaria in a changing climate. By capturing the delayed effects of climatic variables on malaria transmission, these models facilitate more accurate risk assessments and enable the development of early warning systems, improving outbreak preparedness and response. Understanding how temperature, rainfall, and humidity interact with malaria transmission dynamics over time allows health authorities to anticipate outbreak patterns and allocate resources more efficiently. The development of hybrid models that incorporate climate projections, real-time disease surveillance, and remote sensing technologies could further enhance early warning capabilities. Additionally, interdisciplinary collaboration among climate scientists, epidemiologists, public health practitioners, and policymakers will be crucial to translating model-derived insights into effective, evidence-based malaria control strategies. Strengthening regional climate-health monitoring networks and investing in capacity-building initiatives will also be critical to ensure that malaria forecasting tools are effectively utilised in endemic regions. Ultimately, a comprehensive, data-driven approach that integrates both climatic and non-climatic factors will be essential for developing more resilient malaria control strategies under changing environmental conditions.
Data availability statement
The raw data supporting the conclusions of this article will be made available by the authors, without undue reservation.
Ethics statement
Ethical approval was not required for the study involving humans in accordance with the local legislation and institutional requirements. Written informed consent to participate in this study was not required from the participants or the participants’ legal guardians/next of kin in accordance with the national legislation and the institutional requirements.
Author contributions
CT: Conceptualization, Formal Analysis, Writing – original draft, Writing – review & editing, Funding acquisition, Data curation, Investigation, Methodology, Project administration, Resources, Software, Supervision, Validation, Visualization. MD: Formal Analysis, Writing – review & editing, Conceptualization, Data curation, Funding acquisition, Investigation, Methodology, Project administration, Resources, Software, Supervision, Validation, Visualization. ID: Writing – review & editing. MT: Data curation, Writing – review & editing. AG: Data curation, Writing – review & editing. MB: Resources, Writing – review & editing. EI: Conceptualization, Writing – review & editing. CM: Conceptualization, Funding acquisition, Writing – review & editing. RA: Conceptualization, Writing – review & editing. CL: Conceptualization, Supervision, Writing – review & editing.
Funding
The author(s) declare financial support was received for the research and/or publication of this article. This investigation received financial support from the UNICEF/UNDP/World Bank/WHO Special Programme for Research and Training in Tropical Diseases (TDR) (Grant agreement P22-00835).
Conflict of interest
The authors declare that the research was conducted in the absence of any commercial or financial relationships that could be construed as a potential conflict of interest.
Generative AI statement
The author(s) declare that no Generative AI was used in the creation of this manuscript.
Any alternative text (alt text) provided alongside figures in this article has been generated by Frontiers with the support of artificial intelligence and reasonable efforts have been made to ensure accuracy, including review by the authors wherever possible. If you identify any issues, please contact us.
Publisher’s note
All claims expressed in this article are solely those of the authors and do not necessarily represent those of their affiliated organizations, or those of the publisher, the editors and the reviewers. Any product that may be evaluated in this article, or claim that may be made by its manufacturer, is not guaranteed or endorsed by the publisher.
Supplementary material
The Supplementary Material for this article can be found online at: https://www.frontiersin.org/articles/10.3389/fitd.2025.1631996/full#supplementary-material
Supplementary Figure 1 | Monthly distribution of climate variables, with the red line representing the calculated medians. The numbers 1 to 12 represent the months of the year from January to December.
Supplementary Figure 2 | Variance inflation factor (VIF) of all climate variables included in the model estimated using a generalised linear model with quasi-poisson distribution.
Abbreviations
CI, Confidence interval; RDT, Rapid Diagnostic Test; 4S, Senegalese Syndromic Sentinel Surveillance; DLNM, Distributed Lag Non-linear Model.
References
1. Obeagu EI and Obeagu GU. Adapting to the shifting landscape: Implications of climate change for malaria control: A review. Med (Baltimore). (2024) 103:e39010. doi: 10.1097/MD.0000000000039010
2. Shin H-I, Ku B, Jung H, Lee S, Lee S-Y, Ju J-W, et al. 2023 World Malaria Report (Status of World Malaria in 2022). Public Health Weekly Report (2024) 17:1351–77. doi: 10.56786/PHWR.2024.17.32.1
3. Venkatesan P. The 2023 WHO World malaria report. Lancet Microbe. (2024) 5:e214. doi: 10.1016/S2666-5247(24)00016-8
4. Megersa DM and Luo X-S. Effects of Climate Change on Malaria Risk to Human Health: A Review. Atmosphere. (2025) 16:71. doi: 10.3390/atmos16010071
5. Diouf I, Adeola AM, Abiodun GJ, Lennard C, Shirinde JM, Yaka P, et al. Impact of future climate change on malaria in West Africa. Theor Appl Climatol. (2022) 147:853–65. doi: 10.1007/s00704-021-03807-6
6. Ryan SJ, Lippi CA, and Zermoglio F. Shifting transmission risk for malaria in Africa with climate change: a framework for planning and intervention. Malar J. (2020) 19:170. doi: 10.1186/s12936-020-03224-6
7. Okunlola OA and Oyeyemi OT. Spatio-temporal analysis of association between incidence of malaria and environmental predictors of malaria transmission in Nigeria. Sci Rep. (2019) 9:17500. doi: 10.1038/s41598-019-53814-x
8. Smith MW, Willis T, Mroz E, James WHM, Klaar MJ, Gosling SN, et al. Future malaria environmental suitability in Africa is sensitive to hydrology. Science. (2024) 384:697–703. doi: 10.1126/science.adk8755
9. Gashaw KW, Kassa SM, and Ouifki R. Climate-dependent malaria disease transmission model and its analysis. Int J Biomath. (2019) 12:1950087. doi: 10.1142/S1793524519500876
10. Gasparrini A, Armstrong B, and Kenward MG. Distributed lag non-linear models. Stat Med. (2010) 29:2224–34. doi: 10.1002/sim.3940
11. Abiodun GJ, Maharaj R, Witbooi P, and Okosun KO. Modelling the influence of temperature and rainfall on the population dynamics of Anopheles arabiensis. Malaria J. (2016) 15:364. doi: 10.1186/s12936-016-1411-6
12. Armando CJ, Rocklöv J, Sidat M, Tozan Y, Mavume AF, Bunker A, et al. Climate variability, socio-economic conditions and vulnerability to malaria infections in Mozambique 2016-2018: a spatial temporal analysis. Front Public Health. (2023) 11:1162535. doi: 10.3389/fpubh.2023.1162535
13. Lampros A, Talla C, Diarra M, Tall B, Sagne S, Diallo MK, et al. Shifting Patterns of Influenza Circulation during the COVID-19 Pandemic, Senegal. Emerg Infect Dis. (2023) 29:1808–17. doi: 10.3201/eid2909.230307
14. Sparks AH. nasapower: A NASA POWER Global Meteorology, Surface Solar Energy and Climatology Data Client for R. J Open Source Softw. (2018) 3:1035. doi: 10.21105/joss.01035
15. Kim JH. Multicollinearity and misleading statistical results. Korean J Anesthesiol. (2019) 72:558–69. doi: 10.4097/kja.19087
16. Gasparrini A. Distributed Lag Linear and Non-Linear Models in R: The Package dlnm. J Stat Softw. (2011) 43:1–20. doi: 10.18637/jss.v043.i08
17. Ouedraogo B, Inoue Y, Kambiré A, Sallah K, Dieng S, Tine R, et al. Spatio-temporal dynamic of malaria in Ouagadougou, Burkina Faso, 2011–2015. Malaria J. (2018) 17:138. doi: 10.1186/s12936-018-2280-y
18. Team RC. R: A Language and Environment for Statistical Computing. Vienna, Austria: R Foundation for Statistical Computing (2020). Available online at: https://www.R-project.org/ (Accessed January 1, 2025).
19. Covey HO, Wilson R, Gurrola-Mares Y, McMillan JR, and Brelsfoard CL. The thermal stress response of Aedes aegypti and Aedes albopictus when exposed to rapid temperature changes. Parasites Vectors. (2025) 18:300. doi: 10.1186/s13071-025-06951-4
20. Carrington LB, Armijos MV, Lambrechts L, Barker CM, and Scott TW. Effects of Fluctuating Daily Temperatures at Critical Thermal Extremes on Aedes aegypti Life-History Traits. PLoS One. (2013) 8:e58824. doi: 10.1371/journal.pone.0058824
21. Sadoine ML, Zinszer K, Liu Y, Gachon P, Fournier M, Dueymes G, et al. Predicting malaria risk considering vector control interventions under climate change scenarios. Sci Rep. (2024) 14:2430. doi: 10.1038/s41598-024-52724-x
22. Paaijmans KP, Blanford S, Bell AS, Blanford JI, Read AF, and Thomas MB. Influence of climate on malaria transmission depends on daily temperature variation. Proc Natl Acad Sci. (2010) 107:15135–9. doi: 10.1073/pnas.1006422107
23. Adeola AM, Botai JO, Rautenbach H, Adisa OM, Ncongwane KP, Botai CM, et al. Climatic Variables and Malaria Morbidity in Mutale Local Municipality, South Africa: A 19-Year Data Analysis. Int J Environ Res Public Health. (2017) 14:1360. doi: 10.3390/ijerph14111360
24. Chirebvu E, Chimbari MJ, Ngwenya BN, and Sartorius B. Clinical Malaria Transmission Trends and Its Association with Climatic Variables in Tubu Village, Botswana: A Retrospective Analysis. PLoS One. (2016) 11:e0139843. doi: 10.1371/journal.pone.0139843
25. Mordecai EA, Paaijmans KP, Johnson LR, Balzer C, Ben-Horin T, de Moor E, et al. Optimal temperature for malaria transmission is dramatically lower than previously predicted. Ecol Lett. (2013) 16:22–30. doi: 10.1111/ele.12015
26. Rubuga FK, Ahmed A, Siddig E, Sera F, Moirano G, Aimable M, et al. Potential impact of climatic factors on malaria in Rwanda between 2012 and 2021: a time-series analysis. Malaria J. (2024) 23:274. doi: 10.1186/s12936-024-05097-5
27. Paaijmans KP, Read AF, and Thomas MB. Understanding the link between malaria risk and climate. Proc Natl Acad Sci. (2009) 106:13844–9. doi: 10.1073/pnas.0903423106
28. Velu RM, Kwenda G, Bosomprah S, Chisola MN, Simunyandi M, Chisenga CC, et al. Ecological Niche Modeling of Aedes and Culex Mosquitoes: A Risk Map for Chikungunya and West Nile Viruses in Zambia. Viruses. (2023) 15:1900. doi: 10.3390/v15091900
29. Lingala MAL, Singh P, Verma P, and Dhiman RC. Determining the cutoff of rainfall for Plasmodium falciparum malaria outbreaks in India. J Infect Public Health. (2020) 13:1034–41. doi: 10.1016/j.jiph.2019.11.017
30. Prasad P, Gupta SK, Mahto KK, Kumar G, Rani A, Velan I, et al. Influence of climatic factors on the life stages of Aedes mosquitoes and vectorial transmission: A review. J Vector Borne Dis. (2024) 61:158. doi: 10.4103/jvbd.jvbd_42_24
31. Nyaaba GN, Olaleye AO, Obiyan MO, Walker O, and Anumba DOC. A socio-ecological approach to understanding the factors influencing the uptake of intermittent preventive treatment of malaria in pregnancy (IPTp) in South-Western Nigeria. PLoS One. (2021) 16:e0248412. doi: 10.1371/journal.pone.0248412
Keywords: malaria, climate variables, lag non-linear model, infectious disease, modelling
Citation: Talla C, Diarra M, Diouf I, Thiam MS, Gaye A, Barry MA, Igumbor E, Merle CS, Audu R and Loucoubar C (2025) Impact of climatic factors on malaria in Senegal based on the surveillance system between 2015 and 2022. Front. Trop. Dis. 6:1631996. doi: 10.3389/fitd.2025.1631996
Received: 22 May 2025; Accepted: 29 August 2025;
Published: 18 September 2025.
Edited by:
Ikbal Agah Ince, INSERM U1054 Centre de Biochimie Structurale de Montpellier, FranceReviewed by:
Victoria Paige Van de Vuurst, Virginia Tech, United StatesMaeti Antoinette George, National University of Lesotho, Lesotho
Iuri Valerio Graciano Borges, University of São Paulo, Brazil
Manel Herath, Ministry of Health Sri Lanka Entomologist, Sri Lanka
Qiwei Yu, Peking University, China
Copyright © 2025 Talla, Diarra, Diouf, Thiam, Gaye, Barry, Igumbor, Merle, Audu and Loucoubar. This is an open-access article distributed under the terms of the Creative Commons Attribution License (CC BY). The use, distribution or reproduction in other forums is permitted, provided the original author(s) and the copyright owner(s) are credited and that the original publication in this journal is cited, in accordance with accepted academic practice. No use, distribution or reproduction is permitted which does not comply with these terms.
*Correspondence: Cheikh Talla, Y2hlaWtoLnRhbGxhQHBhc3RldXIuc24=