 Qing-Long Gong1
 Qi Wang1
 Xue-Yao Yang1
 Dong-Li Li1
 Bo Zhao1
 Gui-Yang Ge1
 Ying Zong2
 Jian-Ming Li2
 Xue Leng2
 Kun Shi2
 Fei Liu1*
 Rui Du2*
- 1College of Animal Science and Technology, Jilin Agricultural University, Changchun, China
- 2College of Chinese Medicine Materials, Jilin Agricultural University, Changchun, China
Background: Bluetongue caused by the bluetongue virus (BTV) is a non-contagious and an insect-borne disease mainly affecting domestic and wild ruminants. Bluetongue in cattle is associated with vesicular lesions, weight loss, low milk production, and low reproductive capacity. It should not be ignored as it is associated with large economic losses to the livestock breeding industry in China. Although many studies have investigated bluetongue virus infection in cattle, no nationwide study on the prevalence of bluetongue virus infection in cattle from China has yet been conducted. This meta-analysis aimed to evaluate the seroprevalence and risk factors for bluetongue in cattle.
Results: We collected 50 publications from 1988 to 2019 through PubMed, ScienceDirect, Chinese Web of Knowledge (CNKI), VIP Chinese journal database, and Wanfang database. A total of the pooled bluetongue seroprevalence of 12.2% (5,332/87,472) in cattle was tested. The point estimate of bluetongue collected from 2001 to 2011 was 22.5% (95% CI: 1.2–58.9), which was higher than after 2012 (9.9%, 95% CI: 3.3–19.4). The analysis of the feeding model subgroup revealed that the seroprevalence of bluetongue was significantly higher (P < 0.05) among free-range cattle (22.5%; 95% CI: 7.7–42.3) than among cattle from intensive farming systems (1.8%; 95% CI: 0.0–6.7). The seroprevalence of bluetongue in different species showed significant variation (P < 0.05), with the highest seroprevalence of 39.8% (95% CI: 18.7–63.0) in buffalo and the lowest seroprevalence of 4.3% (95% CI: 1.2–9.0) in yak. In the zoogeographical division subgroup, the seroprevalence of bluetongue correlated positively within a certain range with the species distribution of Culicoides.
Conclusion: Our findings suggested that bluetongue was prevalent in cattle in China. In addition, the contact with sheep, other ruminants, or transmission media such as Culicoides may increase the seroprevalence of bluetongue disease in cattle. It is necessary to carry out continuous monitoring of the bluetongue seroprevalence. Moreover, comprehensive and improved strategies and measures should be implemented to prevent and control the spread of bluetongue.
Highlights
• Bluetongue (BT) is highly prevalent and unevenly distributed among Chinese cattle.
• The animal disease prevention plan may effectively reduce this epidemic in cattle.
• An intensive farming model may play an active role in the prevention of BT in cattle.
• This is the first meta-analysis of BT seroprevalence in cattle in China.
Introduction
Bluetongue caused by the bluetongue virus (BTV) is an arboviral non-contagious disease of domestic and wild ruminants and is designated as a reportable disease by the World Organization for Animal Health (OIE) (1). BTV is a segmented double-stranded (dsRNA) virus belonging to the genus Orbivirus of the family Reoviridae and transmitted through biting by hematophagous midges of Culicoides (2). BTV is widely prevalent in sheep, goats, cattle, camels, deer, and antelopes. Clinical presentation ranges from asymptomatic to mild fever, salivation, depression, dyspnea, and even abortion and death (2–4), leading to severe economic repercussions for livestock breeding due to direct (miscarriage, mortality, and reduced milk production) or indirect losses (vector control and animal trade restrictions) (5, 6).
Cattle are usually asymptomatic carriers after being infected with BTV, which leads to BTV spreading easily in the herd and being taken lightly. Asymptomatic carrier cattle can be a potential virus reservoir and source of infection on the farm, spreading BTV to the herd mainly through the bites of biological vectors such as Culicoides (7), but direct transmission (transplacental or sexual) has also been observed (8), which renders the eradication of BTV difficult.
A total of 27 BTV serotypes have been characterized to date (9–12), as well as other serotypes have been discovered (one in China) (13). The disease outcome varies based on the involved serotype and species (14). In the past decade, bluetongue has spread worldwide. There was a bluetongue pandemic in many Mediterranean and African countries such as Israel, Morocco, Tunisia, and Algeria. Tunisia had an epidemic of bluetongue in 2000 and 2004, and BTV serotype 4 (BTV-4) infection caused bluetongue in Morocco in 2004 (15). Since 1998, Europe has faced sporadic incursions of BTV from other areas. With more frequent invasions of bluetongue, the bluetongue epidemiology has changed dramatically, resulting in cases in many countries where they have never been seen before, such as in Balkan countries, France (Corsica), and Italy (5, 16, 17). BTV-8 was first detected in Europe in 2006; BTV-1 was detected in Spain, Portugal, and southwest France in 2007 (5); and BTV-6 was detected in the Netherlands and Germany (18). Bluetongue caused by BTV-4 infection has occurred successively in Greece, Romania, and Turkey (19).
China is a big cattle-breeding country. According to statistics, 49,292,000 cattle were bred in China in 2014 (20). After the first confirmation of bluetongue disease in Yunnan Province in 1979, BTV-positive livestock were detected in 29 Chinese provinces, including Hubei, Anhui, Sichuan, and Gansu. Of these, 164,576 cattle were investigated from these provinces and the positive rate was 7.4% (21). However, to our knowledge, there is no sufficient systematic analysis about the overall seroprevalence of bluetongue in China. Therefore, this meta-analysis aimed to estimate the seroprevalence of bluetongue in cattle in China. This systematic review and meta-analysis aimed to analyze the pooled seroprevalence of BTV in cattle in China and to assess potential risk factors associated with bluetongue seroprevalence.
Materials and Methods
Search Strategy and Selection Criteria
PRISMA was used to report the results in our systematic reviews and meta-analysis (22, 23). We searched the VIP Chinese journal database, Chinese Web of Knowledge (CNKI), Wanfang database, PubMed, and ScienceDirect for papers published in English or Chinese from inception to February 8, 2020. We aimed to screen all English or Chinese published papers on the prevalence of bluetongue in cattle in China. We attempted to contact the authors of the studies that could not be downloaded from the databases for additional information. No attempt was made to identify unpublished reports.
In the PubMed database, the Boolean operator “AND” was used to connect the theme words, and the Boolean operator “OR” was used to connect the free words. We used the theme word “cattle” [Mesh] and the free words “Bos indicus,” “zebu,” “zebus,” “Bos taurus,” “Cow, Domestic,” “Cows, Domestic,” “Domestic Cow,” “Domestic Cows,” “Bos grunniens,” “Yak,” and “Yaks,” which constitute retrieval formula A:
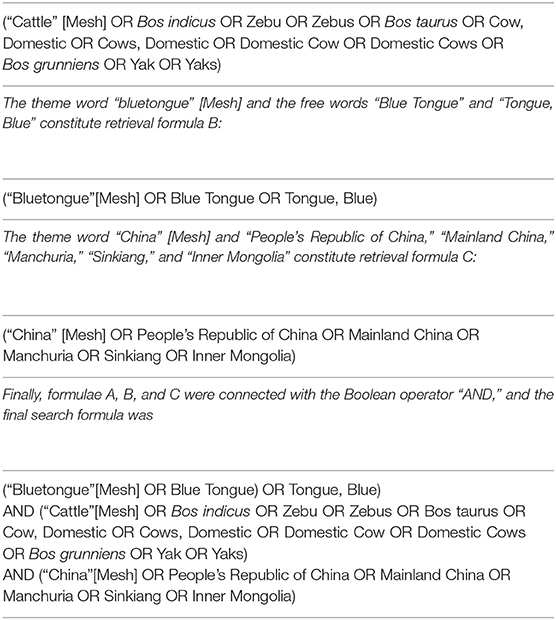
In the ScienceDirect database, the keywords “bluetongue,” “cattle,” “epidemiology,” “seroprevalence,” and “China” were used to search.
The search terms “cattle” (in Chinese) and “bluetongue” (in Chinese) were used for advanced search in the Chinese databases. All the Chinese databases used fuzzy search and synonym expansion. All the retrieved citations were imported into Endnote X9 (version 9.3.1).
Eligible studies were selected in accordance with the following criteria: (1) the objects of the research must be cattle; (2) the study aim must be to investigate the seroprevalence of bluetongue infection in cattle; (3) data must include information on the number of examined cattle and the number of bluetongue-positive cattle; (4) the study location must be in China; (5) the study design must be a cross-sectional study; and (6) the study must be published in Chinese or English. Studies that did not meet all the abovementioned criteria were excluded. Duplicate studies and review studies (not research papers) were also excluded.
Data Extraction and Quality Assessment
Four trained reviewers performed the data extraction separately. Any differences in the process were determined by another reviewer (the author of this article). The following information was extracted from all the collected studies: first author, publication year, sampling year, geographical region of the study, cattle variety, total number of examined cattle, the number of bluetongue-positive cattle, diagnostic tests, and farming mode. To reduce the heterogeneity caused by the different detection methods, we only extracted the results of the serological detection methods [agar gel immunodiffusion (AGID) and enzyme-linked immunosorbent assay (ELISA)] in the study and always used ELISA as the primary detection method. When a study used both ELISA and AGID (or other methods), we extracted only the rate obtained by the ELISA method for subsequent data analysis. The database was established by Microsoft Excel (version 16.32).
We assessed the quality of the publications selected based on these criteria using a method derived from the Grading of Recommendations Assessment, Development, and Evaluation method (24–27). Studies were awarded one point each if they clearly introduced the testing methods, sampling method and time described in detail, whether or not sampling was random, and whether there were four or more potential risk factors. Studies with four or five points were deemed as high quality, those with two or three points were considered to be of moderate quality, and studies scoring zero or one point were marked as low quality.
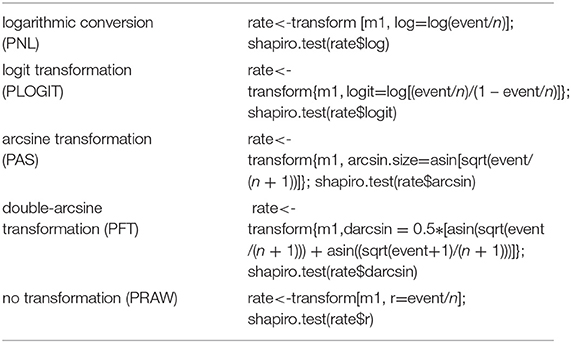
We conducted this meta-analysis of proportions in R v3.5.2 (“R Core Team, R: A language and environment for statistical computing,” R Core Team 2018), where the “meta” package was used to estimate the models (28). When the seroprevalence is small or large, the variance becomes very small. As a result, this type of research tends to have more weightage in the meta-analysis. Therefore, we used transformation methods to avoid skewed distributions due to too large (close to 1) or too small (close to 0) seroprevalence in the included studies (29). Before the meta-analysis was performed, the proportions were converted using logarithmic conversion (PNL), logit transformation (PLOGIT), arcsine transformation (PAS), double-arcsine transformation (PFT), and no transformation (PRAW) (30). Then, a normal distribution test was carried out on the observed and transformation proportions. Judgment criteria were based on previous reports (29, 30). For reporting, the transformed summary proportion and its confidence interval were converted back to proportions for ease of interpretation (28). The following codes were used for this portion of the analysis:
High heterogeneity can be expected in the meta-analysis of seroprevalence. Therefore, we use the random-effect model in advance to perform overall data integration and subgroup analysis. We assessed the heterogeneity between studies using the I2 and Cochrane Q statistics (expressed in χ2 and P-values, respectively). I2 < 50% indicates low heterogeneity; I2 > 50% indicates high heterogeneity, which describes the percentage of differences between studies due to heterogeneity.
The visualized statistical results of the meta-analysis were represented by forest plots. The funnel plot and Egger's test were used to detect publication bias, and sensitivity analysis was used to verify the stability of results. Subgroup analysis and single-factor regression analysis were used to analyze heterogeneity. The following codes were used for this portion of the analysis:
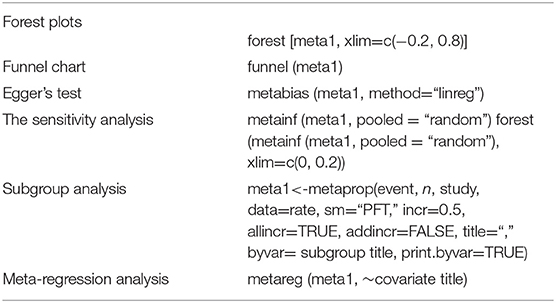
In the funnel diagram, the symmetry of the figure is judged subjectively. If it is symmetrical, there may be no publication bias or heterogeneity. If it is asymmetric, there may be publication bias or heterogeneity. According to the P-value, Egger's test was used to assess the publication bias of studies. The bias was considered to be non-existent when P ≥ 0.05. There may be publication bias if P < 0.05. In the sensitivity analysis, one study was deleted at a time and other studies were analyzed to estimate whether a single study would have a significant impact on the results.
Simultaneously, we conducted subgroup analysis stratified by the following potential risk factors: the investigated factors included the region (Northern China vs. other regions), sampling year (2012 or later vs. 2000 or before and 2001–2011), detection method [competitive (C)-ELISA vs. AGID], cattle variety (yak vs. buffalo, dairy cow, and yellow cattle), farming mode (comparison of intensive farming with free range), and study quality (high vs. middle and low). In the meta-analysis of seroprevalence, the detection method is usually the source of heterogeneity. Here, we used the detection method as a covariate and performed multivariate meta-regression analysis with other risk factors to explain the heterogeneity caused by the detection method.
We were not able to conduct subgroup analysis with the presence of mixed breeding with sheep or other ruminants as a covariate, as almost none of the studies we included mentioned this. We used zoogeographical division to conduct subgroup analysis and regression analysis on the included areas and conducted joint analysis with the distribution of the Culicoides species mentioned (31) to further enrich the potential risk factors affecting the seroprevalence of bluetongue disease in cattle in China.
Results
In this study, 481 records were identified after searching five databases, and 85 papers were selected after the initial screening and removal of duplicates. An additional 35 articles were excluded for the following reasons: 1 was a review, 7 did not include cattle, 6 used repetitive data, 3 papers had incomplete information, 11 articles lack epidemiological data that could be extracted, 6 papers used established detection methods, and 1 article was unavailable for full-text access. Finally, 50 publications were used for the meta-analysis (Figure 1).
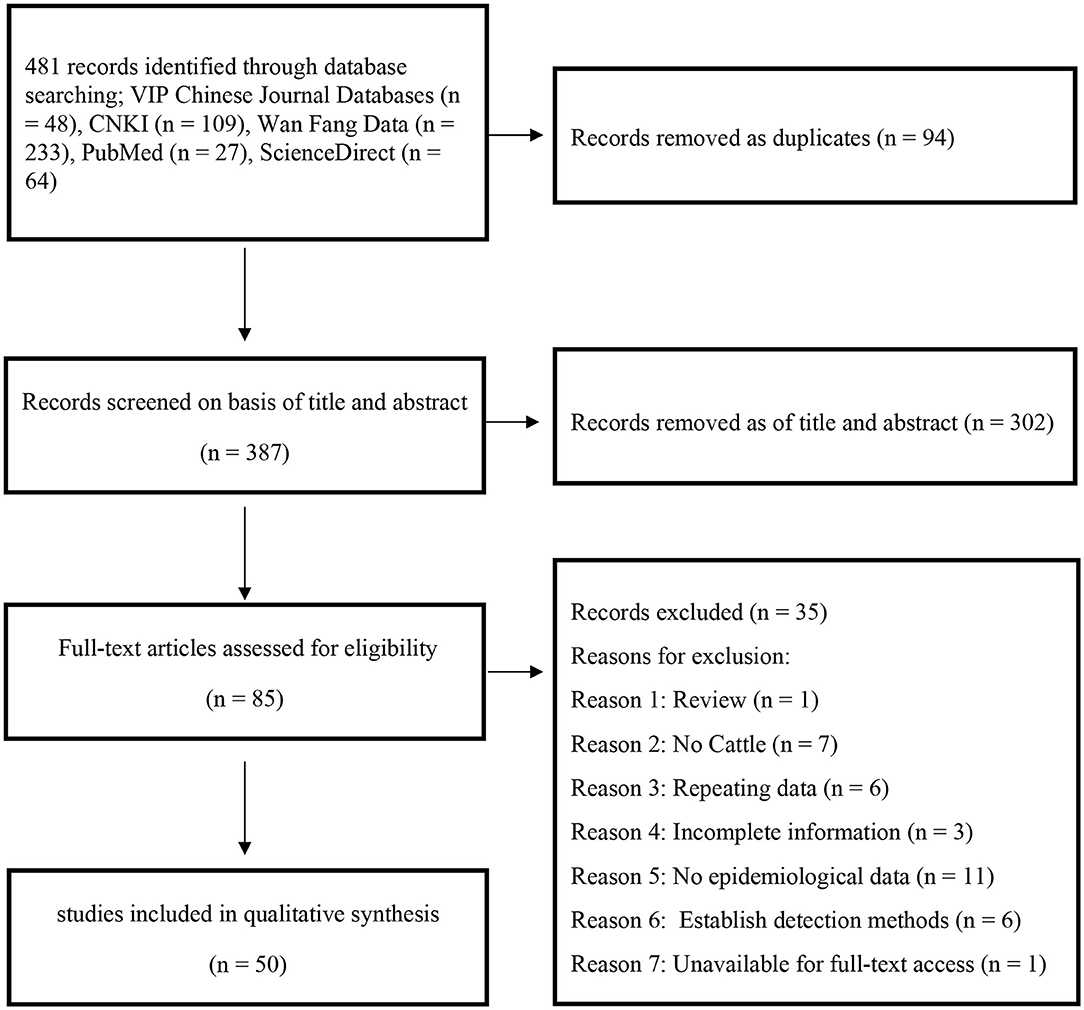
Figure 1. PRISMA chart of the study selection process showing inclusion and exclusion of studies.
The P and I2 statistics demonstrated that a random-effects model should be used in this study (χ2 = 12,688.50, I2 = 99.6%, P = 0.00). A total of 87,472 cattle across seven regions and 23 provinces of China were investigated, and the results revealed that the pooled seroprevalence of bluetongue was 12.2% (5,332/87,472; 95% CI: 8.4–16.6) (Supplementary Figure 1, Table 2). According to our quality criteria, 5 papers were considered to be of high quality (four or five points), 34 were of moderate quality (two or three points), and the remaining 11 papers were deemed to be of low quality (zero to one point).
Four positive conversions were performed on the data (Table 1). The results showed that the conversion results of PAS and PFT may be closer to the normal distribution (30). According to Barendregt et al. (29), PFT can stabilize the variance more effectively. Finally, we chose the combination result of PFT conversion for meta-analysis (32).
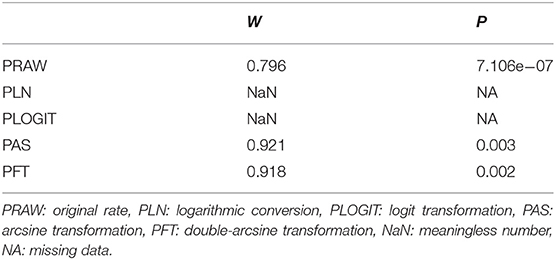
Table 1. Normal distribution test for the normal rate and the different conversion of the normal rate.
According to the funnel chart, we judged the existence of publication bias or heterogeneity in the selected study (Supplementary Figure 2). The results of Egger's test showed the following values: t = 4.582, P = 3.294e−05, indicating that there might be publication bias in the included studies (Supplementary Figure 3, Supplementary Table 1). We also used funnel plots for all the subgroups to assess publication bias (Supplementary Figures 4–9). The results showed that 35 studies did not clearly introduce whether to use random sampling, except for the 15 studies that explicitly mentioned random sampling. Therefore, our research may have sampling bias. The results of the sensitivity analysis indicated that the pooled seroprevalence was not significantly affected by any single study after omitting one study at a time; therefore, we believed that the results of our meta-analysis were reliable (Supplementary Figure 10).
We estimated the potential risk factors including geographical distribution, sampling year, detection methods, species, farming mode, and study quality (Table 3). There was significantly high heterogeneity in all the subgroups, and all estimates of the pooled seroprevalence for each subgroup were calculated using the random-effects model. In terms of geographical region, the highest seroprevalence of bluetongue was 45.9% (95% CI: 30.9–61.4; 1,289/3,178) in Southern China and the lowest seroprevalence was 0.1% (95% CI: 0.0–0.9; 4/3,467) in Northeastern China, and the difference was statistically significant (P < 0.05). We obtained preliminary statistics on the seroprevalence of bluetongue in different provinces. The results showed that the highest positive rate of bluetongue was 46.3% (95% CI: 29.5–63.5) in Guangxi Province, followed by Guangdong at 45.4% (95% CI: 15.8–76.9). The seroprevalence of bluetongue in Hebei (0.0%; 95% CI: 0.0–1.7), Heilongjiang (0.0%; 95% CI: 0.0–0.1), and Jilin (0.7%; 95% CI: 0.0–6.4) was lower than that in other provinces (Figure 2, Table 2).
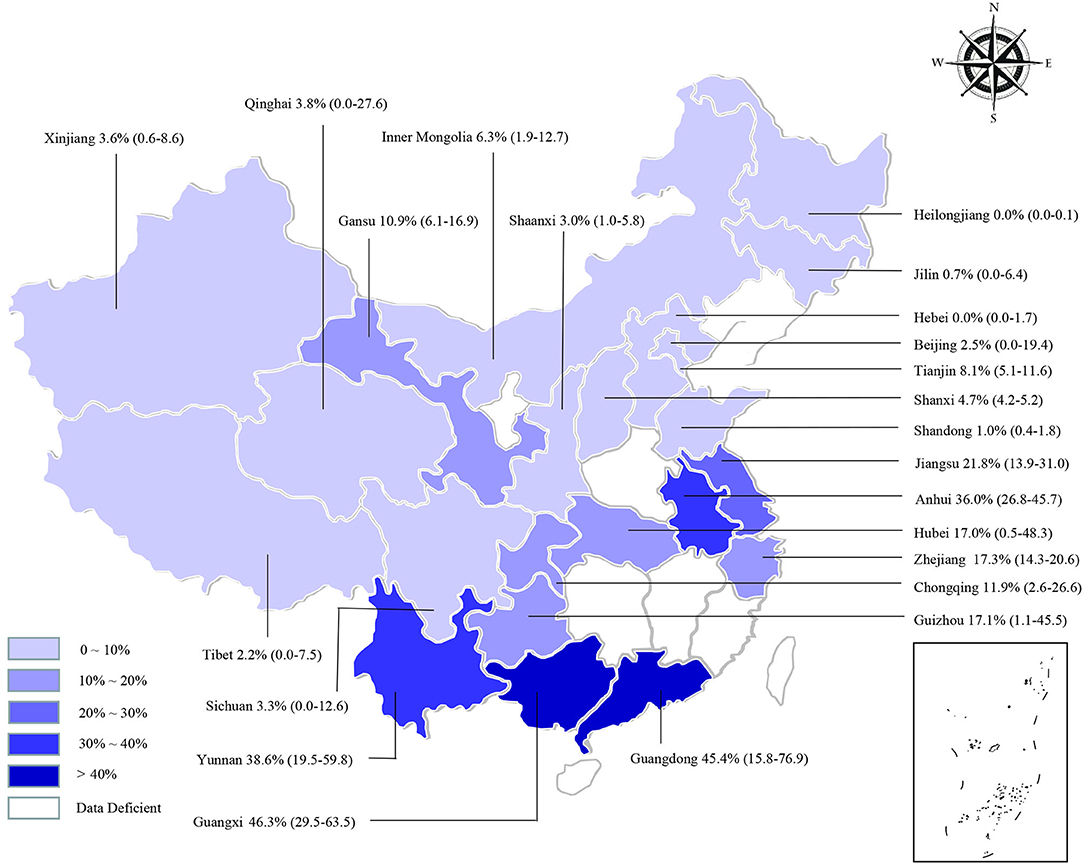
Figure 2. Bluetongue virus infection in cattle in China. Different saturations in the HSB slider represent different infection rates.
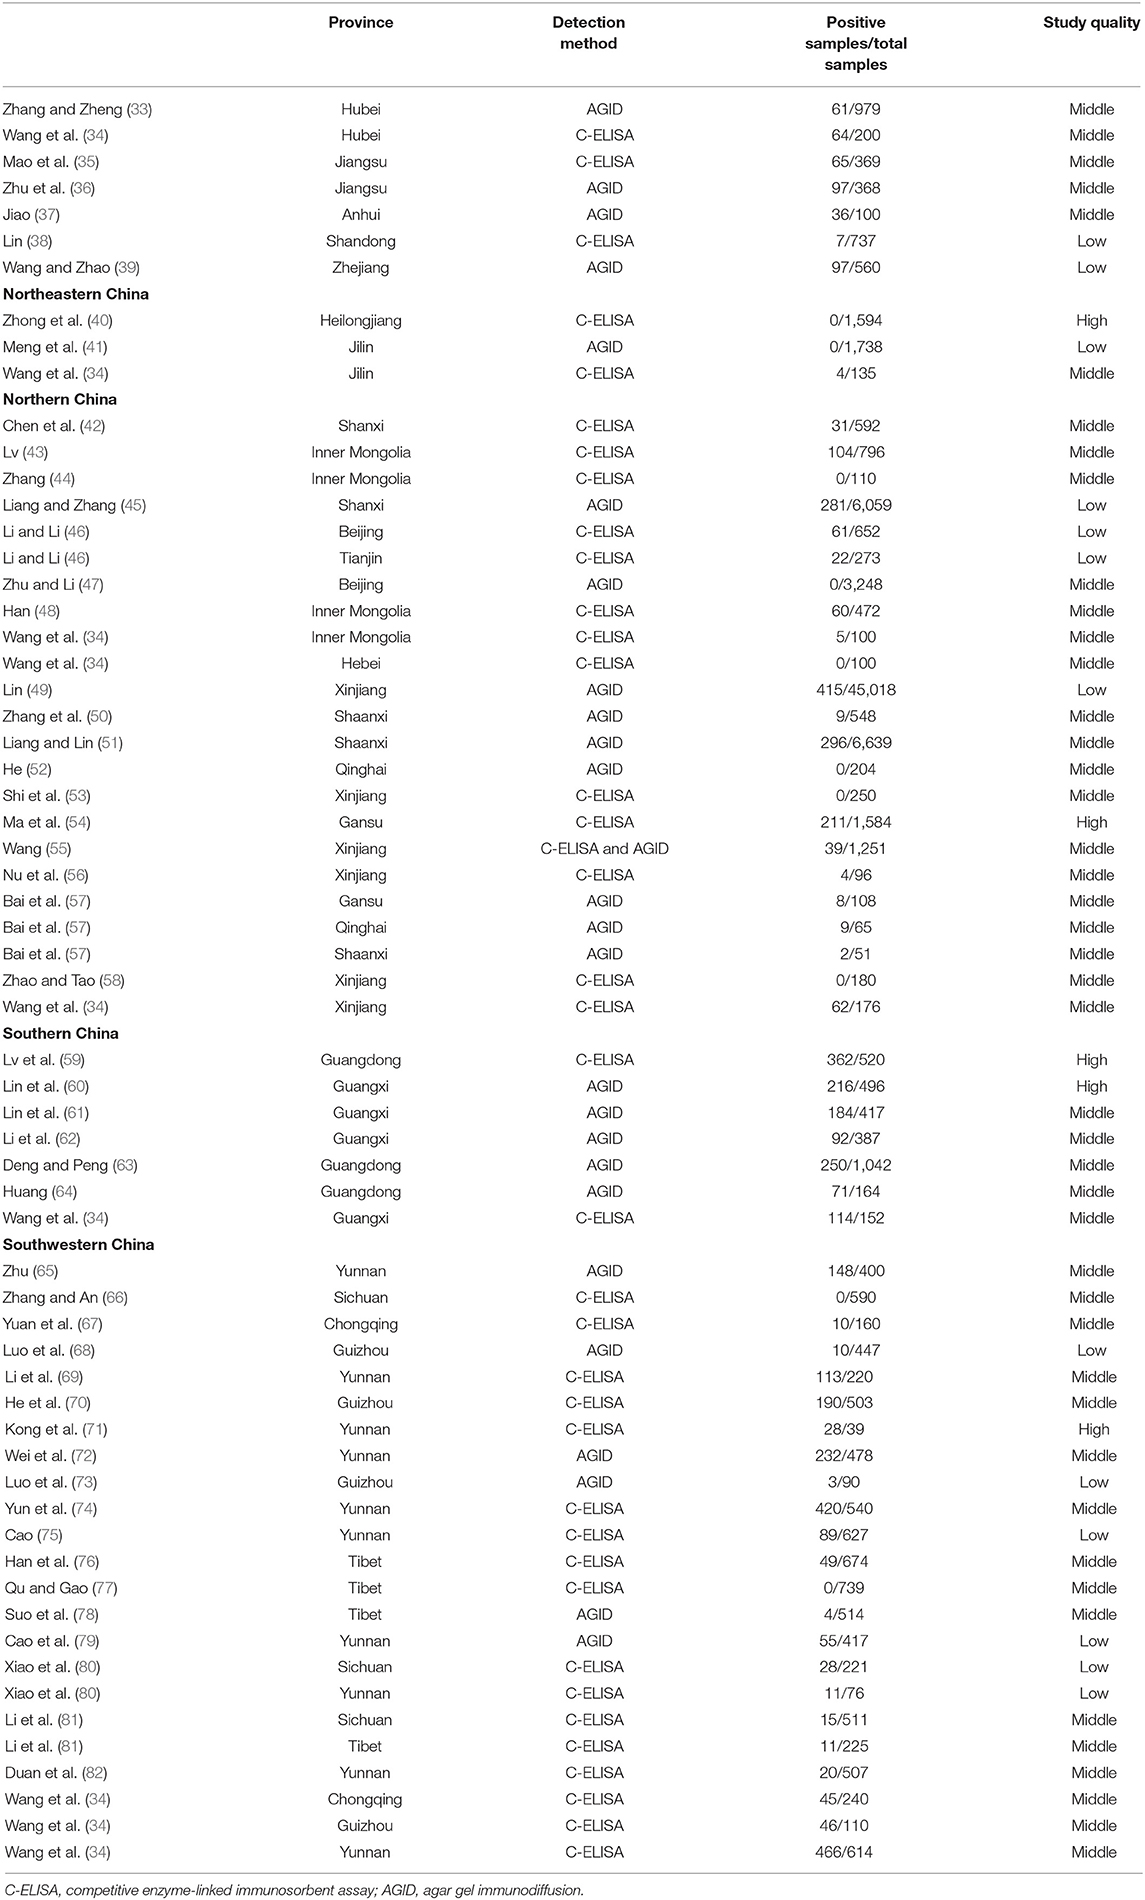
Table 2. Included studies of bluetongue virus in cattle.
Furthermore, the pooled seroprevalence of bluetongue was 16.6% (95% CI: 9.6–25.0; 1,922/22,348) in cattle collected before 2000, 22.5% (95% CI: 1.2–58.9; 400/1,117) in cattle collected during 2001–2011, and 9.9% (95% CI: 3.3–19.4; 1,976/12,564) in cattle collected in 2012 or later. The estimated pooled seroprevalence of bluetongue was significantly higher (P < 0.05) among free-range cattle at 22.5% (95% CI: 7.7–42.3; 210/1,002) than among intensive farming cattle at 1.8% (95% CI: 0.0–6.7; 136/7,497). The pooled seroprevalence of bluetongue in different species showed significant variation (P < 0.05), with the highest seroprevalence of 39.8% (95% CI: 18.7–63.0; 716/1,675) in buffalo and the lowest seroprevalence of 4.3% (95% CI: 1.2–9.0; 289/3,822) in yak. The seroprevalence of bluetongue investigated by AGID was 12.2% (95% CI: 7.6–17.8; 2,764/71,300), and in the C-ELISA test, it was 11.6% (95% CI: 5.8–19.1; 2,568/16,172), and no significant difference was found (P = 0.717) (Table 3). In addition, joint analysis of the detection method and other subgroups showed that the detection method had the greatest impact on the farming mode subgroup [R2 = 31.47%; residual variation due to homogeneity (I2-res) = 99.04%] and had the least impact on the research quality (R2 = 0%; I2-res = 99.51%) (Table 3). In the zoogeographical division subgroup, the Southern China district had the highest disease incidence (47.5%, 42.1–52.9%), which corresponded with the most abundant species of Culicoides (n = 129).
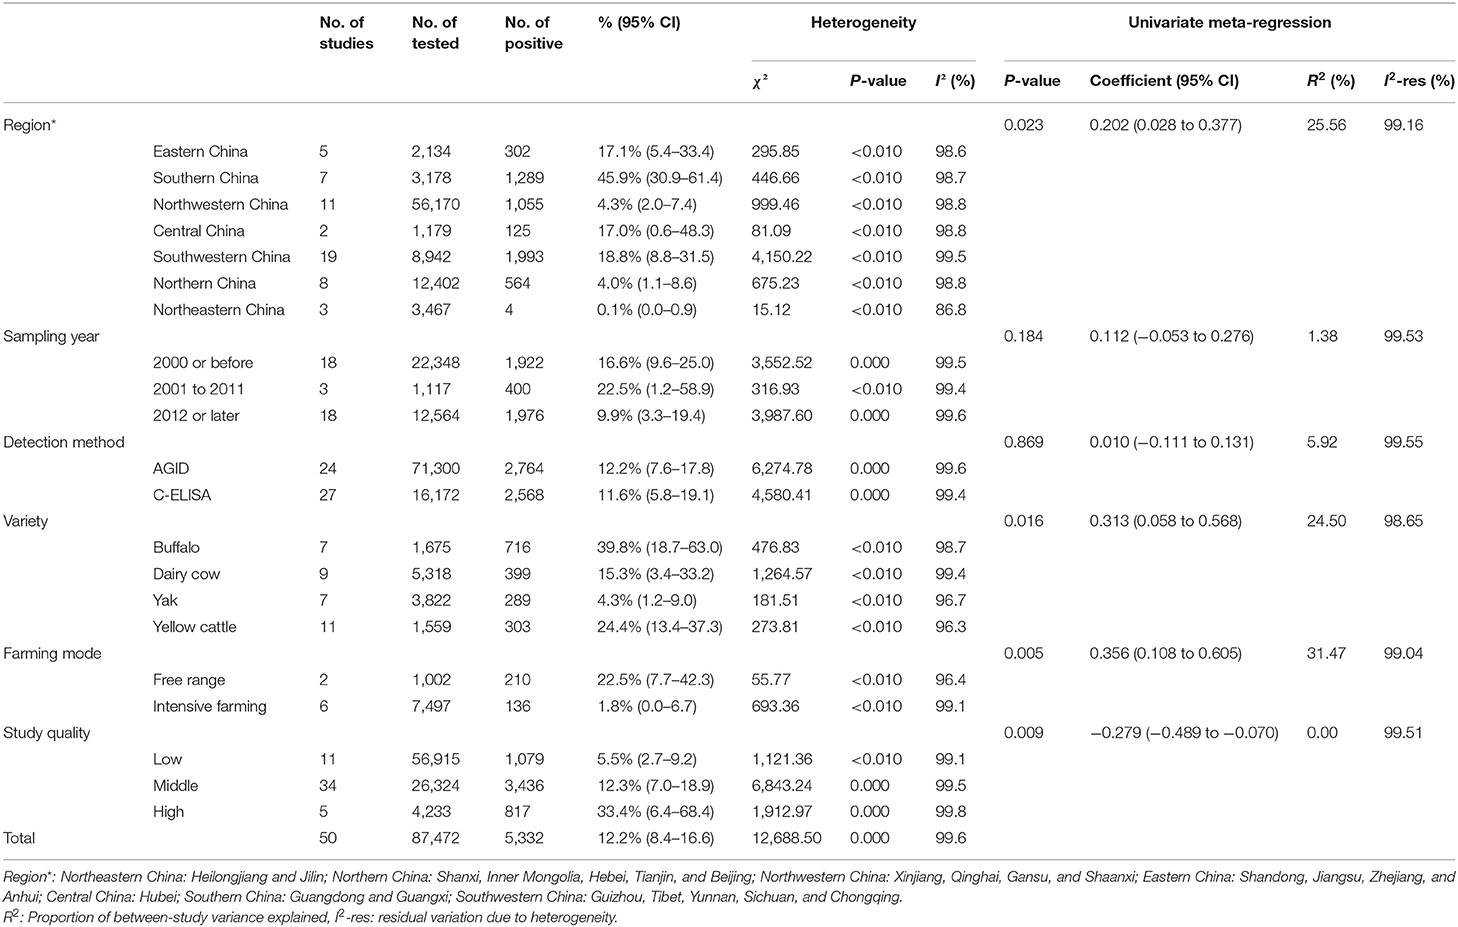
Table 3. Pooled prevalence of bluetongue virus in cattle.
Regression analysis showed that the region, cattle variety, farming mode, and quality score subgroup might be the main sources of heterogeneity (P < 0.05).
Discussion
BTV infection should not be ignored because it causes significant economic losses to global livestock breeding. To our knowledge, this is the first meta-analysis of bluetongue seroprevalence in cattle in China. The findings of this study may provide control measures that can be implemented in the development of animal husbandry. The seroprevalence of bluetongue exhibited variations depending on differences in the region of investigated cattle, cattle variety, sampling year, and farming mode in the present analysis. The pooled seroprevalence of bluetongue in cattle was 12.2% (95% CI: 8.4–16.6), with statistical significance among different regions (Table 3). We found that the seroprevalence was higher in Guangdong, Guangxi, Yunnan, and Anhui and lower in Heilongjiang, Jilin, Xinjiang, and Tibet (Figure 2). The BTV transmission dynamics strongly depends on the local context such as the species present, their density and distribution, and climatic conditions (83). Guangdong, Guangxi, and Yunnan are neighboring provinces. It is worth noting that the geographical distribution was uneven, and the number of studies in some regions was very small in the researches included (Central China, n = 2; Northeastern China, n = 3), which may lead to unstable results. In addition to climatic factors, further cross-province circulation of animals and animal products should be verified. The present study confirms the widespread seroprevalence of bluetongue in cattle in China (Figure 2).
In the detection method subgroups, two detection methods were included (AGID and C-ELISA). Diagnostic technology for bluetongue disease of China (GB/T 18636-2017) stipulates that AGID and C-ELISA are suitable for detecting BTV antibody in serum samples. Since the establishment of the 2002 standard, reverse transcription–polymerase chain reaction (RT-PCR) and fluorescent RT-PCR molecular biological detection methods have been added. Molecular biology is currently the best detection method, with high sensitivity and strong specificity. RT-PCR methods were able to detect representative strains of all 24 BTV serotypes and different BTV serotypes in the Mediterranean region, with a detection limit of < 0.01 ECE50 (median effective dose) (84, 85). However, false-positive results are easy to occur because of contamination by nucleic acids using molecular biological methods with high sensitivity. Moreover, the high price of the instruments and the operation steps of replication limit the technology popularization; serological detection still dominates large-scale clinical testing (86). AGID is relatively simple and economical, but the antibodies in this method exhibit cross-reactivity with epizootic hemorrhagic disease virus, causing false-positive results (87). C-ELISA is a rapid method detecting antibodies in serum samples as early as day 6 post-infection (88) and has been widely commercialized. Based on the analysis of the sampling years, it showed that the seroprevalence of bluetongue in cattle detected pre-2000 was lower than that detected in 2001–2011. However, only three articles reported the detection methods among the studies from 2001 to 2011, and insufficient grouping data may lead to deviation from the actual situation. In addition, different detection methods may cause differences in the seroprevalence of bluetongue disease. AGID was the main detection method before 2000, and C-ELISA was the main detection method in 2001–2011. After China joined in the World Trade Organization (WTO) (89), its internationalization may have led to significant changes in China's animal husbandry. Although China joining the WTO was conducive to the large-scale industrialization of animal husbandry in China, the prevention and control of diseases by breeders was not consistent with the rapid expansion of production scale and the growth of demand (90), causing a rapid increase in the bluetongue infection rate among cattle from 2001 to 2011. We suggested that a comprehensive surveillance system should be established to improve the technical level of breeding management, so that the level of disease prevention and control can be developed together with the scale of breeding to avoid the wide seroprevalence of bluetongue. In the 2012 or later group, the detection method was mainly based on C-ELISA. Cattle collected from after 2012 had a lower seroprevalence of bluetongue than those collected from 2001 to 2011, indicating that the seroprevalence of bluetongue disease declined in recent years. This result may be related to the medium- and long-term animal disease prevention plan (2012–2020) issued by China in 2012, which strengthened animal disease prevention and control measures (91). It is necessary to continue implementing effective control regulations to reduce bovine bluetongue infection.
Our findings suggested that cattle variety (P = 0.015) may be the source of heterogeneity (Table 3). The seroprevalence of bluetongue was significantly higher in buffalo than in yellow cattle, yak, and cow, which may be due to potential vector preference for a host species (92). Moreover, it should be noted that both host susceptibility and climate variations between regions have a direct impact on vector distribution. As previously demonstrated, climate variables play a substantial role in promoting or hampering the development of bluetongue (93–96). The buffalo breeding area has a humid subtropical and temperate climate with an average temperature of 12–29°C and a rainfall of 800–1,500 mm. Therefore, the climatic and geographical conditions of the breeding area are conducive to the survival, propagation, and transmission of the Culicoides midges, which are the vectors that transmit BTV. A higher intensity of vector is directly linked with the increased seroprevalence of BTV (97). The zoogeographical division subgroup showed that the seroprevalence of bluetongue disease in cattle from China was correlated positively with the distribution of Culicoides species. Farms should pay attention to disseminating media such as Culicoides to reduce the spread of bluetongue disease in cattle. In addition, the seroprevalence of BTV among yak was the lowest, which may be related to the yak's habitat. It is mainly distributed in intermountain basins, alpine grasslands, and alpine desert grasslands of Xinjiang, Tibet, and Sichuan. This result is consistent with the trend of seroprevalence.
In different regions, with global warming, there is an indication that the prevention and control of bluetongue in cattle and other animals should be paid more attention. BTV infection may exhibit annual variation due to climatic modulation (98). Moreover, our findings suggested that the seroprevalence of bluetongue was lower in dairy cows than in yellow cattle. We conducted multivariate meta-regression analysis on varieties using regions as the covariates, and the results showed that regions were not a source of heterogeneity in the subgroup (P > 0.05, data not shown). Then, we carried out multivariate meta-regression analysis on varieties with years as covariates, and the results revealed that years were not the source of heterogeneity in the subgroup (P > 0.05, data not shown). We speculated that the difference in the seroprevalence between cows and yellow cattle may be caused by different breeding modes. However, data regarding the farming modes was insufficient for multivariate meta-regression analysis on varieties and farming modes. In general, dairy cows are mostly under the intensive farming system, while yellow cattle are mostly in the free-range system as draft cattle or beef cattle. This result is consistent with the farming mode subgroup.
The results revealed a significant difference in the seroprevalence of bluetongue between cattle in the free-range and intensive farming systems in the farming mode subgroup, indicating that risk behaviors do differ between farming mode. Intensive farming greatly reduced the infection rate of bluetongue disease, indicating that intensive farming had more advanced technologies (different feeding and management schemes are formulated for different animals, seasons, and ages; and strict disease prevention and control measures are taken) and better management in this regard. Moreover, cattle from the free-range farming system had a larger range of activities and more likely to be bitten by mosquitoes transmitting the BTV (83). Therefore, it is necessary to further strengthen intensive farming practices to control the domestic epidemic of bluetongue.
We tried to determine season as a potential risk factor, but results could not be obtained due to lack of adequate data. However, we speculated that season may be one of the potential risk factors affecting the change in seroprevalence, because warm temperature and human environment are positively associated with animal habitats. In fact, a 1°C increase in temperature has been reported to increase the risk of bluetongue by 27% (99). Optimal temperature is favorable for many processes of BTV transmission, such as incubation period, carrier capacity (100), and survival rate (101). Further studies are needed to confirm that there are no other influential factors, such as specific sampling time or season and sampling limitations.
In addition, we found that the study quality was the source of heterogeneity in the present study (P = 0.009), suggesting that more risk factors should be collected as quality evaluation.
There are some limitations in our meta-analysis that may affect the results. First, we found a number of potentially relevant studies through our systematic review, but not all the underlying studies were suitable for use. Therefore, some of these studies might not have been included in this meta-analysis, and some potential risk factors may be missed. Second, numerous qualified studies were acquired in our systematic review, but not all data were available. There is not enough data for the subgroup analysis on the seroprevalence of bluetongue, such as the breeding model and variety. Third, analyzable data were limited, involving age, sex, living environment, the presence or absence of sheep or other ruminants, the presence or absence of Culicoides or other vectors, and season. We correlated the relationship between Culicoides species diversity and zoogeographical divisions in China; however, as far as the authors know, only a few types of Kumon can transmit BTV, so the results of this part should be treated with caution. Researchers should conduct an extensive survey of the distribution of BTV vectors to further study the relationship between BVT infection and transmission vectors. All these variates were not analyzed in our study. The breeding conditions might lead to differences, which is probably the result of differences in environmental conditions. Fourth, a limited number of qualifying researches in Central China (n = 2) and Northeastern China (n = 3) might not reflect the true seroprevalence in the investigated regions, and the quality level of the study was variable, suggesting that more surveillance of bluetongue infection should be continuously undertaken in cattle in these areas. Fifth, some of the included studies did not explicitly mention whether to use random sampling. Therefore, our research may have a sampling bias. Sixth, though the studies included in this review were eligible, most were of moderate or low quality. This may be due to the lack of the underlying factor of sampling randomness or sampling method. To prove the quality of research, more risk factors should be considered and analyzed in the future.
Based on a systematic meta-analysis, we assessed the seroprevalence of bluetongue in cattle from China. The results showed that bluetongue was epidemic in cattle in China. Region, variety, feeding methods, and other factors might affect the seroprevalence of bluetongue. We suggested that appropriate control schemes be formulated according to the differences in breeding patterns and geographical conditions in the various regions. It is also necessary to conduct epidemiological investigations on cattle in more regions to further explore the risk factors of bluetongue infection in cattle. Comprehensive surveillance programs should be adopted to prevent the spread of bluetongue in cattle.
Data Availability Statement
The original contributions presented in the study are included in the article/Supplementary Materials, further inquiries can be directed to the corresponding author/s.
Author Contributions
FL and RD are responsible for the idea and concept of the paper. D-LL, BZ, G-YG, and J-ML collected the data. QW, YZ, and X-YY analyzed the results. Q-LG wrote the manuscript. XL and KS revised the manuscript. All the authors contributed to the manuscript editing and approved the final manuscript.
Funding
This study was financially supported by the Scientific Research Planning Project of Jilin Provincial Department of Education (JJKH20200364KJ) and the Science and Technology Development Program of Jilin Province (20190304004YY).
Disclaimer
Frontiers Media SA remains neutral with regard to jurisdictional claims in published maps and institutional affiliations.
Conflict of Interest
The authors declare that the research was conducted in the absence of any commercial or financial relationships that could be construed as a potential conflict of interest.
Acknowledgments
We thank the scientists and personnel of Jilin Agricultural University, for their collaboration.
Supplementary Material
The Supplementary Material for this article can be found online at: https://www.frontiersin.org/articles/10.3389/fvets.2020.550381/full#supplementary-material
Abbreviations
AGID, agar gel immunodiffusion; BTV, bluetongue virus; CNKI, Chinese Web of Knowledge; OIE, World Organization for Animal Health; WTO, World Trade Organization.
References
1. Bakhshesh M, Otarod V, Mehrabadi MHF. Large-scale seroprevalence and risk factors associated with bluetongue virus in Iran. Prev Vet Med. (2020) 179:104994. doi: 10.1016/j.prevetmed.2020.104994
2. Khezri M, Azimi SM. Epidemiological investigation of bluetongue virus antibodies in sheep in Iran. Vet World. (2013) 6:122–5. doi: 10.5455/vetworld.2013.122-125
3. Najarnezhad V, Rajae M. Seroepidemiology of bluetongue disease in small ruminants of north-east of Iran. Asian Pac J Trop Biomed. (2013) 3:492–5. doi: 10.1016/S2221-1691(13)60102-1
4. Sohail T, Yaqub T, Shafee M, Abbas T, Nazir J, Ullah N. Seroprevalence of bluetongue virus in small ruminants in balochistan province, pakistan. Transbound Emerg Dis. (2018) 65:1272–81. doi: 10.1111/tbed.12871
5. Wilson AJ, Mellor PS. Bluetongue in Europe: past, present and future. Philos Trans R Soc Lond B Biol Sci. (2009) 364:2669–81. doi: 10.1098/rstb.2009.0091
6. Coetzee P, van Vuuren M, Stokstad M, Myrmel M, Venter EH. Bluetongue virus genetic and phenotypic diversity: towards identifying the molecular determinants that influence virulence and transmission potential. Vet Microbiol. (2012) 161:1–12. doi: 10.1016/j.vetmic.2012.07.007
7. Schwartz-Cornil I, Mertens PPC, Contreras V, Hemati B, Pascale F, Bréard E, et al. Bluetongue virus: virology, pathogenesis and immunity. Vet Res. (2008) 39:46. doi: 10.1051/vetres:2008023
8. de Clercq K, de Leeuw I, Verheyden B, Vandemeulebroucke E, Vanbinst T, Herr C, et al. Transplacental infection and apparently immunotolerance induced by a wild-type bluetongue virus serotype 8 natural infection. Transbound Emzrg Dis. (2008) 55:352–9. doi: 10.1111/j.1865-1682.2008.01044.x
9. Maan N, Maan S. Identification and differentiation of the twenty six bluetongue virus serotypes by RT–PCR amplification of the serotype-specific genome segment 2. PLoS ONE. (2012) 7:e32601. doi: 10.1371/journal.pone.0032601
10. Jenckel M, Bréard E, Schulz C, Sailleau C, Viarouge C, Hoffmann B, et al. Complete coding genome sequence of putative novel bluetongue virus serotype27. Genome Announc. (2015) 3:e00016–15. doi: 10.1128/genomeA.00016-15
11. Schulz C, Bréard E, Sailleau C, Jenckel M, Viarouge C, Vitour D, et al. Bluetongue virus serotype 27: detection and characterization of two novel variants in Corsica, France. J Gen Virol. (2016) 97:2073–83. doi: 10.1099/jgv.0.000557
12. Zientara S, Sailleau C, Viarouge C, Höper D, Beer M, Jenckel M, et al. Novel Bluetongue virus in goats, Corsica, France, 2014. Emerg Infect Dis. (2014) 20:2123–5. doi: 10.3201/eid2012.140924
13. Gui YR. Comparative Study of Bluetongue Virus BTV-HbC3 Strain and Bluetongue Virus BTV-10. (Doctoral dissertation) Wuhan University, Wuhan (2004).
14. Elbers AR, Backx A, Mintiens K, Gerbier G, Staubach C, Hendrickx G, et al. Field observations during the Bluetongue serotype 8 epidemic in 2006: II. Morbidity and mortality rate, case fatality and clinical recovery in sheep and cattle in the Netherlands. Prev Vet Med. (2008) 87:31–40. doi: 10.1016/j.prevetmed.2008.06.003
15. Hammami S. North Africa: a regional overview of bluetongue virus, vectors, surveillance and unique features. Vet Ital. (2004) 3:43–6. doi: 10.1016/S0966-842X(01)02040-6
16. Mellor PS, Carpenter S, Harrup L, Baylis M, Mertens PPC. Bluetongue in Europe and the Mediterranean Basin: history of occurrence prior to 2006. Prev Vet Med. (2008) 87:4–20. doi: 10.1016/j.prevetmed.2008.06.002
17. Saegerman C, Berkvens D, Mellor PS. Bluetongue epidemiology in the European union. Emerg Infect Dis. (2008) 14:539–44. doi: 10.3201/eid1404.071441
18. Eschbaumer M, Hoffmann B, Moss A, Savini G, Leone A, König P, et al. Emergence of bluetongue virus serotype 6 in Europe-German field data and experimental infection of cattle. Vet Microbiol. (2010) 143:2–4. doi: 10.1016/j.vetmic.2009.11.040
19. Kyriakis CS, Billinis C, Papadopoulos E, Vasileiou NGC, Athanasiou LV, Fthenakis GC. Bluetongue in small ruminants: an opinionated review, with a brief appraisal of the 2014 outbreak of the disease in Greece and the south-east Europe. Vet Microbiol. (2015) 181:66–74. doi: 10.1016/j.vetmic.2015.08.004
20. Kong L, Song Y. Chinese Animal Husbandry and Veterinary Yearbook Beijing: China Agricultural Press (2014).
21. Lin HL, Ran DL, Wang W. Research progress of bluetongue. Xinjiang Anim Husbandry. (2008) 1:4–7. doi: 10.3969/j.issn.1003-4889.2008.01.002
22. Moher D, Liberati A, Tetzlaff J, Altman DG. Preferred reporting items for systematic reviews and meta-analyses: the PRISMA statement. Int J Surg. (2010) 8:336–41. doi: 10.1016/j.ijsu.2010.02.007
23. Moher D, Shamseer L, Clarke M, Ghersi D, Liberati A, Petticrew M, et al. Preferred reporting items for systematic review and meta-analysis protocols (PRISMA-P) 2015 statement. Syst Rev. (2015) 4:1. doi: 10.1186/2046-4053-4-1
24. Liu S, Zhang H, Gu C, Yin J, He Y, Xie J, et al. Associations between hepatitis B virus mutations and the risk of hepatocellular carcinoma: a meta-analysis. J Natl Cancer Inst. (2009) 101:1066–82. doi: 10.1093/jnci/djp180
25. Speich B, Croll D, Furst T, Utzinger J, Keiser J. Effect of sanitation and water treatment on intestinal protozoa infection: a systematic review and meta-analysis. Lancet Infect Dis. (2016) 16:87–99. doi: 10.1016/S1473-3099(15)00349-7
26. Wang ZD, Liu HH, Ma ZX, Ma HY, Li ZY, Yang ZB, et al. Toxoplasma gondii infection in immunocompromised patients: a systematic review and meta-analysis. Front Microbiol. (2017) 8:389. doi: 10.3389/fmicb.2017.00389
27. Elliott S, Cheetham J. Meta-analysis evaluating resting laryngeal endoscopy as a diagnostic tool for recurrent laryngeal neuropathy in the equine athlete. Equine Vet J. (2019) 51:167–72. doi: 10.1111/evj.12987
28. Wang N. How to Conduct a Meta-Analysis of Proportions in R: a Comprehensive Tutorial. College Station, TX: Texas A&M University (2018).
29. Barendregt JJ, Doi SA, Lee YY, Norman RE, Vos T. Meta-analysis of prevalence. J Epidemiol Commun Health. (2013) 67:974–8. doi: 10.1136/jech-2013-203104
30. Li X, Ni HB, Ren WX, Jiang J, Gong QL, Zhang XX. Seroprevalence of Toxoplasma gondii in horses: a global systematic review and meta-analysis. Acta Trop. (2019) 201:105222. doi: 10.1016/j.actatropica.2019.105222
31. Liu GP, Hao BS, Yu YX. Floristic distribution of Culicoides in China. Chin J Vector Biol Control. (2002) 13:196–9. doi: 10.3969/j.issn.1003-4692.2002.03.012
32. Ding H, Gao YM, Deng Y, Lamberton PH, Lu DB. A systematic review and meta-analysis of the seroprevalence of Toxoplasma gondii in cats in mainland China. Parasit Vectors. (2017) 10:27. doi: 10.1186/s13071-017-1970-6
33. Zhang XZ, Zheng GS. Investigation of bluetongue virus (BTV) infection in cattle and sheep of Xiangfan. Hubei J Anim Vet Sci. (1988) 9:32–3. doi: 10.16733/j.cnki.issn1007-273x.1988.01.014
34. Wang F, Xiao L, Zhu P, Zhu JB. Serological investigation and analysis of influencing factors of bluetongue in China in 2018. Anim Husbandry Vet Med. (2019) 48:1–3.
35. Mao L, Li WL, Yang LL, Shao K, Xu BJ. Serological survey and monitor of Bluetongue virus (BTV) infections in ruminants in Jiangsu province. Southwest China J Agri Sci. (2015) 6:2784–7. doi: 10.16213/j.cnki.scjas.2015.06.080
36. Zhu CG, Li YM, Shao CL, Xu SH, Zheng TR. Prevalence and comprehensive control of bluetongue disease in Jiangsu Province. Anim Husbandry Vet. (1995) 6:262–3.
37. Jiao PL. Epidemiological survey of livestock and poultry in Mengcheng County. Chin J Vet Med. (1995) 6:33–4.
38. Lin XY. The Serosurvey of Five Major Diseases in Large-Scale Farms in Parts of Shandong Province. (Doctoral dissertation) Shandong Agricultural University, Taian (2015).
39. Wang XN, Zhao GY. Seroepidemiological of bluetongue virus (BTV) infection in cattle and sheep of Zhejiang Province. China Anim Health Inspect. (1990) 04:26–7.
40. Zhong YM, Zhang JF, Zhang J, Wang M, Su J, Zhang JY. Surveillance and purification of cattle disease in Heilongjiang province. China J Anim Husbandry Vet Med. (2016) 11:17–8. doi: 10.3969/J.ISSN.1671-6027.2016.11.010
41. Meng RZ, Wang WL, Li TS, Zhou Y, Liang J. Seroepidemiological report of bluetongue virus (BTV) infection in cattle and sheep in some areas of Jilin Province. N Res Zoonot Infect Dis Cont. (2004) 2:751–2.
42. Chen JS, Shen DJ, Yu YP, Wang JD, Ma HL. The seroepidemiology survey and analysis on bluetongue of cattle and sheep in shanxi province. China Anim Health Inspect. (2016) 33:16–9. doi: 10.3969/j.issn.1005-944X.2016.09.006
43. Lv JH. Epidemiological Investigation on Bluetongue and Analysis on it's Transmission Media Distribution in Inner Mongolia. (Doctoral dissertation) Inner Mongolia Agricultural University, Hohho (2015).
44. Zhang SN. Seroepidemiological of Bluetongue Virus (BTV) Infection and Epizootic Haemorrhage Disease and Insect-Borne Identification in Inner Mongolia. (Doctoral dissertation) Inner Mongolia Agricultural University, Hohhot (2016).
45. Liang ZJ, Zhang ZZ. Report on the quarantine results of eight cattle diseases. Anim Quar China Anim Health Inspect. (1991) 6:18–20.
46. Li XC, Li TS. Study on the application of VP7-ELISA for the detection of bluetongue antibodies in serum samples in cattle and sheep II: application of VP7- ELISA for detection bluetongue antibodies. China Anim Quar. (2000) 17:24–5.
48. Han MH. The Epidemiological Investigation of Bluetongue Infected Cattles and Sheep in Inner Mongolia Areas in 2015 and the Preliminary Separation and Identification of Pathogeny. (Doctoral dissertation) Inner Mongolia Agricultural University, Hohhot (2016).
49. Lin HL. Investigation on the epidemic and distribution of Bluetongue in Xinjiang. (Doctoral dissertation) Xinjiang Agricultural University, Urumqi (2007).
50. Zhang XH, Ma ZY, Xiao Y, Wang BH. Serological survey of bluetongue of cattle and sheep. Chin J Prev Vet Med. (1993) 3:27.
51. Liang DJ, Lin ZY. Serological survey of bluetongue of cattle and sheep. Chin Vet Sci. (1992) 3:16–7.
52. He XL. Serological investigation of bluetongue disease in bovine and ovine in qinghai province. China Anim Health Inspect. (2011) 3:68–9.
53. Shi Q, Yuan LG, Pu JW, Li J. Seroepidemiological investigation of coronavirus disease and other diseases in Tianshan yak. Xinjiang Anim Husbandry. (2014) 10:31–2. doi: 10.3969/j.issn.1003-4889.2014.10.010
54. Ma JG, Zhang XX, Zheng WB, Xu YT, Zhu XQ, Hu GX. Seroprevalence and risk factors of bluetongue virus infection in tibetan sheep and yaks in tibetan plateau, China. BioMed Res Int. (2017) 2017:5139703. doi: 10.1155/2017/5139703
55. Wang Y. The Epidemiological Investigation of Bluetongue in Some Areas of Xinjing and Preliminary Separation Identification of Strains. (Doctoral dissertation) Xinjiang Agricultural University, Urumqi (2014).
56. Nu N, Zhang T, Liu S, Ding MY, Jin HJ, Chen YL. Survey on the epidemic status of three important arboviruses in cattle and sheep of Xinjiang. Grass Feeding Livestock. (2018) 191:65–8. doi: 10.16863/j.cnki.1003-6377.2018.04.013
57. Bai JY, Pei TY, Qi QH, Wang YZ, Yang YS, Liu BS. Seroepidemiological of bluetongue virus (BTV) infection in cattle. China J Vet Sci Tech. (1991) 5:16–7.
58. Zhao JX, Tao JL. Serological survey report of major epidemic diseases in large-scale beef cattle farms. Exp Study Online. (2018) 34:1–2.
59. Lv MN, Lin LQ, Chen QL. Epidemiology of bluetongue in Guangdong province. Chin J Prev Vet Med. (2015) 7:499–501. doi: 10.3969/j.issn.1008-0589.2015.07.03
60. Lin J, Bai AB, Hua J, Bin BF. Serological surveillance of bluetongue disease in domestic ruminants in Guangxi. J South Agri. (2012) 43:1580–3. doi: 10.3969/j.issn.2095-1191,2012.10.1580
61. Lin J, Tan SM, Bai AB, Cao YY, Rao GB, Wu JM. Epidemiological investigation of red feather disease and bluetongue infection in cattle and sheep of Guangxi. Chin J Prev Vet Med. (2014) 10:763–5. doi: 10.3969/j.issn.1008-0589.2014.10.05
62. Li YL, Zhang X, Mo HH, Wei JH, Zhuo GG. Serological survey of bluetongue infection in cattle and sheep of Guangxi. Guangxi J Anim Husbandry Vet Med. (1998) 2:16–7.
63. Deng JY, Peng L. Investigation on 10 kinds of epidemic diseases in cattle of Guangzhou. China J Vet Med. (1994) 20:34–5.
64. Huang JJ. Bluetongue virus (BTV) infection in beef cattle. Guangdong J Anim Husbandry Vet Sci Tech. (1999) 4:27.
65. Zhu YH. Red River State found bluetongue disease in cattle and sheep. Yunnan J Anim Husbandry Vet Med. (1989) 2:50.
66. Zhang MG, An Y. Serological survey of bluetongue disease in cattle and sheep in Panxi area. Shanghai J Anim Husbandry Vet Med. (2016) 5:39–40. doi: 10.3969/j.issn.1000-7725.2016.05.015
67. Yuan Y, Li QY, Zhang DZ, Wu RB, Shao B, Liu MQ. Serological investigation of bluetongue disease of cattle and sheep in western Chongqing. Chin J Vet Med. (2017) 09:44–6.
68. Luo XX, Ruan KL, Tang JG, Ding SZ. Diagnostic investigation report on 23 animal diseases. Heilongjiang Anim Husbandry Vet Med. (1999) 3:24–5.
69. Li SN, Deng EC, Cai JF, Deng YH, Li CL. Seroepidemiological survey of bluetongue disease in Xishuangbanna, Yunnan. Shanghai J Anim Husbandry Vet Med. (2018) 63:34–5. doi: 10.14170/j.cnki.cn31-1278/s.2018.04.012
70. He XF, Liu J, Liu J, Ruan ZX, Long DM. Seroepidemiological investigation report of cattle and sheep in Bijie. Chin Livestock Poultry Breeding. (2015) 5:10–1. doi: 10.3969/j.issn.1673-4556.2015.05.005
71. Kong DH, Niu BS, Niu YF, Yao PF, Zhang MX, Wang GX. Establishment of surveillance system and its epidemiological research on bluetongue. Yunnan J Anim Sci Vet Med. (2001) 4:9–10. doi: 10.3969/j.issn.1005-1341.2001.04.008
72. Wei YH, Leng JS, Huang YH, Chen RY. Serological survey of bluetongue disease in Funing county. Yunnan J Anim Sci Vet Med. (2017) 3:32–3.
73. Luo XS, Ruan KL, Xia FL. Seroepidemiological of bluetongue virus (BTV) infection in cattle and goat of Nayong County, Guizhou Province. China J Prev Vet Med. (1991) 4:34.
74. Yun JR, Lin SL, Wu HY, Kang ZH. Seroepidemiological report of bluetongue virus (BTV) infection in cattle and deer of Hainan Province. Anim Health Inspect. (1991) 10:21.
75. Cao XP. Seroepidemiological investigation of bovine bluetongue disease/mucosal disease and infectious rhinotracheitis. Chin J Vet Med. (2003) 9:37–8.
76. Han JM, Li K, Han ZQ, Li JK, Zhao XD, Xie RQ. Serological detection of bluetongue in yaks in Tibet and Hongyuan, Sichuan. Anim Husbandry Vet. (2015) 9:136–7.
77. Qu J, Gao JD. Seroepidemiological of bluetongue virus (BTV) infection in Naqu prefecture. China Anim Health Inspect. (2016) 33:15–6.
78. Suo LCT, Cai LA, Pu BCJ. Seroepidemiological of bluetongue virus (BTV) infection in cattle and sheep bluetongue disease of Xigaze, Tibet. Chin J Vet Sci Tech. (2012) 9:23–4. doi: 10.16656/j.issn.1673-4696.1990.09.019
79. Cao XP, Li CH, Li XL. Seroepidemiological of bluetongue virus (BTV) infection in cattle and sheep of chuxiong prefecture, Yunnan province. Contemporary. Anim. Husbandry. (2002) 4:23–4.
80. Xiao L, Wang ML, Niu MC, Wang JP, Gao L, Li HC. Seroepidemiological of bluetongue virus (BTV) infection in yak of Shangri-La, Songpan, Sichuan, and Zoige areas. Shanghai J Anim Husbandry Vet Med. (2011) 6:29–30.
81. Li J, Li K, Shahzad M, Han Z, Nabi F, Gao J. Seroprevalence of bluetongue virus in domestic yaks (bos grunniens) in tibetan regions of china based on circulating antibodies. Trop Anim Health Product. (2015) 47:1221–3. doi: 10.1007/s11250-015-0853-0
82. Duan YL, Mao HS, Liao DF, Kou ML, Li ZH, Wang Z, et al. The serologic investigation and viral isolation of bluetongue virus in Shangri-la in southwest china. Transbound Emerg Dis. (2019) 66:2353–61. doi: 10.1111/tbed.13292
83. Courtejoie N, Gina Z, Benoi TD. Bluetongue transmission and control in europe: a systematic review of compartmental mathematical models. Prev Vet Med. (2018) 156:113–25. doi: 10.1016/j.prevetmed.2018.05.012
84. Anthony S, Jones H, Darpel K. A duplex RT-PCR assay for detection of genome segment 7 (VP7 gene) from 24 BTV serotypes. J Virol Methods. (2007) 141:188–97. doi: 10.1016/j.jviromet.2006.12.013
85. Toussaint JF, Sailleau C, Breard E, Zientara S, Clercq KD. Bluetongue virus detection by two real-time rt-qpcrs targeting two different genomic segments. J Virol Methods. (2007) 140:115–23. doi: 10.1016/j.jviromet.2006.11.007
86. Liu ST. Comparative Study of Four Techniques for the Detection of Bluetongue Virus. (Doctoral dissertation) Yangzhou University, Yangzhou (2010). doi: 10.13140/RG.2.2.27199.00161
87. Zhang SN, Li HC, Zhu JB, Li L, Miao HS, Xiao L. Epidemiological survey and serotype identification of bluetongue disease and epidemic hemorrhagic fever in Inner Mongolia in 2015. China J Prev Vet Med. (2016)12:939–43.
88. Koumbati M, Mangana O, Nomikou K, Mellor PS, Papadopoulos O. Duration of bluetongue viraemia and serological responses in experimentally infected European breeds of sheep and goats. Vet Microbiol. (1999) 64:277–85. doi: 10.1016/S0378-1135(98)00255-7
90. Hou JQ, Li XN. The impact of China entry into the WTO on animal husbandry and the countermeasures. Issues Agri Econ. (2002) 23:27–30.
91. Wan Q. Current situation and countermeasures of animal epidemic prevention and control-learning from “National medium and long-term animal epidemic disease control plan (2012-2020)”. China Anim Health Inspect. (2013) 30:13. doi: 10.3969/j.issn.1000-6389.2002.05.007
92. Lobato Z, Guedes M, Matos A. Bluetongue and other orbiviruses in South America: gaps and challenges. Vet Ital. (2015) 51:253–62. doi: 10.12834/VetIt.600.2892.1
93. Kluiters G, Swales H, Baylis M. Local dispersal of palaearctic Culicoides biting midges estimated by mark-release-recapture. BioMed Central. (2015) 8:86. doi: 10.1186/s13071-015-0658-z
94. Scolamacchia F, van den Broek J, Meiswinkel R, Heesterbeek JAP, Elbers ARW. Principal climatic and edaphic determinants of Culicoides biting midge abundance during the 2007-2008 bluetongue epidemic in the Netherlands, based on OVI light trap data. Med Vet Entomol. (2014) 28:143–56. doi: 10.1111/mve.12028
95. Mellor PS, Boorman J, Baylis M. Culicoides biting midges: their role as arbovirus vectors. Ann Rev Entomol. (2000) 45:307–40. doi: 10.1146/annurev.ento.45.1.307
96. Tweedle N, Mellor PS. Technical Review-Bluetongue: The Virus, Hosts and Vectors. Version 1.5. Report to the Department of Health; Social Services and Public Safety U.K. (DEFRA) (2002), p. 25.
97. Malik AI, Ijaz MY, Tahir A, Muhammad S, Muhammad Z, Aslam HB. Sero-epidemiology of bluetongue virus (btv) infection in sheep and goats of khyber pakhtunkhwa province of Pakistan. Acta Trop. (2018) 182:207–11. doi: 10.1016/j.actatropica.2018.03.010
98. Maclachlan NJ. Global implications of the recent emergence of bluetongue virus in Europe. Vet Clin North Am Food Anim Pract. (2010) 26:163–71. doi: 10.1016/j.cvfa.2009.10.012
99. Cappaia S, Loia F, Coccollonea A, Contub M, Capecec P, Fioric M. Retrospective analysis of Bluetongue farm risk profile definition, based on biology, farm management practices and climatic data. Prev Vet Med. (2018) 155:75–85. doi: 10.1016/j.prevetmed.2018.04.004
100. Paweska JT, Venter GJ, Mellor PS. Vector competence of South African Culicoides species for Bluetongue virus serotype 1 (BTV-1) with special reference to the effect of temperature on the rate of virus replication in C Imicola and C. Bolitinos. Med Vet Entomol. (2002) 16:10–21. doi: 10.1046/j.1365-2915.2002.00334.x
Keywords: bluetongue virus, cattle, meta-analysis, China, seroprevalence
Citation: Gong Q-L, Wang Q, Yang X-Y, Li D-L, Zhao B, Ge G-Y, Zong Y, Li J-M, Leng X, Shi K, Liu F and Du R (2021) Seroprevalence and Risk Factors of the Bluetongue Virus in Cattle in China From 1988 to 2019: A Comprehensive Literature Review and Meta-Analysis. Front. Vet. Sci. 7:550381. doi: 10.3389/fvets.2020.550381
Received: 09 April 2020; Accepted: 11 December 2020;
Published: 28 January 2021.
Edited by:
Ioannis Magouras, City University of Hong Kong, Hong KongReviewed by:
Heinzpeter Schwermer, Federal Food Safety and Veterinary Office (FSVO), SwitzerlandWilliam C. Wilson, United States Department of Agriculture, United States
Copyright © 2021 Gong, Wang, Yang, Li, Zhao, Ge, Zong, Li, Leng, Shi, Liu and Du. This is an open-access article distributed under the terms of the Creative Commons Attribution License (CC BY). The use, distribution or reproduction in other forums is permitted, provided the original author(s) and the copyright owner(s) are credited and that the original publication in this journal is cited, in accordance with accepted academic practice. No use, distribution or reproduction is permitted which does not comply with these terms.
*Correspondence: Fei Liu, bGYxOTg5MDNAc2luYS5jb20=; Rui Du, ZHVydWkxOTcxMDFAc2luYS5jb20=