 Kangwook Lee1
 La Yoon Choi1Jun Sang Ahn2Jae Yong Song2Joong Kook Park2Suk Jun Yun2Jeong Heon Lee2
 Eui-Cheol Shin3
 Soo-Jin Yeom4
 Jiangchao Zhao5
 Tae Jin Cho1
 Nam Su Oh1
 Jeong-Oh Shin6
 Dahye Kim7Tae Gyun Kim8Hyung Taek Cho8Hyo Ri Shin1Young Jun Kim1
 Jae Kyeom Kim1,9*
- 1Department of Food and Biotechnology, Korea University, Sejong, Republic of Korea
- 2Nonghyup Feed, Seoul, Republic of Korea
- 3Department of GreenBio Science, Gyeongsang National University, Jinju, Republic of Korea
- 4School of Biological Sciences and Technology, Chonnam National University, Gwangju, Republic of Korea
- 5Department of Animal Science, Dale Bumpers College of Agricultural, Food and Life Sciences, University of Arkansas, Fayetteville, AR, United States
- 6Department of Anatomy, College of Medicine, Soonchunhyang University, Cheonan, Republic of Korea
- 7Animal Genomics and Bioinformatics Division, National Institute of Animal Science, Rural Development Administration, Wanju, Republic of Korea
- 8The Bioinformatix, Gwangmyeong, Republic of Korea
- 9Department of Behavioral Health and Nutrition, University of Delaware, Newark, NJ, United States
Introduction: The present study investigated the effects of antioxidant supplementation on the transcriptomic profiles of Hanwoo cattle during a 7-month feeding trial.
Methods: Twelve castrated Hanwoo cattle were randomly assigned to two groups: a control group (CON) and a group supplemented with antioxidants (FEED), consisting of vitamin C, vitamin E, and selenium. Growth performance and carcass traits were evaluated, and liver transcriptomic changes were assessed using RNA sequencing.
Results and discussion: While no significant differences were observed in phenotypic traits such as weight gain and feed conversion ratio, transcriptomic analysis identified 641 differentially expressed genes between the CON and FEED groups. Functional enrichment analysis revealed that differentially expressed genes were mainly associated with transcription regulation, pseudouridine synthesis, and mitochondrial function. These findings suggest that antioxidant supplementation elicits significant molecular changes in the liver, particularly affecting transcriptional activity and mitochondrial processes, even in the absence of detectable phenotypic differences.
1 Introduction
The cattle beef industry aims to reduce the fattening period considering several factors such as feed costs and turnover rates of livestock. However, shortening the fattening period has led to a decrease in total animal weight and intramuscular fat (also known as marbling), resulting in reduced farm income. It has been reported that the status of intracellular antioxidants, such as vitamin C, influences the proliferation and differentiation of fat cells and exhibits antioxidant effects by scavenging reactive oxygen species (1). Antioxidants, including vitamin C, play pivotal roles not only in enhancing marbling and beef quality but also in modulating physiological processes at the molecular level. These molecular changes may have broader implications for improving the overall health and productivity of beef cattle. For instance, Pogge et al. (2) found that supplemental vitamin C improved marbling scores in feedlot cattle consuming high sulfur diets. The study suggested that vitamin C might protect protease μ-calpain, which is involved in muscle tenderness, and improve the fatty acid profile of the meat by increasing omega-3 and omega-6 fatty acids and decreasing saturated fatty acids (3). Also, it was reported that stress and disease conditions can decrease the levels of ascorbic acid in blood and other tissues while supplementation with vitamin C has been shown to have favorable responses, such as early recovery from stress and disease [reviewed in (4)]. Furthermore, in fattening cattle, as age increases, the endogenous synthesis levels of vitamin C decrease, necessitating supplementation of antioxidants for feeding beef cattle (4).
The transcriptome encompasses the complete set of RNA molecules, including messenger RNA, non-coding RNA, and other functional RNA species, present in a biological sample at a specific point in time. RNA sequencing (RNA-seq) is a powerful molecular biology technique used to analyze and quantify the transcriptome (5). Combined with bioinformatics analyses, transcriptomics can uncover previously unknown pathways, potential druggable targets, and biomarkers involved in tissue-specific responses to various interventions, as we previously reported (6). In this study, we employed RNA-seq as an unbiased and comprehensive method to investigate the effects of supplementation of antioxidants on transcriptomic signatures in the liver of Hanwoo cattle. The liver was selected for transcriptomic analysis due to its pivotal role in metabolism, nutrient processing, and stress response, which are directly influenced by antioxidant supplementation. While meat quality is the primary focus in beef production, hepatic transcriptomic profiling offers systemic insights that could indirectly impact muscle development and overall beef quality. In conjunction with the hepatic transcriptomic signature, we have assessed the growth performance and carcass characteristics of Korean fattening cattle according to the feed administered.
2 Materials and methods
2.1 Hanwoo cattle intervention study
The entire study was conducted at the Nonghyup Feed Anseong farm, utilizing a total of 12 castrated Hanwoo cattle in the late fattening stage (23 months old). The initial average animal weight was 693.6 ± 61.2 kg. For the feeding trial, the Hanwoo cattle were randomly divided into two groups: the control group (CON, n = 6) and the antioxidants supplemented group (FEED, n = 6). The animals were housed in pens with four cattle per pen, and commercial feeds were provided twice daily (at 8 AM and 4 PM) according to the feed manufacturer’s program, which included mixed feed and roughage. The antioxidant supplementation was top-dressed at 50 g per animal during feedings. Within the 50 g serving, vitamin C made up 99.33%, followed by vitamin E (0.63%) and organic selenium (0.04%). The fixed dosage of 50 g per animal was selected based on supplementation ranges (30–50 g per animal) recommended by the feed manufacturer. This dosage was determined to ensure sufficient antioxidant intake while maintaining safety and consistency across all subjects. Water was freely available. Other management practices followed the farm’s standard protocols. The nutritional composition of the control feeds is presented in Table 1. All the cattle were sacrificed at their age of 30 months.
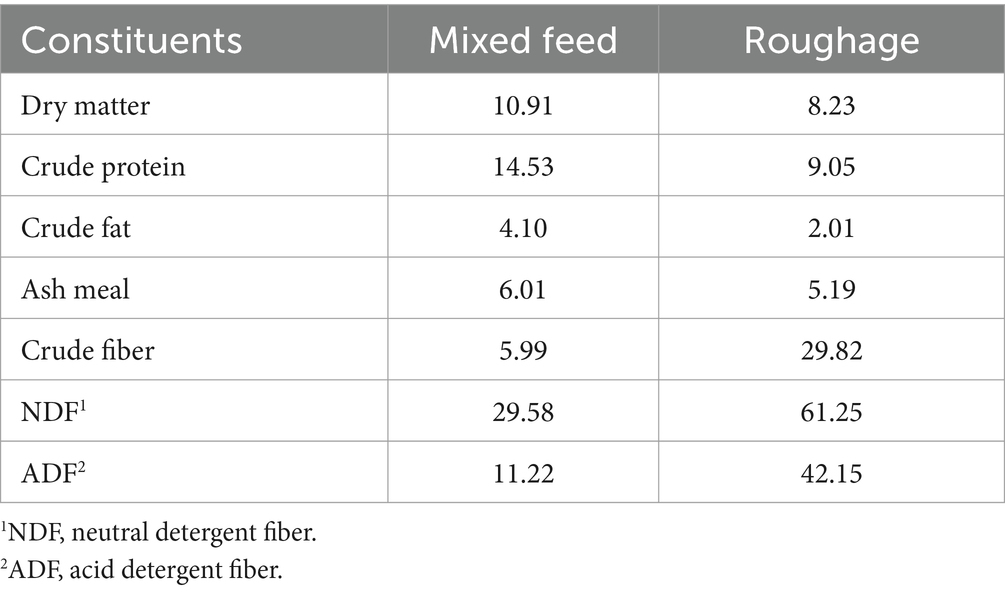
Table 1. Compositions of control feed (contents based on raw materials).
2.2 Growth performance
Body weight was measured monthly before morning feeding using a digital cattle scale, and average daily gain was calculated using the weight gain and number of days reared. Feed intake was calculated monthly for three consecutive days based on the difference between the amount of mixed feed and roughage provided and the leftover, and feed conversion ratio was calculated using dry matter intake and daily gain.
2.3 Ultrasound biometric analysis and other characteristics
Ultrasound biometric analyses were conducted at the same sites used for carcass grading (between the last thoracic and first lumbar vertebrae) using ultrasound tomography equipment (set up for 3.5 Hz and180 mm; Honda Electronics, Tokyo, Japan) to evaluate intramuscular fat, ribeye area, and backfat thickness of the animals. After, all animals were shipped to the slaughterhouse at the end of the feeding trial and evaluated by a meat grading professional according to the Livestock Product Grading Standards. Carcass traits were assessed on chilled carcasses 24 h post-slaughter and classified into meat quality and yield grades.
2.4 RNA extraction, library construction, and RNA sequencing
To evaluate the transcriptomic changes in Hanwoo cattle fed with antioxidants supplements, liver tissues (approximately 50 g per animal) were collected for RNA extraction using the RNeasy mini kit (Qiagen), following the manufacturer’s instructions. DNase I (Qiagen) was used for on-column DNase digestion to eliminate any potential genomic DNA contamination during RNA purification. The quality of the extracted RNA was verified using the RNA Nano 6000 Assay kit and the Bioanalyzer (Agilent Technologies; Santa Clara, CA, USA). For library preparation, the total RNA was fragmented and converted into cDNA. This cDNA underwent end repair, A-tailing, and ligation with indexed adapters. The resulting product was PCR amplified and the cDNA fragments were cleaned up using gel purification to remove any remaining primers and adapters. Transcriptome sequencing was performed on the Illumina NovaSeq platform, generating 150 bp paired-end reads.
2.5 Raw data processing
The FASTQ files were first trimmed using the Trimmomatic software. The trimmed FASTQ files were then subjected to FASTQC software to ensure quality of individual raw data is good for further data processing. Afterwards, trimmed FASTQ files were indexed and mapped using the Hisat2. Subsequently, read count was acquired using the FeatureCounts software, followed by differential gene expression analysis using DESeq2 software in R package. DESeq2’s median of ratios was applied to differential gene expression analysis as a scaling normalization method.
2.6 Differentially expressed genes (DEG) analysis
The DEG list was produced using the DESeq2 R package, operating under the assumption that there are no differentially expressed genes. The data normalization involved using the median of ratios method, where counts are divided by sample-specific size factors, these being determined by the median ratio of gene counts to the geometric mean per gene. For this study, we aimed to include as many genes as possible for comprehensive bioinformatics analyses thus the default threshold set was p < 0.05 without considering their basal gene expression counts and fold changes between groups.
2.7 Volcano plot and heatmap analyses
The transcriptomics datasets were first subjected to univariate analyses for exploratory data examination and visualized through volcano plots. Furthermore, to illustrate the relationships between variable sets, multi-dimensional scaling analysis was employed, aiding in the detection of both similarities and differences. Subsequent analyses produced concise mRNA lists, identified as DEGs for Hanwoo cattle liver tissues, using the EdgeR tools in R under the premise of no differential gene expression. The EdgeR method adjusts the data by employing the trimmed mean of M-values, calculated as the weighted average of log-ratios between the test and reference samples, excluding the most highly expressed genes and those with the largest log-ratios.
The identified DEGs were also utilized to generate heatmap visualization with hierarchical clustering analysis (HCA). In the HCA, each sample begins as a separate cluster and the algorithm proceeds to combine them until all samples belong to one cluster. Two parameters need to be considered when performing hierarchical clustering. The first one is the similarity measure - Euclidean distance, Pearson’s correlation, and Spearman’s rank correlation. The other parameter is clustering algorithms, including average linkage (clustering uses the centroids of the observations), complete linkage (clustering uses the farthest pair of observations between the two groups), single linkage (clustering uses the closest pair of observations), and Ward’s linkage (clustering to minimize the sum of squares of any two clusters). Heatmap is often presented as a visual aid in addition to the dendrogram. Hierarchical clustering with a heatmap is presented below to visualize the differences between the CON and FEED groups.
2.8 Statistical analyses and bioinformatics analyses
Enrichment analyses were conducted on the DEGs from the dataset using Gene Ontology (GO) tools and Kyoto Encyclopedia of Genes and Genomes (KEGG) pathway analysis. Despite using the same DEGs, different databases might highlight various pathways differently based on their specific data and algorithms. The significance of enriched GO terms and KEGG pathways was assessed using adjusted p-values (q-values) calculated by the Benjamini-Hochberg method, with a false discovery rate (FDR) threshold of <0.05 applied to ensure statistical robustness. Our enrichment analysis concentrated on the three main GO categories: biological processes (GO_BP), cellular components (GO_CC), and molecular functions (GO_MF), and incorporated pathways from the KEGG. Statistical analyses for other phenotype indicators were performed using GraphPad Prism software (Boston, MA, USA). The Shapiro–Wilk test was utilized to determine if the data adhered to a normal distribution. For data that deviated from normality, the Mann–Whitney test was applied. In contrast, data that conformed to a normal distribution were analyzed using a two-tailed unpaired Student’s t-test with Welch’s correction. Data were presented as mean ± standard deviation (SD), and findings were deemed statistically significant when p-values were below 0.05.
3 Results and discussion
3.1 Impacts of antioxidant supplementation on phenotypic characteristics in Hanwoo cattle
First the weight gain per day and feed conversion ratio were assessed. The CON and FEED groups had similar weight gain (0.59 ± 0.12 kg/day vs. 0.61 ± 0.05 kg/day) and feed conversion ratio (16.0 ± 3.25 kg feed/kg gain vs. 15.8 ± 1.14 feed/kg gain) both of which were not statistically different (p > 0.05 for both; Figure 1). In addition, other meat quality parameters were assessed including intramuscular fat, meat color, fat color, texture, maturity, backfat thickness, ribeye area, carcass weight, and meat mass index (Figure 1); all the parameters were not different between the CON and FEED groups (p > 0.05 for all parameters). The current study observed that the weight gain per day and feed conversion ratio were not significantly different between the control group and the group supplemented with antioxidants (i.e., FEED group). This aligns with findings from similar research. For instance, the effects of vitamin E supplementation on beef cattle were investigated yet there were no significant differences in disease incidence, immune competence, or weight gain when comparing high and normal vitamin E status, suggesting that excess vitamin supplementation may not always yield performance benefits at least on phenotype levels (7).
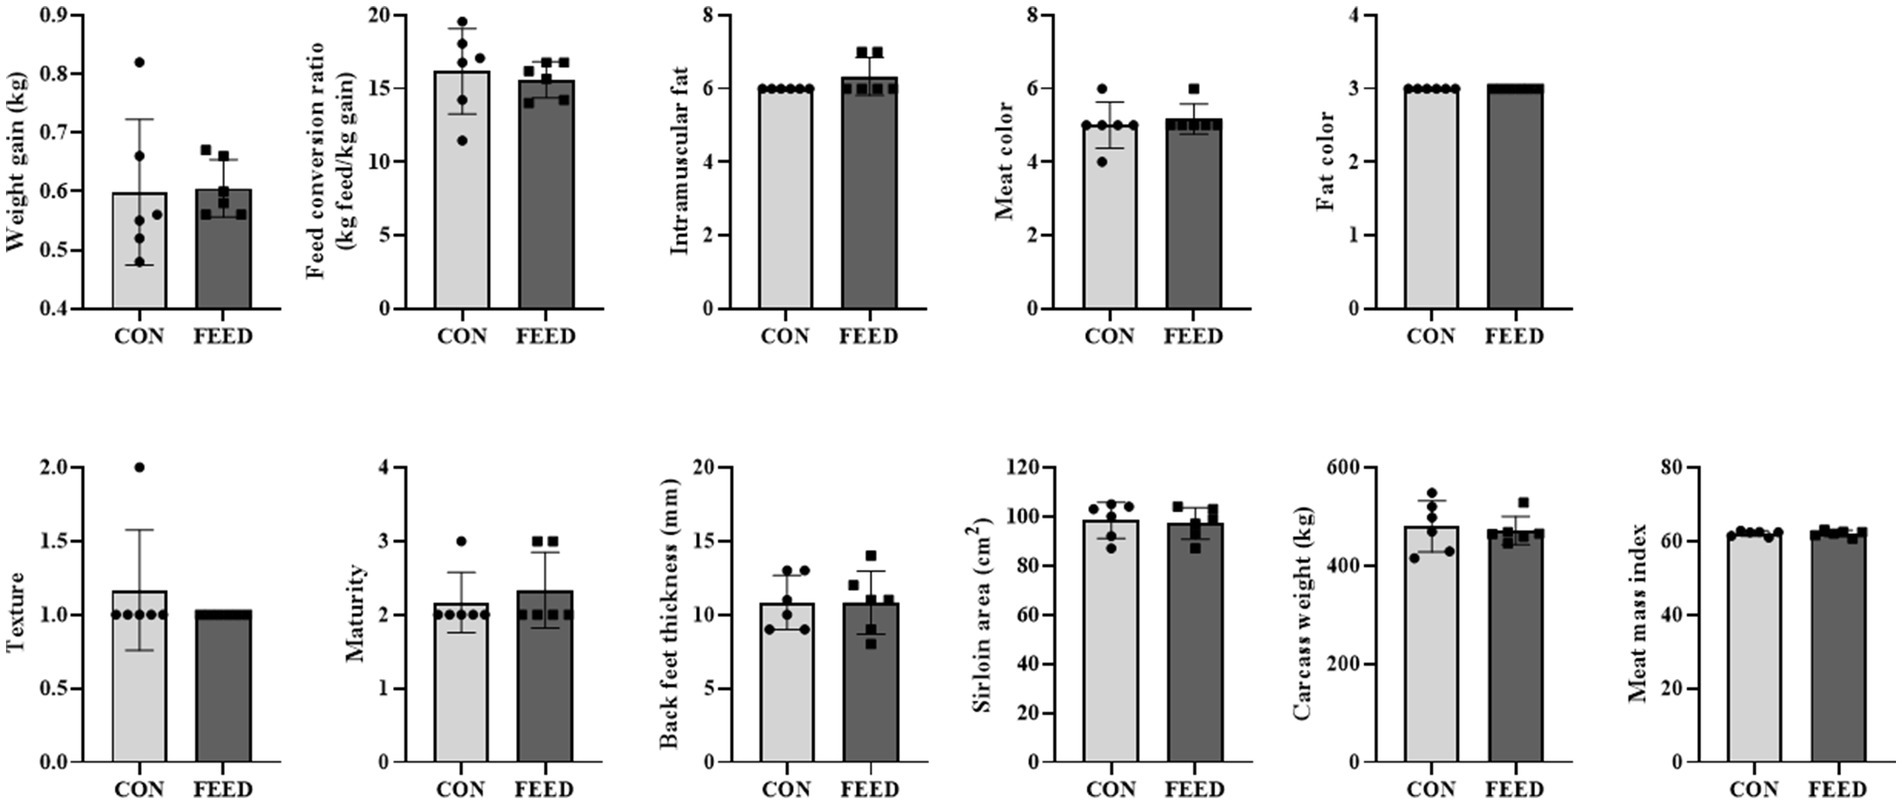
Figure 1. Comparison of phenotypic traits across different dietary intervention groups in Hanwoo cattle. Comparative analysis of weight gain, feed conversion ratio, intramuscular fat content, meat color, fat color, texture, maturity, black feet thickness, sirloin area, carcass weight, and meat mass index among cattle subjected to varying dietary interventions. The Shapiro–Wilk test was used to assess normality, and the significance of differences was assessed using an unpaired two-tailed Student’s t-test with Welch’s correction for adjustments. No statistically significant differences were observed across the tested concentrations. Data are presented as means ± standard deviations (n = 6). CON, Hanwoo cattle fed a standard diet; FEED, Hanwoo cattle fed a standard diet supplemented with antioxidants.
3.2 RNA extraction and sequencing quality control
In order to monitor quality of our sequencing, first we checked the RNA quality where all the samples’ RNA integrity number (also known as RIN) were higher than 7.00 (Supplementary Table S1). RNA concentrations as well as purity results (as assessed via 260/230 and 260/280) were also satisfactory. After, the sequence error rate was calculated using the Phred score where Phred scores 10, 20, 30, and 40 correspond to 10, 1, 0.1, and 0.01% error rates. Following the paired-end transcriptome sequencing analysis of 12 samples, results for all samples fell within the anticipated range. The Supplementary Table S2 shows the raw and processed reads for each sample, categorized by total data volume and Q30 (Phred score for base quality), demonstrating metrics that exceed a value of 30 (Supplementary Table S2).
3.3 DEG establishment, volcano plot, and heatmap analyses
As aforementioned, we established the DEG based on p-value which resulted in a total of 641 genes for further downstream analyses. A complete list of gene is provided in the Supplementary Table S3. To visualize the distribution of the DEG, the volcano plot was constructed in which 343 genes were upregulated while 298 genes were downregulated in the FEED group (Figure 2). Next, the heatmap shows the hierarchical clustering of the DEG, providing a visual representation of the expression patterns across samples (Figure 3). As shown, the heatmap reveals distinct clustering of gene expression profiles between the CON and FEED groups, indicating a clear separation in response to antioxidants supplementation. Such results reinforce that although there seem no noticeable changes in phenotypic parameters, biological impacts must have been elicited at a transcriptional level. The combined analysis of the volcano plot and heatmap suggests that the treatment induces significant changes in gene expression that warrants further bioinformatics analyses. However, it is important to note that the threshold applied for DEG identification in this study, |log2(fold change)| > 0 with p-value ≤0.05, was intentionally set to be inclusive. This liberal approach may result in the inclusion of genes with minimal fold changes, which could potentially limit the biological significance of some findings. Despite this limitation, our objective was to create a robust transcriptomic dataset that captures subtle yet meaningful gene expression changes for comprehensive analysis.
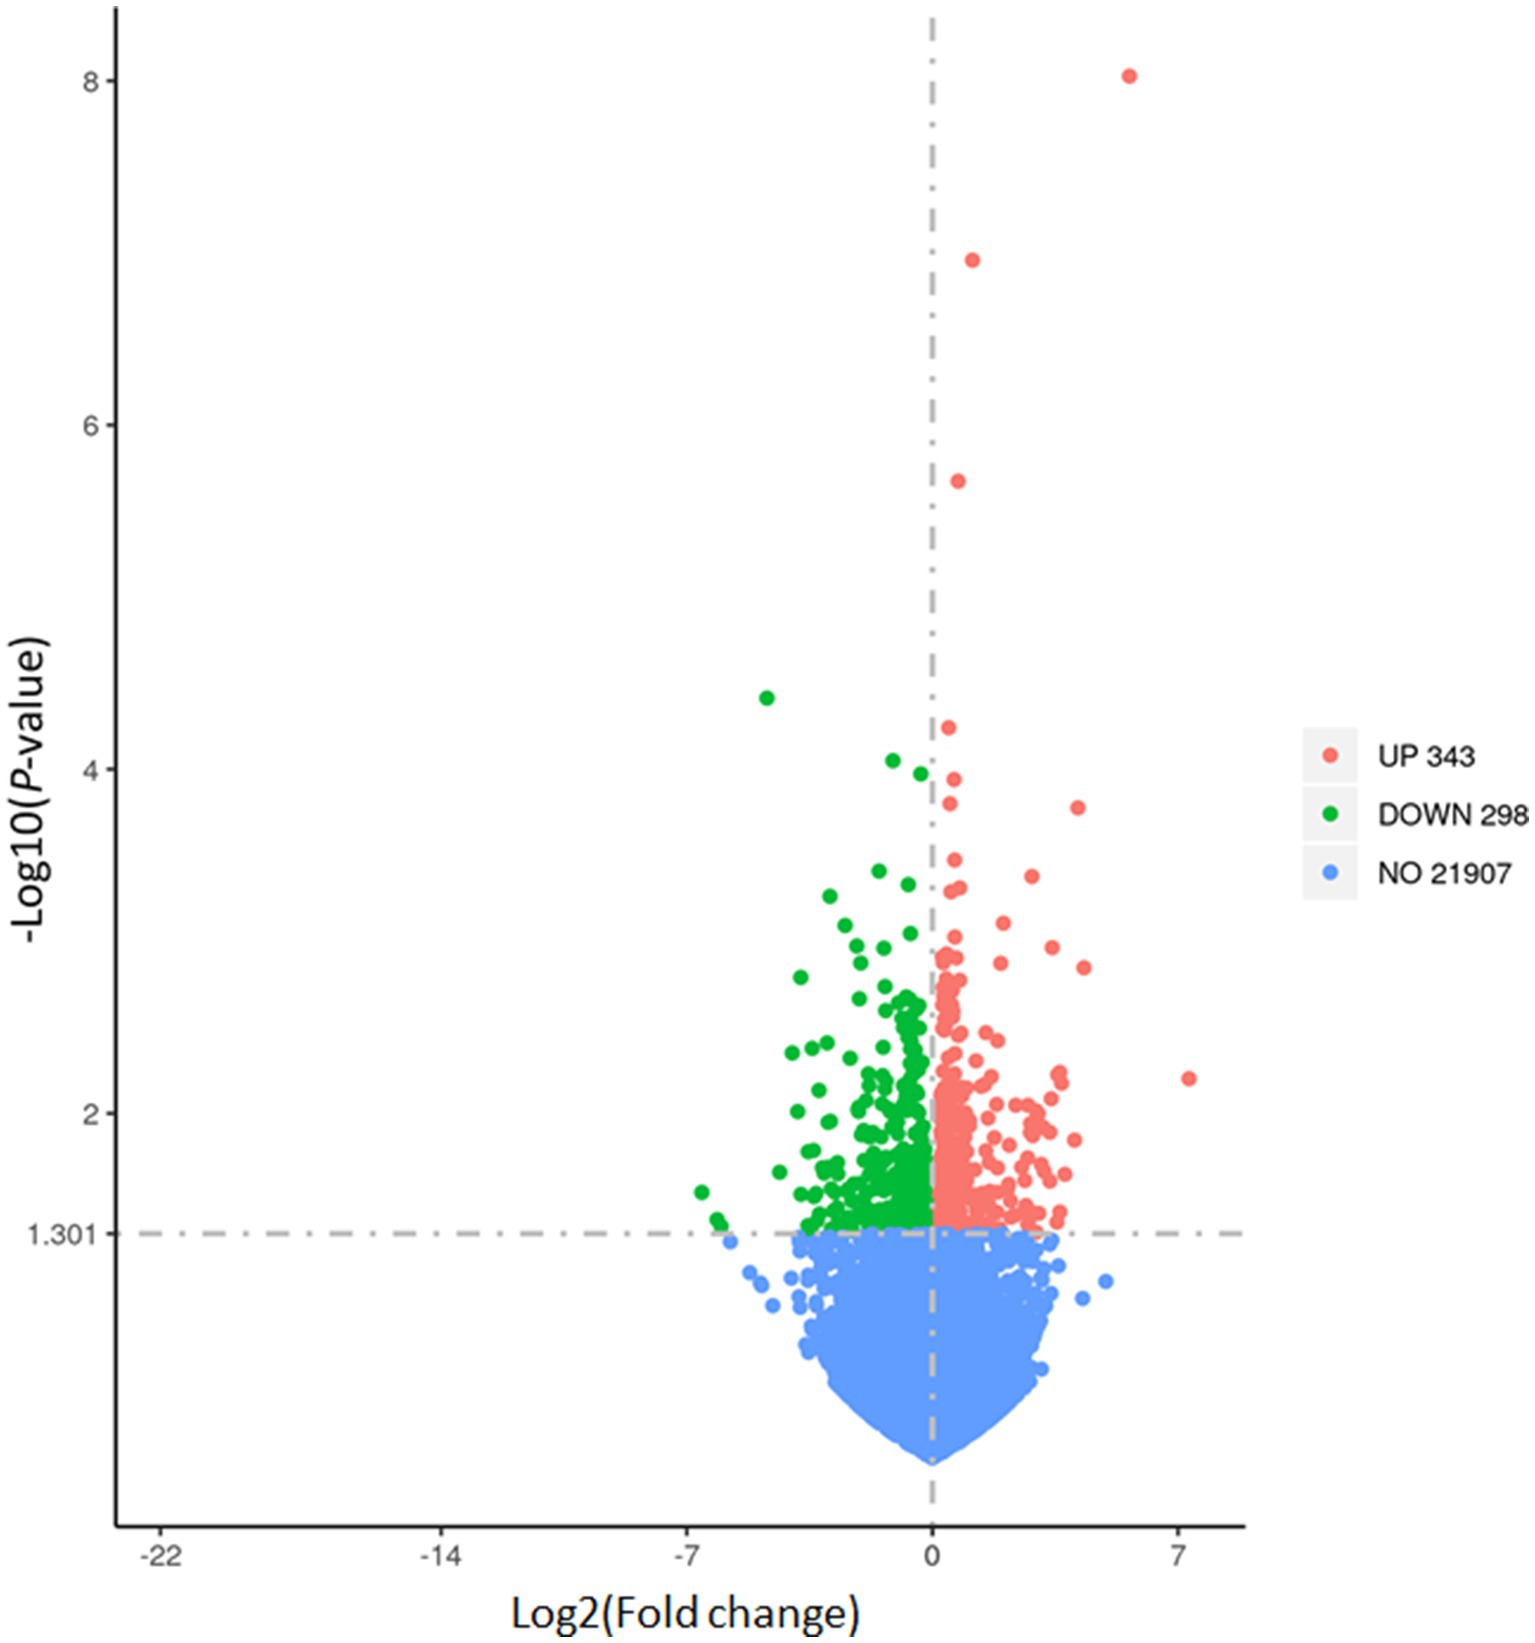
Figure 2. Volcano plot of differential gene expression (DEG) in liver tissues of Hanwoo cattle fed with different dietary intervention. The vertical axis (y-axis) corresponds to the –log10 (False discovery rate), and the horizontal axis (x-axis) displays the log2 fold change (logFC) value. Each point represents an individual gene, plotted by log2 fold change on the x-axis and −log10 p-value on the y-axis. Genes significantly upregulated in the treatment group compared to the control group are depicted in red on the right, while those significantly downregulated are shown in green on the left. The horizontal dashed line indicates the threshold for statistical significance (p < 0.05), and the vertical dashed lines mark the cut-off for log2 fold change. DEG, differential gene expression.
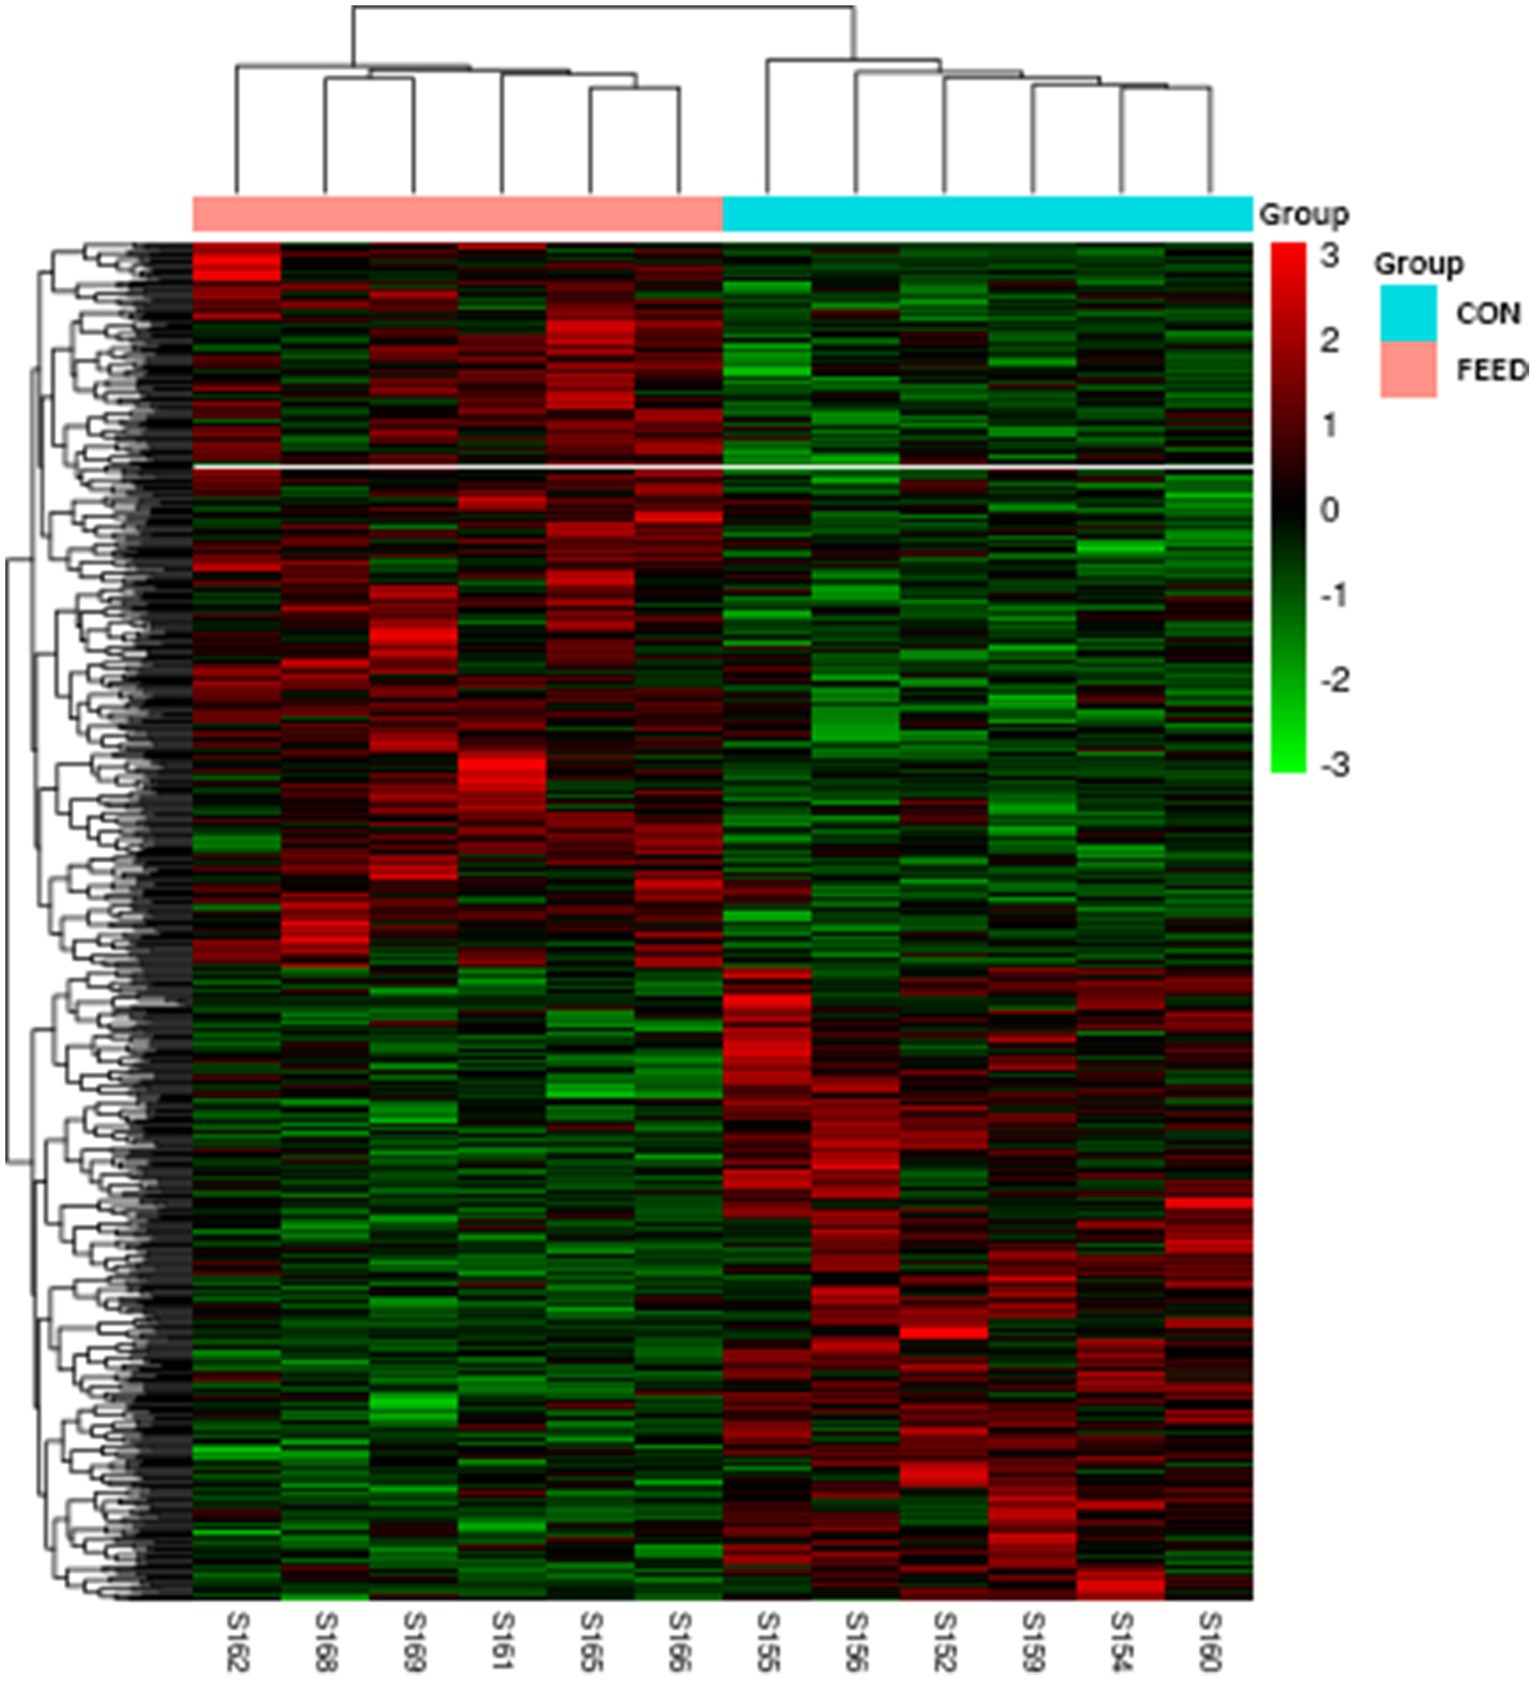
Figure 3. Heatmap with hierarchical clustering analysis for DEG in liver tissues of Hanwoo cattle fed with different dietary intervention. Rows represent individual genes, while columns correspond to samples from each group. The color scale indicates the expression levels of the genes, with red representing upregulated genes and green representing downregulated genes. The hierarchical clustering dendrograms on the top and side of the heatmap demonstrate the similarity between samples and genes, respectively, grouping them based on their expression patterns. CON, Hanwoo cattle fed a standard diet; DEG, differential gene expression; FEED, Hanwoo cattle fed a standard diet supplemented with antioxidants.
3.4 Enrichment analyses: GO terms
Gene GO term enrichment analysis is to highlight the most relevant GO terms (in this study, GO_BP, GO_MF, and GO_CC) associated with a given gene list. Statistically significant terms (p < 0.05) enriched the most in the DEG are shown (Tables 2–4). In this, three different methods were applied to calculate a false null hypothesis (i.e., Bonferroni, Benjamini, FDR). As results, in the GO_BP enrichment, no term passed the false null hypothesis; thus, gene count and raw p-values were utilized for the GO analysis in which ‘GO:0006357 ~ regulation of transcription from RNA polymerase II promoter,’ ‘GO:0045944 ~ positive regulation of transcription from RNA polymerase II promoter,’ and ‘GO:0010629 ~ negative regulation of gene expression’ were enriched the most (Table 2). In this, although none of the GO_BP was significant after adjusting the FDR (as well as Bonferroni, and Benjamini). Overall, it seems that the intervention of antioxidants impacted genes related RNA polymerase II regulation in the Hanwoo cattle liver.
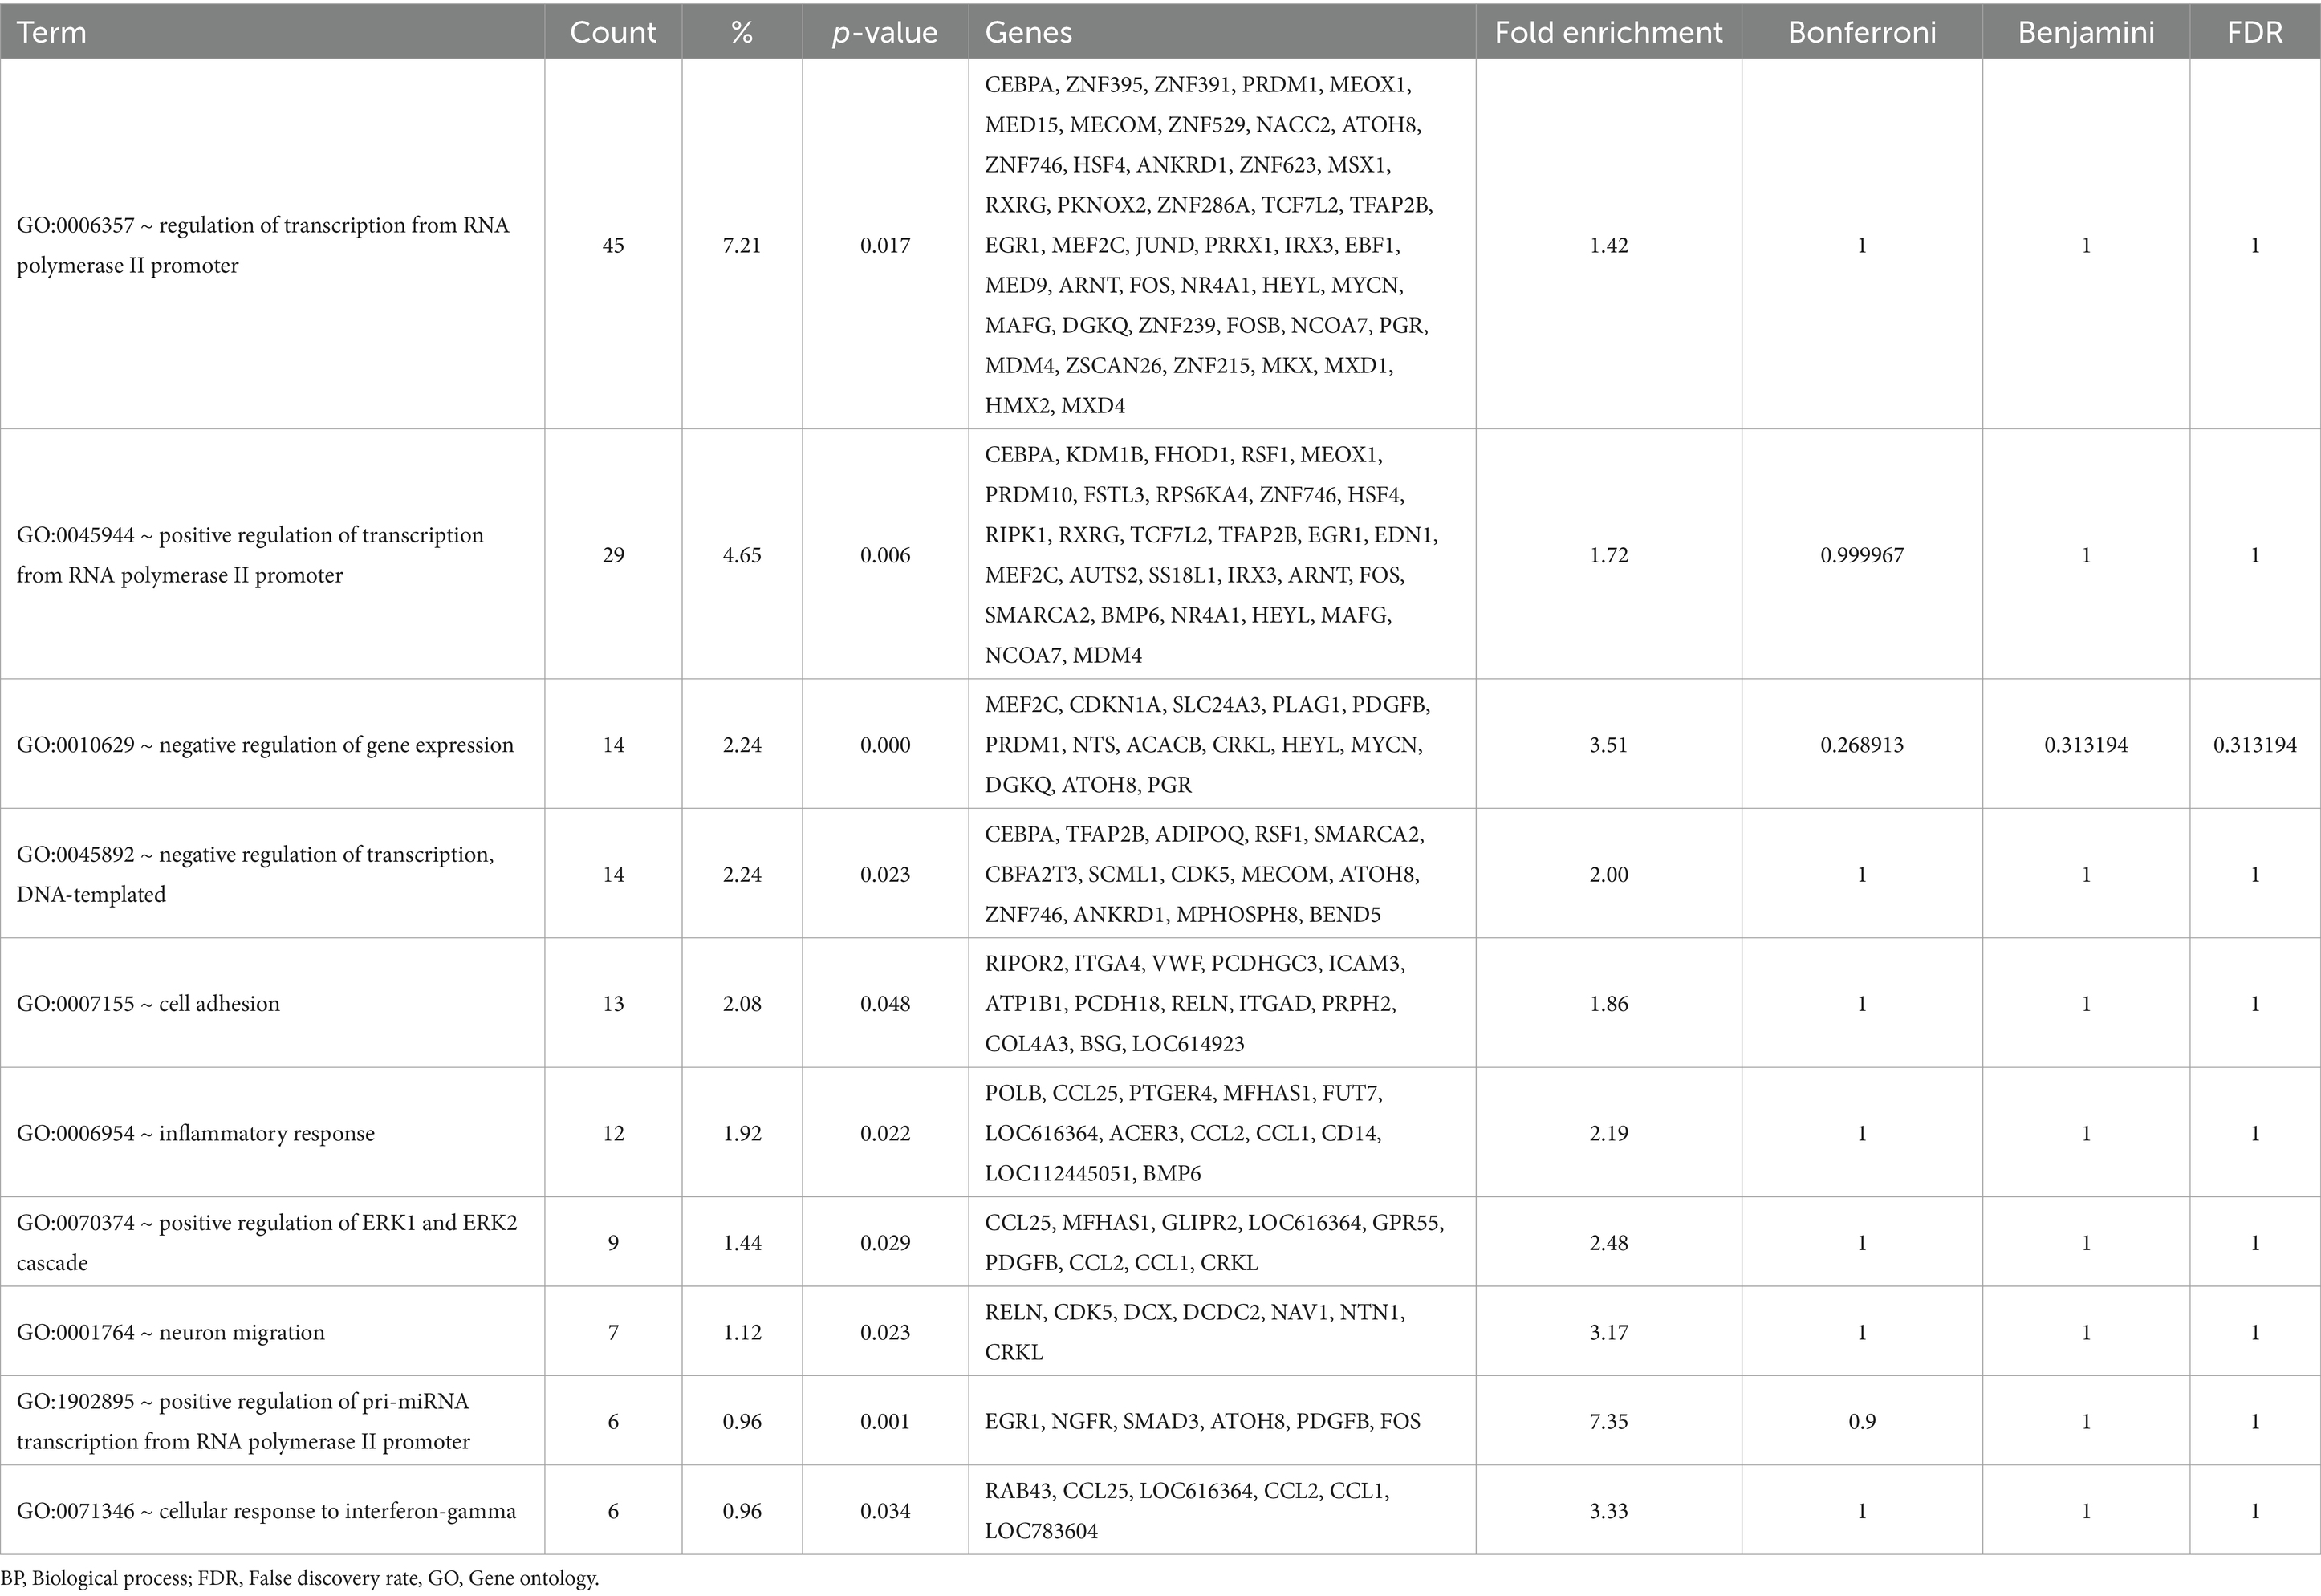
Table 2. Gene Ontology (GO) – Biological Process (BP) terms enriched in the liver by the antioxidants intervention.
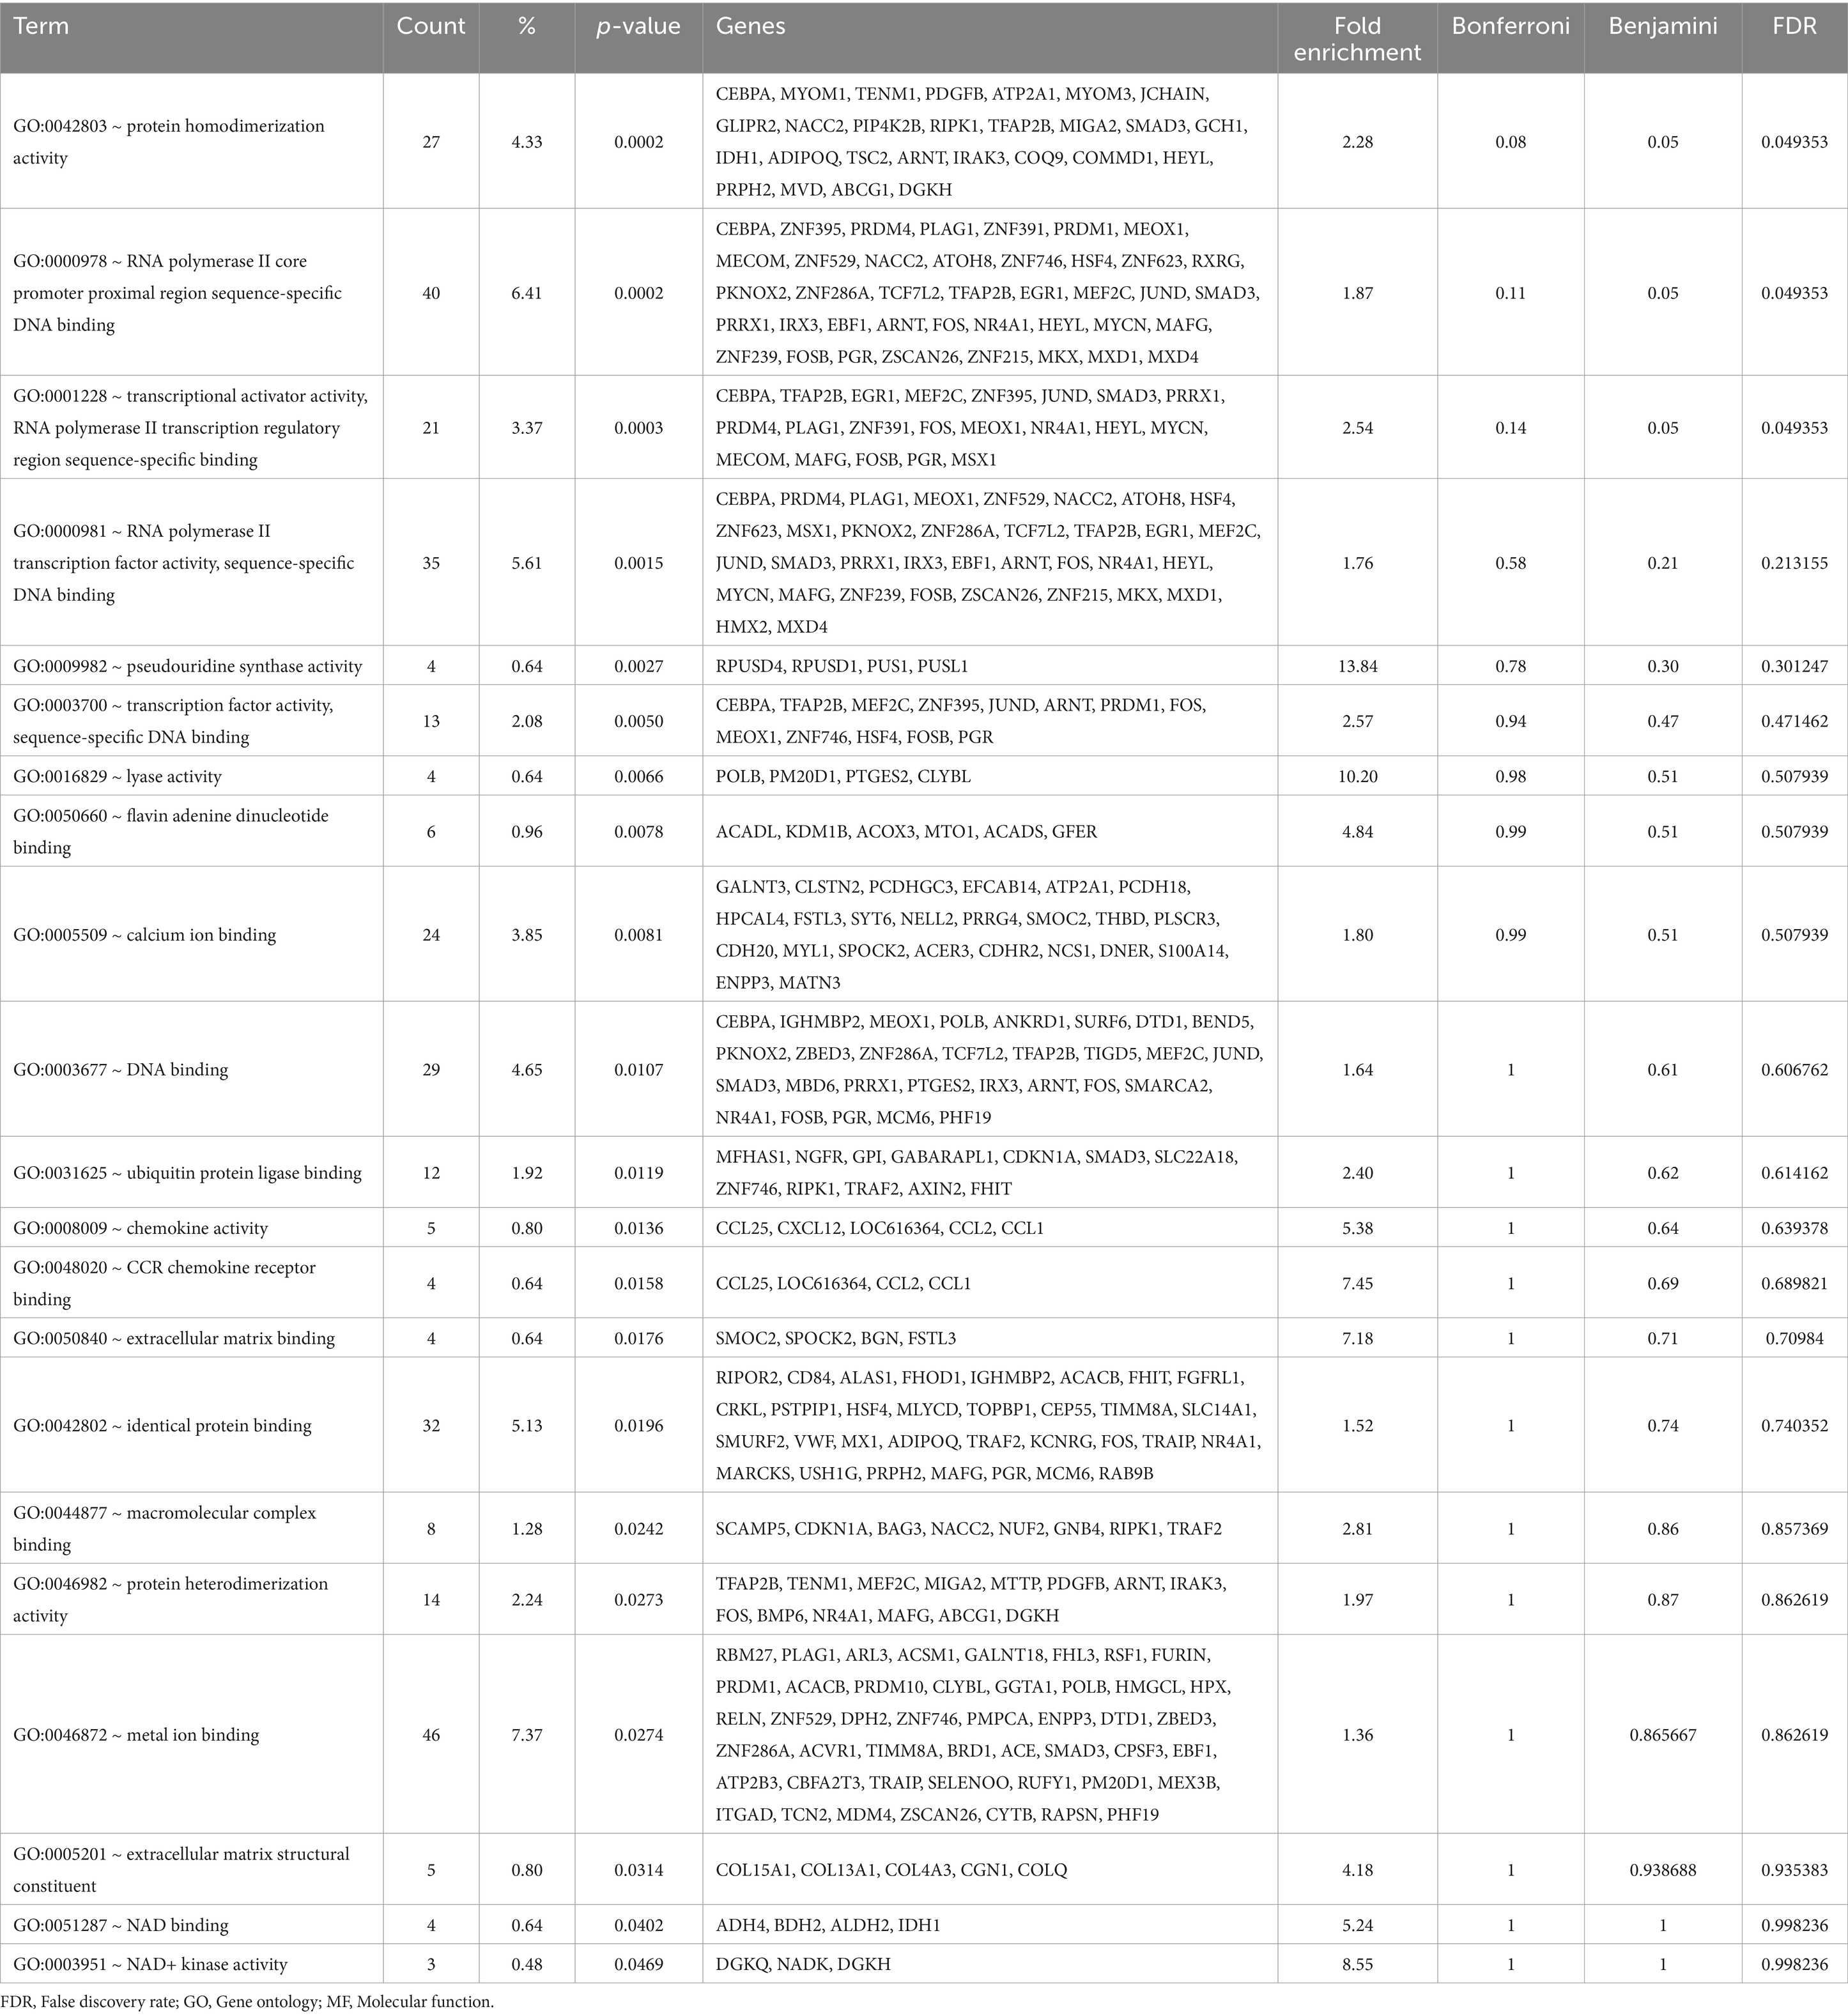
Table 3. Gene Ontology (GO) – Molecular Function (MF) terms enriched in the liver by the antioxidants dietary intervention.
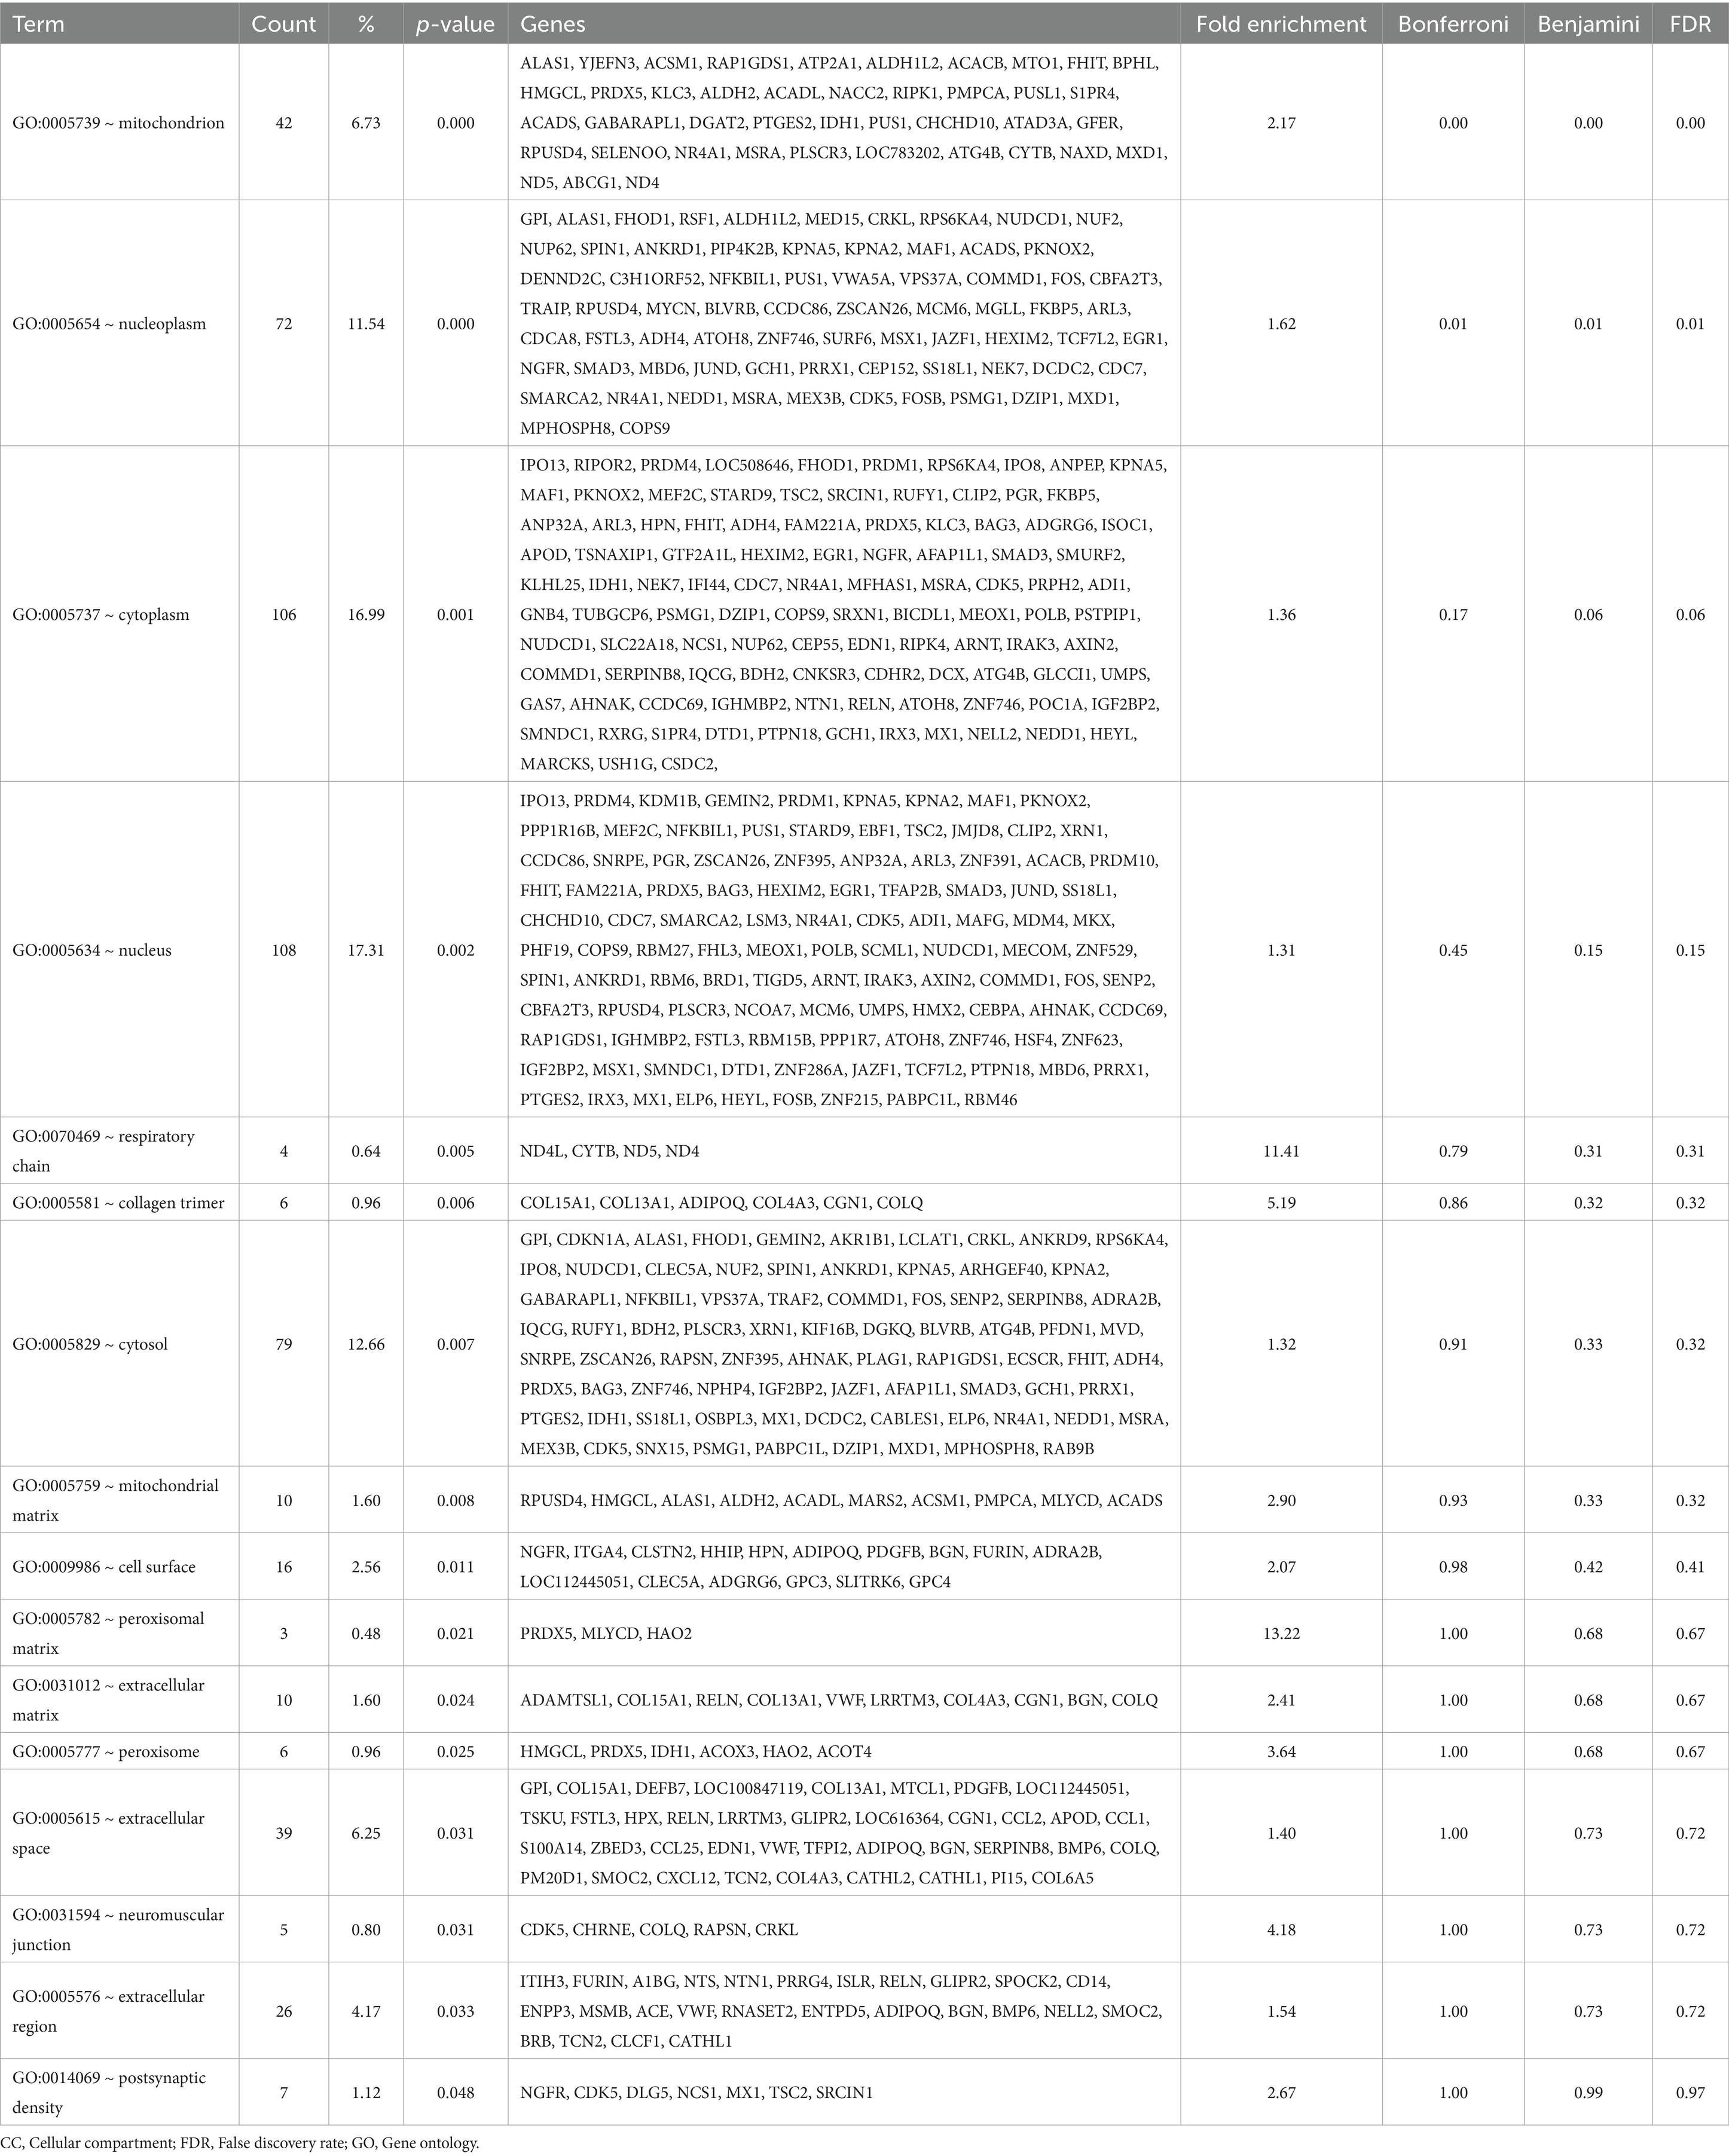
Table 4. Gene Ontology (GO) – Cellular Compartment (CC) terms enriched in the liver by the antioxidants dietary intervention.
Second, GO_MF was explored where a few MF were significant after adjusting FRD. Specifically, ‘GO:0042803 ~ protein homodimerization activity,’ ‘GO:0000978 ~ RNA polymerase II core promoter proximal region sequence-specific DNA binding,’ and ‘GO:0001228 ~ transcriptional activator activity, RNA polymerase II transcription regulatory region sequence-specific binding’ were significantly enriched in the DEG after the intervention. Similar to the GO_BP, the GO_MF results indicate that the antioxidant intervention might have influenced the transcriptional regulation (GO:0000978l and GO:0001228; Table 3). On the other hand, specifically looking at the genes related to the ‘GO:0042803,’ a few key biological functions might be impacted by the intervention such as signal transduction/transcription regulation (SMAD3, ANRT, HEYL, and TRAP2B), metabolic processes (IDH1, GCH1, TSC2, and MVD), and cell survival (RIPK1, and IRAK3; Table 3).
Lastly, GO_CC was investigated to find if specific cellular compartments are impacted compared to the others. As shown in the Table 4, the GO:0005739 ~ mitochondrion was enriched the most with the fold enrichment of 2.17 followed by nucleoplasm and cytoplasm all of which were statistically significant after FDR adjustments (Table 4). With the list of genes enriched in the GO:0005739 ~ mitochondrion, one can expect that multiple biological functions might be impacted by the intervention in the liver mitochondria including mitochondrial dynamics and lipid metabolism. Specifically, ATAD3A gene encodes a mitochondrial membrane protein involved in a wide array of processes including mitochondrial dynamics, nucleoid organization, and cholesterol metabolism and mutations in ATAD3A can lead to neurological disorders by disrupting mitochondrial structure, leading to increased mitophagy and impaired energy production (8, 9). Similarly, RIPK1 is known for its role in regulating cell death, particularly necroptosis, RIPK1 also influences mitochondrial function by modulating reactive oxygen species (ROS) production (10, 11). In contrast, dysregulation of RIPK1 can result in excessive oxidative stress, leading to mitochondrial dysfunction. Interestingly, in our condition, the antioxidant intervention has increased gene expression of mitochondrial RIPK1 (≈120% increase compared to the CON group; p-value = 0.019; Supplementary Table S3). In addition, lipid metabolism is crucial for energy storage, membrane synthesis, and signaling (12). Specifically, ACACB gene encodes an enzyme involved in fatty acid metabolism by regulating the conversion of acetyl-CoA to malonyl-CoA, a key step in fatty acid biosynthesis (13). In our DEG list, the ACACB gene was increased in the FEED group compared to the CON group (≈158% increase compared to the CON group; p-value = 0.035; Supplementary Table S3). Nonetheless, overall changes in specific genes shown at the hepatic RNA level were not aligned with muscle phenotypes such as intramuscular fat content (Figure 1).
Likewise, the gene ELOVL5 expression was increased in the FEED group compared to the CON group (≈160% increase compared to the CON group; p-value = 0.001; Supplementary Table S3); the gene is involved in the elongation of long-chain fatty acids. This gene plays a crucial role in fatty acid metabolism by extending the carbon chain length of polyunsaturated fatty acids, which are important for lipid biosynthesis. Specifically, ELOVL is essential for producing long-chain fatty acids, which contribute to cell membrane composition, signaling, and lipid storage (14). In livestock, the ELOVL gene, which is activated by transcription factors including KLFs, have been associated with differences in intramuscular fat content and overall meat quality due to its impact on lipid metabolism (15). Again, however those specific genetic markers were not able to fully explain the phenotypic characteristics of Hanwoo beef cattle.
3.5 Functional annotation clustering
Additionally, functional annotation clustering was carried out which reports groups similar annotations together. The grouping algorithm is based on the hypothesis, and similar annotations should have similar gene members; the more common genes annotations share, the higher chance they will be grouped together. The enrichment score, the geometric mean (in-log scale) of members’ p-values in a corresponding annotation cluster, is used to rank their biological significance. Thus, the top-ranked annotation groups most likely have lower p-values for their annotation members. Here we provide heat maps of the clusters (i.e., clusters with the top 3 highest enrichment scores; Figures 4a–c). In the first cluster with the highest enrichment score (2.86), included terms were ‘GO:0000978,’ ‘GO:0001228,’ ‘GO:0000981,’ ‘KW-0283,’ and ‘GO:0006357,’ all of which were related with transcription regulation (Figure 4a). This enrichment in transcription regulation is particularly significant in the liver, a central organ for metabolism and homeostasis. Hepatic transcriptional regulation governs the expression of genes involved in critical processes such as lipid metabolism, detoxification, and energy production. For instance, disruptions in transcription factors, including those related to RNA polymerase II activity, can lead to metabolic disorders and impaired liver function (16). These results suggest that the observed transcriptional changes may have broad implications for the metabolic and functional adaptation of the liver under antioxidant supplementation. The second cluster (with its enrichment score of 1.97) includes the terms ‘IPR020103,’ ‘GO:0009982,’ ‘GO:0001522,’ and ‘KW-0413’ (Figure 4b); as shown, the terms were closely related to pseudouridine synthesis which is a critical step in RNA molecule processes (e.g., tRNA, or rRNA) (17). Disruptions in pseudouridine synthesis have been linked to various metabolic disorders, including those affecting lipid metabolism and protein synthesis, which can lead to impaired liver function (18). Therefore, the observed regulation of pseudouridine synthesis in this study may reflect an adaptive response to oxidative stress and nutritional interventions in liver cells. Lastly, the third cluster (enrichment score: 1.76) focuses on terms related to mitochondrial functions: ‘KW-0496,’ ‘GO:0005759,’ ‘TRANSIT: Mitochondrion,’ and ‘KW-0809’; the above terms included genes related to NADH/NADPH recycle, and energy metabolism (Figure 4c). Mitochondrial functions are crucial in the liver for energy metabolism and oxidative stress regulation (12, 19). Efficient NADH/NADPH recycling and energy metabolism maintain liver homeostasis, and disruptions in these processes can impair liver function (20, 21). This underscores the importance of mitochondrial regulation in liver health and metabolic balance, suggesting that antioxidant supplementation affects mitochondrial functions in Hanwoo cattle liver. The other clusters were provided in the Supplementary Table S4.
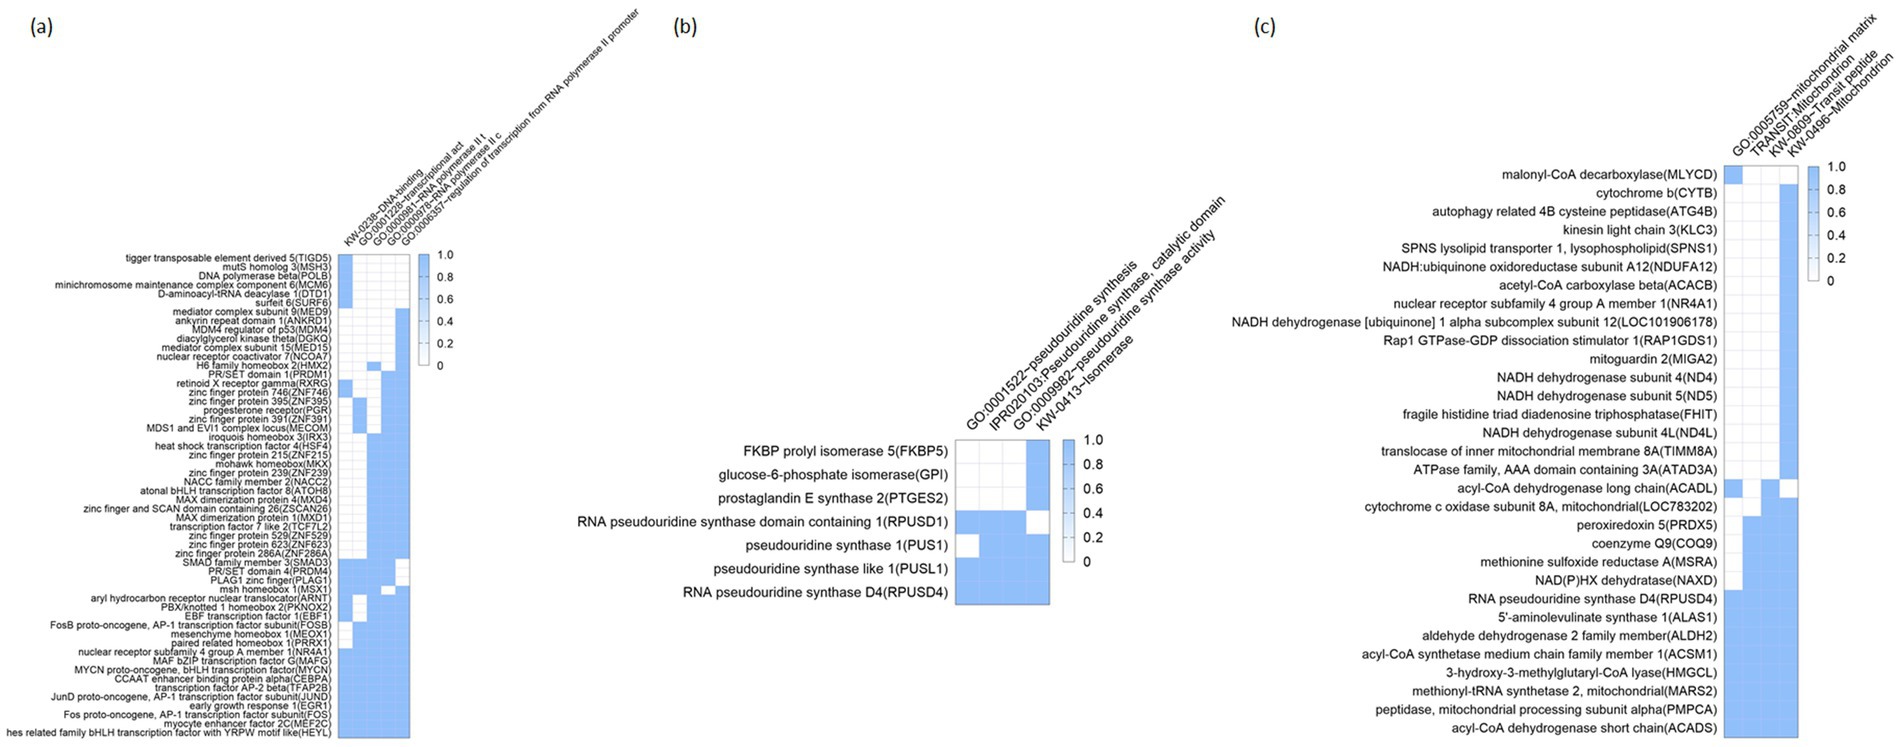
Figure 4. Functional annotation cluster enriched by antioxidant intervention. Heatmaps represent the top three clusters with the highest enrichment scores (a–c): (a) 1st cluster (enrichment score: 2.86), (b) 2nd cluster (enrichment score: 1.97), and (c) 3rd cluster (enrichment score: 1.76). Rows represent individual genes, and columns correspond to specific biological processes or molecular functions, as identified by Gene Ontology (GO) terms. The color intensity reflects the degree of enrichment, with darker blue shades indicating higher enrichment scores. GO, Gene Ontology.
3.6 Identification of potential pathway by the intervention: KEGG pathway analysis
Using the KEGG database, we identified several candidate pathways that had been enriched in our DEG list. First, ‘bta01100: Metabolic pathways (Bos taurus)’ was identified as the first pathway with p-value of 0.0017. In this broad pathway, our DEG list included a total of 56 genes which present 8.9% of total genes (Fold enrichment: 1.48; Supplementary Table S5). Other KEGG pathways enriched by the DEG list were ‘bta04010: MAPK signaling pathway,’ and ‘bta04621: NOD-like receptor signaling pathway’ with 14 genes and 10 genes counted, respectively (Supplementary Table S5).
Overall, this study is significant as it fills a gap in the current understanding of Hanwoo cattle by providing the first comprehensive RNA-seq dataset focusing on the effects of antioxidant supplementation. Previous research has largely overlooked transcriptomic analyses in Hanwoo, especially in the context of dietary interventions. By offering this detailed RNA-seq data, the study contributes valuable insights that can enhance our knowledge of Hanwoo cattle biology, particularly in terms of how these animals respond at the molecular level to specific antioxidant interventions. While no significant differences were observed in phenotypic traits such as weight gain, feed conversion ratio, or meat quality, RNA sequencing revealed substantial gene expression changes. Key genes related to mitochondrial function, lipid metabolism, and transcription regulation, such as RIPK1, ACACB, and ELOVL5 genes, were significantly upregulated in the antioxidant-supplemented group. These findings suggest that while the immediate phenotypic impacts may be limited, significant transcriptional responses occur, which could have long-term implications for cellular function and metabolism. The study’s use of robust bioinformatics analyses, including GO term enrichment and KEGG pathway analysis, further supported these observations by highlighting relevant biological pathways such as metabolic processes and MAPK signaling. However, our research also presents some limitations, including the lack of observed phenotypic changes, a relatively small sample size that may limit the generalizability of the findings, and the short-term nature of the observations, which may not fully capture the long-term impacts of the supplementation. Despite these limitations, the study is a valuable contribution, providing important RNA-seq data that can broaden our understanding of the Hanwoo breed and offer a foundation for future research in this area.
Data availability statement
The original contributions presented in this study are publicly available in the NCBI Sequence Read Archive (SRA) under BioProject accession number PRJNA1247235 (https://www.ncbi.nlm.nih.gov/bioproject/1247235). In addition, key data supporting the findings of this study are included in the article and its Supplementary material. Further inquiries can be directed to the corresponding author.
Ethics statement
The requirement of ethical approval was waived by the Nonghyup Feed Anseong farm for the studies involving animals because ethical approval was waived for this study as it involved standard practices for animal handling and experimentation, adhering to local and institutional guidelines. The study did not introduce any procedures that would fall outside the scope of routine veterinary care or significantly impact animal welfare. All experimental methods were conducted in compliance with relevant regulations for animal research. The studies were conducted in accordance with the local legislation and institutional requirements. Written informed consent was obtained from the owners for the participation of their animals in this study.
Author contributions
KL: Conceptualization, Investigation, Visualization, Writing – review & editing, Writing – original draft. LC: Writing – review & editing, Visualization. JA: Conceptualization, Data curation, Investigation, Validation, Writing – review & editing, Formal analysis, Methodology. JS: Conceptualization, Data curation, Formal analysis, Investigation, Methodology, Writing – review & editing, Validation. JP: Conceptualization, Data curation, Formal analysis, Investigation, Writing – review & editing, Funding acquisition, Methodology, Project administration, Resources, Supervision. SY: Conceptualization, Data curation, Formal analysis, Investigation, Validation, Writing – review & editing. JL: Formal analysis, Writing – review & editing, Conceptualization, Data curation, Investigation, Validation. E-CS: Formal analysis, Writing – review & editing. S-JY: Writing – review & editing, Formal analysis. JZ: Writing – review & editing, Investigation. TC: Methodology, Visualization, Writing – review & editing. NO: Methodology, Writing – review & editing, Visualization. J-OS: Methodology, Writing – review & editing, Investigation. DK: Writing – review & editing, Visualization. TK: Writing – review & editing, Visualization. HC: Writing – review & editing, Visualization. HS: Writing – review & editing, Visualization. YK: Resources, Writing – review & editing, Funding acquisition. JK: Conceptualization, Formal analysis, Methodology, Project administration, Resources, Software, Supervision, Visualization, Writing – original draft, Writing – review & editing.
Funding
The author(s) declare that financial support was received for the research and/or publication of this article. This research was supported by the Ministry of Food and Drug Safety of South Korea (RS-2024-00332492) and the BK21 Fostering Outstanding Universities for Research (FOUR) program.
Conflict of interest
The authors declare that the research was conducted in the absence of any commercial or financial relationships that could be construed as a potential conflict of interest.
Generative AI statement
The authors declare that no Gen AI was used in the creation of this manuscript.
Publisher’s note
All claims expressed in this article are solely those of the authors and do not necessarily represent those of their affiliated organizations, or those of the publisher, the editors and the reviewers. Any product that may be evaluated in this article, or claim that may be made by its manufacturer, is not guaranteed or endorsed by the publisher.
Supplementary material
The Supplementary material for this article can be found online at: https://www.frontiersin.org/articles/10.3389/fvets.2025.1546248/full#supplementary-material
References
1. Ranjan, R, Ranjan, A, Dhaliwal, GS, and Patra, RC. L-ascorbic acid (vitamin C) supplementation to optimize health and reproduction in cattle. Vet Q. (2012) 32:145–50. doi: 10.1080/01652176.2012.734640
2. Pogge, DJ, and Matsui, SL. Supplemental vitamin C improves marbling in feedlot cattle consuming high sulfur diets. J Anim Sci. (2013) 91:4303–14. doi: 10.2527/jas.2012-5638
3. Padilla, L, Matsui, T, Ikeda, S, Kitagawa, M, and Yano, H. The effect of vitamin C supplementation on plasma concentration and urinary excretion of vitamin C in cattle. J Anim Sci. (2007) 85:3367–70. doi: 10.2527/jas.2007-0060
4. Matsui, T, and Vitamin, C. Nutrition in cattle. Asian Australas J Anim Sci. (2012) 25:597–605. doi: 10.5713/ajas.2012.r.01
5. Wang, Z, Gerstein, M, and Snyder, M. RNA-Seq: a revolutionary tool for transcriptomics. Nat Rev Genet. (2008) 10:57–63. doi: 10.1038/nrg2484
6. Pan, JH, Tang, J, Beane, KE, Redding, MC, Cho, YJ, Kim, YJ, et al. Hepatic transcriptomics analysis reveals that fructose intervention down-regulated xenobiotics-metabolising enzymes through aryl hydrocarbon receptor signalling suppression in C57BL/6N mice. Br J Nutr. (2019) 122:769–79. doi: 10.1017/S0007114519001612
7. Pehrson, B, Hakkarainen, J, Törnquist, M, Edfors, K, and Fossum, C. Effect of Vitamin E supplementation on weight gain, immune competence, and disease incidence in barley-fed beef cattle. J Dairy Sci. (1991) 74:1054–9. doi: 10.3168/jds.S0022-0302(91)78255-6
8. Harel, T, Yoon, WH, Garone, C, Gu, S, Coban-Akdemir, Z, Eldomery, MK, et al. Recurrent De novo and Biallelic variation of ATAD3A, encoding a mitochondrial membrane protein, results in distinct neurological syndromes. Am J Hum Genet. (2016) 99:831–45. doi: 10.1016/j.ajhg.2016.08.007
9. Chen, L, Li, Y, Sottas, C, Lazaris, A, Petrillo, SK, Metrakos, P, et al. Loss of mitochondrial ATPase ATAD3A contributes to nonalcoholic fatty liver disease through accumulation of lipids and damaged mitochondria. J Biol Chem. (2022) 298:102008. doi: 10.1016/j.jbc.2022.102008
10. Blériot, C, and Lecuit, M. RIPK1, a key survival factor for hepatocytes. J Hepatol. (2017) 66:1118–9. doi: 10.1016/j.jhep.2017.02.009
11. Zhang, Y, Su, SS, Zhao, S, Yang, Z, Zhong, CQ, Chen, X, et al. RIP1 autophosphorylation is promoted by mitochondrial ROS and is essential for RIP3 recruitment into necrosome. Nat Commun. (2017) 8:1–14. doi: 10.1038/ncomms14329
12. Han van der Kolk, JH, Gross, JJ, Gerber, V, and Bruckmaier, RM. Disturbed bovine mitochondrial lipid metabolism: a review. Vet Q. (2017) 37:262–73. doi: 10.1080/01652176.2017.1354561
13. Lee, AK, Kyriakou, T, Weston, AJ, and O’Dell, SD. Functional single-nucleotide polymorphism in acetyl-CoA carboxylase ACACB gene promoter. DNA Cell Biol. (2010) 29:703–12. doi: 10.1089/dna.2010.1078
14. Yeboah, GK, Lobanova, ES, Brush, RS, and Agbaga, MP. Very long chain fatty acid-containing lipids: a decade of novel insights from the study of ELOVL4. J Lipid Res. (2021) 62:100030. doi: 10.1016/j.jlr.2021.100030
15. Hongfang, G, Khan, R, Raza, SHA, Nurgulsim, K, Suhail, SM, Rahman, A, et al. Transcriptional regulation of adipogenic marker genes for the improvement of intramuscular fat in Qinchuan beef cattle. Anim Biotechnol. (2022) 33:776–95. doi: 10.1080/10495398.2020.1837847
16. Pegolo, S, Cecchinato, A, Mach, N, Babbucci, M, Pauletto, M, Bargelloni, L, et al. Transcriptomic changes in liver of young bulls caused by diets low in mineral and protein contents and supplemented with n-3 fatty acids and conjugated linoleic acid. PLoS One. (2016) 11:e0167747. doi: 10.1371/journal.pone.0167747
17. Penzo, M, and Montanaro, L. Turning uridines around: role of rRNA Pseudouridylation in ribosome biogenesis and ribosomal function. Biomol Ther. (2018) 8:38. doi: 10.3390/biom8020038
18. Jin, Z, Song, M, Wang, J, Zhu, W, Sun, D, Liu, H, et al. Integrative multiomics evaluation reveals the importance of pseudouridine synthases in hepatocellular carcinoma. Front Genet. (2022) 13:944681. doi: 10.3389/fgene.2022.944681
19. Satapati, S, Kucejova, B, Duarte, JAG, Fletcher, JA, Reynolds, L, Sunny, NE, et al. Mitochondrial metabolism mediates oxidative stress and inflammation in fatty liver. J Clin Invest. (2015) 125:4447–62. doi: 10.1172/JCI82204
20. Delabar, JM, Martin, SR, and Bayley, PM. The binding of NADH and NADPH to bovine-liver glutamate dehydrogenase. Eur J Biochem. (1982) 127:367–74. doi: 10.1111/j.1432-1033.1982.tb06881.x
Keywords: Hanwoo cattle, antioxidant supplementation, transcriptomics, RNA sequencing, mitochondrial function
Citation: Lee K, Choi LY, Ahn JS, Song JY, Park JK, Yun SJ, Lee JH, Shin EC, Yeom SJ, Zhao J, Cho TJ, Oh NS, Shin JO, Kim D, Kim TG, Cho HT, Shin HR, Kim YJ and Kim JK (2025) Transcriptomic signatures in response to antioxidants supplementation in Korean cattle beef, Hanwoo: a 7-month feeding study. Front. Vet. Sci. 12:1546248. doi: 10.3389/fvets.2025.1546248
Edited by:
He Zhang, Chinese Academy of Agricultural Sciences, ChinaReviewed by:
Dongjoon Lee, Dankook University, Republic of KoreaSangyub Kim, The Pennsylvania State University, United States
Wan Heo, Seowon University, Republic of Korea
Copyright © 2025 Lee, Choi, Ahn, Song, Park, Yun, Lee, Shin, Yeom, Zhao, Cho, Oh, Shin, Kim, Kim, Cho, Shin, Kim and Kim. This is an open-access article distributed under the terms of the Creative Commons Attribution License (CC BY). The use, distribution or reproduction in other forums is permitted, provided the original author(s) and the copyright owner(s) are credited and that the original publication in this journal is cited, in accordance with accepted academic practice. No use, distribution or reproduction is permitted which does not comply with these terms.
*Correspondence: Jae Kyeom Kim, amtraW1AdWRlbC5lZHU=; bnV0cmlnZW5vbWljc0Brb3JlYS5hYy5rcg==