 Negin Sanaei1
 Mohamad Zamani-Ahmadmahmudi
 Seyed Mahdi Nassiri
- 1Department of Clinical Pathology, Faculty of Veterinary Medicine, University of Tehran, Tehran, Iran
- 2Department of Clinical Science, Faculty of Veterinary Medicine, Shahid Bahonar University of Kerman, Kerman, Iran
Canine parvovirus (CPV) is one of the most contagious viral diseases in dogs that usually presents with diarrhea, vomiting, and fever. Various clinical and laboratory biomarkers such as SIRS, leukopenia, neutropenia and CRP have been introduced to predict the final outcome of dogs with CPV. With the advent of machine learning methods/algorithms, various models can be developed using a combination of clinical and non-clinical variables to predict clinical outcome in different diseases with higher efficiency compared to traditional biomarkers. In this study, we sought to develop models to predict clinical outcome and recovery time in dogs with CPV infection using 10 and 4 machine learning algorithms, respectively. A model was developed using four variables (SIRS, deworming, vaccination and crying) to predict clinical outcome. The performance of this model was measured using three metrics: accuracy scores, AUC (area under the Receiver Operating Characteristic (ROC) curve) and AUC score. Another model was constructed using five variables (retching, foul smelling, housing, dehydration, and shift-to-left) to estimate recovery time. The performance of this model was evaluated using two criteria: mean square error (MSE) and root mean square error (RMSE). In the model developed for clinical outcome, the average of accuracy scores, AUC scores and AUCs in the test dataset were 0.84, 0.90 and 0.73, respectively. The second model predicted the recovery time in the test group with a mean error of 2 days (RMSE = 2.05). Our findings demonstrate that ML models can effectively integrate clinical and laboratory features to predict survival and recovery time in CPV-infected dogs, offering a valuable tool for early prognosis and treatment optimization.
Introduction
Canine parvovirus type 2 (CPV-2), which belongs to the genus Protoparvovirus in the family Parvoviridae, is a single-stranded DNA virus that is ~5.12 kb in length (1). CPV spreads rapidly in the canine population and has a high mortality rate. Because CPV is completely dependent on the host cell, virus replication requires cells with high proliferative capacity, such as the digestive tract, bone marrow, and lymphoid tissues. CPV infection primarily affects three main tissues: the GI tract, bone marrow, and myocardium, though the skin and nervous tissue may also be impacted. The most common clinical manifestations are diarrhea, vomiting, and fever. The severity of vomiting is often severe, and diarrhea and anorexia occur with less severity. Excretion of body fluids and proteins through the digestive system causes severe dehydration and hypovolemic shock (2–5).
One of the most important aspects of CPV for the small animal practitioner and animal owner is the prediction of clinical outcome in infected dogs. Therefore, various clinical and laboratory biomarkers have been introduced to estimate the prognosis in dogs with CPV. For example, some studies have shown that leukopenia, neutropenia, and lymphopenia as important biomarkers for predicting clinical outcome, while other studies have shown that SIRS syndrome is a strong risk factor for non-survival patients (5–8). In addition, it was reported that serum levels of C-reactive protein and ceruloplasmin were significantly higher in non-survival dogs than in survival dogs (9). Serum cortisol, thyroxine concentrations and C-reactive protein (CRP) have also been reported as other prognostic biomarkers in canine parvovirus enteritis (10, 11). Although all these biomarkers are individually valuable prognostic factors, their combination can create stronger and more reliable prognostic indicators. The main disadvantage of these single biomarkers is the lack of reproducibility, as many times a biomarker is confirmed in one study while not in another. The difficulty of measurement and cost are other major disadvantages. It would be a great advantage if we could build prognostic models using variables that can be recorded/measured easily and with minimal cost/effort. Recent advances in machine learning (ML) and artificial intelligence (AI) have provided us with various valuable algorithms that are widely used to predict the clinical outcome of various diseases in human and animals using a combination of multiple variables rather than based on a single variable (12–17). Furthermore, attempts are made to use variables that are easily measurable to enter ML models in most such studies. Although the use of ML to study human diseases in various aspects is relatively widespread, the application of these technologies in veterinary medicine and especially small animal medicine is in its early stages (18). Predicting clinical outcome (survival) and recovery time is very important for small animal physicians and dog owners. While single prognostic biomarkers are not enough powerful predictors, developing ML models using multiple clinical/non-clinical variables can more robustly and reliably predict outcome and recovery time. For example using random forest algorithm and some of the hematology and serum biochemistry variables including antithrombin, serum aspartate aminotransferase, serum lipase, monocyte and lymphocyte count, the survival time could be reliably predicted (18). Given the lack of predictive models in CPV, this study aimed to develop an ML-based model to predict clinical outcome and recovery time in 156 dogs with CPV.
Methods
Patients
Current study was done on 156 dogs with confirmed CPV infection referred to the University of Tehran of Veterinary Medicine Hospital or private clinics. In addition to clinical/historical symptoms (depression, diarrhea, vomiting), CPV infection was confirmed using a rapid fecal antigen test (Arvin Biohealth: Iran, specificity: 100%, sensitivity: 97.6%). As recommended by the kit manufacturer (Arvin Biohealth: Iran), in case of vaccination, at least 10 days must have passed since the vaccination to consider the test positive. Dogs with confirmed CPV test and complete laboratory, clinical, and outcome variables were included in the study. Dogs were excluded from the study if they did not have any of the hematology, biochemistry, or clinical examination parameters or outcome (see “Data collection” section for details on recording variables). There were no inclusion/exclusion criteria based on age, gender, and severity of disease.
Data collection
For each CPV-infected case, we collected three types of data: (1) demographic, (2) clinical, and (3) laboratory variables, all recorded prior to treatment initiation (Table 1). This study aims to develop an ML model to predict clinical outcomes and recovery time in CPV-infected dogs using easily obtainable demographic, clinical, and laboratory variables. Regarding laboratory variables, we only included hematology variables (e.g., WBC, neutrophil count, and left shift) and some biochemical analytes (glucose, magnesium, and paraoxonase) that were confirmed in previous studies as prognostic parameters for CPV (5, 6, 19–22).
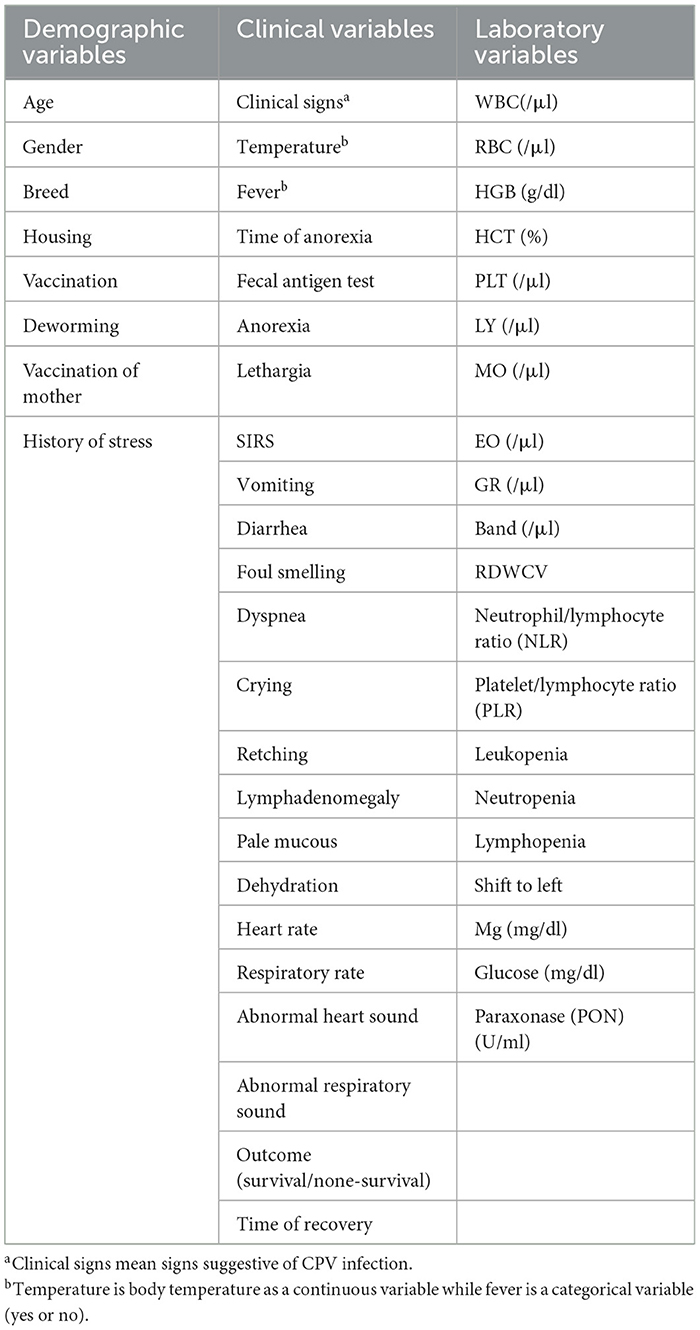
Table 1. Various type of data (variables) recorded for each dog with CPV.
First, a questionnaire was designed to record demographic information and clinical metadata. In the questionnaire, demographic information (such as age, sex, breed, housing, nutrition, vaccination, and antiparasitic treatment), clinical symptoms and the presence of systemic inflammatory response syndrome (SIRS) were recorded. SIRS was confirmed by the presence of at least three of the four criteria, including heart rate > 140/min, respiratory rate > 30/min, body temperature > 39.2°C, and total white blood cell count more than 17,000/μl or < 6,000/μl (5). Recovery time was considered as the interval (days) between confirmation of CPV infection and complete clinical recovery. Afterwards, whole blood was sampled for routine complete blood count (CBC) test and measurement of previously confirmed serum biomarkers for canine CPV infection (glucose, magnesium, and paraoxonase) (21, 22) (Table 1). The samples were taken with the consent of the animal owner. CBC test was performed using a veterinary hematology analyzer (Celltacα, NIHON KHODEN, Japan) and glucose, Mg, and PON were measured using colorimetric GOD/PAP, colorimetric Xylidyl Blue, and colorimetric sandwich ELISA kit (ZellBio GmbH, Germany), respectively. Also, for 47 cases, a second CBC test after treatments (postadmission sampling) was performed and relevant data was recorded.
Primary data analysis
Before developing ML models to predict clinical outcome or estimate recovery time, we performed a preliminary statistical analysis on various clinical/none-clinical data. Descriptive analysis was performed on various categorical and numerical variables using SPSS 23 software (Chicago, IL, USA). Also, the relationship between clinical outcome and numerical variables or clinical outcome and categorical variables was done using one-way ANOVA and Pearson's chi-squared test, respectively. P < 0.05 level was considered significant.
Developing ML model to predict clinical outcome
The general workflow for developing models to predict clinical outcome is summarized in Figure 1.
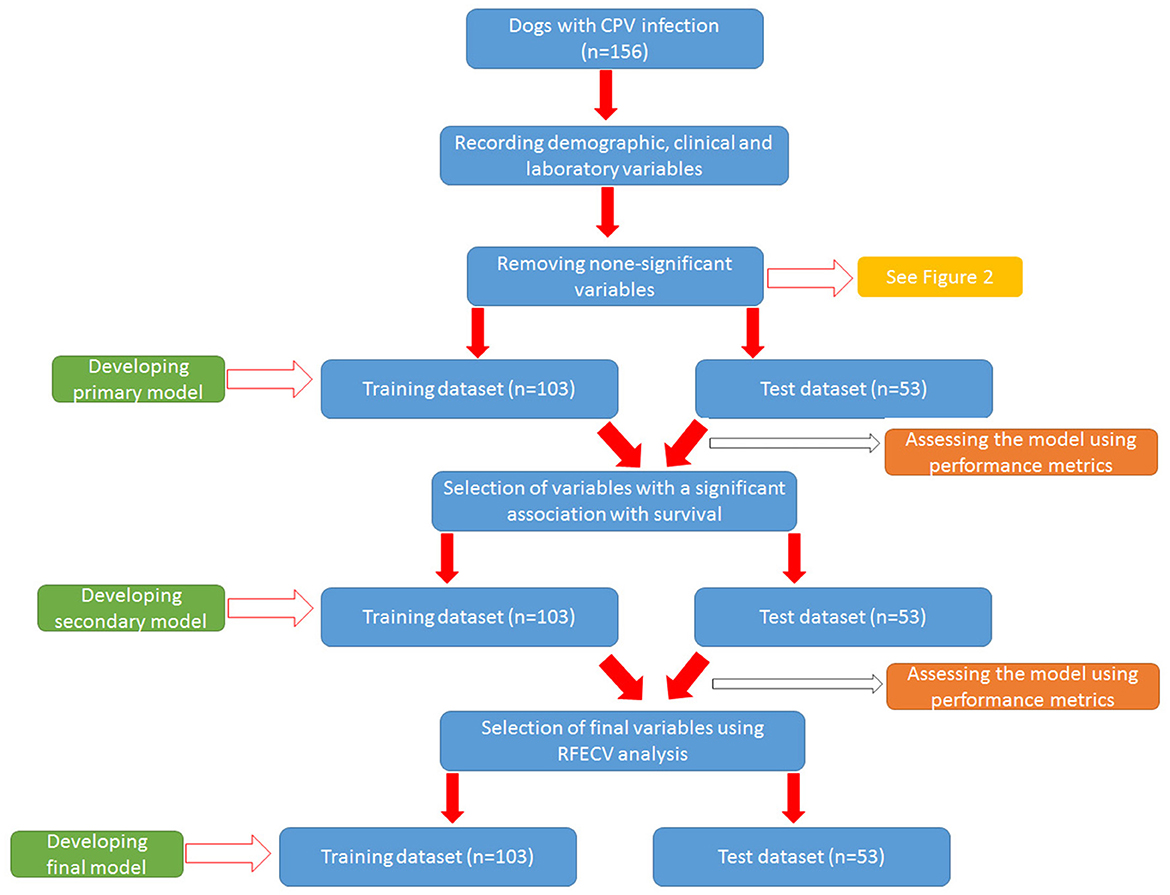
Figure 1. The general workflow for developing models to predict clinical outcome.
Filtering the variables
Before developing the model, we revised the initial variables to filter out unnecessary variables. Our workflow for removing non-informative variables is summarized in Supplementary Figure 1. Briefly, variables with more than 25% missing data, variables with small changes (low information), duplicate variables and dummy variables with more than 10 levels were identified and removed. Dummy variables can have two or more levels. A variable with small change is a variable in which 90% of the samples have the same information. For example, more than 90% of cases in our study had anorexia. Duplicate variables are continuous or categorical variables that provide the same information (such as temperature and fever) (Supplementary Figure 1).
There were few missing data for some of the variables. In this situation, the missing values for continuous and categorical data were filled with the average value and the value with the highest frequency, respectively.
Training the outcome models
After removing non-informative variables, different ML models were trained to reach a final optimal model. Figure 2 shows the workflow for developing the final model. To develop each model, the initial dataset was first divided into training dataset (67%, n = 104) and test (validation) dataset (33%, n = 51). Then the model was built in the training dataset using different algorithms and then used to predict the clinical outcome in the test dataset. The algorithms used to build the models were from the scikit-learn library and include LogisticRegression, Support Vector Classification (SVC), GaussianProcessClassifier, DecisionTreeClassifier, RandomForestClassifier, AdaBoostClassifier, Gaussian Naive Bayes (GaussianNB), QuadraticDiscriminantAnalysis, LinearDiscriminantAnalysis, and GradientBoostingClassifier. The performance of the models was evaluated using three parameters: accuracy score, AUC [Area under the Receiver Operating Characteristic (ROC) Curve], and AUC score (23). Accuracy score simply indicated a percentage of correct predictions made by a model. The AUC indicates how well the model can discriminate the classes, while the AUC score indicates how reliable the AUC value is. As a rule of thumb, AUCs between 0.6 and 0.7 show poor discrimination, AUCs between 0.7 and 0.8 indicate acceptable discrimination and AUCs between 0.8 and 0.9 indicate excellent discrimination. To tackle the imbalance problem in our analysis, we also trained and compared models with and without SMOTE (Synthetic Minority Over-sampling Technique) analysis. We merely used SMOTE analysis in the training group. To control the problem of overfitting during model development, K-fold cross validation (https://scikitlearn.org/stable/modules/cross_validation.html) was performed in both training and test groups for all algorithms. In our analysis, we considered k = 10 in the cross-validation analysis. All models were built using python language and Jupyter notebook. Additionally, we tuned our models to find optimal values of the hyperparamters using the GridSearchCV tool in the scikit-learn library.
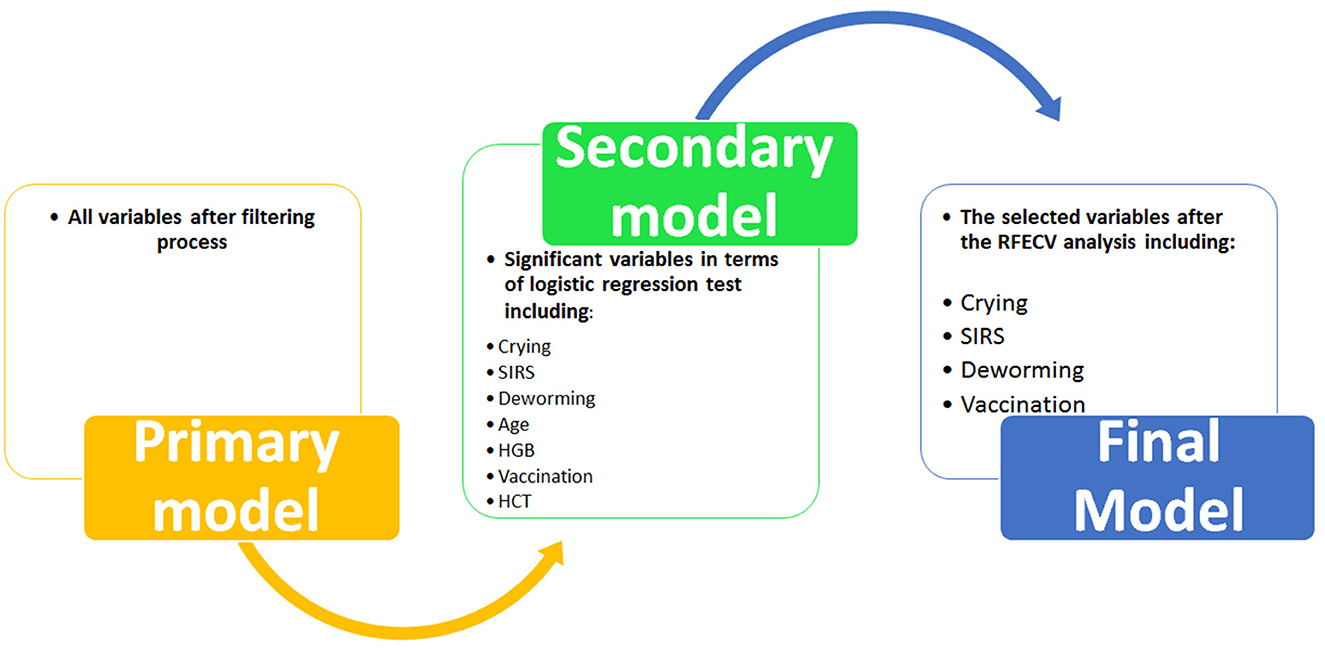
Figure 2. Development process of different models to predict clinical outcome.
First, a primary model was trained using all the variables selected in the previous step. As the primary model required too many variables and showed poor performance (see Results section), a secondary model was constructed. To reduce the number of primary variables, logistic regression analysis was performed to identify variables with a significant association with the outcome (survival) (Ps < 0.05). Then the variables that had a significant relationship with the outcome were included in the process of building the secondary model. Next, the secondary model was evaluated using performance parameters. Although the performance of the secondary model was significantly better than the primary model (see Results section), the AUCs (as the most important performance metric) of this model were not ideal. Hence we developed the third model (i.e., the final model) with the help of Recursive Feature Elimination with Cross-Validation Analysis (RFECV) to select considerable features (variables) (24). In this analysis, the number of features (variable) selected is tuned automatically by fitting an RFE selector on the different cross- validation splits. As a result, selected and non-selected variables were labeled as True and False, respectively. Using RFECV analysis, four variables (crying, SIRS, deworming and vaccination) were selected and included in the final model (Figure 2). Again, the performance of the final model was checked in both training and test groups using the mentioned parameters.
Developing ML model to predict recovery time
Filtering the variables
We also attempted to develop an optimized model(s) that robustly predicted the time to recovery in studied dogs with CPV infection. The initial stage for these models was similar to the models developed for clinical outcome. Therefore, we first filtered the unnecessary variables using the workflow mentioned above (Supplementary Figure 1).
Training the recovery models
To build the final predictive model, we followed the path shown in Figure 3. First, numerical variables (e.g., age and CBC data) that had a significant correlation with recovery time were identified using Spearman's correlation analysis. Then, categorical variables (e.g., deworming, SIRS, housing, dehydration, and foul smelling) with a significant relationship with recovery time were identified using ANOVA analysis. Both analyzes were performed using Pandas and statsmodels libraries in Jupyter notebook. Finally, using significant numerical and categorical variables, ML models were developed using four regression algorithms from scikit-learn library (LinearRegression, DecisionTreeRegressor, RandomForestRegressor, and KNeighborsRegressor). Here again, the models were trained using 67% of the dataset and tested on the remaining 33% of the data. The performance of these models was evaluated based on the mean square error (MSE) and root mean square error (RMSE) parameters (25). Both metrics represent the average difference between estimated and actual values. However, since RMASES are the root value of MASES, they provide more realistic and tangible differences.
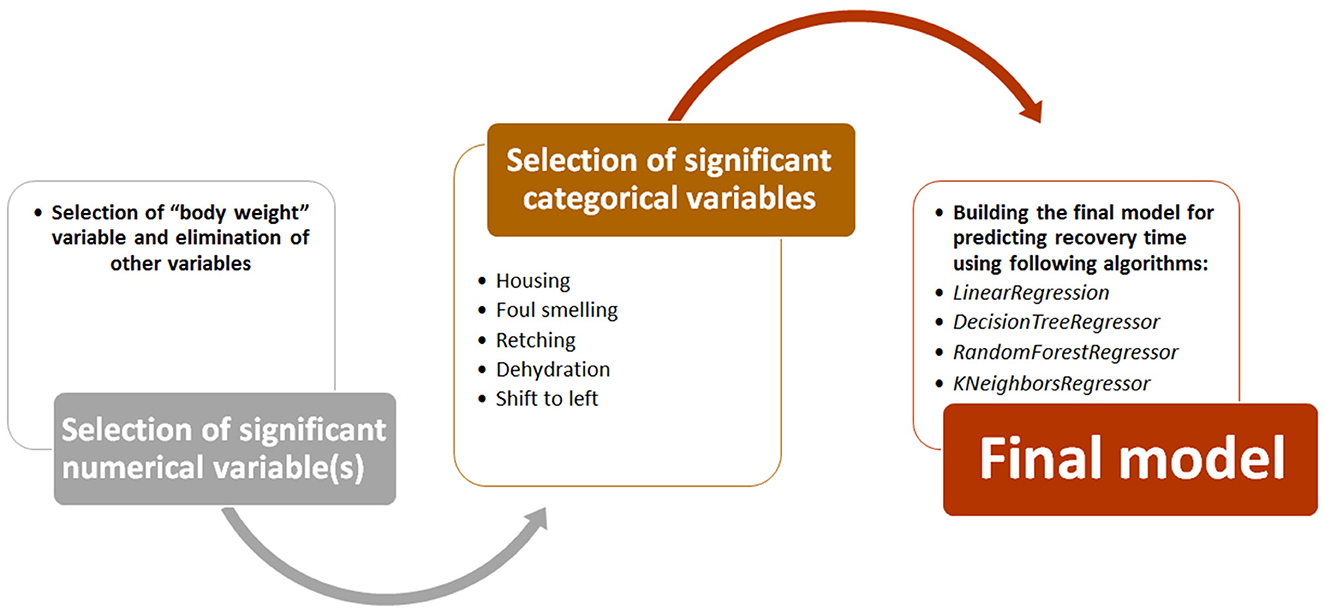
Figure 3. Development process of different models to predict recovery time.
Results
Descriptive analysis of the studied cases
In our study, we worked on 156 dogs with CPV infection with average body weight of 7.96 ± 6.28 kg and average age of 4.64 ± 4.0 months. German shepherded (28.6%), mix dogs (23.4%), Pomeranian (9.1%), and Sarabi (7.8%) were most common breeds in our study. Table 2 shows the frequency of demographic variables. As shown, the frequency of vaccination and deworming variables was significantly different between the survival and none-survival groups. The frequency of vaccinated and dewormed dogs in the survival group was significantly higher than the non-survival group (Ps < 0.05). Also, the frequency of the gender variable tended to be significant (P = 0.057) (Table 2). Frequency of clinical categorical and clinical numerical variables are presented in Tables 3, 4, respectively. Here we found that the number of cases with SIRS, dyspnea, and crying in the non-survival group was significantly higher than the survival group (Ps < 0.05) (Table 3).
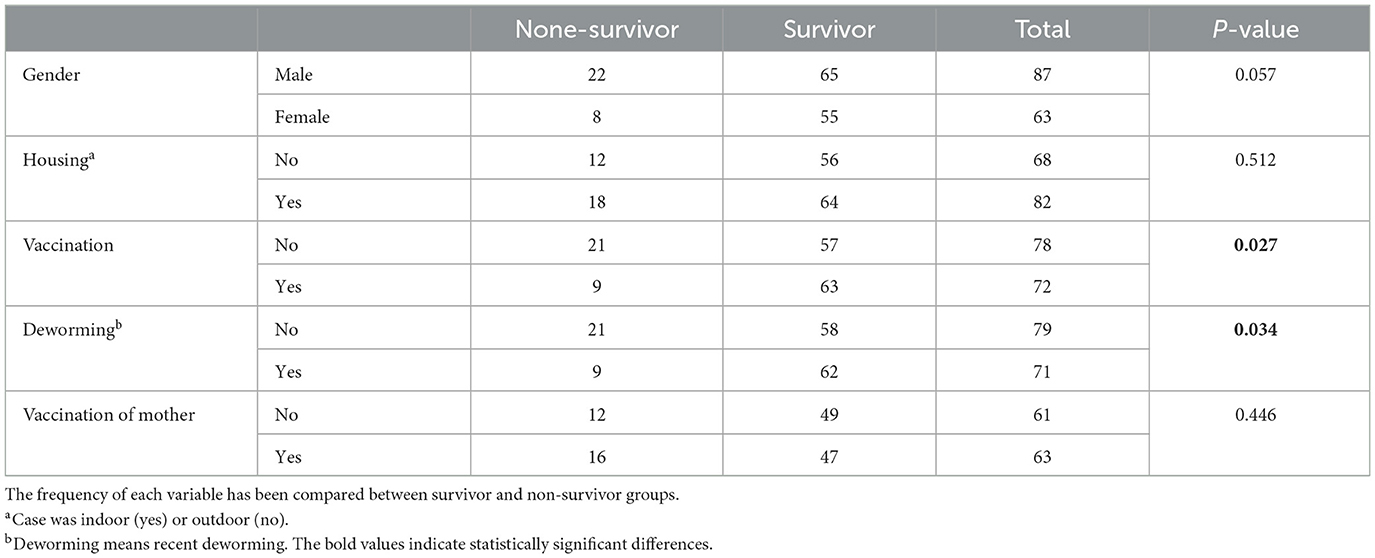
Table 2. Frequency of demographic variables in studied dogs with CPV.
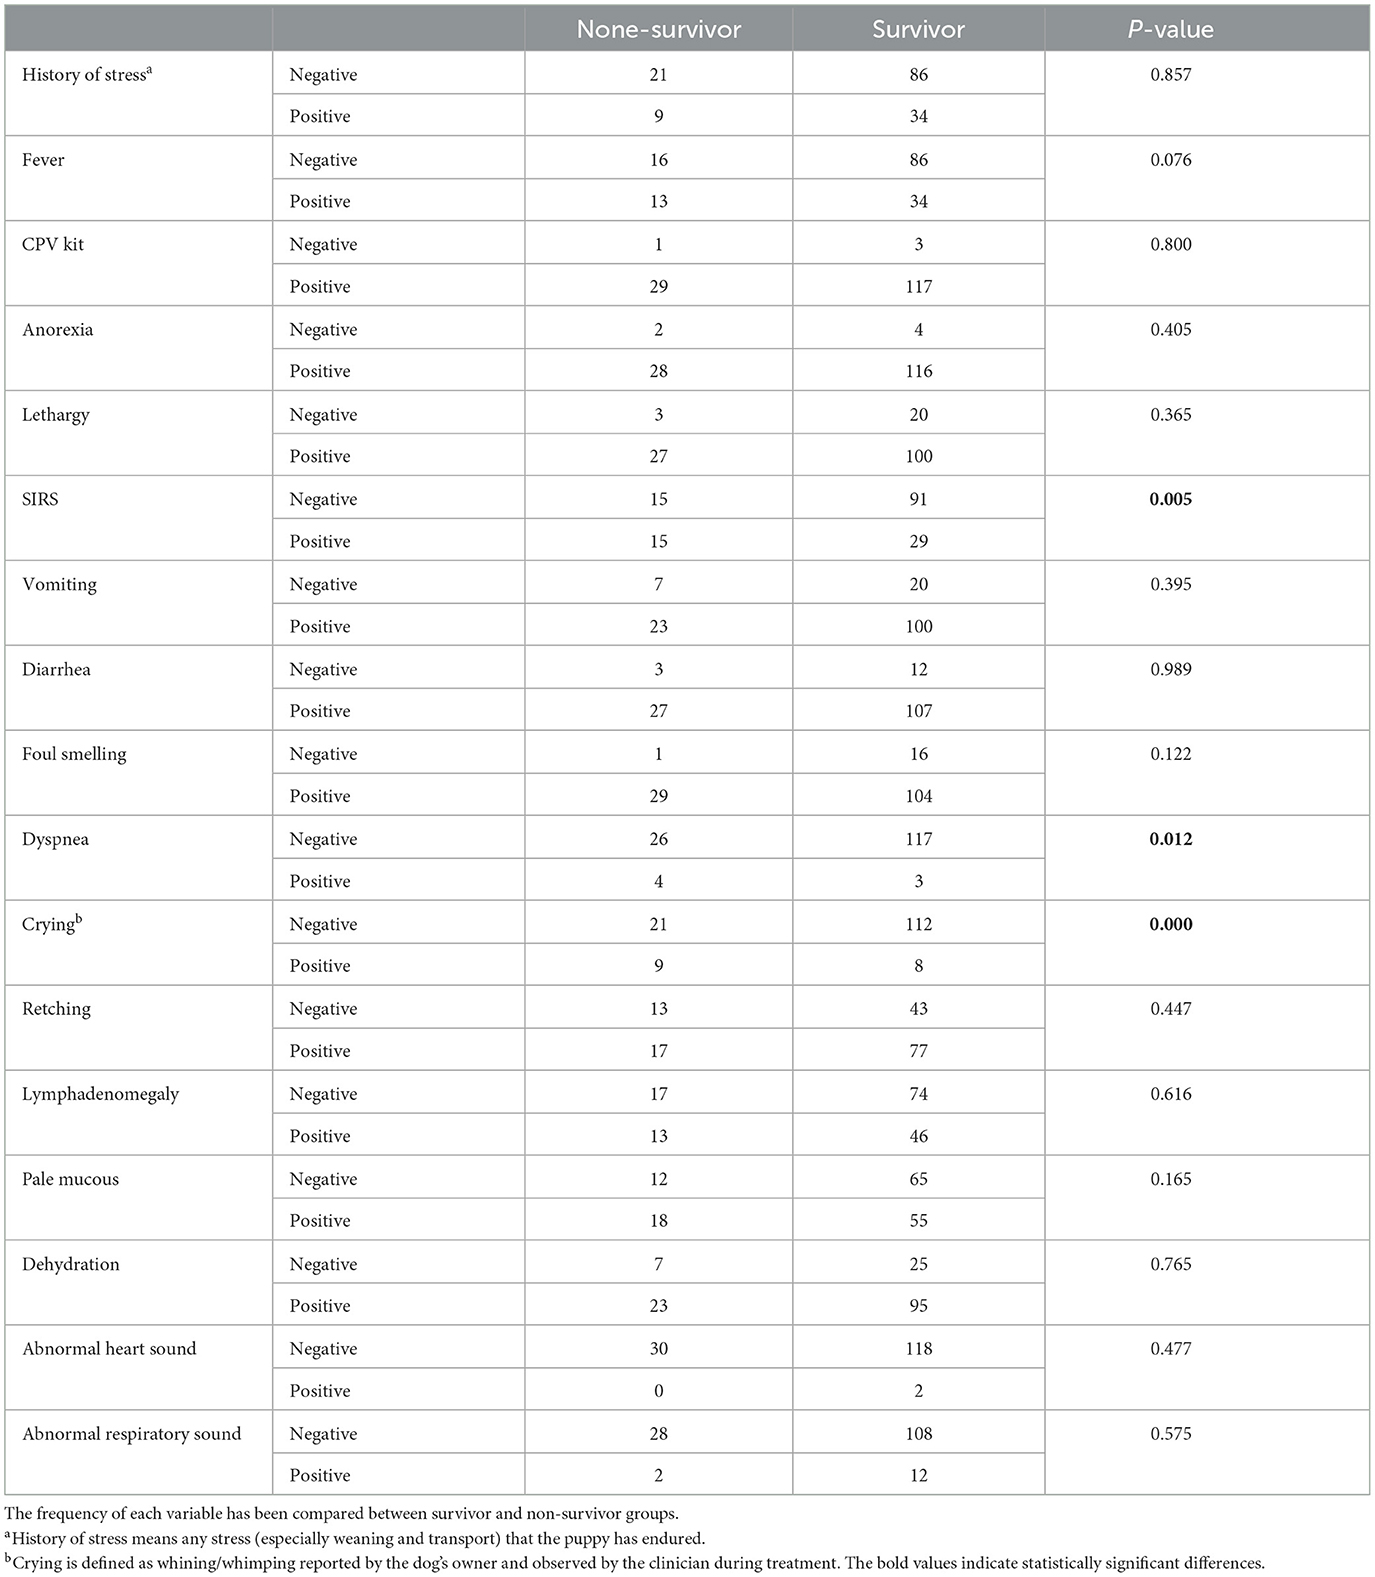
Table 3. Frequency of clinical categorical variables in studied dogs with CPV.

Table 4. Descriptive analysis of clinical numerical variables in studied dogs with CPV.
We also evaluated hematology parameters first at admission and second ??? days after admission. None of the hematology parameters were different between survival and none-survival dogs in the first sampling (Ps > 0.05) (Supplementary Tables 1, 2), while in the second blood sampling, the mean RDW and mean platelet-to-lymphocyte ratio (PLR) were significantly higher in the none-survival group than in the survival group (66.9 vs. 14.3 and 793 vs. 273, respectively) (Ps < 0.05) (Table 5). In addition, the number of dogs with leukopenia and neutropenia in the non-survival group were significantly higher than in the survival group (Ps < 0.05) (Table 6). Although the hematology and cytopenia variables of the second sampling were found to be suitable prognostic factors, these variables were not included in the prognostic models because less than one third of the cases had a second sampling. Furthermore, our preference was to use only parameters that could be recorded at the time of admission, the other reason not including hematology and cytopenia at the second sampling in our models. Our analysis also showed that the serum levels of glucose, magnesium and PON enzyme were not statistically different in the two groups (Ps > 0.05) (Supplementary Table 3).
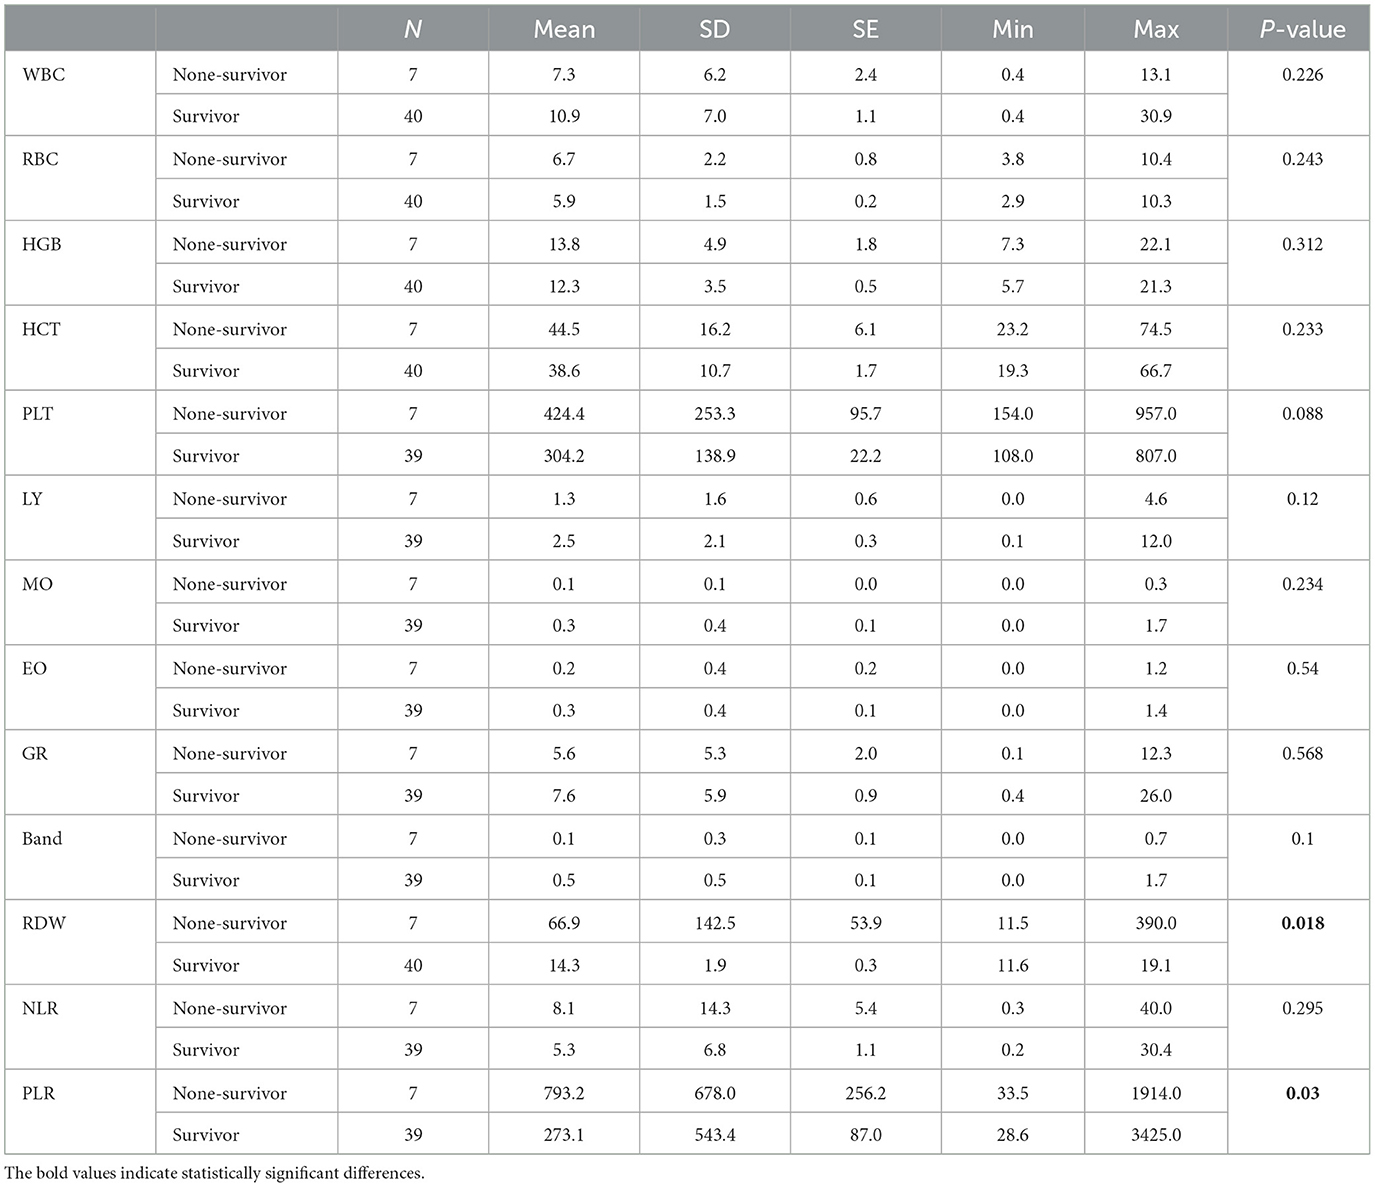
Table 5. Descriptive statistics and comparison of hematological parameters of the second sampling (postadmission) between two groups of survival and non-survival dogs infected with CPV.
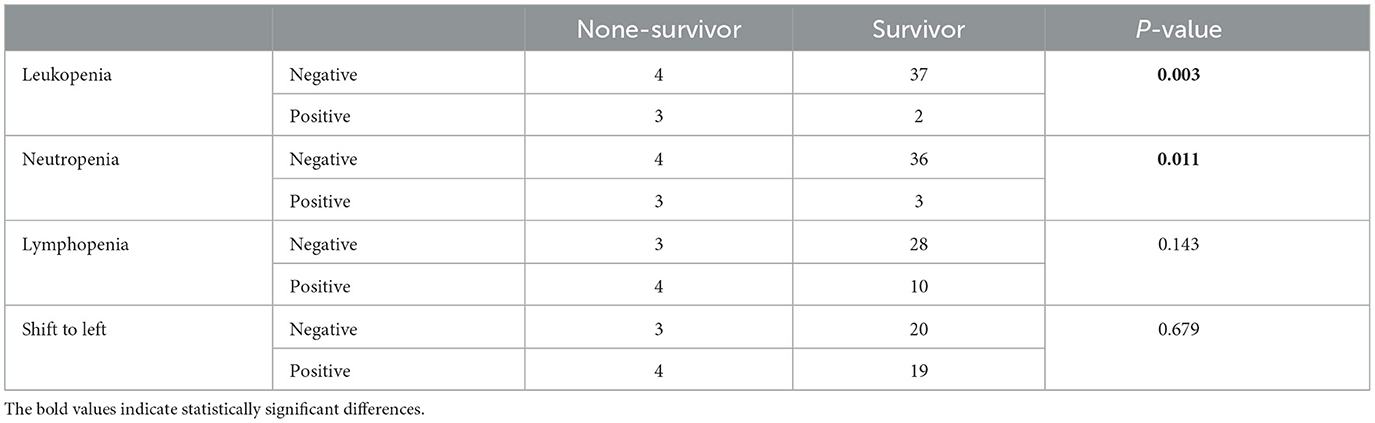
Table 6. Frequency and statistical comparison of different parameters of cytopenia in the second sampling among two groups of survival and non-survival.
ML models to predict clinical outcome
As described in the Methods section, we went through three steps to arrive at a final model for robust prediction of clinical outcome in our patients. Primary and secondary models were trained and tested using 9 ML algorithms, while the final model was trained and tested using 10 algorithms. The performance of the models in two training and test groups was evaluated through three parameters: accuracy score, AUC score and AUC. We developed our models with and without SMOTE analysis (for dealing with imbalance dataset). In general, we obtained almost similar values for different metrics in both approaches, but two metrics including AUC score on the test dataset and AUC score on the training dataset were lower in models developed using SMOTE compared to models without SMOTE, while other metrics were remained unchanged. Hence, due to the higher performance metrics explained above, we preferred to consider the models developed without SMOTE analysis as the main models for further analysis (Tables 7–9; Supplementary Tables 4–6). Performance metrics for models developed using SMOTE analysis are presented in Supplementary Tables 4–6.
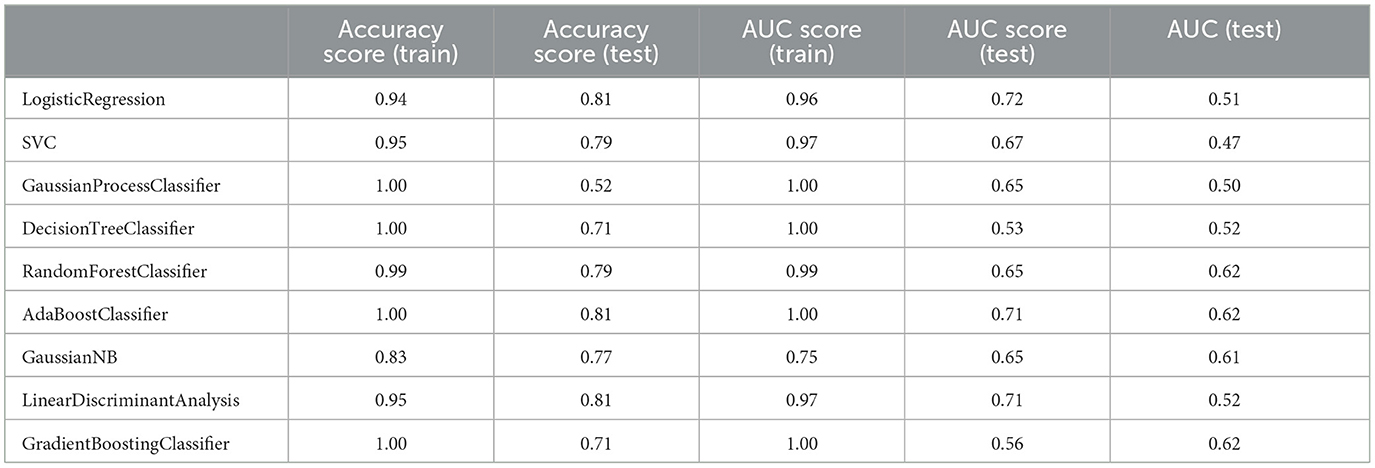
Table 7. Measuring the performance parameters of the primary model built with different algorithms in train and test groups.
Although the primary models in the training group had high accuracy scores (mean = 0.96), these models performed poorly in the test group, so that the AUC scores (mean = 0.65) and AUCs (mean= 0.55) were poor and close to the random range (Table 7; Figure 4; Supplementary Figure 2). Due to the low performance and large number of variables in the primary model, after selecting seven important variables using logistic regression analysis, we developed the secondary model (Figure 2). In the secondary models, the average accuracy scores in the training and test groups were 0.88 and 0.81, respectively. Also, the average AUC score in the test group was good (0.73). However, mean AUCs (0.65), as the most important performance metric, were poor in secondary models (Table 8; Figure 4; Supplementary Figure 3). After conducting RFECV analysis to find robust features/(variables), the final model was developed using four variables (SIRS, deworming, vaccination and crying) (Figure 2). As shown, the performance of our final models improved significantly on the training and test datasets. The average accuracy score in the training and test groups was 0.82 and 0.84, respectively. In addition, the average of AUC scores and AUCs in the test group were excellent (0.90) and good (0.73), respectively (Table 9; Figures 4, 5). In summary, in an effort to improve the performance of the models, all performance parameters gradually increased from the initial model to the final model, of which the AUC score increased the most from the initial model to the final model (Figure 4).
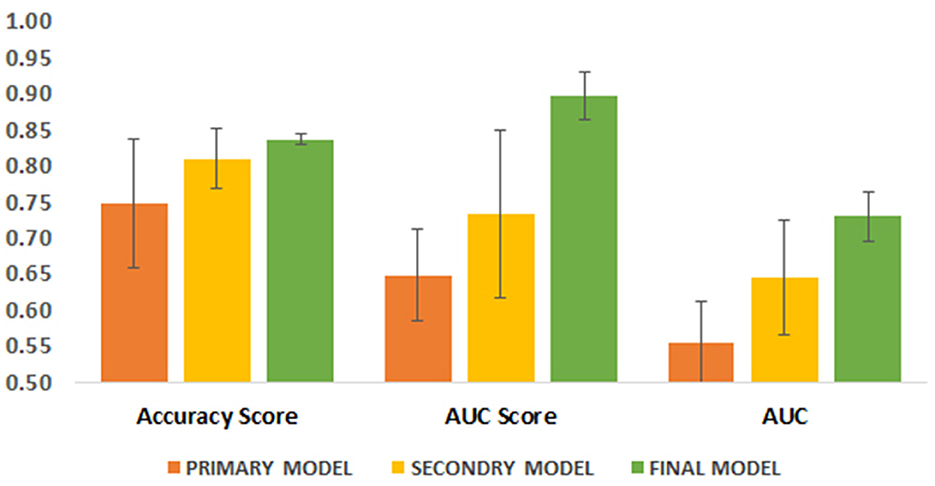
Figure 4. Comparison of three performance parameters between primary, secondary and final models in the test group. Each parameter is its average in different algorithms.
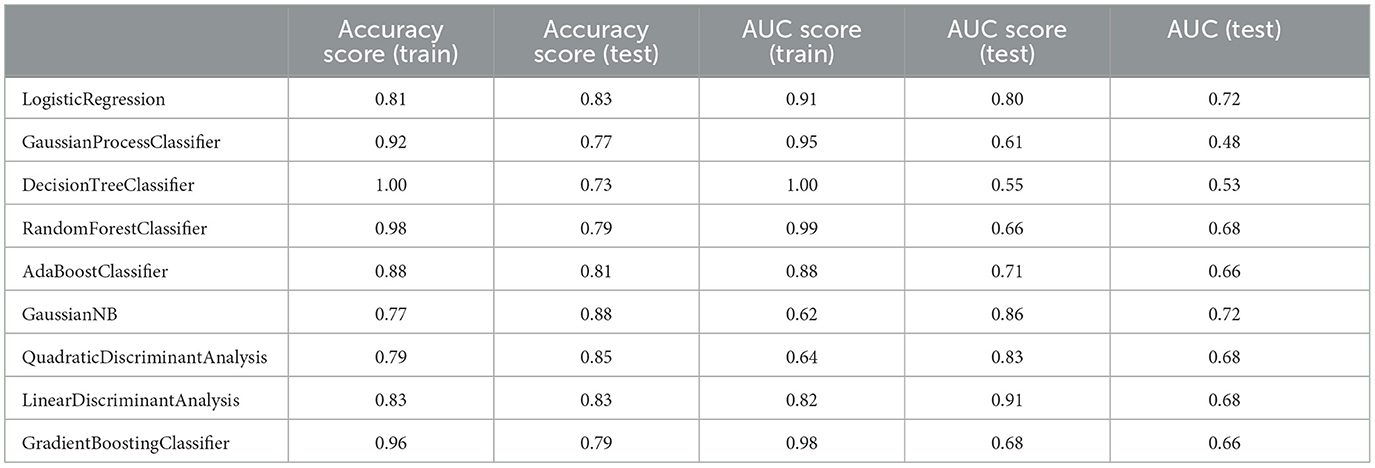
Table 8. Measuring the performance parameters of the secondary model built with different algorithms in train and test groups.
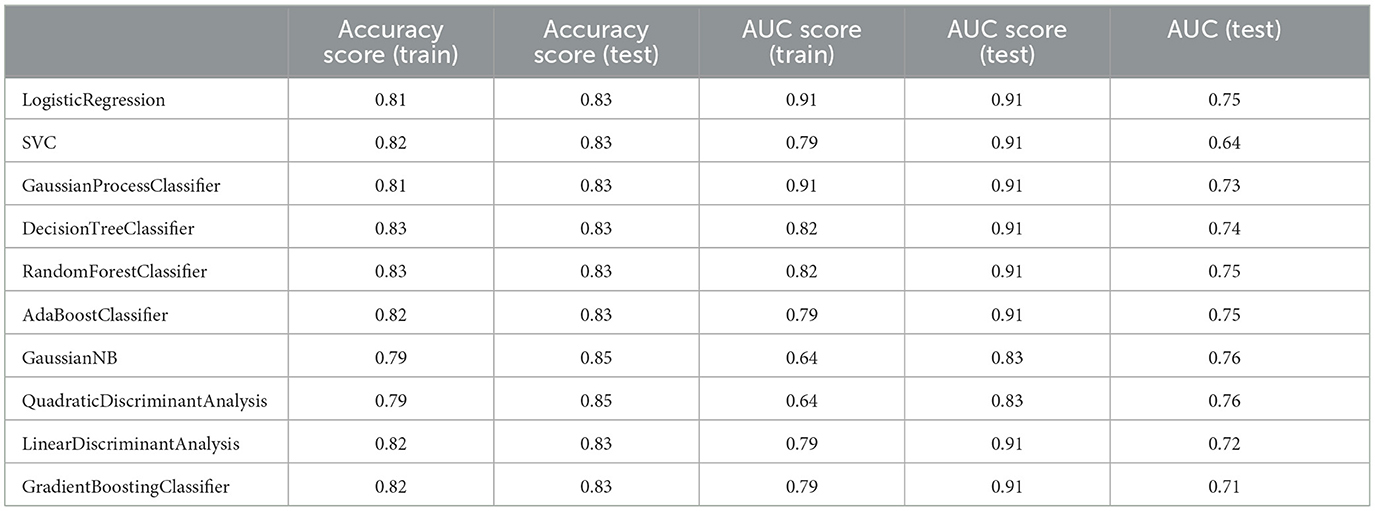
Table 9. Measuring the performance parameters of the final model built with different algorithms in train and test groups.
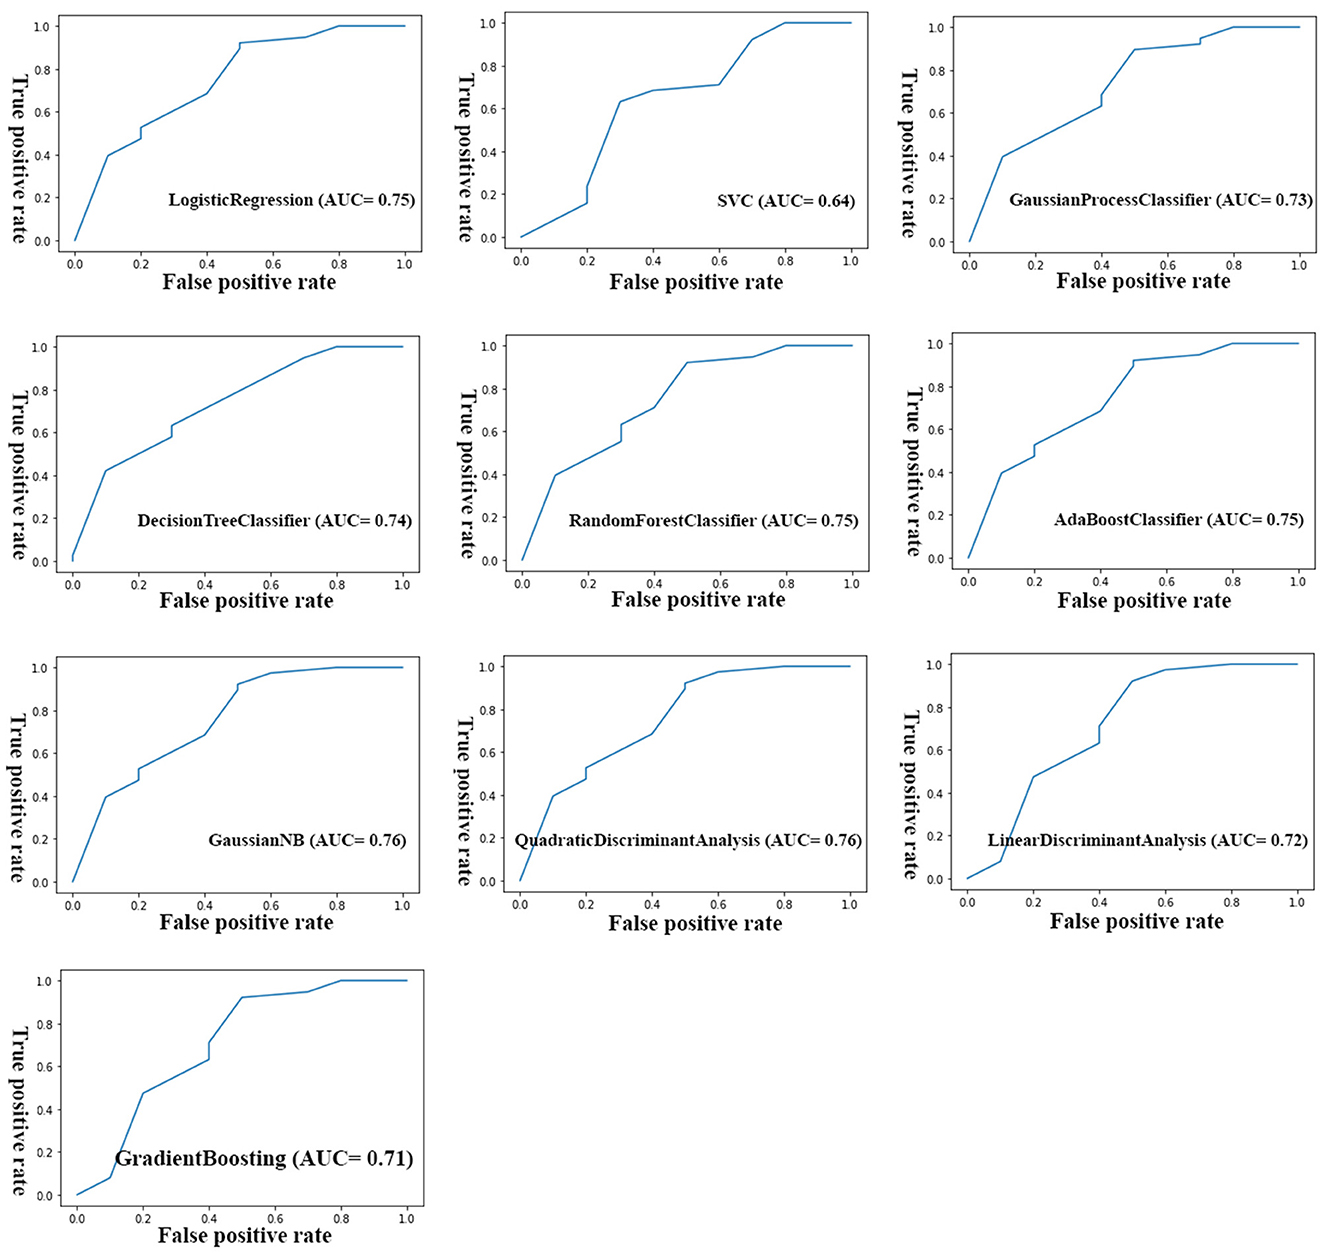
Figure 5. AUC plots of different final models built using different algorithms.
We also evaluated our final model for the overfitting problem as an undesirable ML behavior using k-fold cross-validation analysis. In overfitting models, the developed model provides accurate predictions on the training dataset, while it performs poorly on the internal/external test dataset. Our analysis showed that our final models did not suffer from overfitting, as the average of accuracy scores for 10 independent analyzes were almost the same for all but two algorithms (i.e., QuadraticDiscriminantAnalysis and LinearDiscriminantAnalysis) in the training and test groups (Table 10). However, in the two mentioned algorithms, the average accuracy scores were not significantly different between the two datasets.
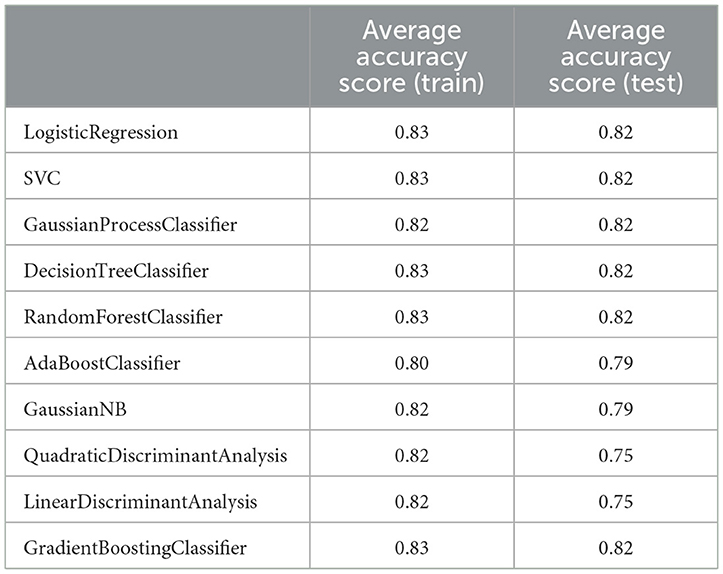
Table 10. K-fold test to check the presence of overfitting in the final model made using different algorithms (standard deviation was equal to zero in all analyses).
ML model to predict recovery time
We also developed a predictive model to estimate recovery time in studied dogs with CPV. Predictive models were trained and tested using four ML regression algorithms. In order to enter meaningful numerical and categorical variables in the model, we performed two primary statistical analyses. Among the categorical variables, only retching, foul smelling, housing, dehydration, and shift-to-left had a significant association with recovery time (Supplementary Table 7). Except body weight, all other numerical variables did not show significant correlation (r < 0.25) with recovery time (Supplementary Table 8). Body weight had a weak correlation with the dependent variable (r = 0.46). Hence, only retching, foul smelling, housing, shift-to-left and body weight were used to develop predictive models.
Recovery time in the studied dogs were 6 ± 1.8 days. The developed models predicted the recovery time in the test group with an average error rate of 2.05 days. Among the four models, the model developed using LinearRegression had the lowest error rate (RMSE = 1.86 days). Since the body weight variable had a weak correlation with the recovery time, this feature was removed in the next step and then the model was trained again. In the new model without body weight, the performance of the models improved slightly (mean RMASES = 1.88 days). Again, the developed LinearRegression model had the lowest error rate (RMSE = 1.81 days) (Table 11).
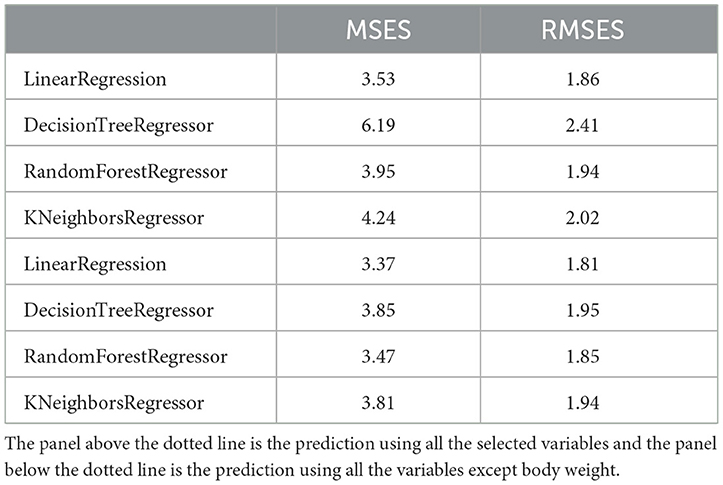
Table 11. Evaluating the performance of four regression algorithms for predicting recovery time.
Discussion
In this study, we developed models to predict clinical outcome and recovery time in dogs with CPV. Similar to our findings, in a study by Franzo et al. (18), ML models were developed using different algorithms to predict outcome in dogs with CPV infection, by using some hematology and serum biochemistry parameters, including antithrombin, serum aspartate aminotransferase, serum lipase, monocyte and lymphocyte count, in contrary to our study where we comprehensively combined various demographic, clinical and laboratory variables to develop the predictive models. As a key point in ML, we tried to build models with minimum number of variables so that these variables can be easily obtained/measured by users (here small animal clinicians). Clearly, models with a large number of variables or models with unusual and hard-to-measure variables (such as antithrombin) cannot be easily applied. Our variables in this model (SIRS, deworming, vaccination and crying) are readily available and can be effortlessly recorded by clinicians. In Franzo et al. model, random forest performed best, while in our final model, except for SVC, GaussianNB, and QuadraticDiscriminantAnalysis, all other 8 algorithms including random forest performed similarly in terms of performance criteria. Also, in the abovementioned study, no model was provided for estimating recovery time.
One of the major drawbacks of previous prognostic markers is that they usually work best 24–48 h after admission, whereas we need markers that would be useful at the time of admission. So that, we consider the variables that can be recorded at the time of admission. As shown in the results, although some hematology and cytopenia variables in the second sampling were significantly associated with clinical outcome, they were not included in the predictive models.
In our final model, the four variables of SIRS, deworming, vaccination, and crying were used to predict clinical outcome with acceptable performance. In agreement with our study, previous studies confirmed SIRS as a critical risk factor in non-surviving dogs with CPV, with dogs with SIRS having a higher mortality rate (5, 26, 27). Additionally, we found that vaccinated and dewormed pups had a lower risk of death compared to unvaccinated or untreated pups. It has been documented that vaccinated dogs had lower odds for developing CPV infection than unvaccinated dogs (4). It has been confirmed that the accumulation of parasites in the intestine can increase the severity of parvovirus enteritis in dogs (19, 28). Moreover, it was shown that sometimes a single anthelmintic treatment could be associated with an increased risk of parvovirus infection (4). As a surprising finding in our study, we found that crying was significantly associated with the risk of death in CPV-infected dogs, with crying occurring in 30% of non-surviving dogs compared to only 6.6% of surviving dogs (Table 3). To the best of our knowledge, this is the first study to introduce crying as a potential prognostic factor to predict clinical outcome in CPV enteritis.
Consistent with previous studies, reporting that parvovirus infection usually occurs in pups < 6 months of age (4, 5, 20), the mean age of our cases was 4.6 months. Furthermore, we similarly found no relationship between breed and risk of CPV enteritis (5, 29). Some studies reported breed predisposition for Doberman Pinscher and Rottweiler breeds (4, 20). Because these breeds were present in very small numbers in our study, we could not find such a significant association. In our project, we found that hematological and cytopenic variables at the time of admission did not differ between surviving and none-surviving dogs, while some of these variables (leukopenia, neutropenia, RDW and PLR) in the second sampling after admission were significantly different between the two groups. Likewise, the occurrence of leukopenia, neutropenia, and lymphopenia 24 and 48 h after admission has been reported as risk factors in none-survivor dogs with CPV enteritis (6, 20). In addition, some studies showed that initial leukopenia, neutropenia, or lymphopenia decreased the chance of survival (19, 30). Although variables such as dyspnea, PLR, NLR, and RDW are important parameters in CPV, they were not considered significant based on statistical and machine learning tests such as logistic regression analysis and other algorithms and therefore were not included in the model.
Our study also had limitations that reduced the quality of the developed models. First, we had a relatively small sample size (n = 156), which may have negatively affected the performance of the models. Clearly, with a larger population of dogs with CPV, we can achieve more powerful models with excellent AUCs. However, by using three serial screenings, we could achieve final models with strong AUC values, which could be generalized in highly populated models. The second problem was the weakness of recording information due to the lack of cooperation of clinicians or animal owners. Hence, we had to remove some cases with high missing variables. Despite all these issues, the models used in this study can be developed using a larger population of dogs and by applying more extensive data (variables) to achieve more efficient ML models for survival prediction.
Data availability statement
The original contributions presented in the study are included in the article/Supplementary material, further inquiries can be directed to the corresponding author.
Ethics statement
The animal studies were approved by University of Tehran Animal Ethics Committee. The studies were conducted in accordance with the local legislation and institutional requirements. Written informed consent was obtained from the owners for the participation of their animals in this study.
Author contributions
NS: Writing – original draft. MZ-A: Writing – original draft, Writing – review & editing. SN: Writing – original draft, Writing – review & editing.
Funding
The author(s) declare that no financial support was received for the research and/or publication of this article.
Conflict of interest
The authors declare that the research was conducted in the absence of any commercial or financial relationships that could be construed as a potential conflict of interest.
Generative AI statement
The author(s) declare that no Gen AI was used in the creation of this manuscript.
Publisher's note
All claims expressed in this article are solely those of the authors and do not necessarily represent those of their affiliated organizations, or those of the publisher, the editors and the reviewers. Any product that may be evaluated in this article, or claim that may be made by its manufacturer, is not guaranteed or endorsed by the publisher.
Supplementary material
The Supplementary Material for this article can be found online at: https://www.frontiersin.org/articles/10.3389/fvets.2025.1555714/full#supplementary-material
Supplementary Figure 1 | The workflow for removing non-informative variables.
Supplementary Figure 2 | AUC plots of different primary models built using different algorithms.
Supplementary Figure 3 | AUC plots of different final secondary built using different algorithms.
Supplementary Table 1 | Descriptive statistics and comparison of hematological parameters of the first sampling between two groups of survival and non-survival dogs infected with CPV.
Supplementary Table 2 | Frequency and statistical comparison of different parameters of cytopenia in the first sampling among two groups of survival and non-survival.
Supplementary Table 3 | Descriptive statistics and comparison of three biochemical parameters (Mg, glucose and paraoxonase enzyme) between two surviving and non-surviving groups.
Supplementary Table 4 | Measuring the performance parameters of the primary model built using SMOTE analysis and different algorithms in train and test groups.
Supplementary Table 5 | Measuring the performance parameters of the secondary model built using SMOTE analysis and different algorithms in train and test groups.
Supplementary Table 6 | Measuring the performance parameters of the final model built using SMOTE analysis and different algorithms in train and test groups.
Supplementary Table 7 | Correlation between categorical variables and recovery time. Values in this table are P values. Significant variables are in bold.
Supplementary Table 8 | Correlation coefficient between numerical variables and recovery time. Only body weight had a weak correlation with recovery time.
References
1. Reed AP, Jones EV, Miller TJ. Nucleotide sequence and genome organization of canine parvovirus. J Virol. (1988) 62:266–76. doi: 10.1128/jvi.62.1.266-276.1988
2. Decaro N, Campolo M, Desario C, Elia G, Martella V, Lorusso E, et al. Maternally-derived antibodies in pups and protection from canine parvovirus infection. Biologicals. (2005) 33:261–7. doi: 10.1016/j.biologicals.2005.06.004
3. Goddard A, Leisewitz AL. Canine parvovirus. Vet Clin N Am Small Anim Pract. (2010) 40:1041–53. doi: 10.1016/j.cvsm.2010.07.007
4. Houston DM, Ribble CS, Head LL. Risk factors associated with parvovirus enteritis in dogs: 283 cases (1982-1991). J Am Vet Med Assoc. (1996) 208:542–6. doi: 10.2460/javma.1996.208.04.542
5. Iris Kalli n, Leontides LS, Mylonakis ME, Adamama-Moraitou K, Rallis T, Koutinas AF. Factors affecting the occurrence, duration of hospitalization and final outcome in canine parvovirus infection. Res Vet Sci. (2010) 89:174–8. doi: 10.1016/j.rvsc.2010.02.013
6. Goddard A, Leisewitz AL, Christopher MM, Duncan NM, Becker PJ. Prognostic usefulness of blood leukocyte changes in canine parvoviral enteritis. J Vet Int Med. (2008) 22:309–16. doi: 10.1111/j.1939-1676.2008.0073.x
7. Pollock RV, Coyne MJ. Canine parvovirus. Vet Clin N Am Small Anim Pract. (1993) 23:555–68. doi: 10.1016/S0195-5616(93)50305-4
8. Potgieter LN, Jones JB, Patton CS, Webb-Martin TA. Experimental parvovirus infection in dogs. Can J Comp Med. (1981) 45:212–6.
9. Kocaturk M, Martinez S, Eralp O, Tvarijonaviciute A, Ceron J, Yilmaz Z. Prognostic value of serum acute-phase proteins in dogs with parvoviral enteritis. J Small Anim Pract. (2010) 51:478–83. doi: 10.1111/j.1748-5827.2010.00965.x
10. McClure V, van Schoor M, Thompson PN, Kjelgaard-Hansen M, Goddard A. Evaluation of the use of serum C-reactive protein concentration to predict outcome in puppies infected with canine parvovirus. J Am Vet Med Assoc. (2013) 243:361–6. doi: 10.2460/javma.243.3.361
11. Schoeman JP, Goddard A, Herrtage ME. Serum cortisol and thyroxine concentrations as predictors of death in critically ill puppies with parvoviral diarrhea. J Am Vet Med Assoc. (2007) 231:1534–9. doi: 10.2460/javma.231.10.1534
12. Schofield I, Brodbelt DC, Kennedy N, Niessen SJM, Church DB, Geddes RF, et al. Machine-learning based prediction of Cushing's syndrome in dogs attending UK primary-care veterinary practice. Sci Rep. (2021) 11:9035. doi: 10.1038/s41598-021-88440-z
13. Reagan KL, Deng S, Sheng J, Sebastian J, Wang Z, Huebner SN, et al. Use of machine-learning algorithms to aid in the early detection of leptospirosis in dogs. J Vet Diagn Invest. (2022) 34:612. doi: 10.1177/10406387221096781
14. Akinsulie OC, Idris I, Aliyu VA, Shahzad S, Banwo OG, Ogunleye SC, et al. The potential application of artificial intelligence in veterinary clinical practice and biomedical research. Front Vet Sci. (2024) 11:1347550. doi: 10.3389/fvets.2024.1347550
15. J G, M A, Y C, El S. Applications of machine learning in animal and veterinary public health surveillance. Rev Sci Tech. (2023) 42:3366. doi: 10.20506/rst.42.3366
16. Habehh H, Gohel S. Machine learning in healthcare. Curr Genom. (2021) 22:291–300. doi: 10.2174/1389202922666210705124359
17. Ahsan MM, Luna SA, Siddique Z. Machine-learning-based disease diagnosis: a comprehensive review. Healthcare. (2022) 10:541. doi: 10.3390/healthcare10030541
18. Franzo G, Corso B, Tucciarone CM, Drigo M, Caldin M, Cecchinato M. Comparison and validation of different models and variable selection methods for predicting survival after canine parvovirus infection. Vet Rec. (2020) 187:e76. doi: 10.1136/vr.105283
19. McCaw DL, Hoskins JD. Canine viral enteritis. In:Greene CE, , editor. Infectious Diseases of the Dog and Cat, 3rd ed. St. Louis: Saunders Elsevier (2006). p. 63–73.
20. Glickman LT, Domanski LM, Patronek GJ, Visintainer F. Breed-related risk factors for canine parvovirus enteritis. J Am Vet Med Assoc. (1985) 187:589–94. doi: 10.2460/javma.1985.187.06.589
21. Chalifoux NV, Parker SE, Cosford KL. Prognostic indicators at presentation for canine parvoviral enteritis: 322 cases (2001-2018). J Vet Emerg Crit Care. (2021) 31:402–13. doi: 10.1111/vec.13052
22. Salarpour R, Ahmadmahmudi MZ, Rezaei M, Eskandarzade N. Paraoxonase activity assessment in dogs suffering from Parvovirus infection. J Hellenic Vet Med Soc. (2020) 71:2399–504. doi: 10.12681/jhvms.25927
23. Nahm FS. Receiver operating characteristic curve: overview and practical use for clinicians. Korean J Anesthesiol. (2022) 75:25–36. doi: 10.4097/kja.21209
24. Guyon I, Weston J, Barnhill S, Vapnik V. Gene selection for cancer classification using support vector machines. Mach Learn. (2002) 46:389–422. doi: 10.1023/A:1012487302797
25. Chicco D, Warrens MJ, Jurman G. The coefficient of determination R-squared is more informative than SMAPE, MAE, MAPE, MSE and RMSE in regression analysis evaluation. PeerJ Comput Sci. (2021) 7:e623. doi: 10.7717/peerj-cs.623
26. Otto CM, Jackson CB, Rogell EJ, Prior RB, Ammons WS. Recombinant bactericidal/permeability-increasing protein (rBPI21) for treatment of parvovirus enteritis: a randomized, double-blinded, placebo-controlled trial. J Vet Int Med. (2001) 15:355–60. doi: 10.1111/j.1939-1676.2001.tb02329.x
27. Turk J, Miller M, Brown T, Fales W, Fischer J, Gosser H, et al. Coliform septicemia and pulmonary disease associated with canine parvoviral enteritis: 88 cases (1987-1988). J Am Vet Med Assoc. (1990) 196:771–3. doi: 10.2460/javma.1990.196.05.771
28. Brunner CJ, Swango LJ. Canine parvovirus infection: effects on the immune system and factors that predispose to severe disease. Comp Cont Educ Pract Vet. (1985) 85:979–88.
29. Pospischil A, Yamaho H. Parvovirus enteritis in dogs based on autopsy statistics 1978-1985. Tierarztl Prax. (1987) 15:67–71.
Keywords: canine parvovirus, machine learning, survival, prediction, dog
Citation: Sanaei N, Zamani-Ahmadmahmudi M and Nassiri SM (2025) Development of machine learning models to predict clinical outcome and recovery time in dogs with parvovirus enteritis. Front. Vet. Sci. 12:1555714. doi: 10.3389/fvets.2025.1555714
Received: 05 January 2025; Accepted: 14 March 2025;
Published: 15 April 2025.
Edited by:
Patrick Gonin, Gustave Roussy Cancer Campus, FranceReviewed by:
Aziz Ur Rehman Rehman, Ghulam Ishaq Khan Institute of Engineering Sciences and Technology, PakistanAynur Simsek, Dicle University, Türkiye
Hagar Gouda, Zagazig University, Egypt
Copyright © 2025 Sanaei, Zamani-Ahmadmahmudi and Nassiri. This is an open-access article distributed under the terms of the Creative Commons Attribution License (CC BY). The use, distribution or reproduction in other forums is permitted, provided the original author(s) and the copyright owner(s) are credited and that the original publication in this journal is cited, in accordance with accepted academic practice. No use, distribution or reproduction is permitted which does not comply with these terms.
*Correspondence: Seyed Mahdi Nassiri, bmFzaXJpbUB1dC5hYy5pcg==