 Chenbo Shi
 Qingqing Liu
 Jianqing Zhao
 Jun Luo
- Shaanxi Key Laboratory of Molecular Biology for Agriculture, College of Animal Science and Technology, Northwest A&F University, Yangling, China
Dairy goats represent a crucial species within global dairy livestock. In temperate regions with distinct seasons, dairy goats exhibit reduced reproductive activity under long photoperiod conditions—a phase termed the non-breeding season. This poses a significant challenge to sustaining year-round goat milk production. As the pivotal organ for reproduction, the molecular regulatory mechanisms of the ovary in seasonal breeding remain incompletely characterized. This study investigated the variations in gonadotropin levels in dairy goats across breeding and non-breeding seasons, alongside an evaluation of follicle size and quantity. Furthermore, ovarian differences were explored at the molecular level using transcriptomic and proteomic methodologies. The findings indicate that follicle-stimulating hormone (FSH) and luteinizing hormone (LH) levels in dairy goats are significantly reduced during the non-breeding season compared to the breeding season (p < 0.05). Furthermore, follicle sizes in dairy goats are notably larger during the breeding season relative to the non-breeding season (p < 0.05). A total of 1,115 differentially expressed genes (DEGs) were identified, comprising 749 upregulated and 366 downregulated genes. Additionally, 520 differentially expressed proteins (DEPs) were identified, with 162 upregulated and 358 downregulated. The identified common DEGs and DEPs exhibiting consistent expression patterns include TMEM205, TM7SF2, SLC35G1, GSTM1, and ABHD6. These DEGs and DEPs suppress follicular development during the non-breeding season by regulating steroid hormone biosynthesis. In conclusion, this study reveals the molecular basis underlying seasonal reproductive differences at the ovarian level in dairy goats, offering new insights into the mechanisms of their seasonal reproduction.
Introduction
As a breed specifically developed for dairy production, the dairy goat holds a significant role within the livestock industry and the dairy sector across numerous countries (1). Goat milk is rich in essential fatty acids, abundant milk proteins, and vitamins, all of which positively influence human health (2). In regions of low latitude, such as northwestern China, dairy goats demonstrate a significant decrease in reproductive activity from spring to summer (February to August). This seasonal decline often results in fluctuations in milk supply, posing challenges in consistently meeting market and consumer demands throughout the year.
The seasonal reproductive cycle of animals is a multifaceted physiological process regulated by multiple factors, primarily including photoperiod and temperature changes, with photoperiod serving as the dominant determinant (3–6). Extended daylight periods during the non-breeding season induce inactive reproductive status in dairy goats. The photoperiod modulates melatonin secretion by the pineal gland, with light cues being relayed to the pineal gland through the suprachiasmatic nucleus in the brain. This process governs the release of thyroid stimulating hormone (TSH) from the pituitary gland via melatonin, subsequently influencing the secretion of gonadotropin-releasing hormone (GnRH) by the hypothalamus. As a result, ovarian function is affected through the actions of luteinizing hormone (LH) and follicle-stimulating hormone (FSH) secreted by the pituitary gland (7). In certain mammalian species, alterations in photoperiod can modulate the activity of kisspeptin and RFRP-3 neurons within the hypothalamus, which are integral to the regulation of GnRH release. Consequently, photoperiodic changes influence the functionality of these neurons, thereby impacting the reproductive axis and dictating the timing of seasonal reproduction (8).
Estrogen (E2) and progesterone (P4) secreted by the ovaries play a central role in regulating the reproductive cycle and supporting pregnancy, while the ability of the ovaries to store oocytes directly affects female fertility (9). Notable differences exist in ovarian biological function between breeding and non-breeding seasons. Research indicates that reduced LH levels during the non-breeding season can result in slower follicular development (10). In Boer goats, the size and number of follicles during the non-breeding season are diminished compared to the breeding season (11). However, the alterations in ovarian function during the non-breeding season are intricate and necessitate further investigation into their underlying causes.
RNA sequencing (RNA-seq) provides valuable insights into genetic information at the transcriptional level. Furthermore, proteomic analysis of functional proteins enables more comprehensive elucidation of underlying molecular mechanisms. In this study, we investigated follicular development and reproductive hormone levels in dairy goats during both the breeding and non-breeding seasons to enhance our understanding of their reproductive status. Additionally, RNA-seq was employed to compare the ovarian transcriptomic profiles of dairy goats, while a 4D-DIA proteomic approach was utilized to examine the ovarian proteomic data. This dual analysis offers insights into the transcriptomic and proteomic variations in ovarian expression patterns across different seasons. The findings provide a foundation for elucidating the specific characteristics of seasonal reproduction in dairy goats and for exploring potential underlying molecular mechanisms.
Materials and methods
The experiment was performed under approval by the Animal Ethical and Welfare Committee at the Northwest Agriculture and Forestry University, China.
Animals
This study was conducted in region, Shaanxi, China (34° 16′N, 108° 4′E). The region has distinct four seasons, characterized by a continental monsoon climate, with an average annual temperature of 12°C. Following the summer solstice, the duration of daylight diminishes, prompting the dairy goats in the region to enter the breeding season. Conversely, post the winter solstice, the daylight duration increases, leading the dairy goats in the area to transition into the non-breeding season. The peak breeding season for dairy goats in the region is from August (14 h of daylight) to October (12 h of daylight), while clearly exhibit anestrus status from March (12 h of daylight) to May (14 h of daylight).
The goat breed is Xinnong Saanen dairy goats, all females were multiparous and ranged in age from 2.5 to 3.5 years, with an average body weight of 47.29 ± 7.45 kg. The diet consists of corn silage and alfalfa hay for roughage. The concentrate includes soybean meal, corn grain, bran, trace mineral salt, and vitamin-mineral premix. The concentrate-to-roughage ratio is 4:6, and they have ad libitum access to water.
Experimental design
Forty dairy goats were divided into two experimental groups, with studies conducted during the non-breeding season group (NBS group) from March to May and the breeding season group (BS group) from August to October, each lasting 6 weeks. Weekly blood samples were obtained from the goats via jugular venipuncture. Upon the conclusion of the experiment, ovarian samples from the goats were procured for subsequent analysis.
Ovaries collection and follicle counting
The ovaries were harvested under general anesthesia with xylazine hydrochloride (Administer a muscular injection at a dose of 2.5 μL/kg in accordance with the instructions; Huamu Animal Health Products Corporation), and the ovaries were collected in a sterile operating room. Following the surgery, the goats were placed in quiet and clean pens for 7 days, with daily iodine disinfection of the wounds. The follicle count was recorded, and the diameter of each follicle was measured using a ruler. Follicles with a diameter smaller than 2.5 mm and larger than 2.5 mm were categorized as small-sized and large-sized follicles, respectively. The ovarian tissues were preserved in liquid nitrogen for subsequent transcriptomic and proteomic sequencing analyses.
RNA sequencing
The total RNA of the ovaries was extracted by Trizol reagent (Invitrogen, United States), according to the instructions of the manufacturer. The purity and concentration of the extracted RNA were detected by NanoDrop 2000A Spectrophotometer (Thermo Fisher Scientific, United States). According to the manufacturer’s manual, cDNA libraries and sequencing were performed at Allwegene Company (Beijing, China). Briefly, mRNAs were extracted from total RNA using oligo (dT) magnetic beads and then broken into short fragments. The fragmented mRNAs were reverse-transcribed into cDNAs which were then amplified by PCR.
The cDNA libraries were sequenced using Illumina HiSeq 2000. Clean data were obtained by removing reads containing adapters and low-quality reads from the raw data. Subsequent analyses were performed using the clean data. The clean redas were mapped to the Capra hircus reference genome Capra_hircus. ARS1.1 Calculate the number of clean reads mapped to each gene, and standardize gene expression using the RPKM (Reads per kilobase per million mapped reads) method. Based on RPKM-normalized results, gene expression levels are evaluated, with genes satisfying p < 0.05 and |FoldChange| > 2identified as differentially expressed genes (DEGs). CPM (Counts per million mapped reads) data are used to assess the quality and accuracy of transcriptomic analyses.
R software (Ggplot2 R package) was used for plot, and Kyoto Encyclopedia of Genes and Genomes (KEGG) enrichment analysis was performed using the OmicShare tool.2 Gene Ontology (GO) enrichment analysis was performed and the results visualized with the OmicShare tool, an online platform for data analysis.3 KEGG pathways or GO terms with p < 0.05 were considered significantly enriched in DEGs.
4D-DIA proteomics
Ovarian samples were retrieved from liquid nitrogen storage and pulverized using liquid nitrogen. Subsequently, 200 mg of the pulverized sample was transferred to a centrifuge tube, and 300 μL of RIPA buffer solution was added and mixed thoroughly. Cryogenic grinding was performed using steel beads at 70 Hz for 4 min, followed by centrifugation at 12,000 rpm for 10 min at 4°C. The samples then underwent ultrasonic treatment in an ice-water bath for 15 min to ensure complete lysis. A second centrifugation was conducted at 12,000 rpm for 10 min at 4°C, and the supernatant was collected for further analysis.
The protein concentration was quantified utilizing the Bicinchoninic Acid (BCA) assay. Subsequently, peptide samples were prepared for instrumental analysis. In summary, proteins underwent precipitation via acetone, followed by reconstitution, reduction, and alkylation. Trypsin was then employed for enzymatic digestion of the proteins. Subsequently, trifluoroacetic acid (TFA) was used to remove sodium deoxycholate (SDC) from the peptide samples. Following desalting, the samples were prepared for instrumental analysis.
For each sample, 200 ng of total peptides were separated and analyzed with a nano-UPLC (nanoElute2) coupled to a timsTOF Pro2 instrument (Bruker) with a nano-electrospray ion source. Vendor’s raw MS files were processed using SpectroMine software (4.2.230428.52329) and the built-in Pulsar search engine.
The statistical analysis of the dataset was primarily executed utilizing R software (version 4.0). Protein raw intensity values underwent normalization via the median. The identification of significantly different proteins was conducted using the R package metaX, applying a filtration based on two criteria: a p-value < 0.05 from the T-test and a fold change > 1.2. Enrichment analyses for GO and KEGG Pathways of the differentially expressed proteins were performed using hypergeometric tests, with functional terms deemed significantly enriched if they exhibited a p-value < 0.05. The subcellular localization of proteins was analyzed using the WoLF PSORT software.4
Real-time quantitative PCR
Extract total RNA using the previously described method. Subsequently, 1,000 ng of RNA was reverse transcribed into cDNA utilizing the PrimeScript™ RT reagent Kit with gDNA Eraser (Takara, China). The sequences and GenBank accession numbers of the primers employed for target gene amplification are presented in Table 1. Quantitative detection of the target genes was performed using the SYBR Green PCR Master Mix (Takara, China). The relative gene expression was analyzed using the 2 − ΔΔCt method.
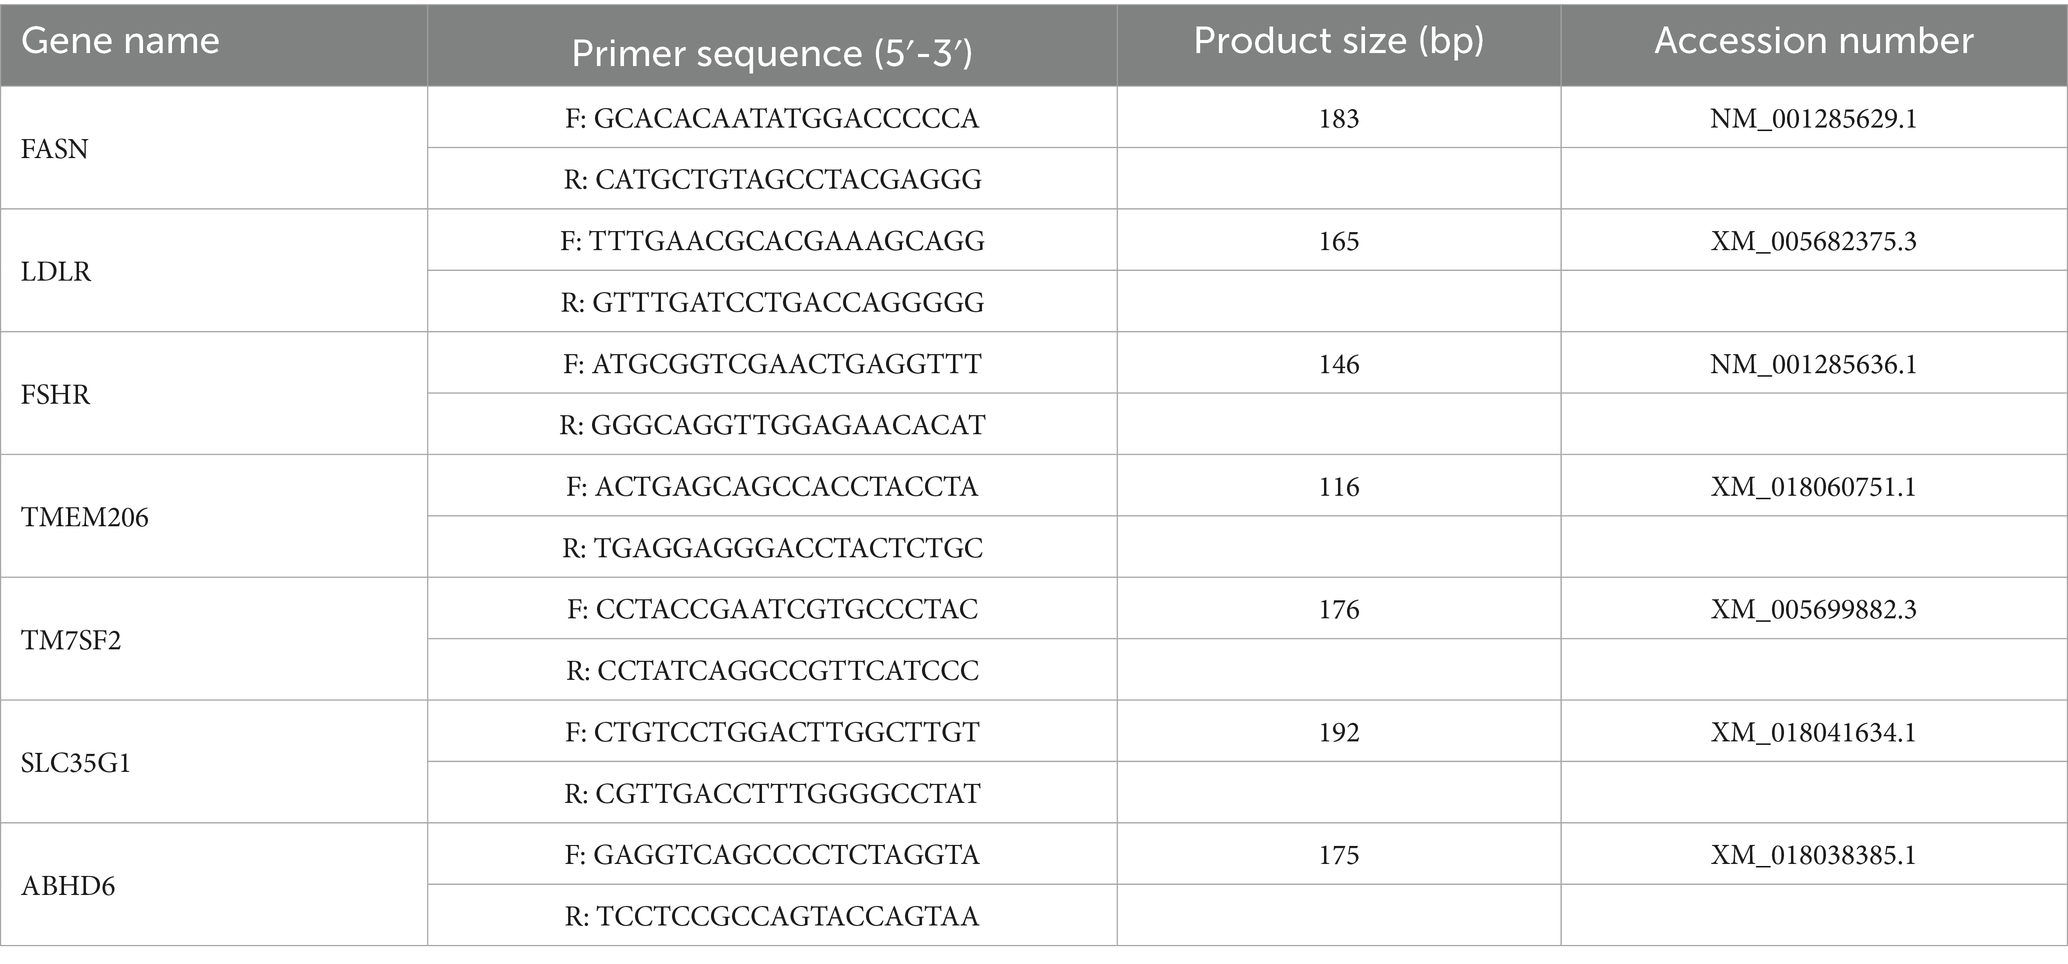
Table 1. Primers used for the qRT-PCR validation.
Elisa assay
Centrifuge the blood samples at 3000 rpm for 5 min to collect the serum. Use the ELISA kit (Fankew, China) according to the manufacturer’s instructions to detect FSH and LH in the serum.
Statistical analyses
Statistical analyses were conducted utilizing SPSS software version 17.0 (SPSS Inc., Chicago, IL, United States), incorporating a minimum of three independent replicates. Independent sample t-tests were employed to compare the two groups, with all data expressed as mean ± standard error of the mean (S. E. M.). A p-value of less than 0.05 was deemed statistically significant. The levels of significance are denoted as follows: * indicates p < 0.05, ** indicates p < 0.01, and *** indicates p < 0.001.
Results
Reproductive hormone levels and follicle counts
During the six-week experimental period, the levels of FSH and LH in dairy goats were assessed weekly. Serum FSH levels during weeks 1, 3, 4, and 6 of the breeding season were significantly higher than those in the non-breeding season (p < 0.05), while serum LH levels during weeks 1, 2, and 5 of the breeding season were significantly higher than those in the non-breeding season (p < 0.05; Figures 1A,B). Despite these findings, FSH levels at weeks 2 and 5 showed no significant difference (p > 0.05), and LH levels at weeks 3, 4, and 6 also exhibited no significant difference (p > 0.05; Figures 1A,B). Additionally, an analysis of follicular size and quantity indicated that, relative to the non-breeding season, dairy goats in the breeding season exhibited a greater number of large-sized follicles (p < 0.05) and fewer small-sized follicles (p < 0.05), while the total follicle count remained statistically unchanged (p > 0.05; Figure 1C).
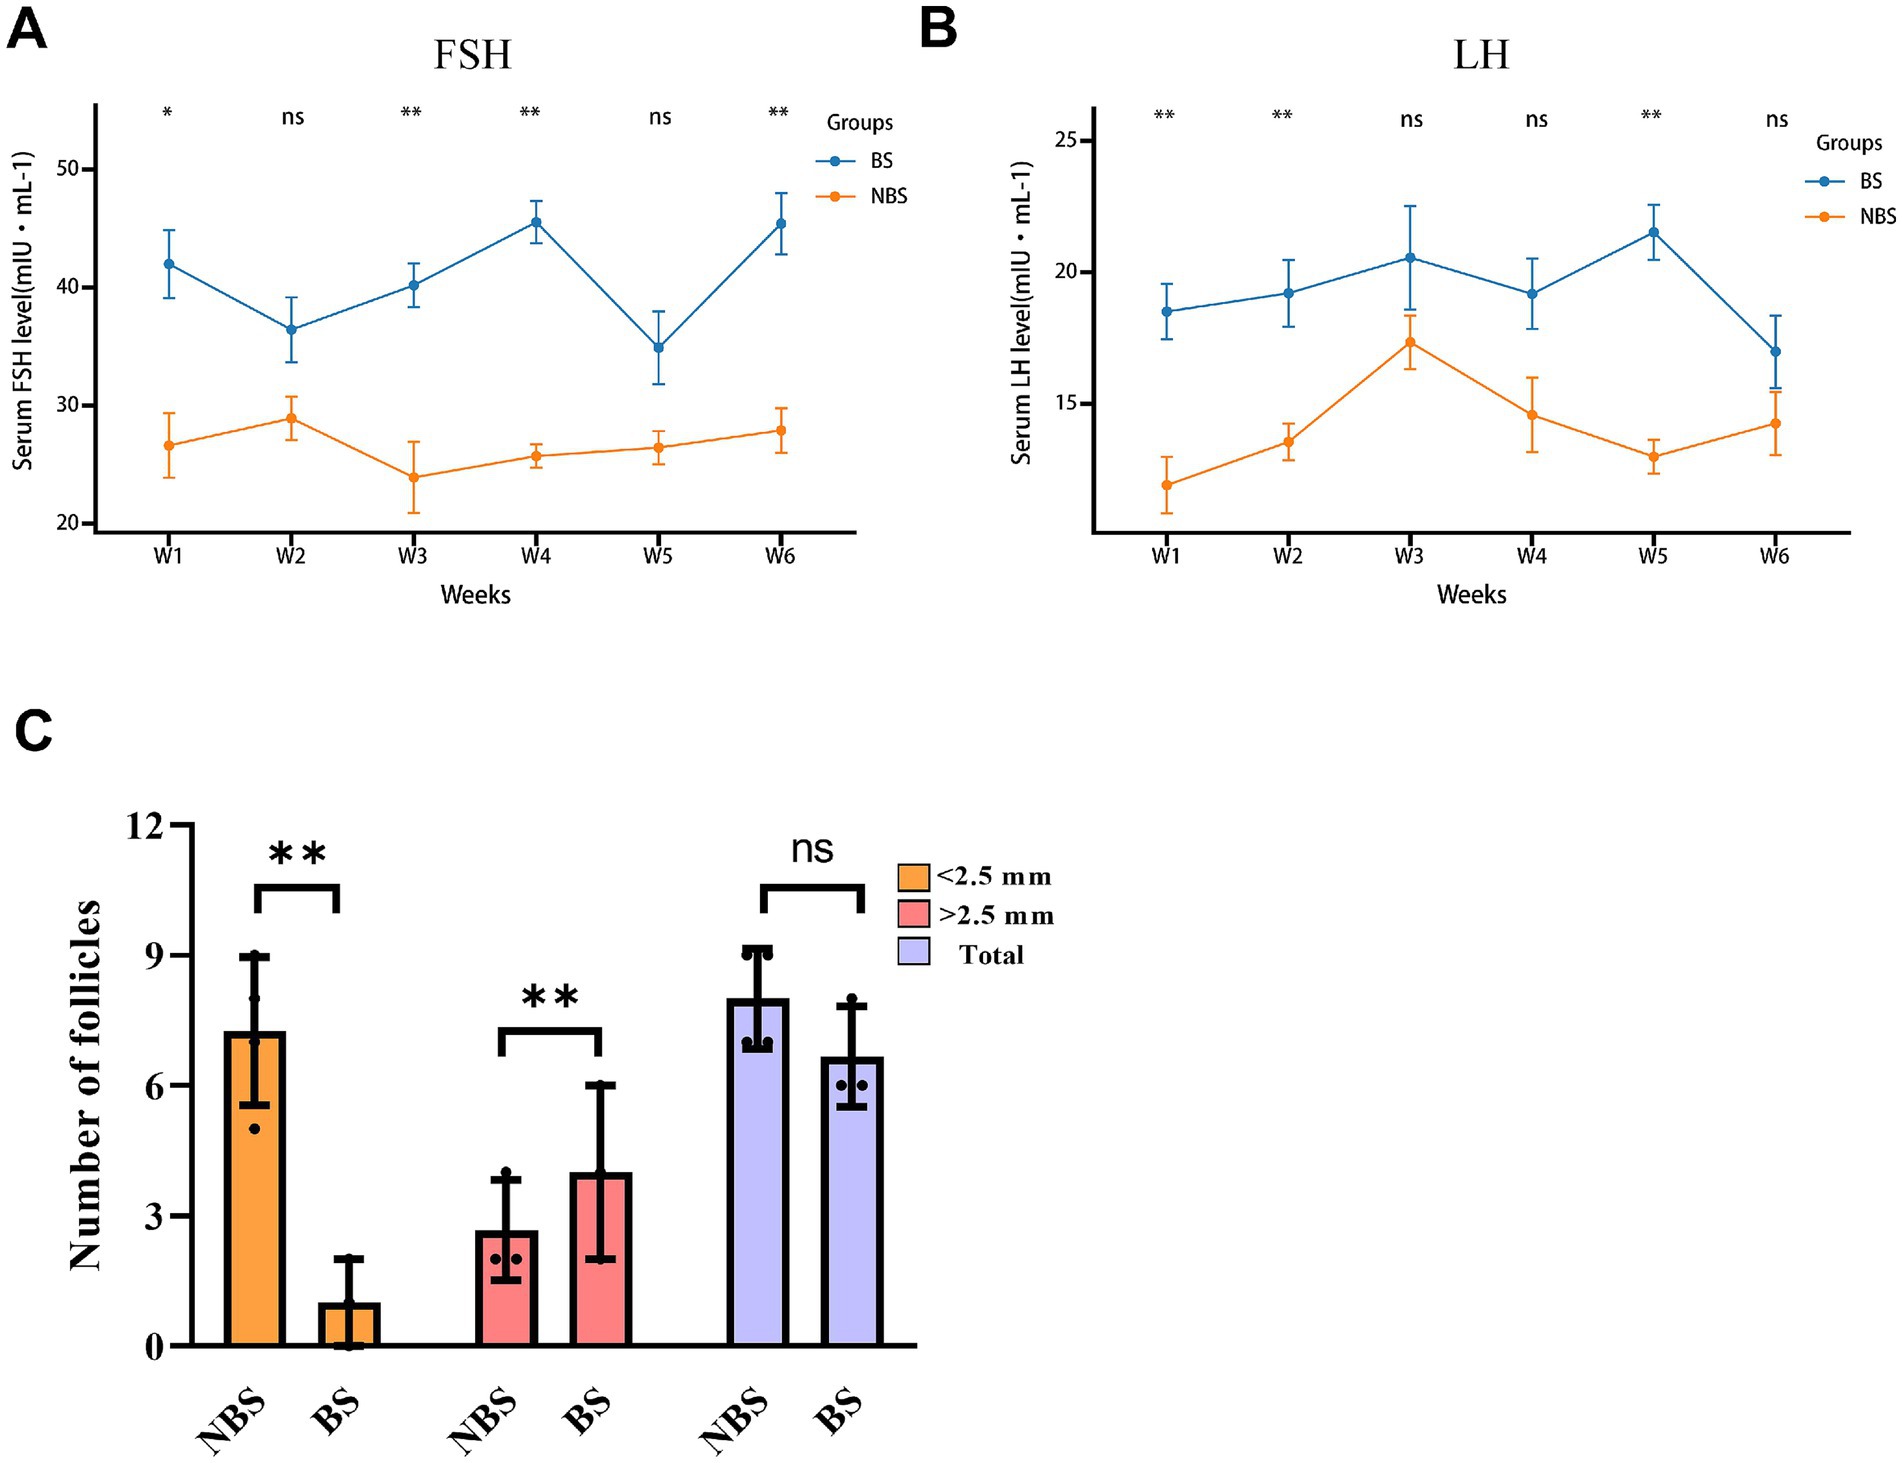
Figure 1. Levels of FSH and LH in the serum and follicle count in dairy goats during the breeding and non-breeding seasons. The contents of FSH (A) and LH (B) in serum were measured by ELISA. (C) Size and number of ovarian follicles.*p < 0.05, **p < 0.01, ns > 0.05.
Transcriptome analysis
The principal component analysis (PCA) results illustrate the distribution of samples across the first two principal components (PC1 and PC2), with PC1 accounting for 37.5% of the variance and PC2 accounting for 24.7% (Figure 2A). A total of 954 DEGs were identified between the NBS and BS groups, with 749 genes upregulated in the NBS group and 366 genes upregulated in the BS group (Figures 2B,C). A comprehensive analysis of the top 20 DEGs revealed that the log2(fc) values for integrin subunit beta 6 (ITGB6), fibrous sheath interacting protein 2 (FSIP2), and acid phosphatase 3 (ACP3) were upregulated by factors of 10.9, 10.7, and 10.5, respectively (Table 2). Conversely, the log2(fc) values for G protein-coupled Receptor 22 (GPR22) and pyroglutamylated RFamide peptide receptor (QRFPR) were downregulated by factors of 10.6 and 10.0, respectively (Table 2).
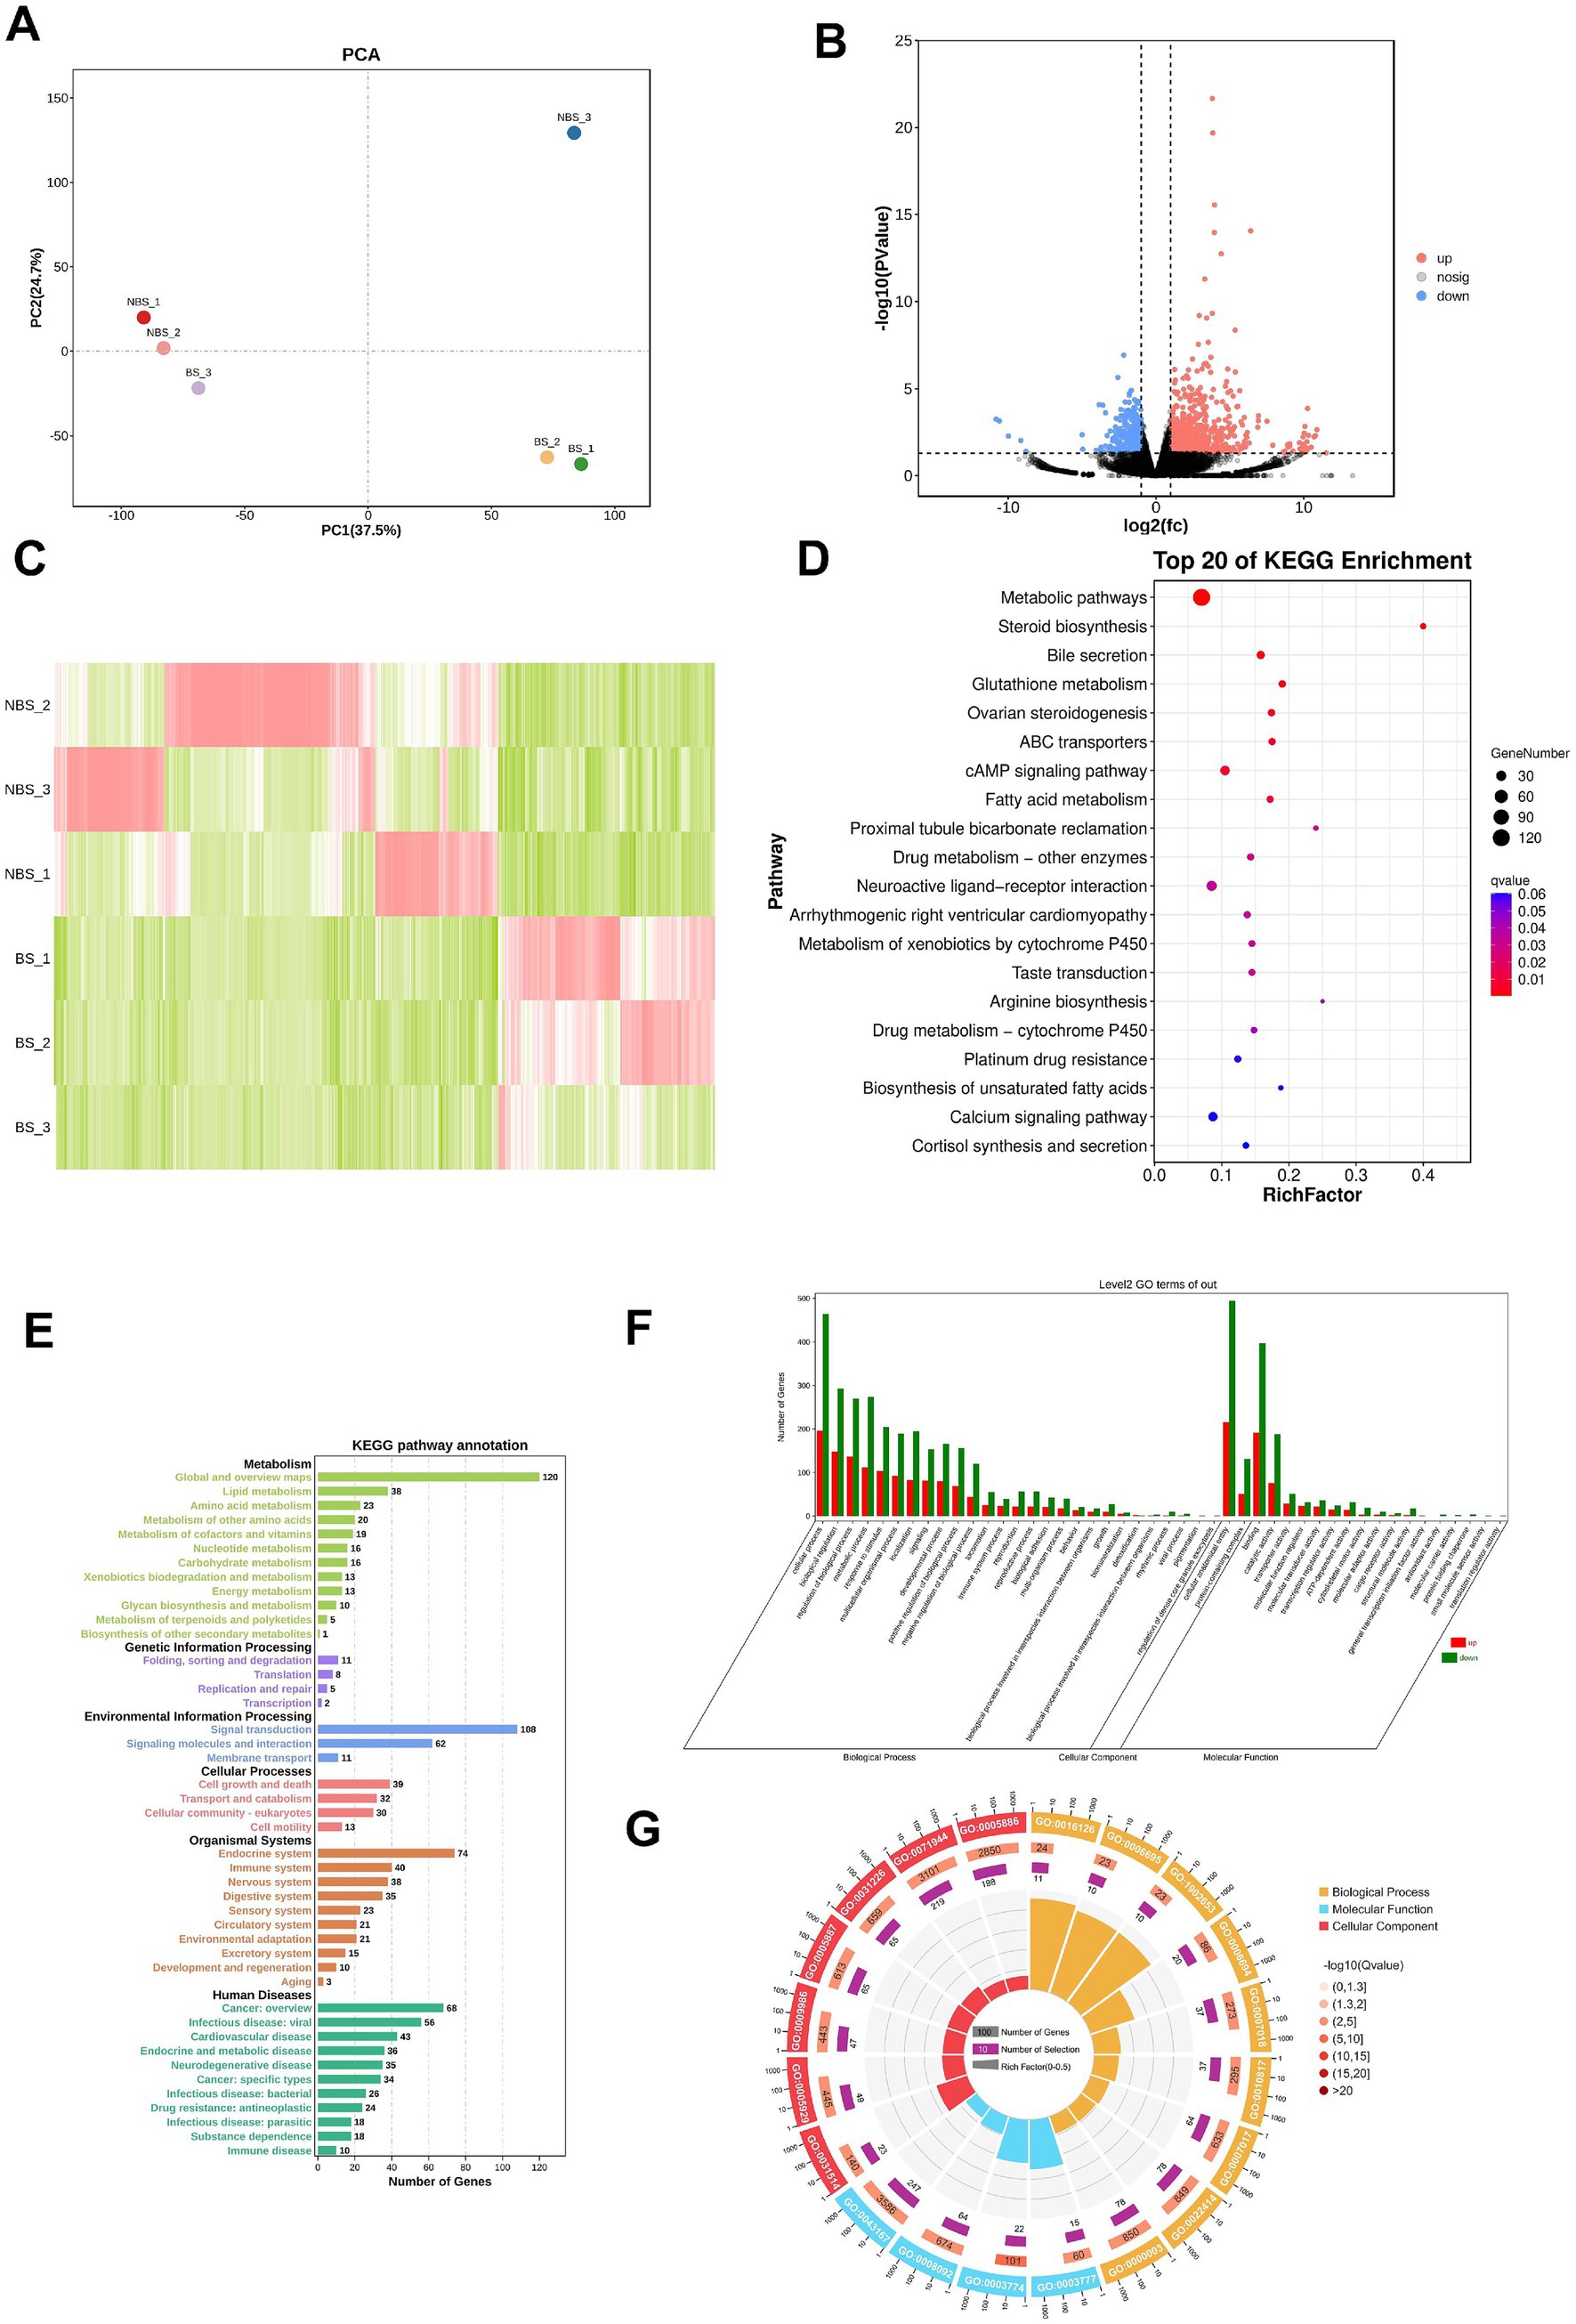
Figure 2. Transcriptome sequencing and bioinformatics analysis. (A) PCA analysis. (B) Volcano plot. (C) Heatmap of DEGs. (D) Top 20 pathways obtained from KEGG pathway enrichment. (E) KEGG pathway annotation. (F) GO terms enrichment analysis. (G) Enrichment circle plot of GO terms.
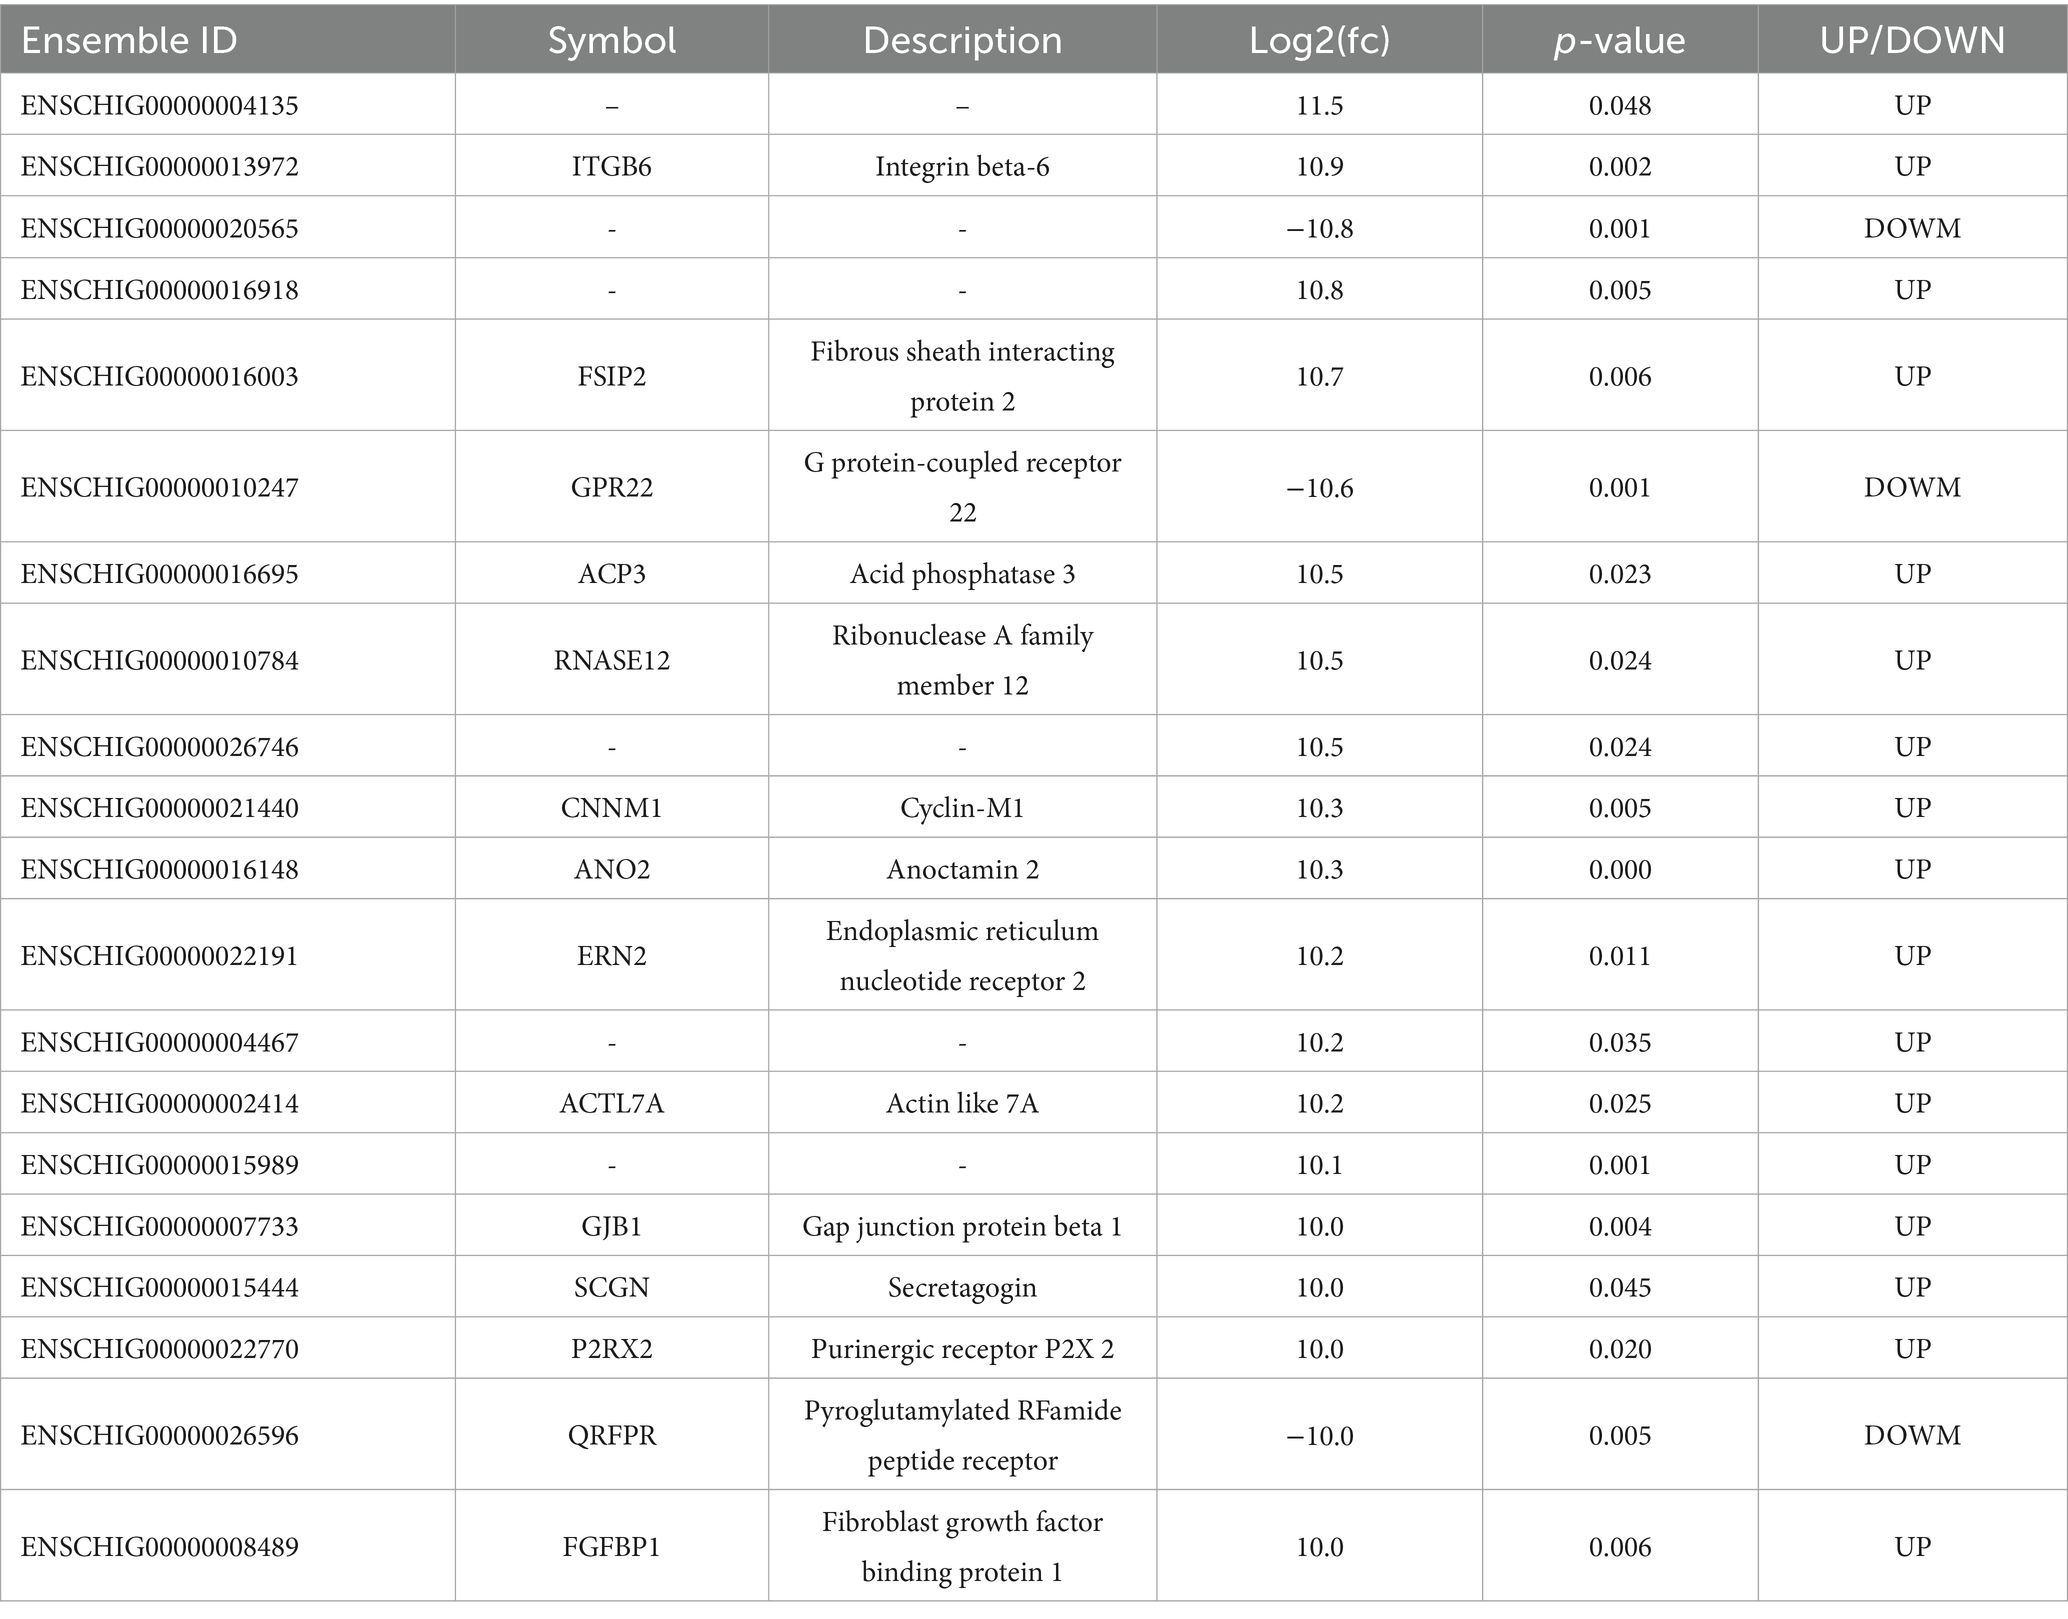
Table 2. The top 20 upregulated or downregulated DEGs in NBS vs. BS.
KEGG enrichment analysis identified the top 20 pathways significantly enriched with DEGs (Figure 2D). Among these, 120 DEGs were significantly enriched in metabolic pathways, 8 DEGs in steroid biosynthesis, 8 DEGs in glutathione metabolism, and 12 DEGs in ovarian steroidogenesis. The enriched pathways are predominantly annotated in categories such as metabolism, genetic information processing, environmental information processing, cellular processes, organizational systems, and human diseases (Figure 2E). Notably, metabolism accounts for the highest number of annotated pathways (12 pathways), whereas environmental information processing accounts for the fewest (only 3 pathways; Figure 2E).
GO analysis identified the top 20 terms that are significantly enriched among the DEGs, categorizing them into three primary domains: biological process, molecular function, and cellular component (Figures 2F,G). The terms exhibiting the highest distribution of DEGs include cellular anatomical entity, cellular process, binding, and biological regulation (Figures 2F,G).
Proteomic analysis
The results of 4D-DIA proteomics analysis showed that principal component analysis (PCA) revealed the distribution of principal components, with PC1 accounting for 73.1% of the variance and PC2 for 8.2% (Figure 3A). In comparison to NBS group, the BS group exhibited 162 upregulated and 358 downregulated differential expressed proteins(DEPs), as illustrated in the volcano plot and heatmap (Figures 3B,D). Subcellular localization analysis revealed that the DEPs are predominantly situated in the nucleus, cytoplasm, and mitochondria (Figure 3C). Table 3 presents the log2 fold change (fc) values for the top 20 DEPs, highlighting that LOC108633460, solute carrier family 35 member (SLC35G1), and grancalcin (GCA) were upregulated by 8.20, 7.67, and 7.71 times, respectively. Conversely, the log2 (fc) values for LysM domain containing 3 (LYSMD3) and histone acetyltransferase (KAT2A) were reduced by 5.69 and 5.64 times, respectively (Table 3).
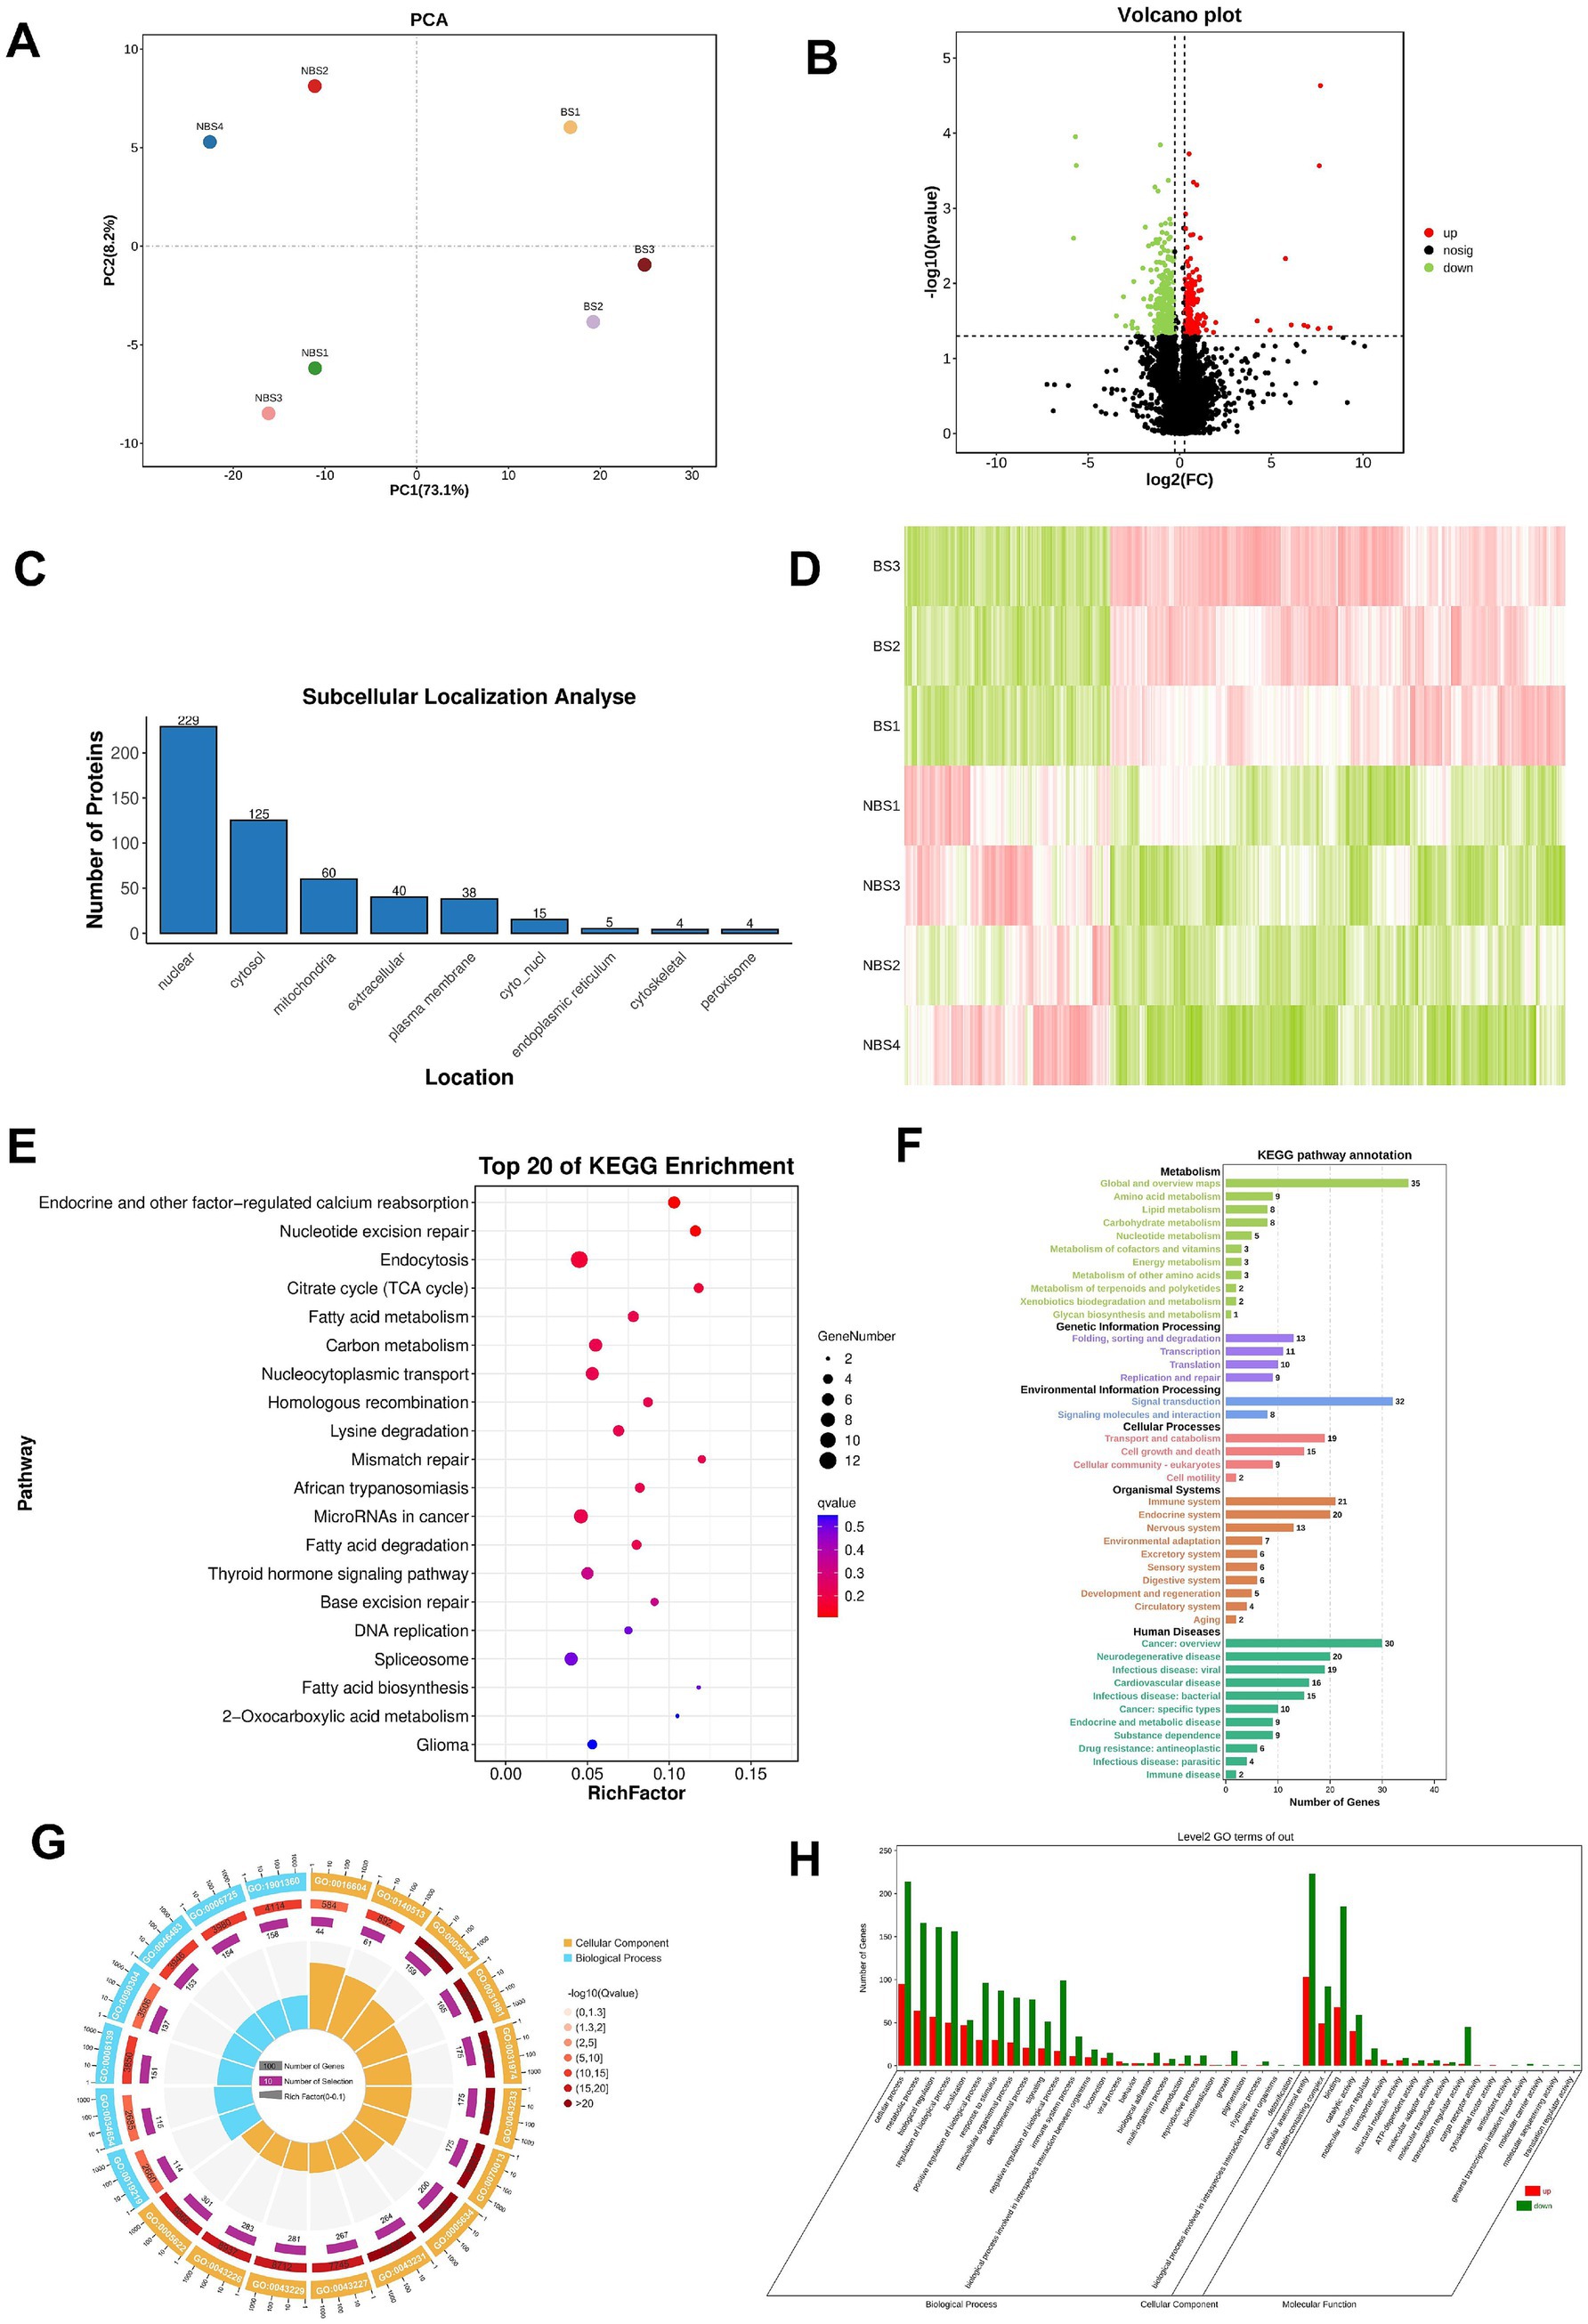
Figure 3. Proteomic sequencing and bioinformatics analysis. (A) PCA analysis. (B) Volcano plot. (C) Subcellular localization of DEPs. (D) Heatmap of DEPs. (E) Top 20 pathways obtained from KEGG pathway enrichment. (F) KEGG pathway annotation. (G) Enrichment circle plot of GO terms. (H) GO terms enrichment analysis.
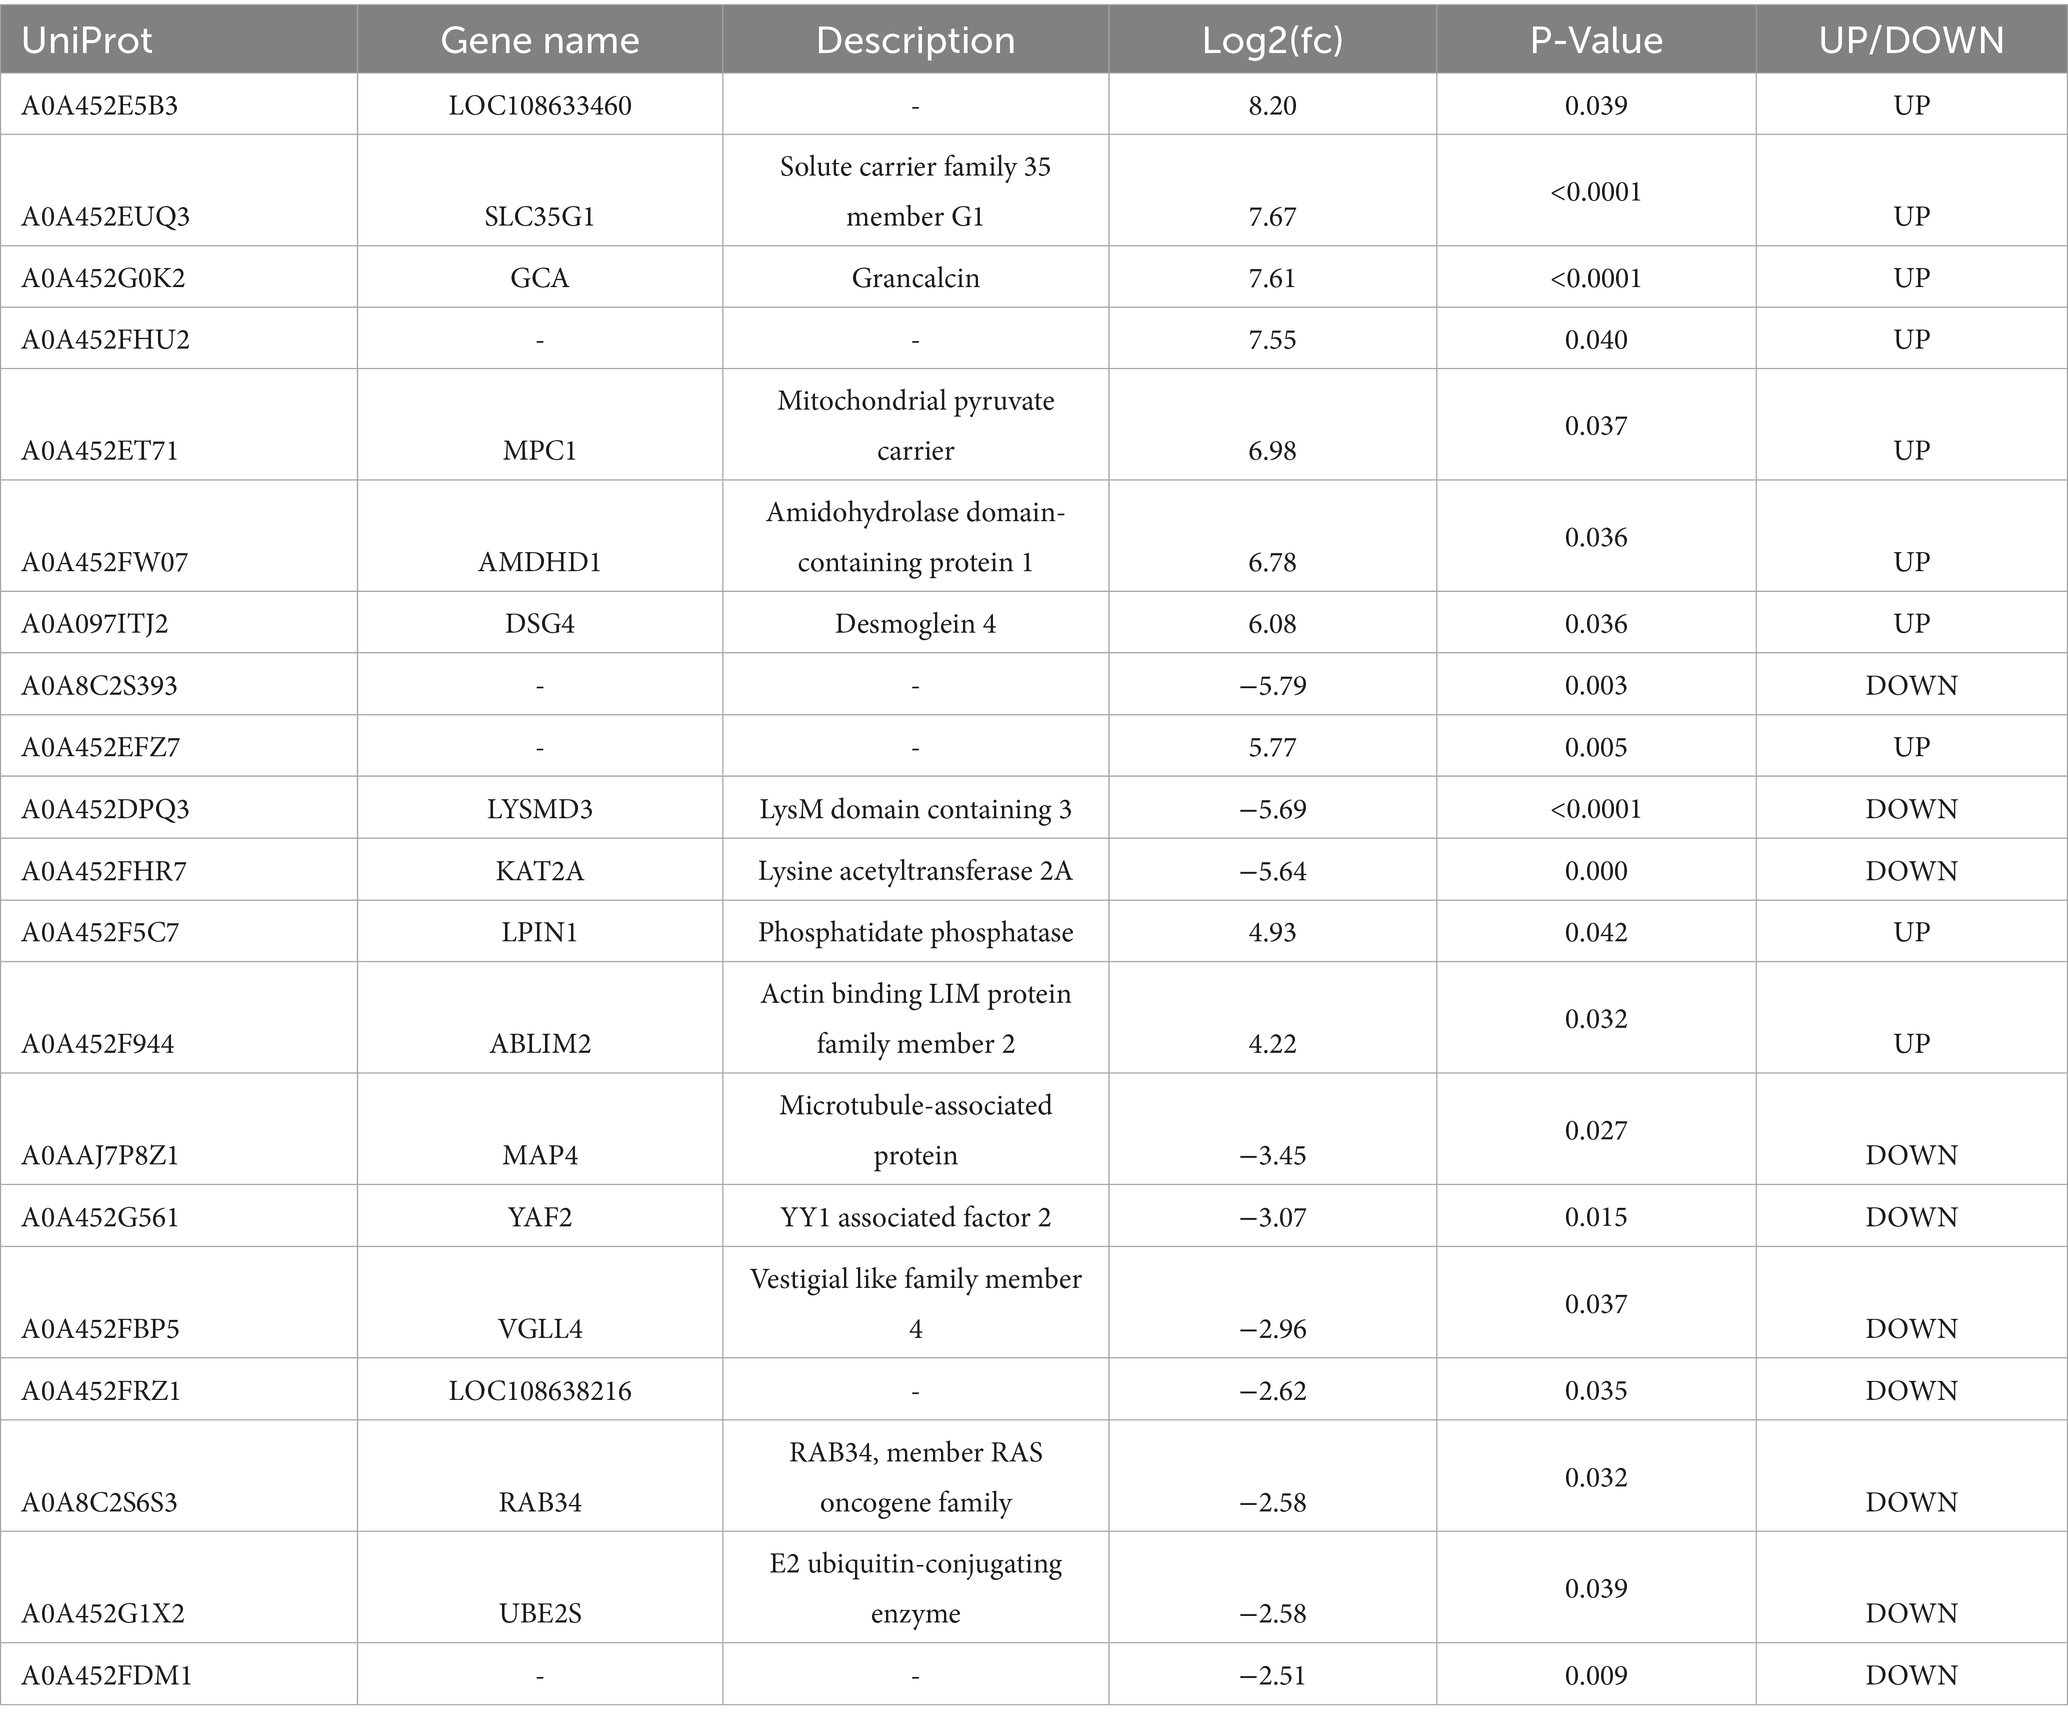
Table 3. The top 20 upregulated or downregulated DEPs in NBS vs. BS.
KEGG enrichment analysis identifies the top 20 enriched pathways, with the five most significant being endocrine and other factor-regulated calcium reabsorption, nucleotide excision repair, endocytosis, citrate cycle (TCA Cycle), and fatty acid metabolism. Additionally, the thyroid hormone signaling pathway, associated with steroid hormone synthesis, is also enriched (Figure 3E). Pathway annotation results indicate that there are 11 pathways each annotated to metabolism and human diseases (Figure 3F).
Furthermore, Gene Ontology (GO) analysis identifies the top 20 significantly enriched terms among the DEPs, with cellular anatomical entity, cellular process, and binding exhibiting the highest distribution of DEPs. These top 20 terms are categorized exclusively under cellular component and biological process, with no classification under molecular function (Figures 3G,H).
Conjoint analysis of DEGs and DEPs
To overcome the constraints of analyzing a single omics dataset and to improve the precision and dependability of bioinformatics analysis, a joint analysis of DEGs and DEPs was conducted. Seven common DEGs/DEPs were identified, with transmembrane protein 205 (TMEM205), transmembrane 7 superfamily member 2 (TM7SF2), solute carrier family 35 member G1 (SLC35G1), glutathione S-transferase (GSTM5), abhydrolase domain containing 6, acylglycerol lipase (ABHD6), E2 ubiquitin-conjugating enzyme (UBE2S) and insulin-like growth factor-binding protein 2 (IGFBP2)exhibiting similar expression patterns in both DEGs and DEPs (Figure 4).
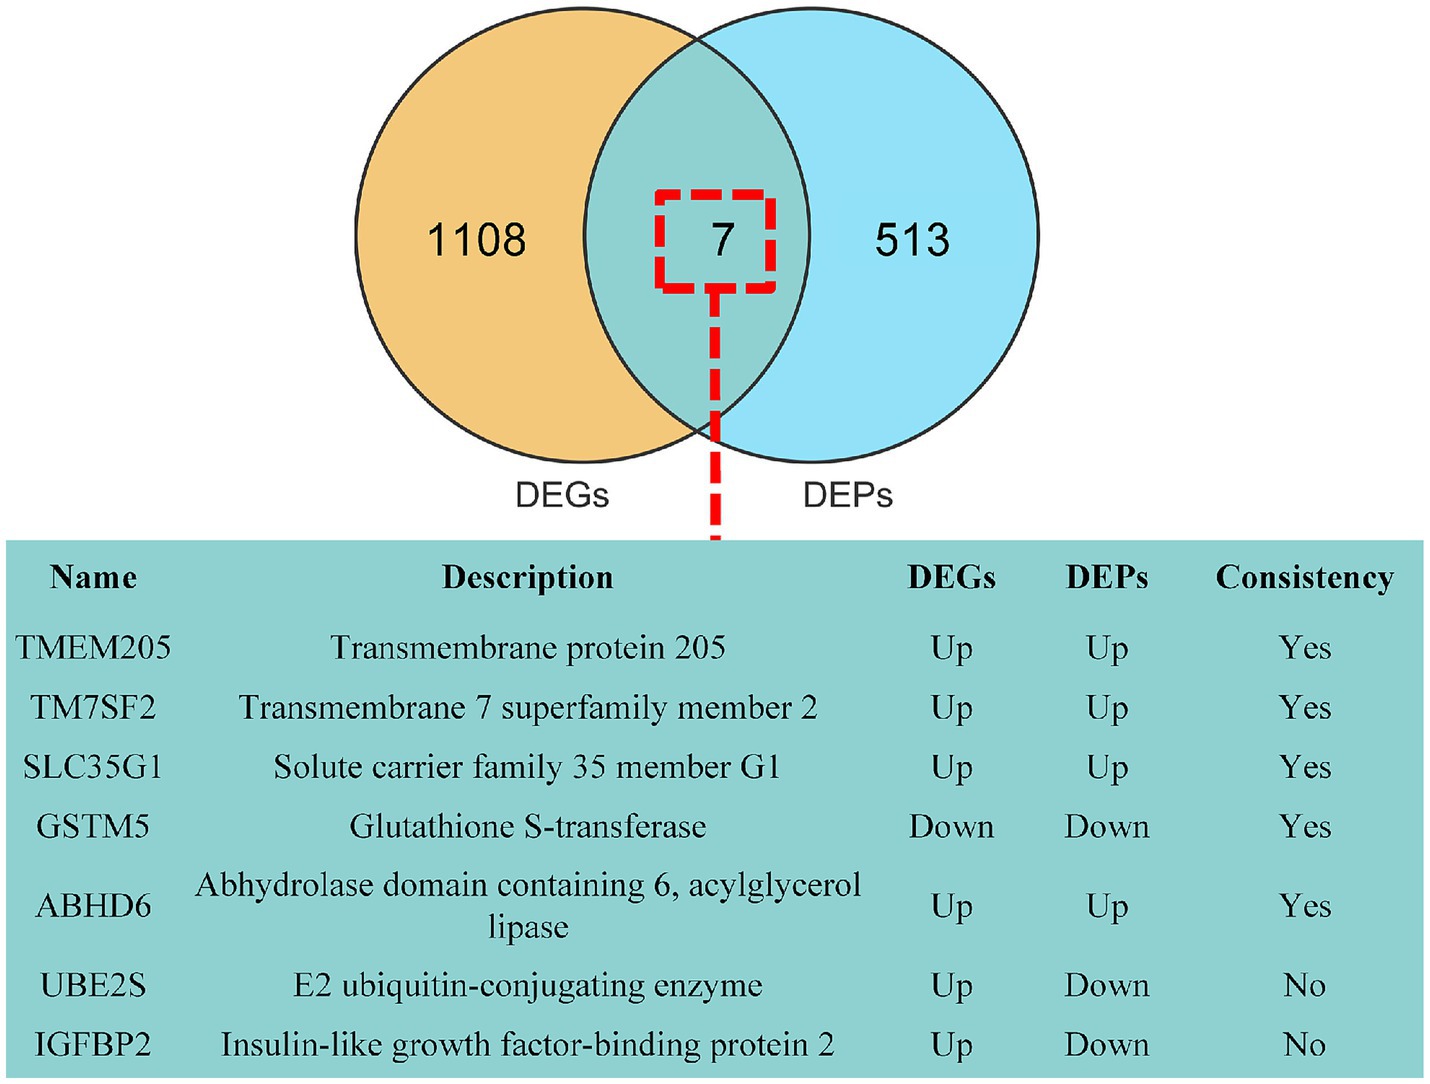
Figure 4. Conjoint Analysis of DEGs and DEPs. There are 7 shared DEGs/DEPs (green).
Validation of selected DEGs by qRT-PCR
qRT-PCR validation was conducted on genes associated with ovarian hormone synthesis, in addition to the four shared genes identified from DEGs and DEPs. In the ovarian tissues of dairy goats during the breeding season, the expression levels of fatty acid synthase (FASN) (p < 0.01), low-density lipoprotein receptor (LDLR) (p < 0.05), follicle stimulating hormone receptor (FSHR) (p < 0.05), TMEM205 (p < 0.05), TM7SF2 (p < 0.05), ABHD6 (p < 0.01) and SLC35G1 (p < 0.05) were significantly increased (Figures 5A–G), and the fold change showed a trend similar to the corresponding counts per million (CPM) values in the RNA sequencing results, indicating the accuracy of the RNA sequencing data (Figure 5H).
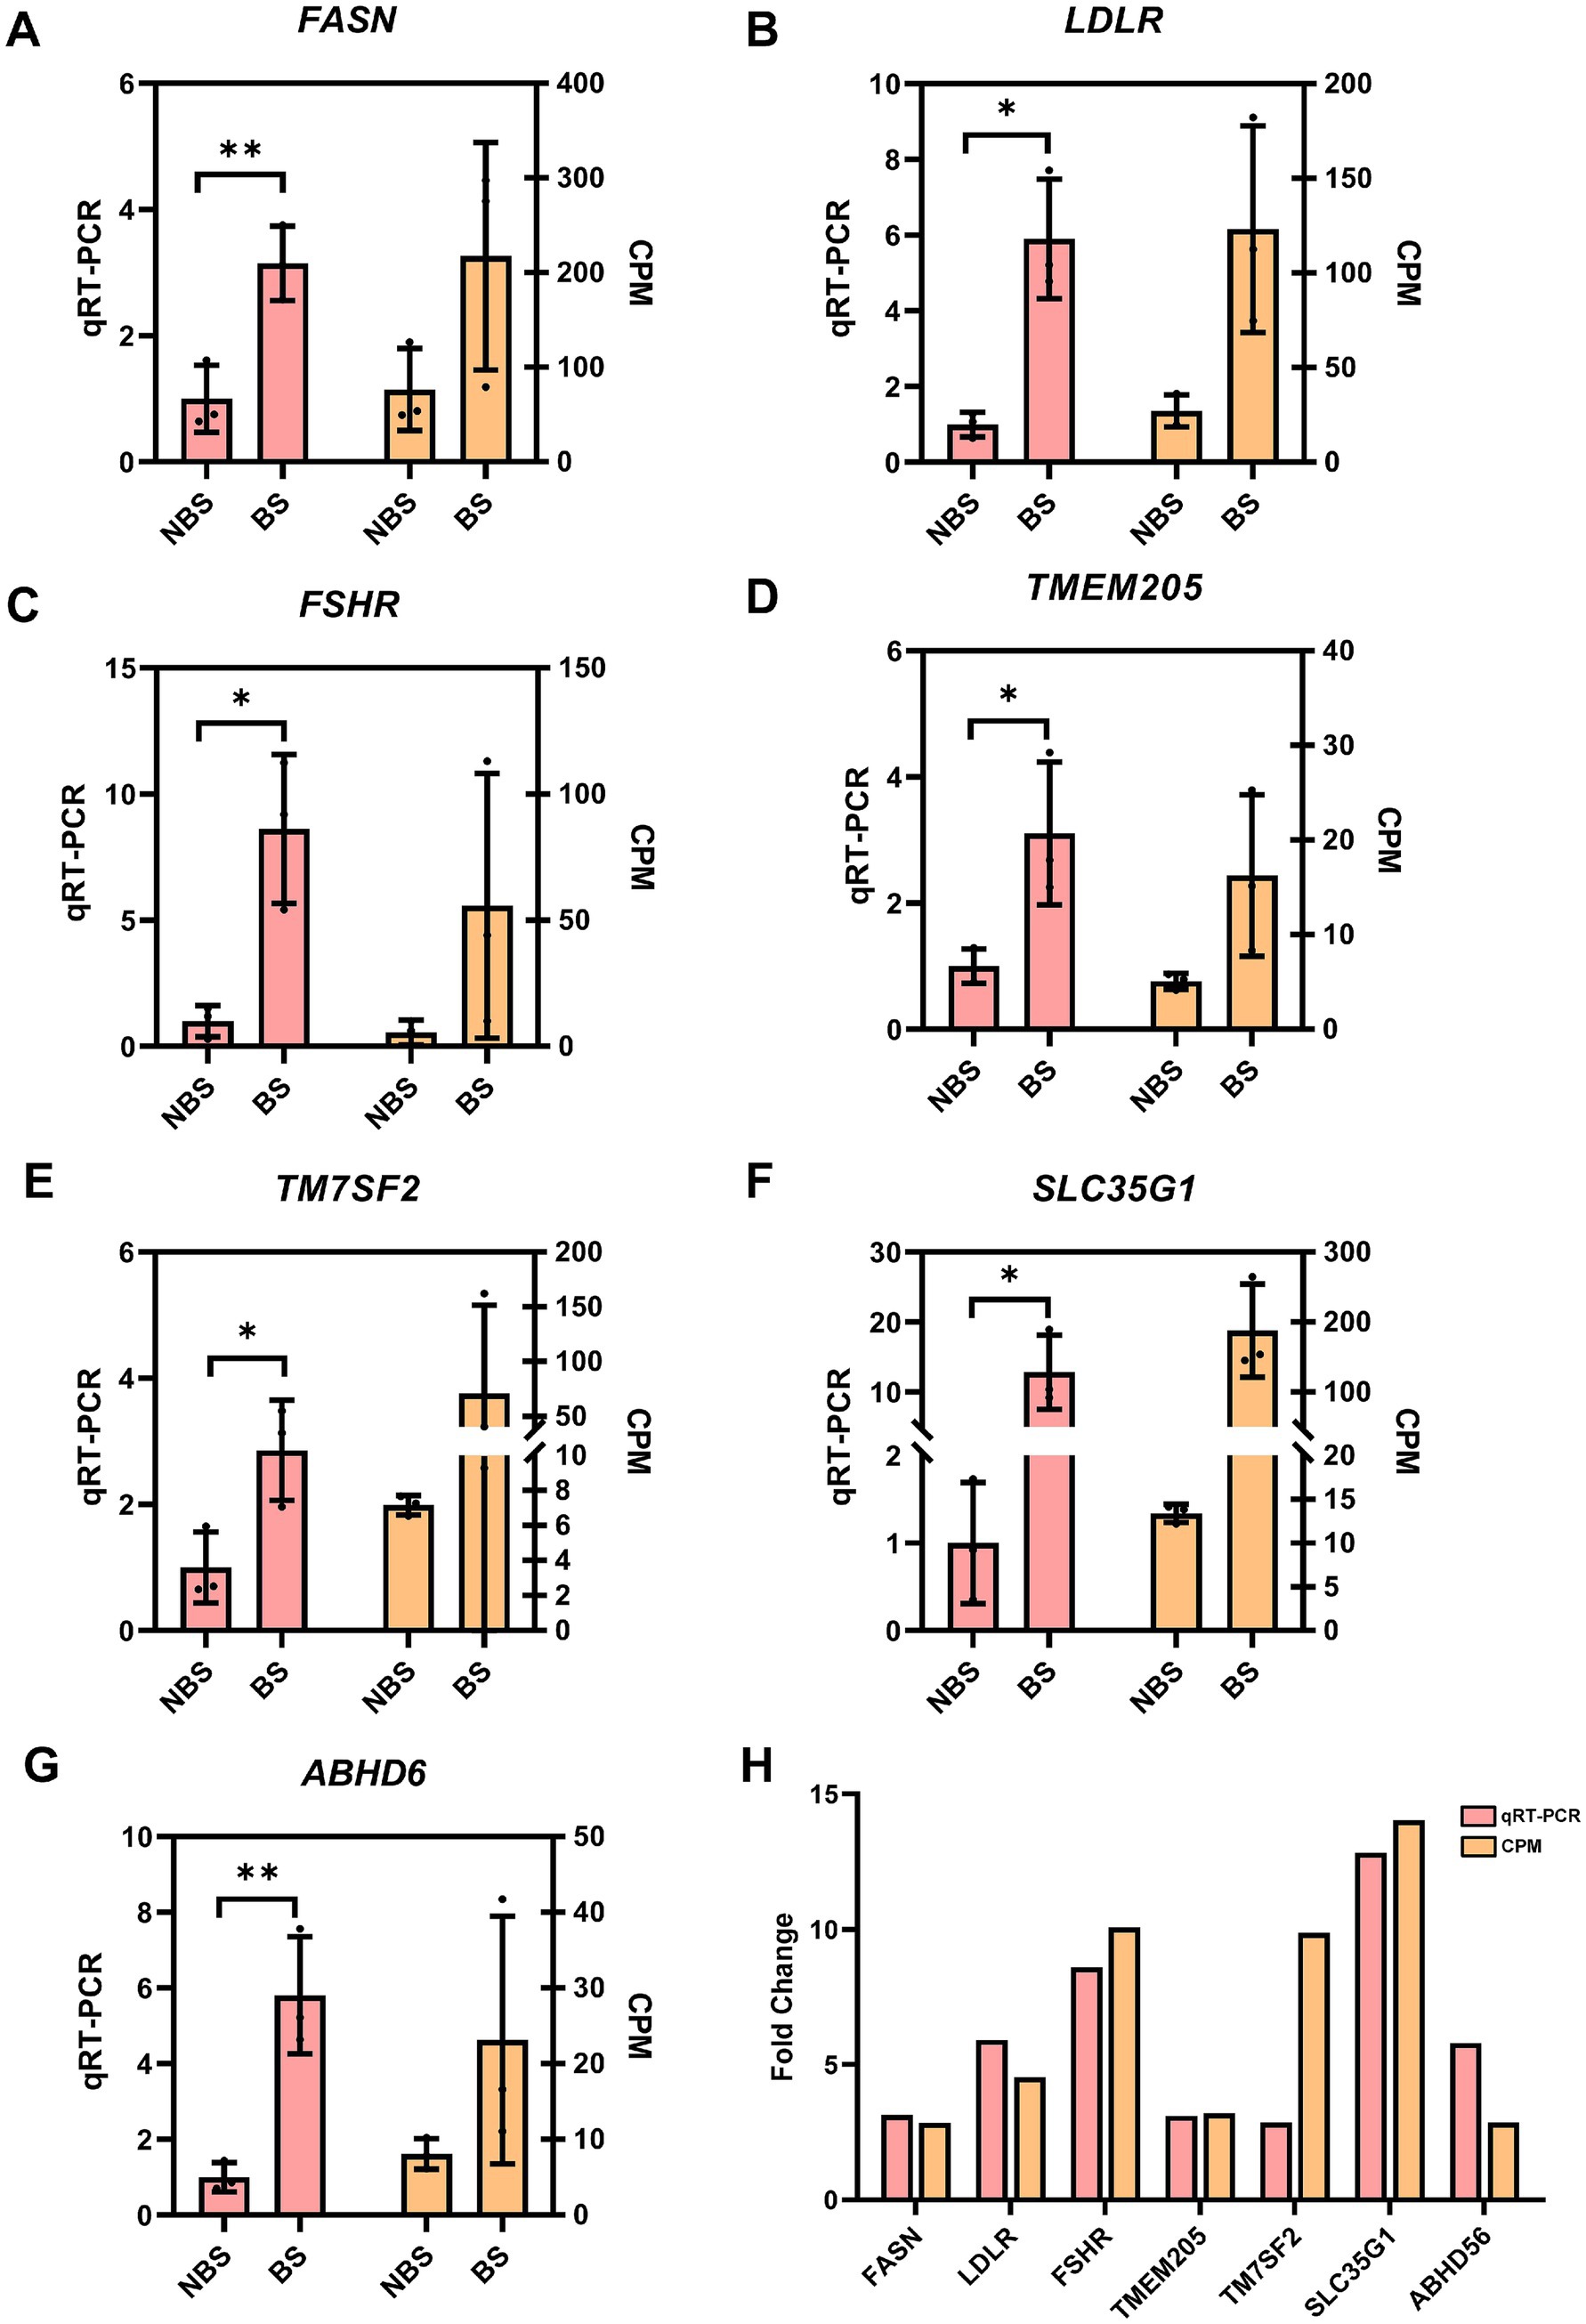
Figure 5. The expression of some DEGs were verified by qRT-PCR. The CPM value(right Y-axis) was taken as the relative expression level of DEGs(left Y-axiss). (A) FASN. (B) LDLR. (C) FSHR. (D) TMEM205. (E) TM7SF2. (F) SLC35G1. (G) ABHD6. (H) Fold change between qRT-PCR and CPM. The relative expression level of DEGs were analyzed with independent sample t-tests.*p < 0.05, **p < 0.01.
Discussion
The regulation of reproductive hormones, including FSH and LH, is a multifaceted process influenced by a range of factors, encompassing environmental cues and intrinsic physiological mechanisms. In seasonally breeding species such as goats, the secretion of these hormones is typically downregulated during the non-breeding season, resulting in diminished reproductive activity. The seasonality of goat reproduction is primarily governed by alterations in photoperiod, which modulate the negative feedback exerted by estradiol on LH secretion. Specifically, during extended photoperiods, the negative feedback of E2 is enhanced, leading to reduced LH secretion and the suppression of ovulation (12, 13). Similarly, during the non-breeding season, goats exhibit decreased levels of FSH (14). The administration of PMSG or other pharmacological agents that stimulate FSH release can induce ovulation in goats during this period. In this study, we observed that the overall concentrations of FSH and LH in the bloodstream of dairy goats during the non-breeding season are significantly lower than those observed during the breeding season. FSH and LH are pivotal gonadotropins that regulate various dimensions of ovarian follicular development, including follicular growth, maturation, and ovulation. FSH is particularly critical for follicle maturation and development, whereas LH plays a significant role in follicular development and oocyte maturation (15, 16). Furthermore, existing research suggests that follicular development is subject to seasonal influences (17, 18). Our study reveals that follicle size in dairy goats is reduced during the non-breeding season compared to the breeding season, which we attribute to diminished levels of FSH and LH during the non-breeding period. Consequently, the analysis of hormone concentrations and follicle counts indicates that the ovarian activity of dairy goats is in a quiescent state during the non-breeding season relative to the breeding season.
To further investigate the potential genetic factors underlying the differences in seasonal reproductive status, we conducted transcriptomic analysis and 4D-DIA proteomic analysis, identifying several DEGs and DEPs that may be related to ovarian function. In the study of ovarian aging, ITGB6 is associated with the remodeling of the extracellular matrix, which may affect the fibrotic process of the ovary. Studies have shown that ITGB6 is highly expressed in the stromal cells of aged ovaries and is associated with the cell-stromal junction process (19). In addition, previous studies have indicated that ITGB6 promotes lipid metabolism in ovarian cancer through its interaction with the PI3K signaling pathway (20). GPR22 is classified as a G protein-coupled receptor. Although research on the role of GPR22 in ovarian function is still limited, existing evidence indicates the involvement of G protein-coupled receptors in follicular development, ovulation, and ovarian steroid hormone metabolism. Within the ovarian context, the activation of the G protein-coupled estrogen receptor (GPER) is intimately associated with critical processes such as cell proliferation, differentiation, and apoptosis, all of which are essential for oocyte growth and ovulation (21). Additionally, G protein-coupled receptor 30 (GPR30) has been identified as a regulatory factor in the secretion of gonadotropins in cattle, underscoring its potential importance in reproductive regulation (22). SLC35G1 was significantly upregulated in granulosa cells of different sizes of follicles compared to follicular membrane cells (23). It was found that the leukemia inhibitory factor promoted the expression of KAT2A in vitro maturation of bovine oocytes (24). The KEGG enrichment analysis reveals that the DEGs and DEPs are predominantly associated with metabolic pathways and pathways related to steroid synthesis. Metabolic pathways are integral to ovarian hormone secretion and follicular development, with metabolic status exerting a significant influence on ovarian function. This is particularly pertinent as metabolic pathways are intrinsically linked to follicle maturation (25). During follicular development, the synthesis of steroid hormones, such as estradiol and progesterone, is facilitated by both granulosa and theca cells, with secretion levels being directly modulated by FSH and LH (26). In the initial stages of follicular development, FSH enhances the expression of the steroidogenic acute regulatory protein (StAR) in granulosa cells via its receptors, thereby augmenting the transport of cholesterol to the mitochondria—a critical step in steroid synthesis (27). Concurrently, LH, through its receptors in theca cells, upregulates the expression of steroidogenic enzymes, thereby promoting the synthesis of steroid hormones (26). Our GO analysis reveals a significant enrichment of terms related to cellular processes and biological regulation among the differentially expressed genes, with a particular emphasis on those associated with ovarian development and hormone secretion. In the context of follicular development, ovarian granulosa cells engage in bidirectional communication with oocytes, a process that is crucial for the development and functionality of both cell types. Current research suggests that the interactiono between granulosa cells and oocytes can elucidate changes in gene expression during follicle maturation, as evidenced by transcriptomic analyses (28).
The integration of multi-omics analyses offers insights into various tiers of biological systems. Our comprehensive analysis of DEGs and DEPs revealed 5 common DEGs/DEPs, which demonstrated consistent expression patterns in both the transcriptomic data and RT-qPCR validation. This concordance underscores the reliability of the transcriptomic findings. The TMEM205 gene, which encodes the transmembrane protein 205, is a member of the transmembrane protein family (29). Although research on this gene is currently limited, evidence suggests that mutations in TMEM205 may be associated with chemotherapy resistance in ovarian cancer (30). Research has shown that TM7SF2 is involved in the steroidogenic biosynthetic pathways of ovarian granulosa cells (31). Combining this with our results, it can be inferred that TM7SF2 may influence follicle maturation by affecting hormone synthesis in granulosa cells. Additionally, SLC35G1 is expressed in granulosa cells, with expression levels in follicles of varying sizes surpassing those in theca cells (23). This suggests that SLC35G1 may contribute to the functional differences in synthesis between granulosa and theca cells, functions that are tightly regulated by FSH and LH, potentially due to seasonal variations in LH and FSH levels in dairy goats. Research has demonstrated that human subjects possessing the GSTM1 deletion genotype exhibit significantly reduced testosterone levels (32). This phenomenon may be attributed to the role of GSTM1 as a steroid-binding protein, implying that GSTM1 potentially regulates steroid synthesis and thereby influences the seasonal reproductive status of dairy goats. Conversely, limited research exists regarding the role of ABHD6 in ovarian function. Research on ABHD6 and ovarian function is scarce; however, some studies have confirmed that estrogen can promote high expression of ABHD6 in women immune cells (33). There is a wealth of research indicating that estrogen can influence estrus in goats (34, 35). This suggests that the secretion of ovarian estrogen may differ between the breeding and non-breeding seasons.
Conclusion
In conclusion, this study utilized transcriptomic and proteomic sequencing to investigate the molecular basis of seasonal reproductive differences in dairy goats. We, respectively, identified 1,115 DEGs and 520 DEPs in ovarian tissue between the breeding and non-breeding seasons. Critically, our results demonstrate reduced FSH and LH levels and impaired follicular development during the non-breeding season. Furthermore, functional analyses strongly suggest that the genes TMEM205, TM7SF2, SLC35G1, GSTM1, and ABHD6 contribute to suppressed ovarian function in the non-breeding season, through regulating specific roles in steroid hormone synthesis pathways. These findings offer new insights into the molecular mechanisms underlying seasonal variations in dairy goat ovaries, presenting innovative strategies to mitigate seasonal anestrus and enhance year-round milk production.
Data availability statement
The transcriptomics datasets generated during the current study are available in NCBI SRA (PRJNA1280907), https://www.ncbi.nlm.nih.gov/bioproject/PRJNA1280907. The mass spectrometry proteomics data have been deposited to the ProteomeXchange Consortium, https://proteomecentral.proteomexchange.org, via the iProX partner repository with the dataset identifier PXD065416.
Ethics statement
The animal study was approved by the Institutional Animal Care and Use Committee of Northwest A&F University. The study was conducted in accordance with the local legislation and institutional requirements.
Author contributions
CS: Data curation, Writing – original draft. QL: Supervision, Writing – review & editing. WW: Writing – review & editing. QH: Resources, Writing – review & editing. JZ: Writing – review & editing. FZ: Methodology, Writing – review & editing. LZ: Methodology, Writing – review & editing. JL: Conceptualization, Funding acquisition, Writing – review & editing.
Funding
The author(s) declare that financial support was received for the research and/or publication of this article. This research was jointly supported by the National Key Research and Development Program of China (no. 2021YFD1600704). Shaanxi Livestock and Poultry Breeding Double-chain Fusion Key Proiect of China (2022GD-TSLD-46-0201), Hohhot City Science and Technology Plan Project (Major Science and Technology Special Project) in China (no. 2023150103000025). This work received support from the high-performance computing (HPC) resources at Northwest A&F University (NWAFU).
Conflict of interest
The authors declare that the research was conducted in the absence of any commercial or financial relationships that could be construed as a potential conflict of interest.
Generative AI statement
The authors declare that no Gen AI was used in the creation of this manuscript.
Publisher’s note
All claims expressed in this article are solely those of the authors and do not necessarily represent those of their affiliated organizations, or those of the publisher, the editors and the reviewers. Any product that may be evaluated in this article, or claim that may be made by its manufacturer, is not guaranteed or endorsed by the publisher.
Footnotes
1. ^https://ftp.ensembl.org/pub/release-111/fasta/capra_hircus
2. ^https://www.omicshare.com/tools/home/report/koenrich.html
References
1. Zhao, JQ, Mu, YP, Gong, P, Liu, BL, Zhang, FH, Zhu, L, et al. Whole-genome resequencing of native and imported dairy goat identifies genes associated with productivity and immunity. Front Vet Sci. (2024) 11:11. doi: 10.3389/fvets.2024.1409282
2. Cabiddu, A, Delgadillo-Puga, C, Decandia, M, and Molle, AG. Extensive ruminant production systems and Milk quality with emphasis on unsaturated fatty acids, volatile compounds, antioxidant protection degree and phenol content. Animals (Basel). (2019) 9:771. doi: 10.3390/ani9100771
3. Liddle, TA, Stevenson, TJ, and Majumdar, G. Photoperiodic regulation of avian physiology: from external coincidence to seasonal reproduction. J Exp Zool A Ecol Integr Physiol. (2022) 337:890–901. doi: 10.1002/jez.2604
4. Nakane, Y, and Yoshimura, T. Photoperiodic regulation of reproduction in vertebrates. Annu Rev Anim Biosci. (2019) 7:173–94. doi: 10.1146/annurev-animal-020518-115216
5. Poissenot, K, Chorfa, A, Moussu, C, Trouillet, AC, Brachet, M, Chesneau, D, et al. Photoperiod is involved in the regulation of seasonal breeding in male water voles (Arvicola terrestris). J Exp Biol. (2021) 224. doi: 10.1242/jeb.242792
6. Simonneaux, V. A kiss to drive rhythms in reproduction. Eur J Neurosci. (2020) 51:509–30. doi: 10.1111/ejn.14287
7. Henningsen, JB, Franois, G, and Valérie, S. Rfrp neurons – the doorway to understanding seasonal reproduction in mammals. Front Endocrinol. (2016) 7:36. doi: 10.3389/fendo.2016.00036
8. Weems, PW, Goodman, RL, and Lehman, MN. Neural mechanisms controlling seasonal reproduction: principles derived from the sheep model and its comparison with hamsters. Front Neuroendocrinol. (2015) 37:43–51. doi: 10.1016/j.yfrne.2014.12.002
9. Mossa, F, and Ireland, JJ. Physiology and endocrinology symposium: anti-Müllerian hormone: a biomarker for the ovarian reserve, ovarian function, and fertility in dairy cows. J Anim Sci. (2019) 97:1446–55. doi: 10.1093/jas/skz022
10. Evans, ACO. Characteristics of ovarian follicle development in domestic animals. Reprod Domest Anim. (2003) 38:240–6. doi: 10.1046/j.1439-0531.2003.00439.x
11. Nogueira, DM, Cavalieri, J, Gummow, B, and Parker, AJ. Comparison of follicular dynamics and hormone profiles in Boer goats examined during the breeding and non-breeding seasons in the tropics of Queensland, Australia. Small Rum Res. (2015) 125:93–100. doi: 10.1016/j.smallrumres.2015.02.014
12. Muñoz, AL, Chesneau, D, Hernández, H, Bedos, M, Duarte, G, Vielma, J, et al. Sexually active bucks counterbalance the seasonal negative feedback of estradiol on Lh in Ovariectomized goats. Domest Anim Endocrin. (2017) 60:42–9. doi: 10.1016/j.domaniend.2017.03.004
13. Karsch, FJ, Bittman, EL, Foster, DL, Goodman, RL, Legan, SJ, and Robinson, JE. Neuroendocrine basis of seasonal reproduction. Recent Prog Horm Res. (1984) 40:185. doi: 10.1016/B978-0-12-571140-1.50010-4
14. Decourt, C, Robert, V, Anger, K, Galibert, M, Madinier, JB, Liu, X, et al. A synthetic Kisspeptin analog that triggers ovulation and advances puberty. Sci Rep. (2016) 6:6. doi: 10.1038/srep26908
15. Chaves, RN, Duarte, AB, Rodrigues, GQ, Celestino, JJ, Silva, GM, Lopes, CA, et al. The effects of insulin and follicle-simulating hormone (Fsh) during in vitro development of ovarian goat Preantral follicles and the relative Mrna expression for insulin and Fsh receptors and cytochrome P450 aromatase in cultured follicles. Biol Reprod. (2012) 87:69. doi: 10.1095/biolreprod.112.099010
16. Silva, CM, Castro, SV, Faustino, LR, Rodrigues, GQ, Brito, IR, Saraiva, MV, et al. Moment of addition of Lh to the culture medium improves in vitro survival and development of secondary goat pre-antral follicles. Reprod Domest Anim. (2011) 46:579–84. doi: 10.1111/j.1439-0531.2010.01704.x
17. Horoz, H, Kasikçi, G, Ak, K, Alkan, S, and Sönmez, C. Controlling the breeding season using melatonin and Progestagen in Kivircik ewes. Turk J Vet Anim Sci. (2003) 27:301–5.
18. Arikan, MS, Mat, B, Alkan, H, Cevrimli, MB, Akin, AC, Sahin, TS, et al. A Meta-analysis of the effects of synchronization protocols applied to sheep in Turkey on pregnancy rates during breeding and non-breeding seasons. Vet Med Sci. (2021) 7:2280–9. doi: 10.1002/vms3.610
19. Wei, Y, Yu, R, Cheng, S, Zhou, P, Mo, S, He, C, et al. Single-cell profiling of mouse and primate ovaries identifies high levels of Egfr for stromal cells in ovarian aging. Mol Ther Nucleic Acids. (2023) 31:1–12. doi: 10.1016/j.omtn.2022.11.020
20. Lin, F, Li, X, Wang, X, Sun, H, Wang, Z, and Wang, X. Stanniocalcin 1 promotes metastasis, lipid metabolism and cisplatin Chemoresistance via the Foxc2/Itgb6 signaling Axis in ovarian Cancer. J Exp Clin Cancer Res. (2022) 41:129. doi: 10.1186/s13046-022-02315-3
21. Pavlik, R, Wypior, G, Hecht, S, Papadopoulos, P, Kupka, M, Thaler, C, et al. Induction of G protein-coupled estrogen receptor (Gper) and nuclear steroid hormone receptors by gonadotropins in human granulosa cells. Histochem Cell Biol. (2011) 136:289–99. doi: 10.1007/s00418-011-0846-7
22. Kadokawa, H. Discovery of new receptors regulating luteinizing hormone and follicle-stimulating hormone secretion by bovine Gonadotrophs to explore a new paradigm for mechanisms regulating reproduction. J Reprod Dev. (2020) 66:291–7. doi: 10.1262/jrd.2020-012
23. Hatzirodos, N, Hummitzsch, K, Irving-Rodgers, HF, and Rodgers, RJ. Transcriptome comparisons identify new cell markers for Theca Interna and granulosa cells from small and large antral ovarian follicles. PLoS One. (2015) 10:e0119800. doi: 10.1371/journal.pone.0119800
24. Vendrell-Flotats, M, García-Martínez, T, Martínez-Rodero, I, López-Béjar, M, LaMarre, J, Yeste, M, et al. In vitro maturation in the presence of leukemia inhibitory factor modulates gene and Mirna expression in bovine oocytes and embryos. Sci Rep. (2020) 10:961. doi: 10.1038/s41598-020-74961-6
25. Mantri, M, Zhang, HH, and Vlaminck, RID. A spatiotemporal molecular atlas of the ovulating mouse ovary. Proc Natl Acad Sci U S A. (2024) 121:18121. doi: 10.1073/pnas.2317418121
26. Zheng, M, Poulsen, LC, Wang, NF, Mamsen, LS, Johannsen, ML, Styrishave, B, et al. Progesterone and 17-Hydroxy-progesterone concentrations in follicular fluid and serum reflect their production in granulosa and Theca cells. Reprod Biomed Online. (2024) 49:103853. doi: 10.1016/j.rbmo.2024.103853
27. Fang, L, Guo, Y, Li, Y, Jia, Q, Han, X, Liu, B, et al. Epigallocatechin-3-Gallate stimulates Star expression and progesterone production in human granulosa cells through the 67-Kda laminin receptor-mediated Creb signaling pathway. J Cell Physiol. (2022) 237:687–95. doi: 10.1002/jcp.30538
28. Regassa, A, Rings, F, Hoelker, M, Cinar, U, Tholen, E, Looft, C, et al. Transcriptome dynamics and molecular cross-talk between bovine oocyte and its companion cumulus cells. BMC Genomics. (2011) 12:57. doi: 10.1186/1471-2164-12-57
29. Gallenito, MJ, Qasim, TS, Tutol, JN, Prakash, V, Dodani, SC, and Meloni, G. A recombinant platform to characterize the role of transmembrane protein Htmem205 in Pt(ii)-drug resistance and extrusion. Metallomics. (2020) 12:1542–54. doi: 10.1039/d0mt00114g
30. Li, LY, Kim, HJ, Park, SA, Lee, SH, Kim, LK, Lee, JY, et al. Genetic profiles associated with Chemoresistance in patient-derived xenograft models of ovarian Cancer. Cancer Res Treat. (2019) 51:1117–27. doi: 10.4143/crt.2018.405
31. Liu, ZL, Rudd, MD, Hernandez-Gonzalez, I, Gonzalez-Robayna, I, Fan, HY, Zeleznik, AJ, et al. Fsh and Foxo1 regulate genes in the sterol/steroid and lipid biosynthetic pathways in granulosa cells. Mol Endocrinol. (2009) 23:649–61. doi: 10.1210/me.2008-0412
32. Savic-Radojevic, A, Mazibrada, I, Djukic, T, Stankovic, ZB, Pljesa-Ercegovac, M, Sedlecky, K, et al. Glutathione S-transferase (Gst) polymorphism could be an early marker in the development of polycystic ovary syndrome (Pcos) - an insight from non-obese and non-insulin resistant adolescents. Endokrynol Pol. (2018) 69:366–74. doi: 10.5603/EP.a2018.0034
33. Drehmer, MN, Muniz, YCN, Marrero, AR, and Löfgren, SE. Gene expression of Abhd6, a key factor in the endocannabinoid system, can be modulated by female hormones in human immune cells. Biochem Genet. (2019) 57:35–45. doi: 10.1007/s10528-018-9871-8
34. Nagai, K, Endo, N, Tanaka, T, and Kamomae, H. Exposure to estrogen mimicking the level of late pregnancy suppresses estrus subsequently induced by estrogen at the level of the follicular phase in Ovariectomized Shiba goats. J Reprod Dev. (2013) 59:123–30. doi: 10.1262/jrd.2012-140
Keywords: dairy goat, transcriptome, proteome, ovary, seasonal reproduction
Citation: Shi C, Liu Q, Wang W, He Q, Zhao J, Zhang F, Zhu L and Luo J (2025) Transcriptome and proteome of ovarian tissues revealed the differences in the ovaries of dairy goats during the breeding and non-breeding seasons. Front. Vet. Sci. 12:1565807. doi: 10.3389/fvets.2025.1565807
Edited by:
Manuel Garcia-Herreros, National Institute for Agricultural and Veterinary Research (INIAV), PortugalReviewed by:
Regiane R. Santos, Schothorst Feed Research, NetherlandsXiaoyun He, Chinese Academy of Agricultural Sciences, China
Copyright © 2025 Shi, Liu, Wang, He, Zhao, Zhang, Zhu and Luo. This is an open-access article distributed under the terms of the Creative Commons Attribution License (CC BY). The use, distribution or reproduction in other forums is permitted, provided the original author(s) and the copyright owner(s) are credited and that the original publication in this journal is cited, in accordance with accepted academic practice. No use, distribution or reproduction is permitted which does not comply with these terms.
*Correspondence: Jun Luo, bHVvanVuQG53YWZ1LmVkdS5jbg==