 Hong Du
 Zunqiang Yan1
 Shuangbao Gun
- 1College of Animal Science and Technology, Gansu Agricultural University, Lanzhou, Gansu, China
- 2Department of Reproductive Medicine, Lanzhou University Second Hospital, Lanzhou, Gansu, China
- 3Gansu Research Center for Swine Production Engineering and Technology, Lanzhou, Gansu, China
Autophagy-related gene 5 (ATG5) plays a crucial role in autophagosome formation. Recent studies have investigated the role of autophagy in regulating testosterone production; however, its expression in testicular tissues and Leydig cells of Hezuo pig remains less understood. In this study, we cloned the coding sequence (CDS) region of the ATG5 gene and assessed its expression using qPCR across various tissues and testes at different developmental stages in Hezuo pigs. Subsequently, we constructed silencing and overexpression vectors for ATG5 and transfected them into Leydig cells. Cell proliferation and apoptosis were evaluated using CCK-8 and flow cytometry assays, respectively. Autophagy and testosterone synthesized gene expression were detected by qPCR, while ATG5, StAR and LC3 protein levels were measured by Western blotting. Furthermore, testosterone concentration and the levels of autophagy-related genes BECN1 (Beclin1), NPC1L1 (Niemann-Pick C1-like 1), and TSPO (translocator protein) were quantified via ELISA. The results indicated that the CDS region of the ATG5 gene spans 828 base pairs, encoding 275 amino acids. ATG5 showed high expression in the testis and lung (p < 0.01), with significantly higher expression in the testicular tissues of the 4-month-old group compared to the 1-month-old group (p < 0.01). Compared to the empty vector control (ATG5-PC), the overexpression group (ATG5-OE) exhibited increased cell proliferation (p < 0.05), reduced apoptosis (p < 0.01), elevated autophagy gene expression (BECN1, ATG7, and LC3) (p < 0.01) and testosterone synthesis-related genes (StAR, HSD3B and CYP11A1) (p < 0.01), along with increased ATG5, StAR and LC3protein levels (p < 0.01), as well as significantly increased testosterone levels, BECN1, NPC1L1, and TSPO expression (all p < 0.01). These findings indicate that ATG5 manipulation affects testosterone synthesis in Leydig cells, likely through autophagy regulation. This study offers novel insights into the function of ATG5 in testosterone production within testicular Leydig cells, providing theoretical support for investigating early puberty in Hezuo pigs.
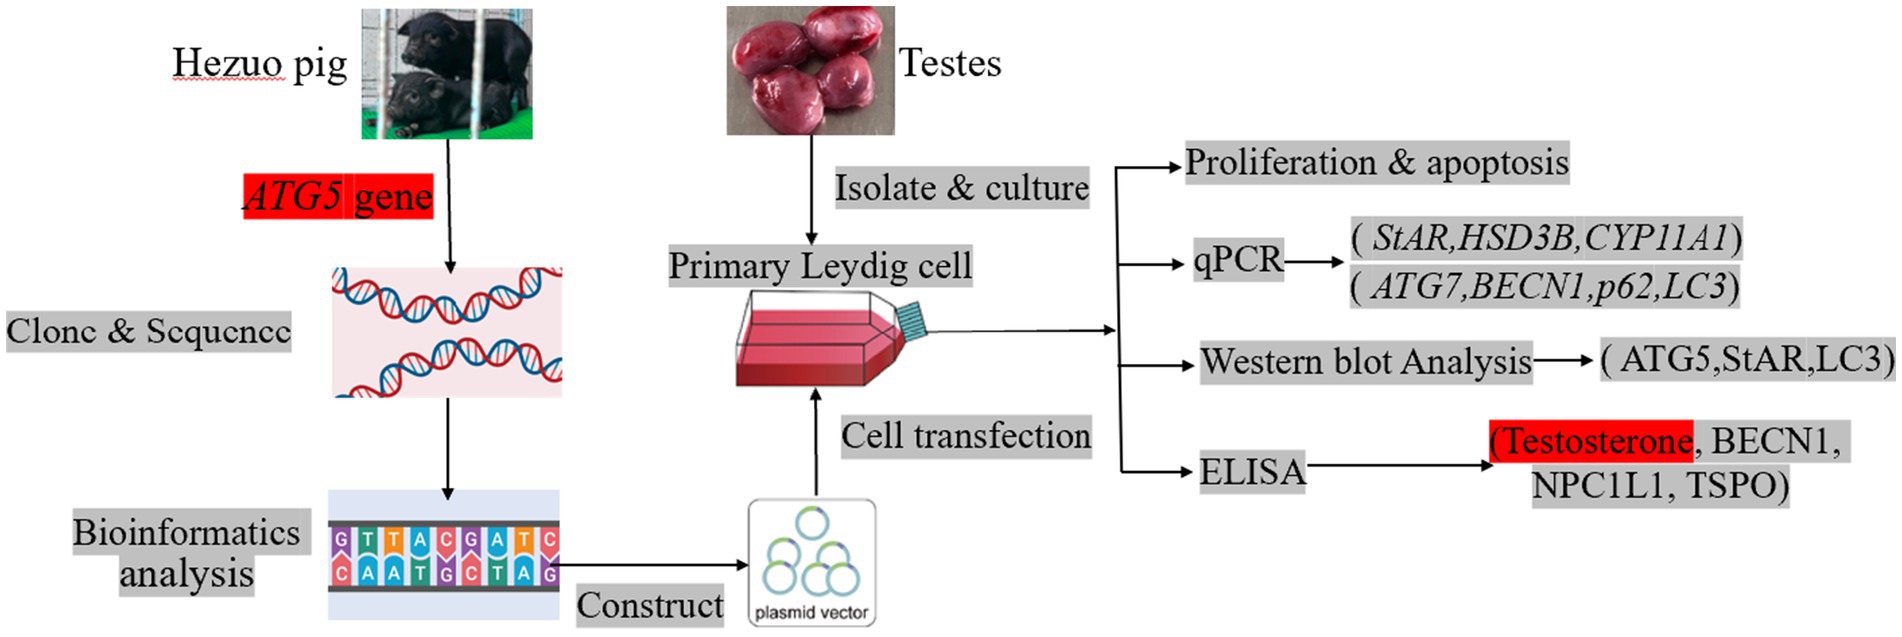
Graphical Abstract.
1 Introduction
Autophagy is a fundamental cellular process in eukaryotic cells, involving a metabolic pathway that transports damaged or dysfunctional intracellular components to the lysosome for degradation and recycling. This process is essential for maintaining normal cellular functions (1). Autophagy plays a role in various biological processes, such as mammalian follicular development (2), regulation of circadian rhythms (3), germ cell development (4), synthesis of steroid hormones (e.g., testosterone (5, 6), estrogen (7), progesterone (8, 9)), and maintenance of pregnancy (10). Autophagy is regulated by numerous conserved autophagy-related genes (11). In 1997, the first autophagy-related gene, ATG1, was cloned by A. Matsuura et al., and it plays a key role in initiating autophagy (12). To date, approximately 40 autophagy-related genes have been identified (13). Among these genes, ATG5, which is widely expressed in eukaryotes, regulates the autophagic ubiquitination process and plays a crucial role in the early stages of autophagosome formation and the initiation of autophagy (14). ATG5 initially forms an ATG5-ATG12 complex with ATG12, which subsequently interacts with ATG16 to form a homodimer. The ATG5-ATG12-ATG16 complex promotes the elongation and expansion of the autophagosome membrane, as well as the activation of autophagy (15–17).
Hezuo pig, a small plateau breed, is indigenous to the Gannan Tibetan Autonomous Prefecture in Gansu Province, China. This pig usually feeds on Juemas in the grasslands, and is also known as the Juema pig (18). Hezuo pig production is widespread in areas such as Hezuo, Xiahe, Luqu, Lintan, Zhuoni, and Diebu within the Gannan Tibetan Autonomous Prefecture, which has a cold climate and belongs to the alpine hilly regions characteristized by semi-agricultural and semi-pastoral activities (19). Hezuo pigs are small but robust, with high roughage digestibility and are highly adaptable due to prolonged rearing on grasslands. Compared to commercially introduced pig breeds (e.g., Yorkshire, Landrace, etc.), the Hezuo pig is noted for its early sexual maturity and stable inheritance. Boars display sexual desire at 45 days of age and typically reach sexual maturity around 4 months (20, 21).
In male mammals, Leydig cells account for about 4% of the total number of testicular somatic cells. Leydig cells are capable of secreting steroid hormones; studies indicate that over 95% of testosterone in the body is produced by these cells (22, 23). Testosterone is one of the important sex hormones in male mammals and is involved in reproductive activities such as the regulation of sexual maturation, spermatogenesis, and the maintenance of secondary sex characteristics (24, 25).
BECN1 (also known as Beclin 1) is the first gene identified as being associated with autophagy in mammals. BECN1 is a crucial for the autophagosomes formation, acting as an autophagic switch. It facilitates the localization of other autophagy proteins to autophagic vesicles, thereby regulating the formation and maturation of mammalian autophagosomes (26–28). Microtubule-associated protein 1 light chain 3 (LC3) is one of the key proteins expressed during autophagy, playing a crucial role in the formation and maturation of autophagosomes. It is commonly utilized as a marker to monitor autophagic activity, with its expression level exhibiting a positive correlation with autophagic flux (29–31). Cholesterol serves as the substrate for testosterone synthesis. The steroidogenic acute regulatory protein (StAR) binds cholesterol in the outer mitochondrial membrane and transports it to the inner membrane, where it is catalyzed by the cytochrome P450 side-chain cleavage enzyme to produce pregnenolone. After leaving the mitochondria, pregnenolone is converted into testosterone in testicular tissue (32, 33). Transporter protein (TSPO), located on the outer mitochondrial membrane, is essential for the import of cholesterol into the inner mitochondrial membrane, representing the rate-limiting step in steroid hormones biosynthesis (34, 35). Recently studies show that Niemann-Pick C1-like 1 (NPC1L1) is a transmembrane cholesterol absorption transporter capable of mediating cholesterol uptake, regulating lipid homeostasis in mammals and increasing substrates for synthesizing steroid hormones, cholesterol depletion has been associated with autophagy (36, 37).
This study focused on the Hezuo pig, the ATG5 gene was cloned and sequence analysis was performed. Subsequently, Leydig cells from Hezuo pig were isolated. Based on successful transfections with ATG5 silencing and overexpression vector, the effects of ATG5 overexpression and silencing on testosterone levels, BECN1, NPC1L1, TSPO were explored using ELISA assays; autophagy gene (BECN1, ATG7, p62 and LC3) and testosterone synthesis gene (StAR, HSD3B, and CYP11A1) were detected by qPCR; ATG5, StAR and LC3 were detected by Western Blot, aiming to elucidate the molecular mechanisms by which ATG5 regulates testosterone synthesis in testicular Leydig cells of Hezuo pigs, with the goal of investigating the reproductive endocrine basis underlying the characteristic precocious puberty trait in this breed.
2 Materials and methods
2.1 Ethical statement
The entire study was approved by the Institutional Animal Care and Use Committee of Gansu Agricultural University. All experimental procedures and sample collection methods adhered to the approved guidelines to ensure animal welfare.
2.2 Sample collection
A total of 6 1-month-old (1 M, n = 3) and four-month-old (4 M, n = 3) Hezuo pigs, raised by farmers in Gannan, Gansu, China, were selected. After slaughter, testicular, heart, liver, spleen, lung, and kidney tissues were collected, quickly frozen in liquid nitrogen, transported to the laboratory, and stored at −80°C for RNA extraction. Testicular tissues were collected from the center of the testis and immediately immersed in 3% glutaraldehyde for transmission electron microscopy. Testicular tissues from 1 M Hezuo pigs were sterilized by immersion in 75% alcohol for 3 min, then placed in pre-cooled PBS buffer containing 2% penicillin–streptomycin (Gibco, Carlsbad, CA, USA), and transported back to the laboratory within 2 h for the isolation of testicular Leydig cells.
2.3 Total RNA extraction and cDNA synthesis
Total RNA was extracted from each sample using TRIzol reagent (AG, Changsha, Hunan, China) following the manufacturer’s instructions. The concentration and quality of the RNA samples were assessed using a NanoDrop2000 spectrophotometer (Thermo Fisher Scientific, Waltham, MA, USA). The RNA was then reverse-transcribed into cDNA using the Evo M-MLV RT Kit (AG, Changsha, Hunan, China) and stored at −20°C.
2.4 Primer synthesis
Based on the porcine gene sequence in Genbank, primers were designed using primer 5.0 software (Premier Company, Toronto, ON, Canada), and synthesized by Genewiz Biotechnology Co. (Suzhou, Jiangsu, China). The primer details are presented in Table 1.
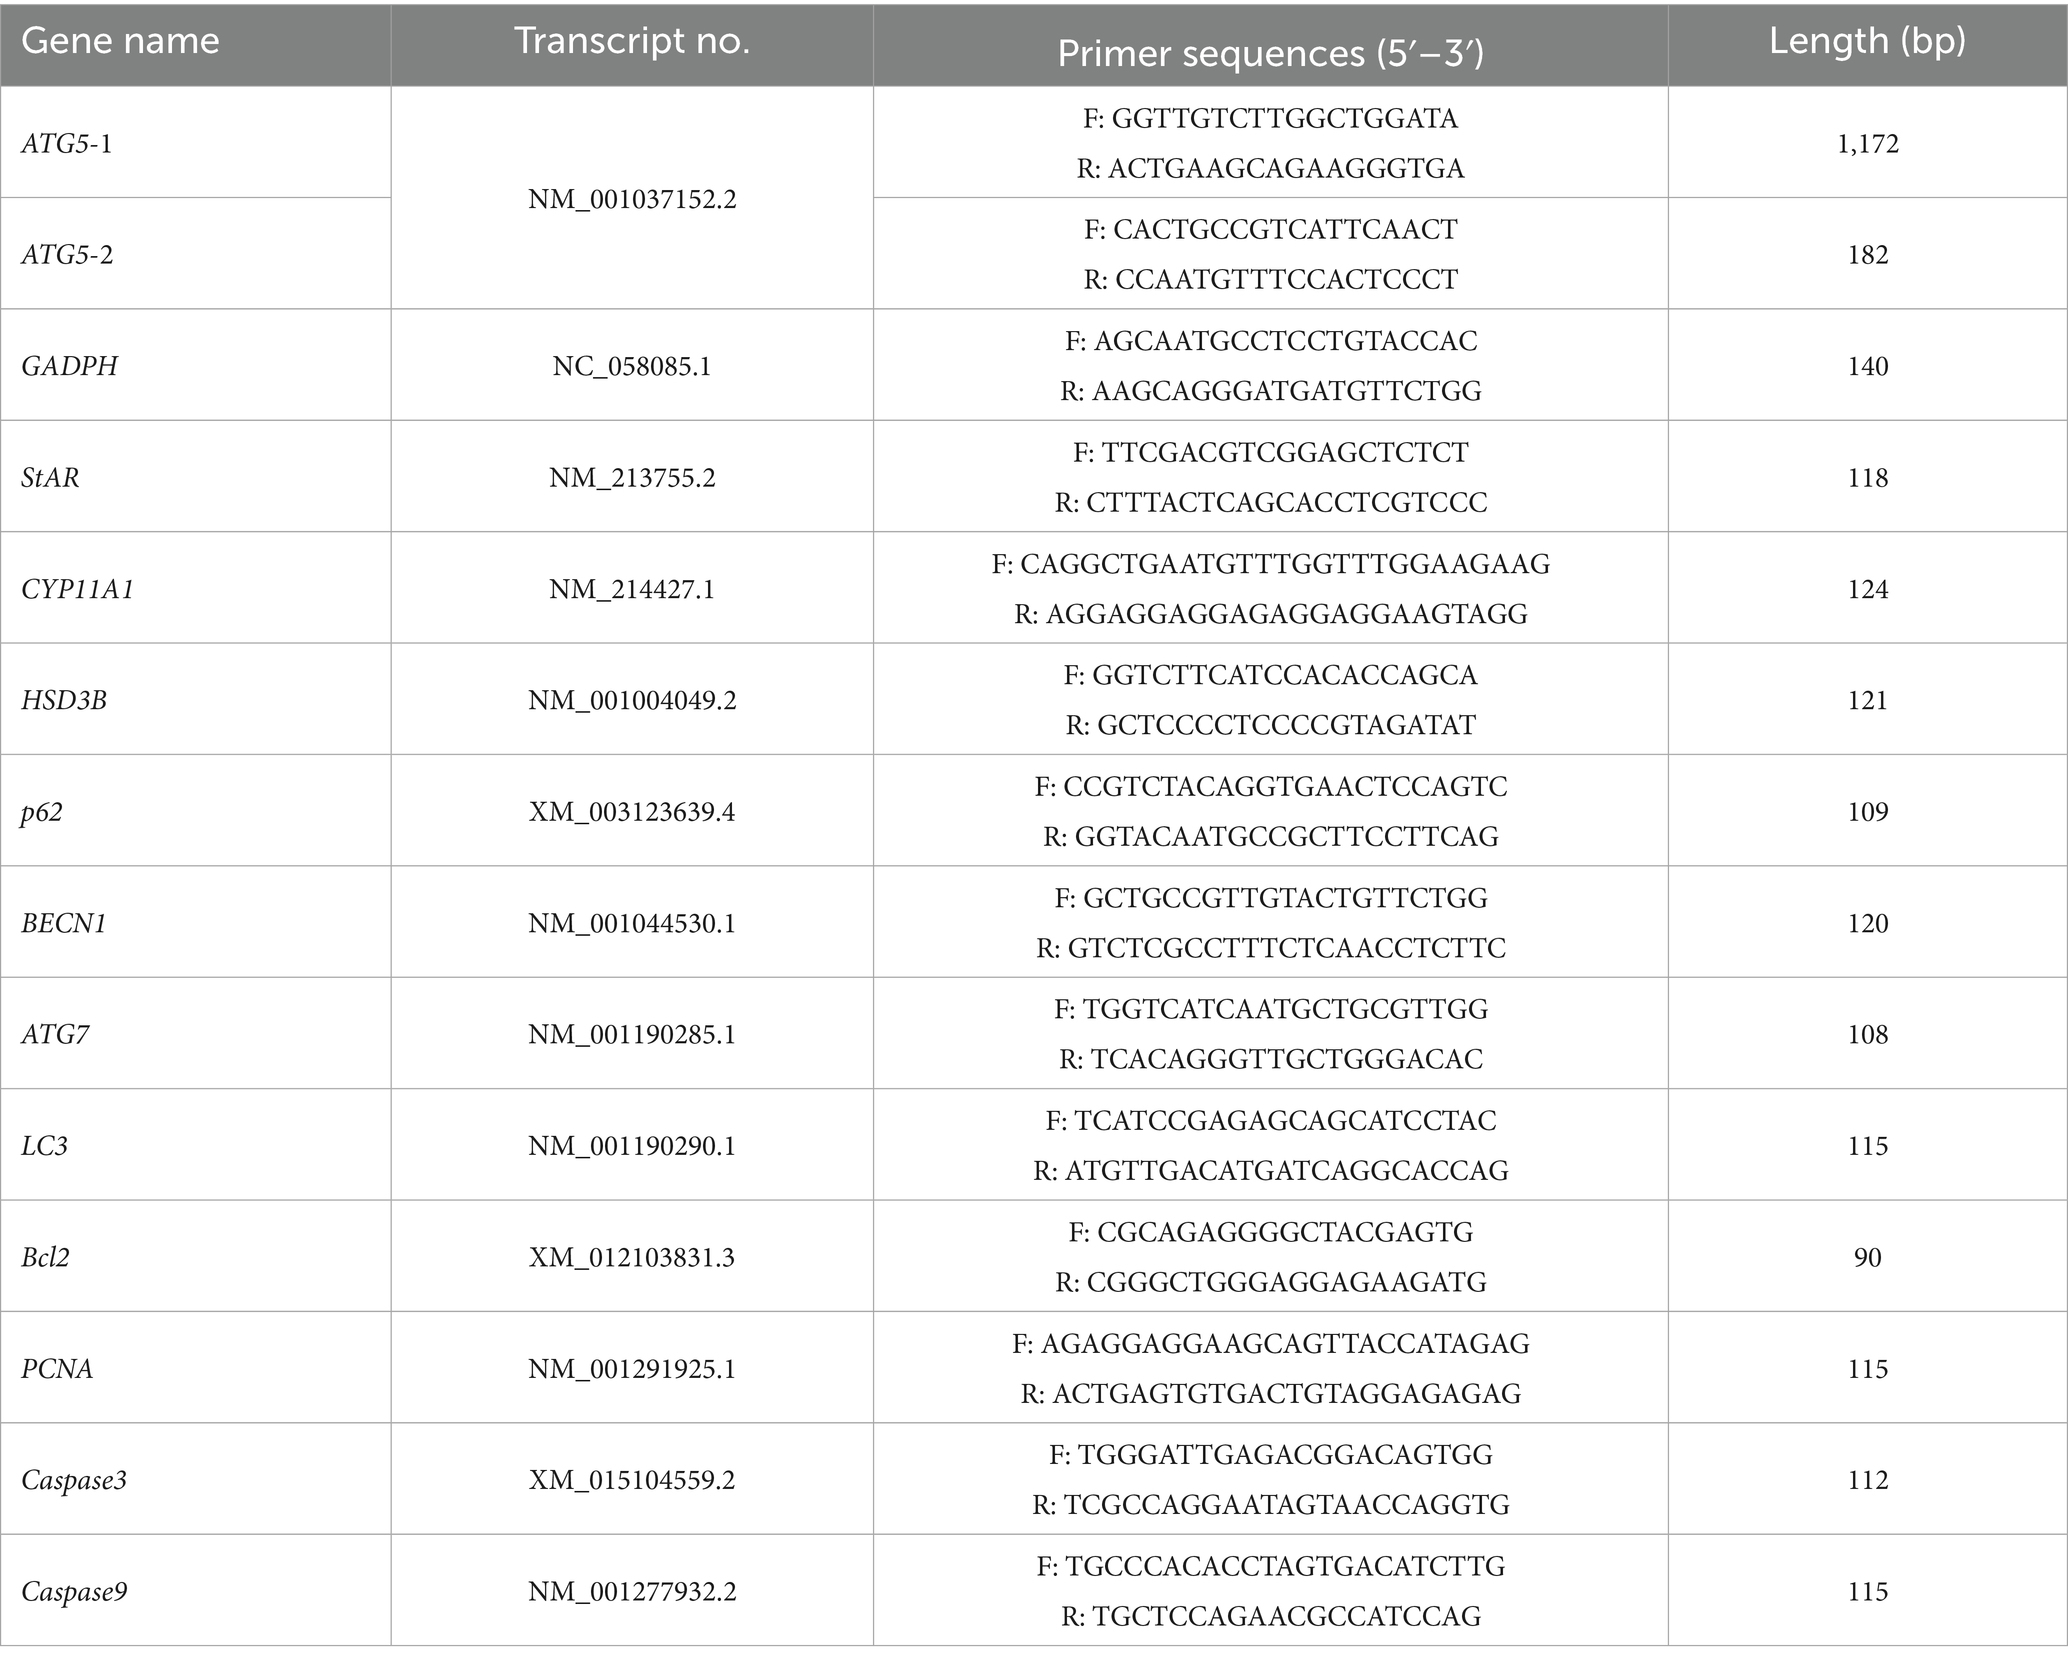
Table 1. A list of the primers used in the study.
2.5 PCR amplification
The cDNA samples derived from the testicular tissues of all Hezuo pigs were used as a templates to amplify the CDS sequence of the ATG5 gene. The PCR reaction system (20 μL) contained of: 2.0 μL cDNA, 1.0 μL forward primer, 1.0 μL reverse primer, 10 μL Easy Taq PCR SuperMix (Tiangen Biotech, Beijing, China), and 6 μL of RNase free H2O. The reaction conditions were as follows: initial denaturation at 95°C for 5 min; 35 cycles of denaturation at 94°C for 30 s, annealing at 59°C for 30 s, and extension at 72°C for 80 s; followed by a final extension at 72°C for 10 min.
2.6 Cloning and sequencing
The PCR product of the Hezuo pig ATG5 gene was purified using 1.5% agarose gel electrophoresis, then ligated into the pMD19-T vector (TaKaRa, Dalian, Liaoning, China) and transformed into DH5α competent cells (TransGen Biotech, Beijing, China). Cells were plated on LB solid medium without ampicillin (AMP+), X-Gal, and IPTG, and incubated overnight at 37°C. Independent positive clones were selected and inoculated into 5 mL of LB liquid medium containing ampicillin (AMP+) and incubated with shaking for 12–16 h. A 2 μL aliquot of the bacterial culture was used for PCR verification, while the remaining culture was used for plasmid DNA extraction and subsequent sequencing by Shenggong Biotech Co., Ltd. (Shanghai, China).
2.7 ATG5 expression assay
The expression of ATG5 in various tissues and testicular tissues of Hezuo pigs at different ages was detected using qPCR on the Roche LightCycler 96 system (Roche, Basel, Switzerland). The reaction mixture was 20 μL, containing: 10 μL SYBR Premix Ex Taq II, 1.0 μL forward primer, 1.0 μL reverse primer, 2.0 μL cDNA, and 6 μL RNase-free water. The thermal cycling protocol included an initial denaturation at 95°C for 3 min, followed by 40 cycles of denaturation at 95°C for 15 s, annealing at 58°C for 15 s, and extension at 72°C for 20 s. All reactions were carried out in three technical replicates. The relative expression of all reactions were performed in triplicate. The relative expression level of ATG5 was calculated relative to GAPDH as the reference gene using 2–ΔΔCt method (38).
2.8 Bioinformatics analysis
The CDS region of the ATG5 gene obtained by cloning was analyzed using various online tools and databases. Homologous sequences were identified using the BLAST tool on the NCBI website. Details of the specific software and websites used are provided in Table 2.
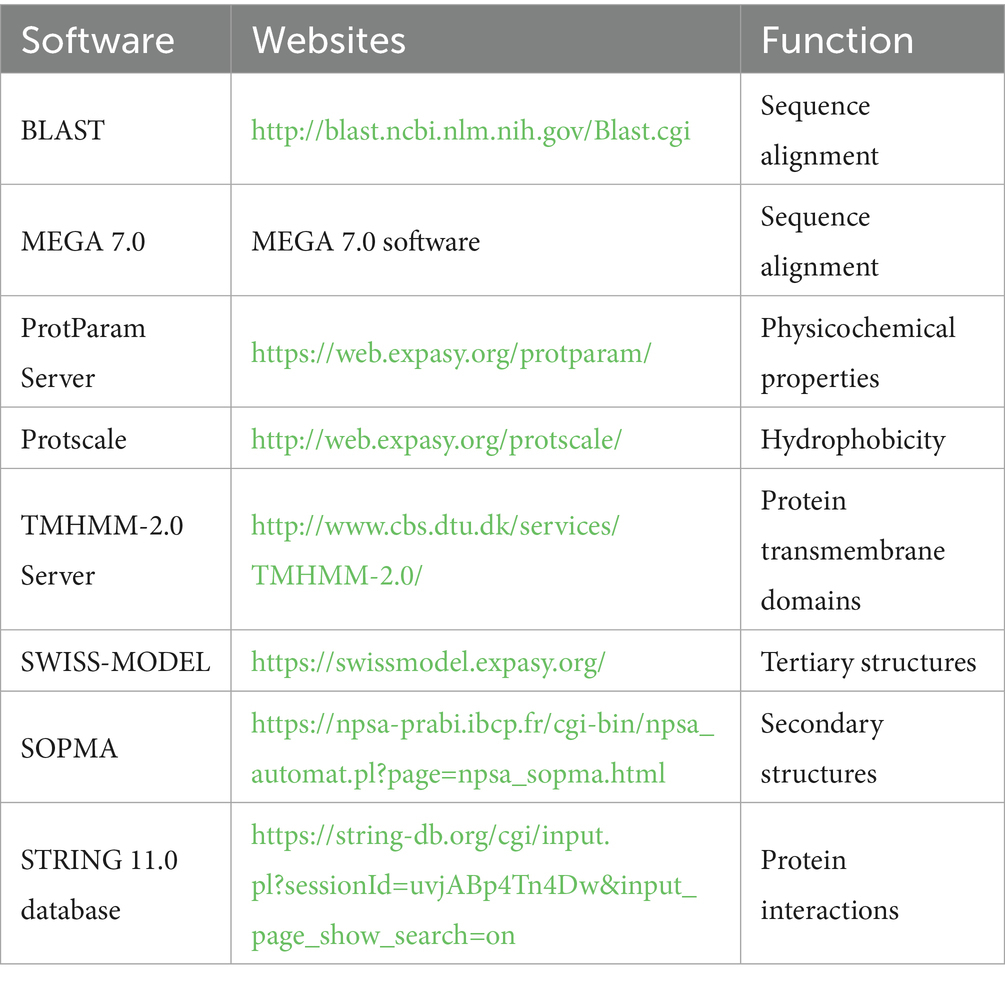
Table 2. A list of websites and software of bioinformatics analysis in the study.
2.9 Isolation, purification and identification of Hezuo pig testicular Leydig cells
The white membrane on the surface of the testicular tissue was removed to expose the testicular parenchyma, which was then minced and transferred to a 50 mL centrifuge tube. Type IV collagenase, pre-warmed to 37°C and at a concentration of 1 mg/mL, was added for digestion at 37°C for 60 min. The supernatant was aspirated, diluted with an equal volume of PBS, and sequentially filtered through 70 μm and 40 μm cell strainers. The filtrate was collected by centrifugation at 1,100 rpm for 10 min. The pellet was collected and washed twice with PBS. Cells were resuspended in DMEM supplemented with 10% FBS (Gibco, NY, USA) and passed through 70 μm and 40 μm cell strainers. The filtrate was collected and inoculated into culture flasks. After 4 h, non-adherent cells were removed, followed by two washes with PBS. Cells were then re-suspended in DMEM containing 10% FBS and cultured in an incubator set at 37°C and 5% CO₂. Culture medium was replaced every 48 or 72 h based on cell growth (39).
The specific 3β-HSD antibody (Bioss Biotechnology Co., Ltd., Beijing, China) was used to identify Leydig cells by fluorescent immunostaining. The purified cells were seeded in 24-well plates and cultured until they reached approximately 70% confluence, then fixed with 4% paraformaldehyde for 15 min, permeabilized with 1% Triton X-100 (Beyotime Biotechnology, Shanghai, China) for 15 min, blocked it with 5% (w/v) goat serum for 30 min at room temperature. Next, the primary antibody (anti-HSD3B, 1: 500) was incubated overnight at 4°C. After washing with PBS (three times, 5 min each), the cells were incubated with secondary antibody (Cy5-labeled goat anti-rabbit IgG, 1:500) and a nuclear counterstain (4′,6-diamidino-2-phenylindole, DAPI) for 1 h at room temperature in the dark. Following three additional 5-min washes with distilled water, the samples were mounted and examined under a fluorescence microscope (Nikon, Eclipse C1, Tokyo, Japan).
2.10 ATG5 gene silencing or overexpression vector construction and cell transfection
Based on the gene clone sequence, si-ATG5-404, si-ATG5-477, si-ATG5-566, and si-ATG5-696 interference sequences were designed. The negative control (si-ATG5-NC) served as the control group. The interference sequences are listed in Table 3. The ATG5 overexpression vector (ATG5-OE) was constructed using the pcDNA 3.1 cloning vector, employing 5’ HindIII and 3’ BamHI restriction sites. The empty vector (ATG5-PC) served as a control. The silencing and overexpression vectors were synthesized by GenePharma Biotech Co., Ltd. (Shanghai, China).
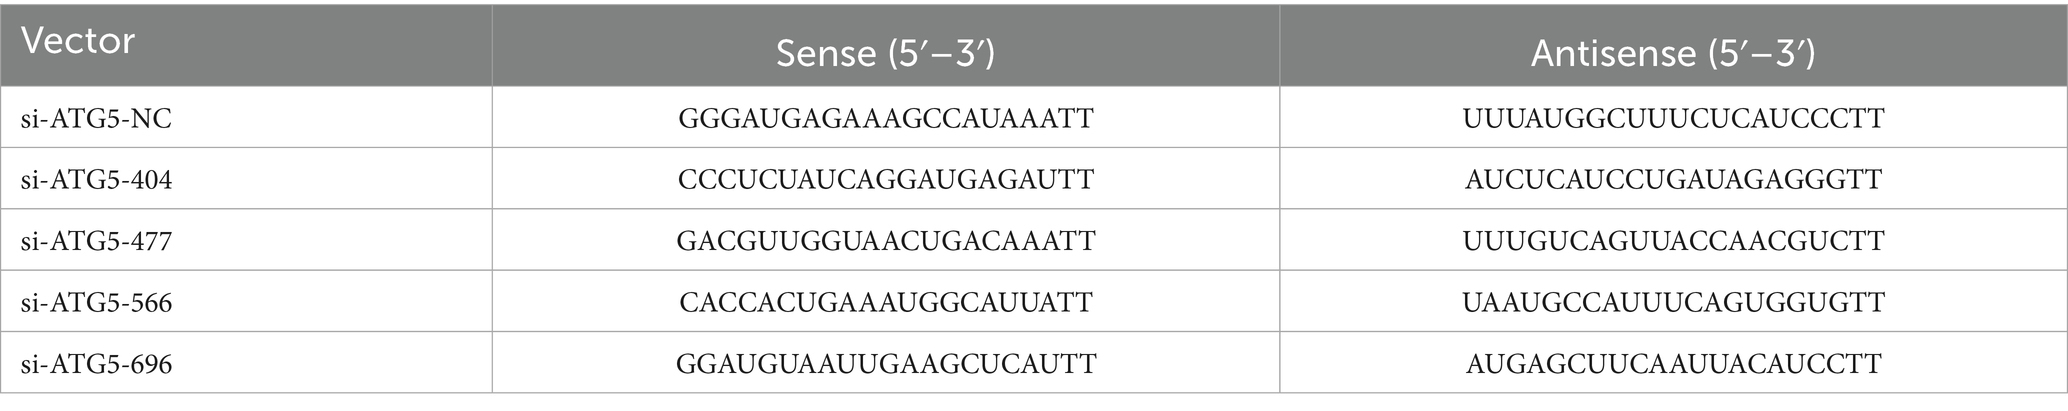
Table 3. The information of interference RNA sequence.
Hezuo pig testicular Leydig cells were seeded into 6-well culture plates. Once cell confluence reached approximately 80%, the silencing and overexpression vectors were transfected into each well following the protocol of Lipofectamine 2000 Reagent (Invitrogen, Carlsbad, CA, USA). qPCR was performed to quantify the silencing or overexpression of ATG5 mRNA in Leydig cells. Successful transfection was indicated by an mRNA expression level in the overexpression group exceeding 10-fold that of the PC group, and in the silencing group being less than 0.5-fold of the NC group.
2.11 Effects of ATG5 gene silencing or overexpression on proliferation and apoptosis of testicular Leydig cells
Hezuo pig testicular Leydig cells in the logarithmic growth phase were selected and seeded into 96-well plates at a density of 1 × 10⁴ cells/well. Transfection was performed 24 h post-seeding. At 24, 48, and 72 h post-transfection, 10 μL of CCK-8 reagent (Beyotime, Shanghai, China) was added to each well. Following a 2-h incubation at 37°C, the optical density (OD) at 450 nm was measured using a microplate reader, and the growth curves were plotted.
Apoptosis was assessed using flow cytometry. Cells were harvested using EDTA-free trypsin to create a single-cell suspension, washed with chilled PBS, and resuspended in 300 μL of binding buffer at a concentration of approximately 5 × 10⁵ cells/tube. Then, 5 μL of Annexin V-FITC and 5 μL of propidium iodide (PI) were added, gently mixed, and incubated in the dark for 10 min. The samples were analyzed by flow cytometry.
2.12 qPCR assay the effects of ATG5 gene silencing or overexpression on autophagy and testosterone synthesized gene expression of testicular Leydig cells
Hezuo pig Leydig cells were seeded in 6-well plates and transfected when they reached approximately 70% confluence. At 48 h post-transfection, the culture medium was removed, and the cells were washed three times with ice-cold PBS. Total RNA was extracted from each well’s Leydig cells using 1 mL of TRIzol reagent according to the protocol outlined in Section 4.3. The extracted RNA was then reverse-transcribed into cDNA. Expression levels of autophagy-related genes (BECN1, p62, ATG7 and LC3) and steroidogenesis-related genes (StAR, HSD3B and CYP11A1) across different treatment groups were quantified using the reaction system specified in Section 4.7 and the amplification protocol detailed in Table 1.
2.13 Western blot analysis
Hezuo pig Leydig cells were seeded in culture flasks. When cell confluence reached approximately 80%, silencing and overexpression vectors were introduced into each flask. At 48 h post-transfection, total proteins were extracted using a radioimmunoprecipitation assay (RIPA) lysis buffer (Solarbio, Beijing, China) supplemented with phenylmethanesulfonyl fluoride (PMSF) (Solarbio, Beijing, China), following the manufacturer’s instructions. Protein concentrations were quantified using a bicinchoninic acid (BCA) protein assay kit (Beyotime, Shanghai, China) to standardize the sample volumes. A mixture of 30 μL loading buffer and 120 μL protein samples was transferred to a 1.5 mL centrifuge tube and denatured by boiling at 95°C for 15 min. The protein samples were separated by 12.5% sodium dodecyl sulfate-polyacrylamide gel electrophoresis (SDS-PAGE) and subsequently transferred onto polyvinylidene difluoride (PVDF) membranes (Beyotime, Shanghai, China). The membranes were blocked with 5% non-fat milk in phosphate-buffered saline with Tween-20 (PBST) for 1 h at room temperature and then incubated overnight at 4°C with rabbit anti-ATG5 and anti-StAR polyclonal antibodies (1:2,000; Bioss, Beijing, China) as well as GAPDH antibody (1:2,000; Bioss, Beijing, China). After washing three times with PBST, the PVDF membranes were incubated with horseradish peroxidase (HRP)-conjugated secondary antibody (Proteintech, Wuhan, Hubei, China; 1:10,000) at 37°C for 1 h. The positive signals of the target proteins were visualized using an enhanced chemil The positive signals of the target proteins were visualized using an enhanced chemiluminescence (ECL) kit (Servicebio, Wuhan, Hubei, China). Gray levels were analyzed using ImageJ2 software (National Institutes of Health, Bethesda, MD, USA). The relative expression levels of ATG5 and StAR proteins were normalized to those of GAPDH.
2.14 Enzyme-linked immunosorbent assay (ELISA) assay
Hezuo pig testicular Leydig cells were seeded in 6-well culture plates. When cell confluence reached approximately 80%, silencing and overexpression vectors were introduced into each well. After 48 h post-transfection, the supernatant from each well was collected to perform ELISAs using the Testosterone Assay Kit, Autophagy Gene Assay Kit, NPC1L1 Assay Kit, and TSPO Assay Kit (Nanjing Jingmei, Nanjing, China), following the manufacturers’ instructions.
2.15 Statistical analysis of data
All assays were repeated independently at least three times. SPSS26.0 software (SPSS, Chicago, IL, USA) was executed to analyze the data. Two-tailed student’s t-test was used for comparison between two groups, one-way ANOVA was used for comparison between more than two groups, Duncan’s method was used for multiple comparisons. The results were expressed as mean ± standard deviation (Mean ± SD), *: indicate significant differences (p < 0.05); **: indicate extremely significant differences (p < 0.01).
3 Results
3.1 Autophagosomes confirmed by TEM
Autophagy and lysosomes were confirmed through transmission electron microscopy (TEM). The autophagy-related structures and lysosomes, which typically have a double membrane, were easily detected in the testicular tissues of 1-month-old and 4-month-old Hezuo pigs (Figure 1). Once parts of the cytoplasm are sequestered within autophagosomes, their contents and surrounding membranes remain morphologically stable (Figure 1). Our findings confirm the occurrence of autophagy in testicular tissues of Hezuo pigs at both 1 month and 4 months, with autophagy being more pronounced at 4 months.
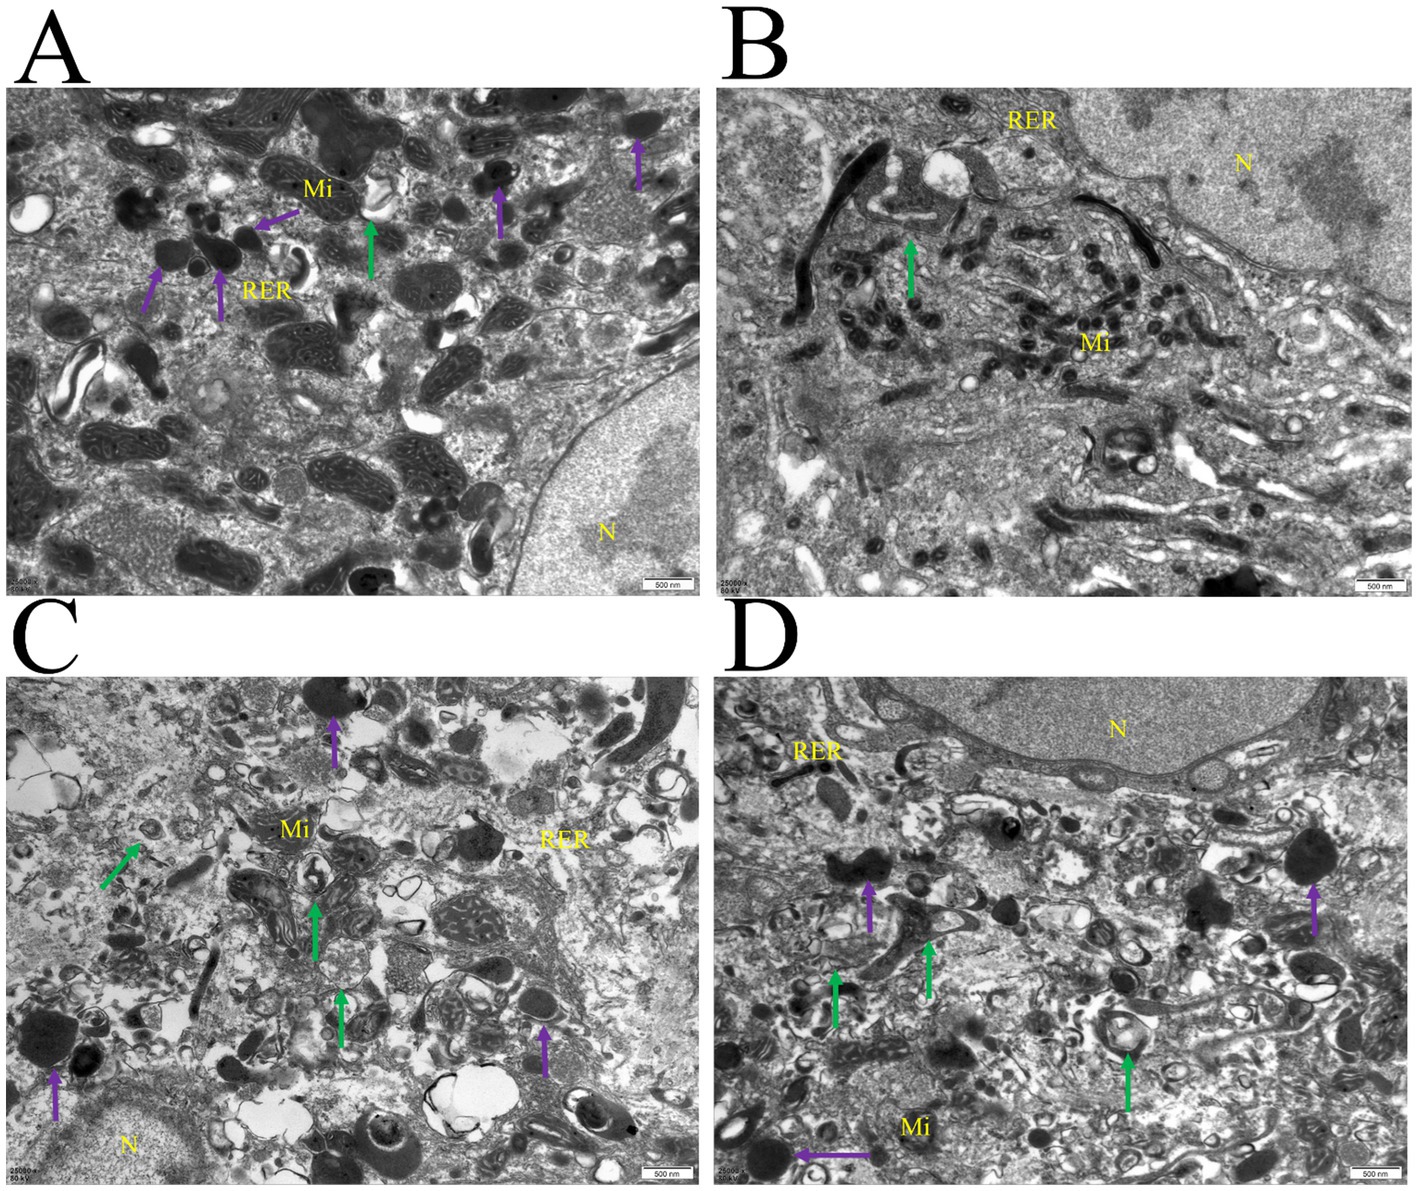
Figure 1. Autophagy was observed in the testicular tissues of Hezuo pig. Nucleus (N), mitochondria (Mi), rough endoplasmic reticulum (RER); autophagosome (green arrow), lysosome (purple arrow). Scale bar = 50 nm. (A,B) Represent samples from 1-month-old pigs, while (C,D) are from 4-month-old pigs.
3.2 CDS sequence characterization of ATG5
The PCR product of the ATG5 gene was detected using 1.5% agarose gel electrophoresis, resulting in a specific band of approximately 1,172 bp (Figure 2A). Sequencing and BLAST comparison results revealed the coding sequence (CDS) region was 828 bp in length, encoding 275 amino acids. Three nucleotides were mutated (base 26 G → A, base 69 T → C, base 359 T → C) (Figure 2B). Two of these mutations resulted in missense mutations, while one was a synonymous mutation, leading to two amino acid changes (R → Q, 9st point, V → Q120st point) (Figure 2C). Among the 275 amino acids, leucine accounted for the largest proportion (10.5%) (Figure 2D) Phenylalanine at position 87 exhibited the strongest hydrophobicity (score: 2.267), while glutamic acid at 233 position showed the weakest hydrophobicity (score: −3.100), suggesting that the protein encoded by this gene is hydrophilic (Figure 2E). The predicted physicochemical properties of the ATG5 protein included a molecular formula of C1477H2248N378O418S12, a molecular weight of 32,373.10, a theoretical pI of 5.47, and an instability index (II) of 45.92. These results indicate that ATG5 is an unstable protein. The predicted secondary structure of the ATG5 protein revealed a mixed composition, consisting of 44% random coil, 36.36% alpha helix, 15.27% extended strand, and 4.36% beta turn (Figure 2F). The predicted tertiary structure of the ATG5 protein primarily consists of random coils, alpha helices, and beta turns (Figure 2G). The protein encoded by ATG5 may interact with 10 proteins, primarily including autophagy-related proteins such as ATG12, ATG16 and ATG3 (Figure 2H).
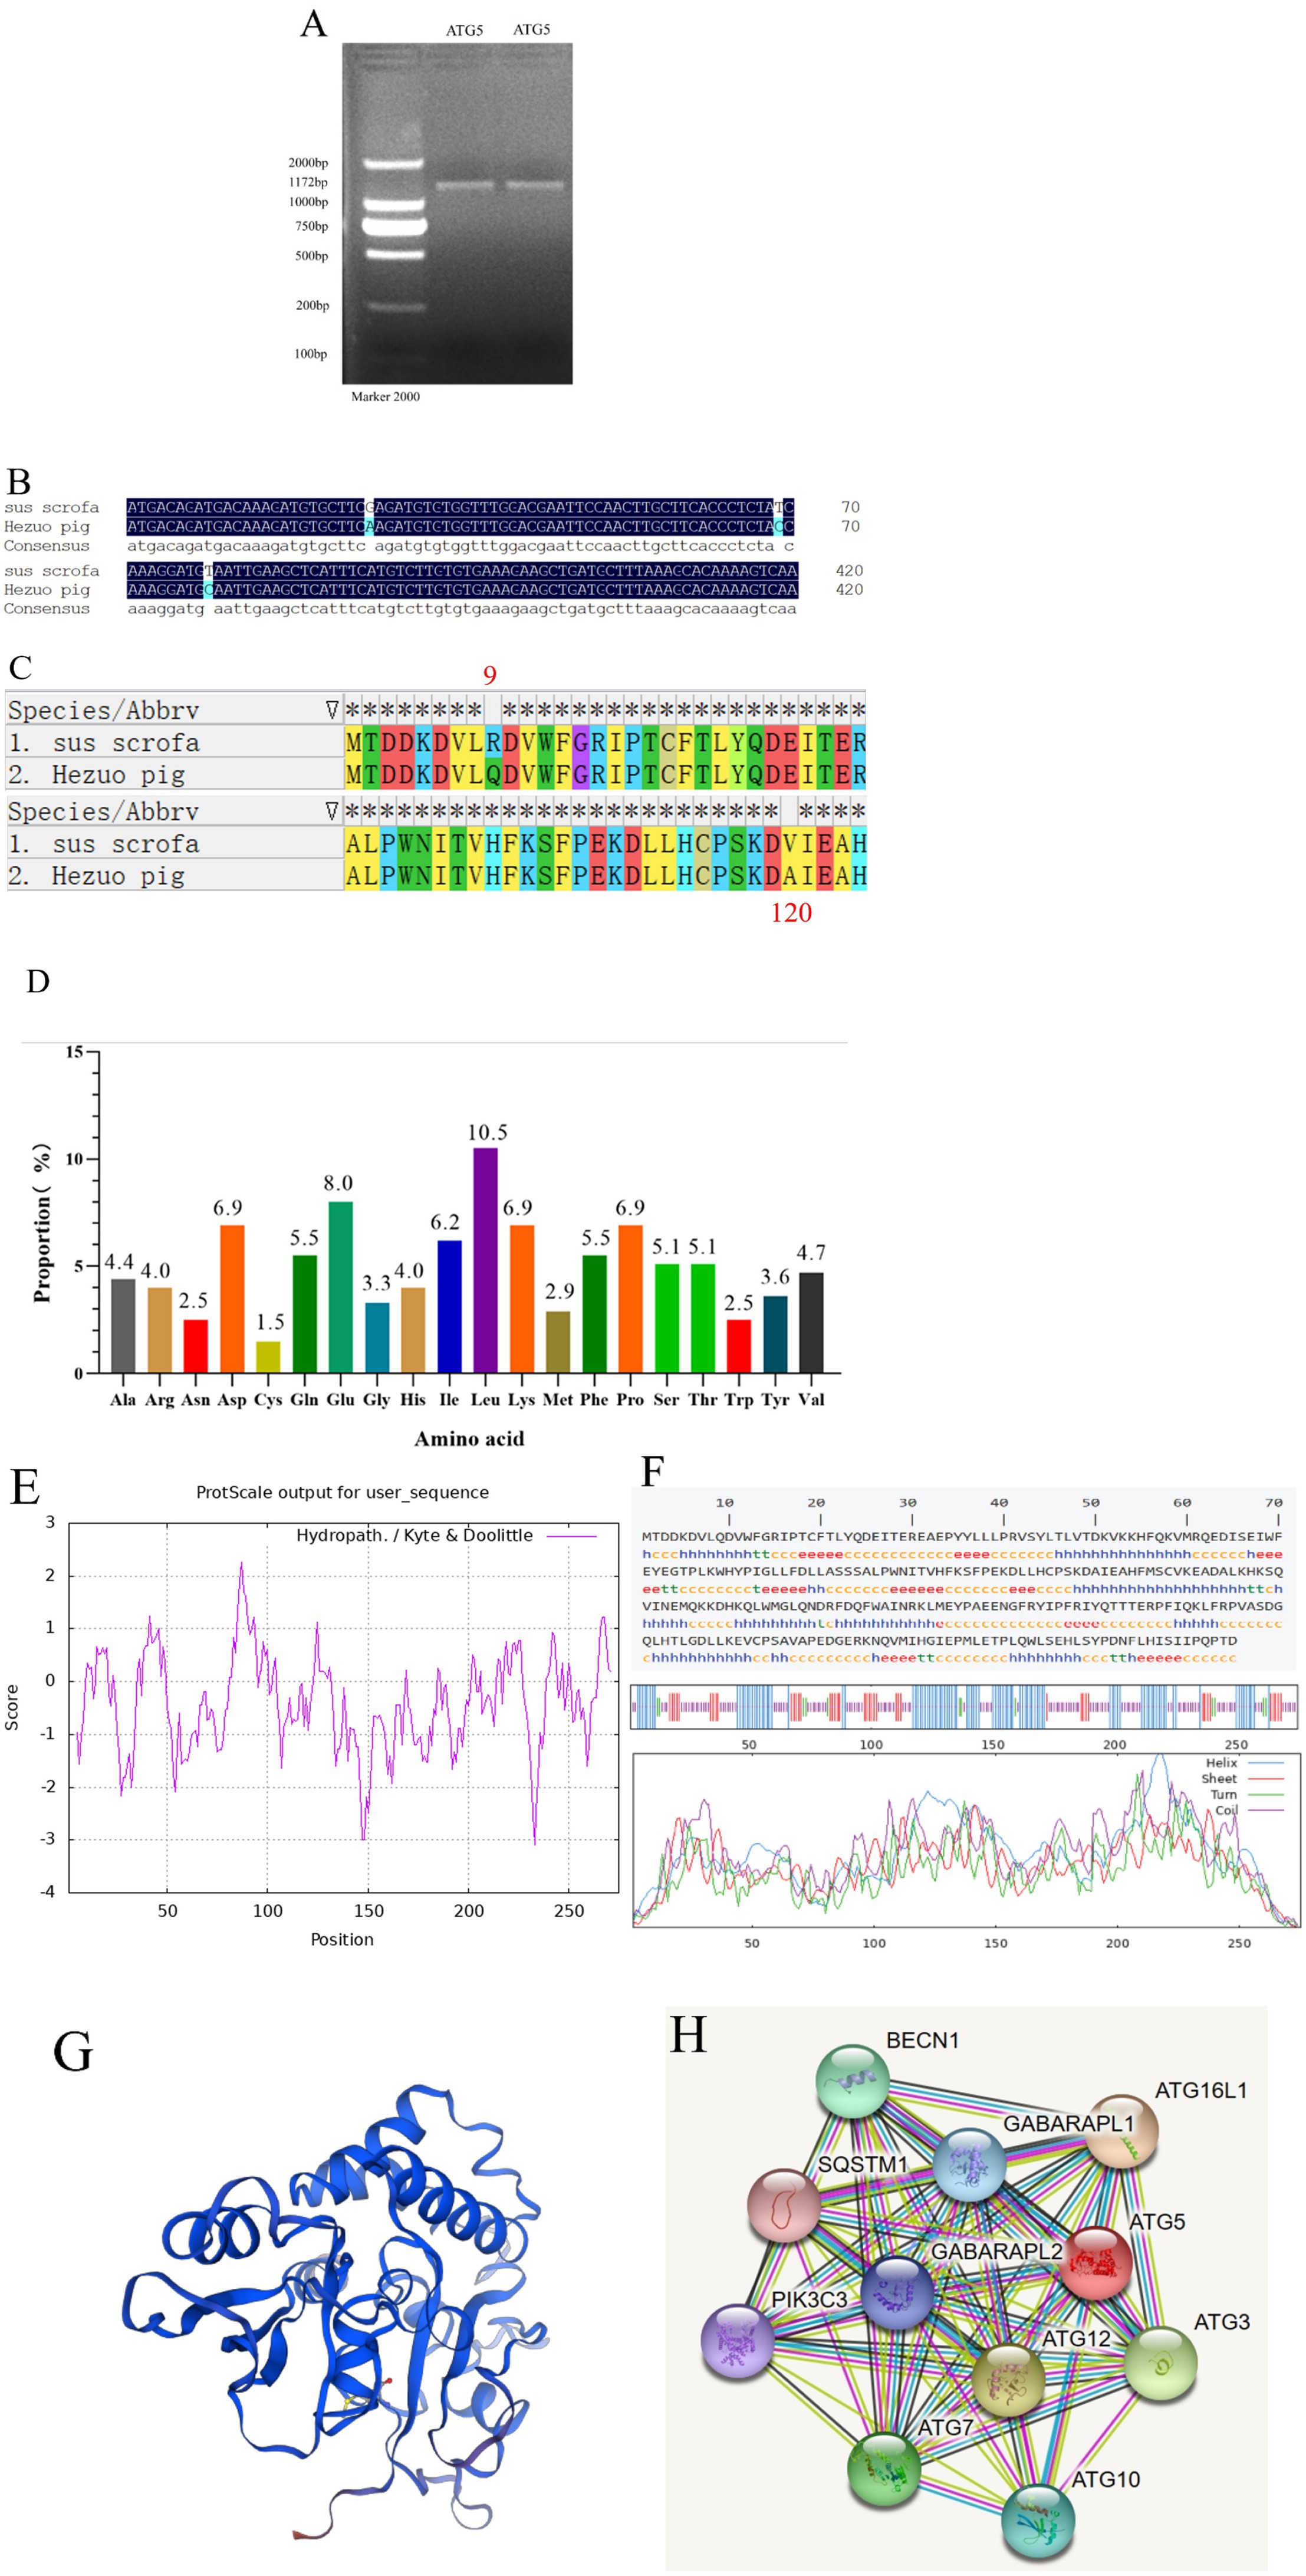
Figure 2. Cloning and sequence analysis of Hezuo pig ATG5 gene. PCR amplification product of ATG5 gene (A); Sequence alignment between cloned and reference ATG5 CDS region (B); Amino acids sequence alignment between cloned and reference ATG5 (C); Analysis of the amino acid composition of Hezuo pig ATG5 protein (D); The analysis of hydrophobicity of Hezuo pig ATG5 protein (E); The secondary structure prediction of Hezuo pig ATG5 protein (F); The transmembrane structure prediction of the Hezuo pig ATG5 protein (G); Analysis of protein networks interacting of ATG5 protein (H).
3.3 Expression pattern of ATG5 at the transcript levels in Hezuo pig
qPCR analysis of ATG5 mRNA expression across various tissues indicated higher expression levels in the testis and lung compared to those in the heart, spleen, kidney, and liver (Figure 3A). Within testicular tissues, ATG5 mRNA was extremely significantly increased in the 4-month group compared to 1-month group (p < 0.01) (Figure 3B).
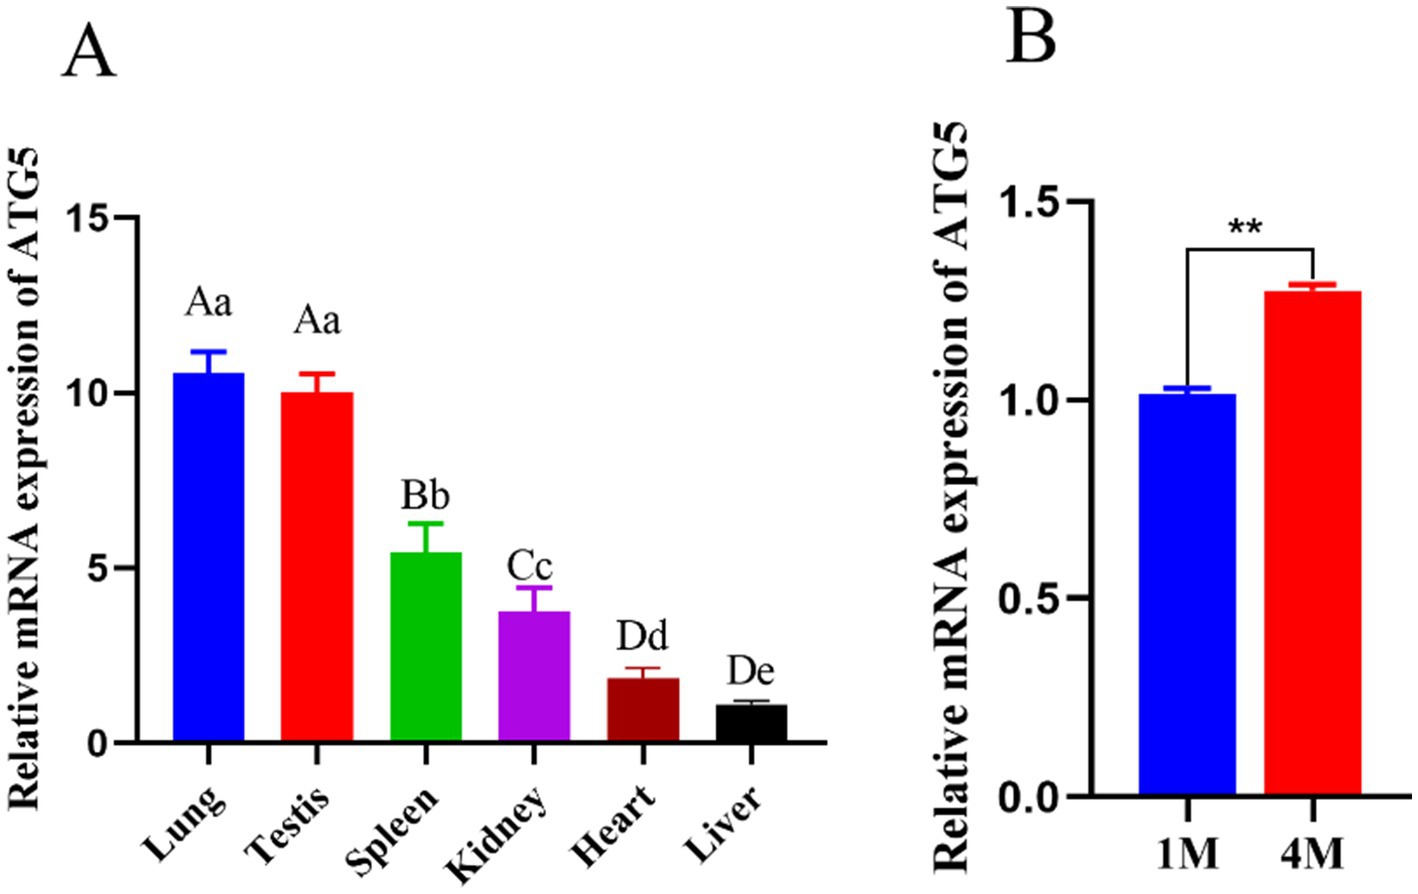
Figure 3. Expression of ATG5 mRNA in different tissues of Hezuo pig (A), Expression of ATG5 in different month of Hezuo pig (B). Different uppercase letters indicate extremely significant differences (p < 0.01), different lowercase letters indicate significant differences (p < 0.05).
3.4 Purification and identification of Hezuo pig primary Leydig cells
After being isolated from testicular tissue, Leydig cells appeared round or oval, displaying good refractive properties and remained suspended in the culture medium. To further purify the culture, the medium was changed 4 h post-isolation, allowing for the removal of unadhered cells. Non-adherent cells were subsequently eliminated through multiple medium changes. Leydig cells were identified using a specific 3β-HSD antibody and immunofluorescence. All cells exhibited positive staining, confirming that the isolated cells were indeed testicular Leydig cells (Figure 4).
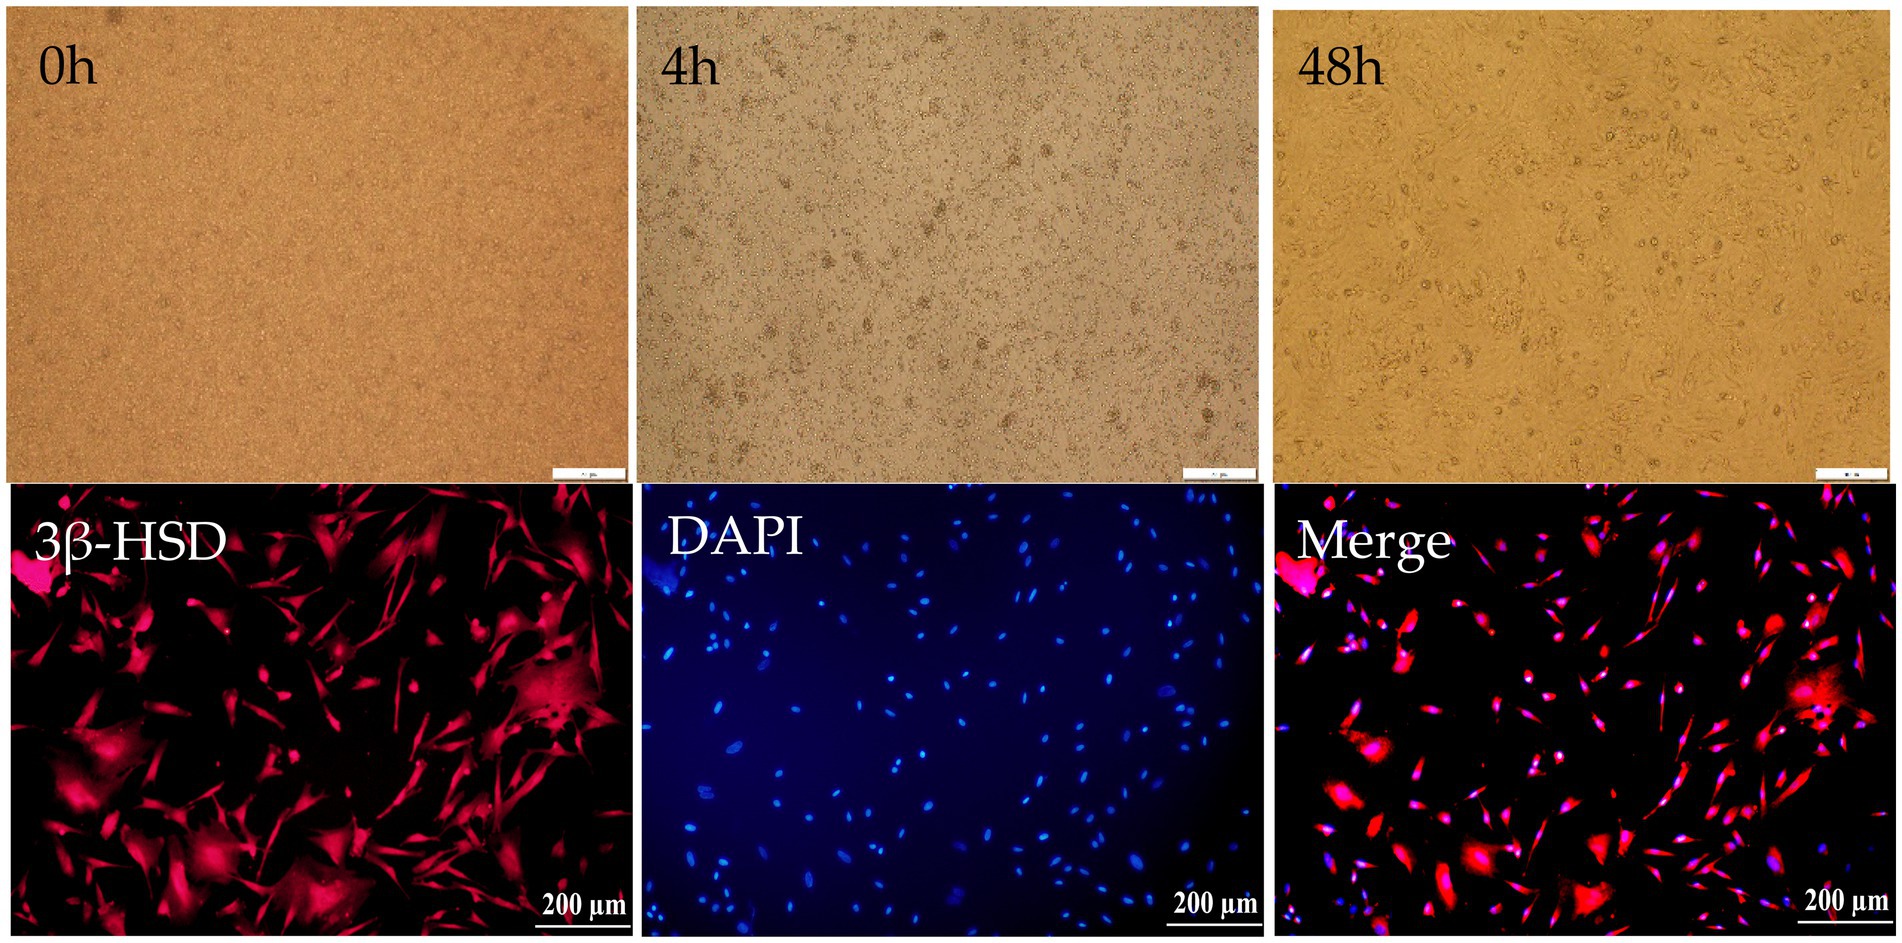
Figure 4. Isolation and identification of Leydig cells in Hezuo pig. Primary of Leydig cells in Hezuo pig just isolated (20×) (0 h), primary of Leydig cells in Hezuo pig after 4 h culturing (20×) (4 h), primary of Leydig cell in Hezuo pig after 48 h culturing (20×) (48 h). Immunofluorescence identification of 3β-HSD in Leydig cells of Hezuo pig (20×) (3β-HSD). DAPI:4′6-Diamidino-2-phenylindole in Leydig cells of Hezuo pig (20×) (DAPI). Merge of 3β-HSD and DAPI in Leydig cells of Hezuo pig. (20×) (Merge).
3.5 Transfection efficiency assay
qPCR was used to detect the mRNA expression level of the ATG5 gene in transfected Hezuo pig testicular Leydig cells. The results showed that the ATG5 gene was significantly down-regulated in the si-ATG5-404, si-ATG5-477, si-ATG5-566, and si-ATG5-696 transfected groups compared with si-ATG5-NC at 48 h, in which the silencing effect of si-ATG5-477 was extremely significantly higher than the other three (p < 0.01) (Figure 5A). Conversely, the ATG5 gene was up-regulated following transfection with a 2,500 ng concentration of the overexpressed ATG5-OE for 48 h (Figure 5B) (p < 0.01). The above results demonstrate both the interference and overexpression were successful.
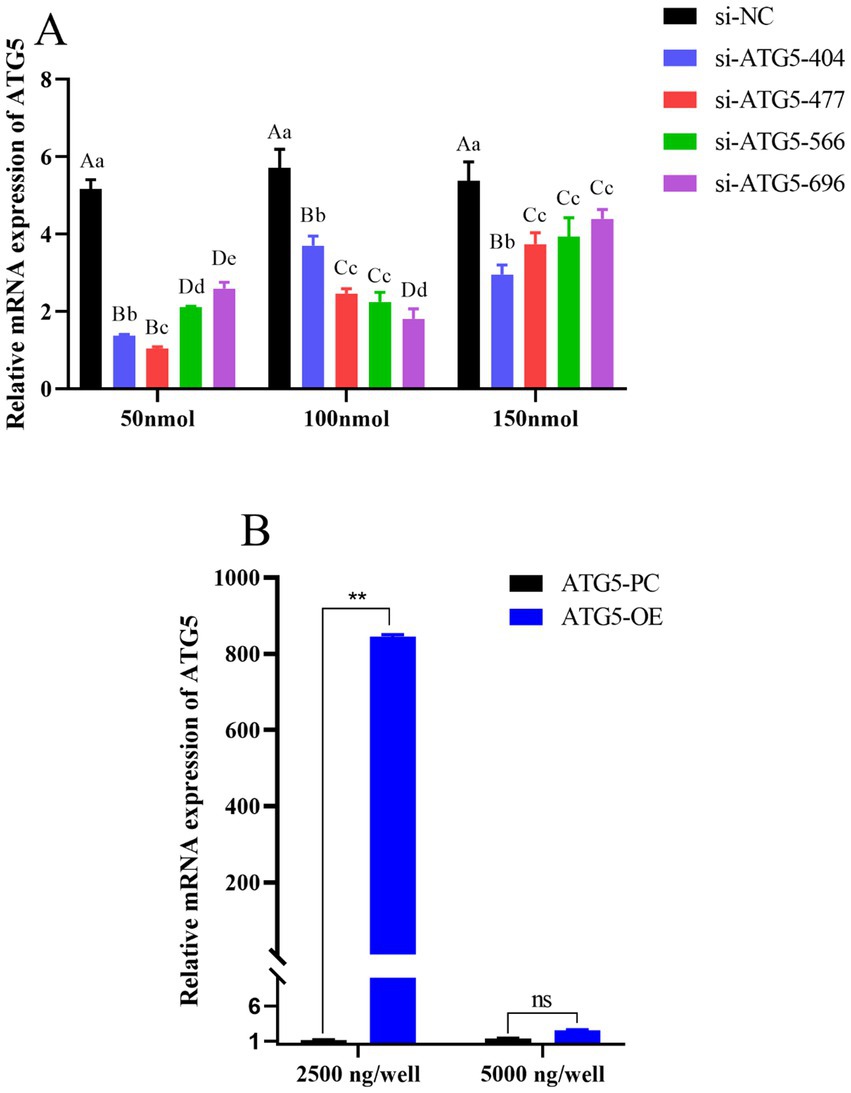
Figure 5. Detection of transfection efficiency. (A) ATG5 gene silencing efficiency of different concentration. (B) ATG5 gene overexpression efficiency of different concentration. Different uppercase letters indicate extremely significant differences (p < 0.01), different lowercase letters indicate significant differences (p < 0.05).
3.6 Effect of ATG5 gene silencing or overexpression on the proliferation, apoptosis of Hezuo pig Leydig cells
Overexpression of ATG5 inhibits cell apoptosis, promotes cell viability, whereas silencing ATG5 produces opposite results. The results of CCK-8 assay for cell viability showed that the cells count in the ATG5-OE group was higher than that in ATG5-PC group at both 48 h and 72 h post-transfection (p < 0.05) (Figure 6A), accompanied by significantly increased expression levels of the proliferation-related genes Bcl2 and PCNA (p < 0.01; Figures 6G,H). Additionally, the cell count in the si-ATG5-477 group was significantly lower compared to the si-ATG5-NC group at the same time points (p < 0.01) (Figure 6D), along with significantly decreased expression of Bcl2 and PCNA (p < 0.01; Figures 6G,H). The apoptosis rate in the ATG5-OE group was significantly lower than that in the ATG5-PC group (p < 0.01) (Figures 6B,C), along with significantly decreased expression of the apoptosis-related genes Caspase3 and Caspase9 (p < 0.01; Figures 6I,J). The apoptosis rate in the si-ATG5-477 group was higher than that in the si-ATG5-NC group (p < 0.05) (Figures 6E,F), along with significantly elevated expression of Caspase3 and Caspase9 (p < 0.01; Figures 6I,J).
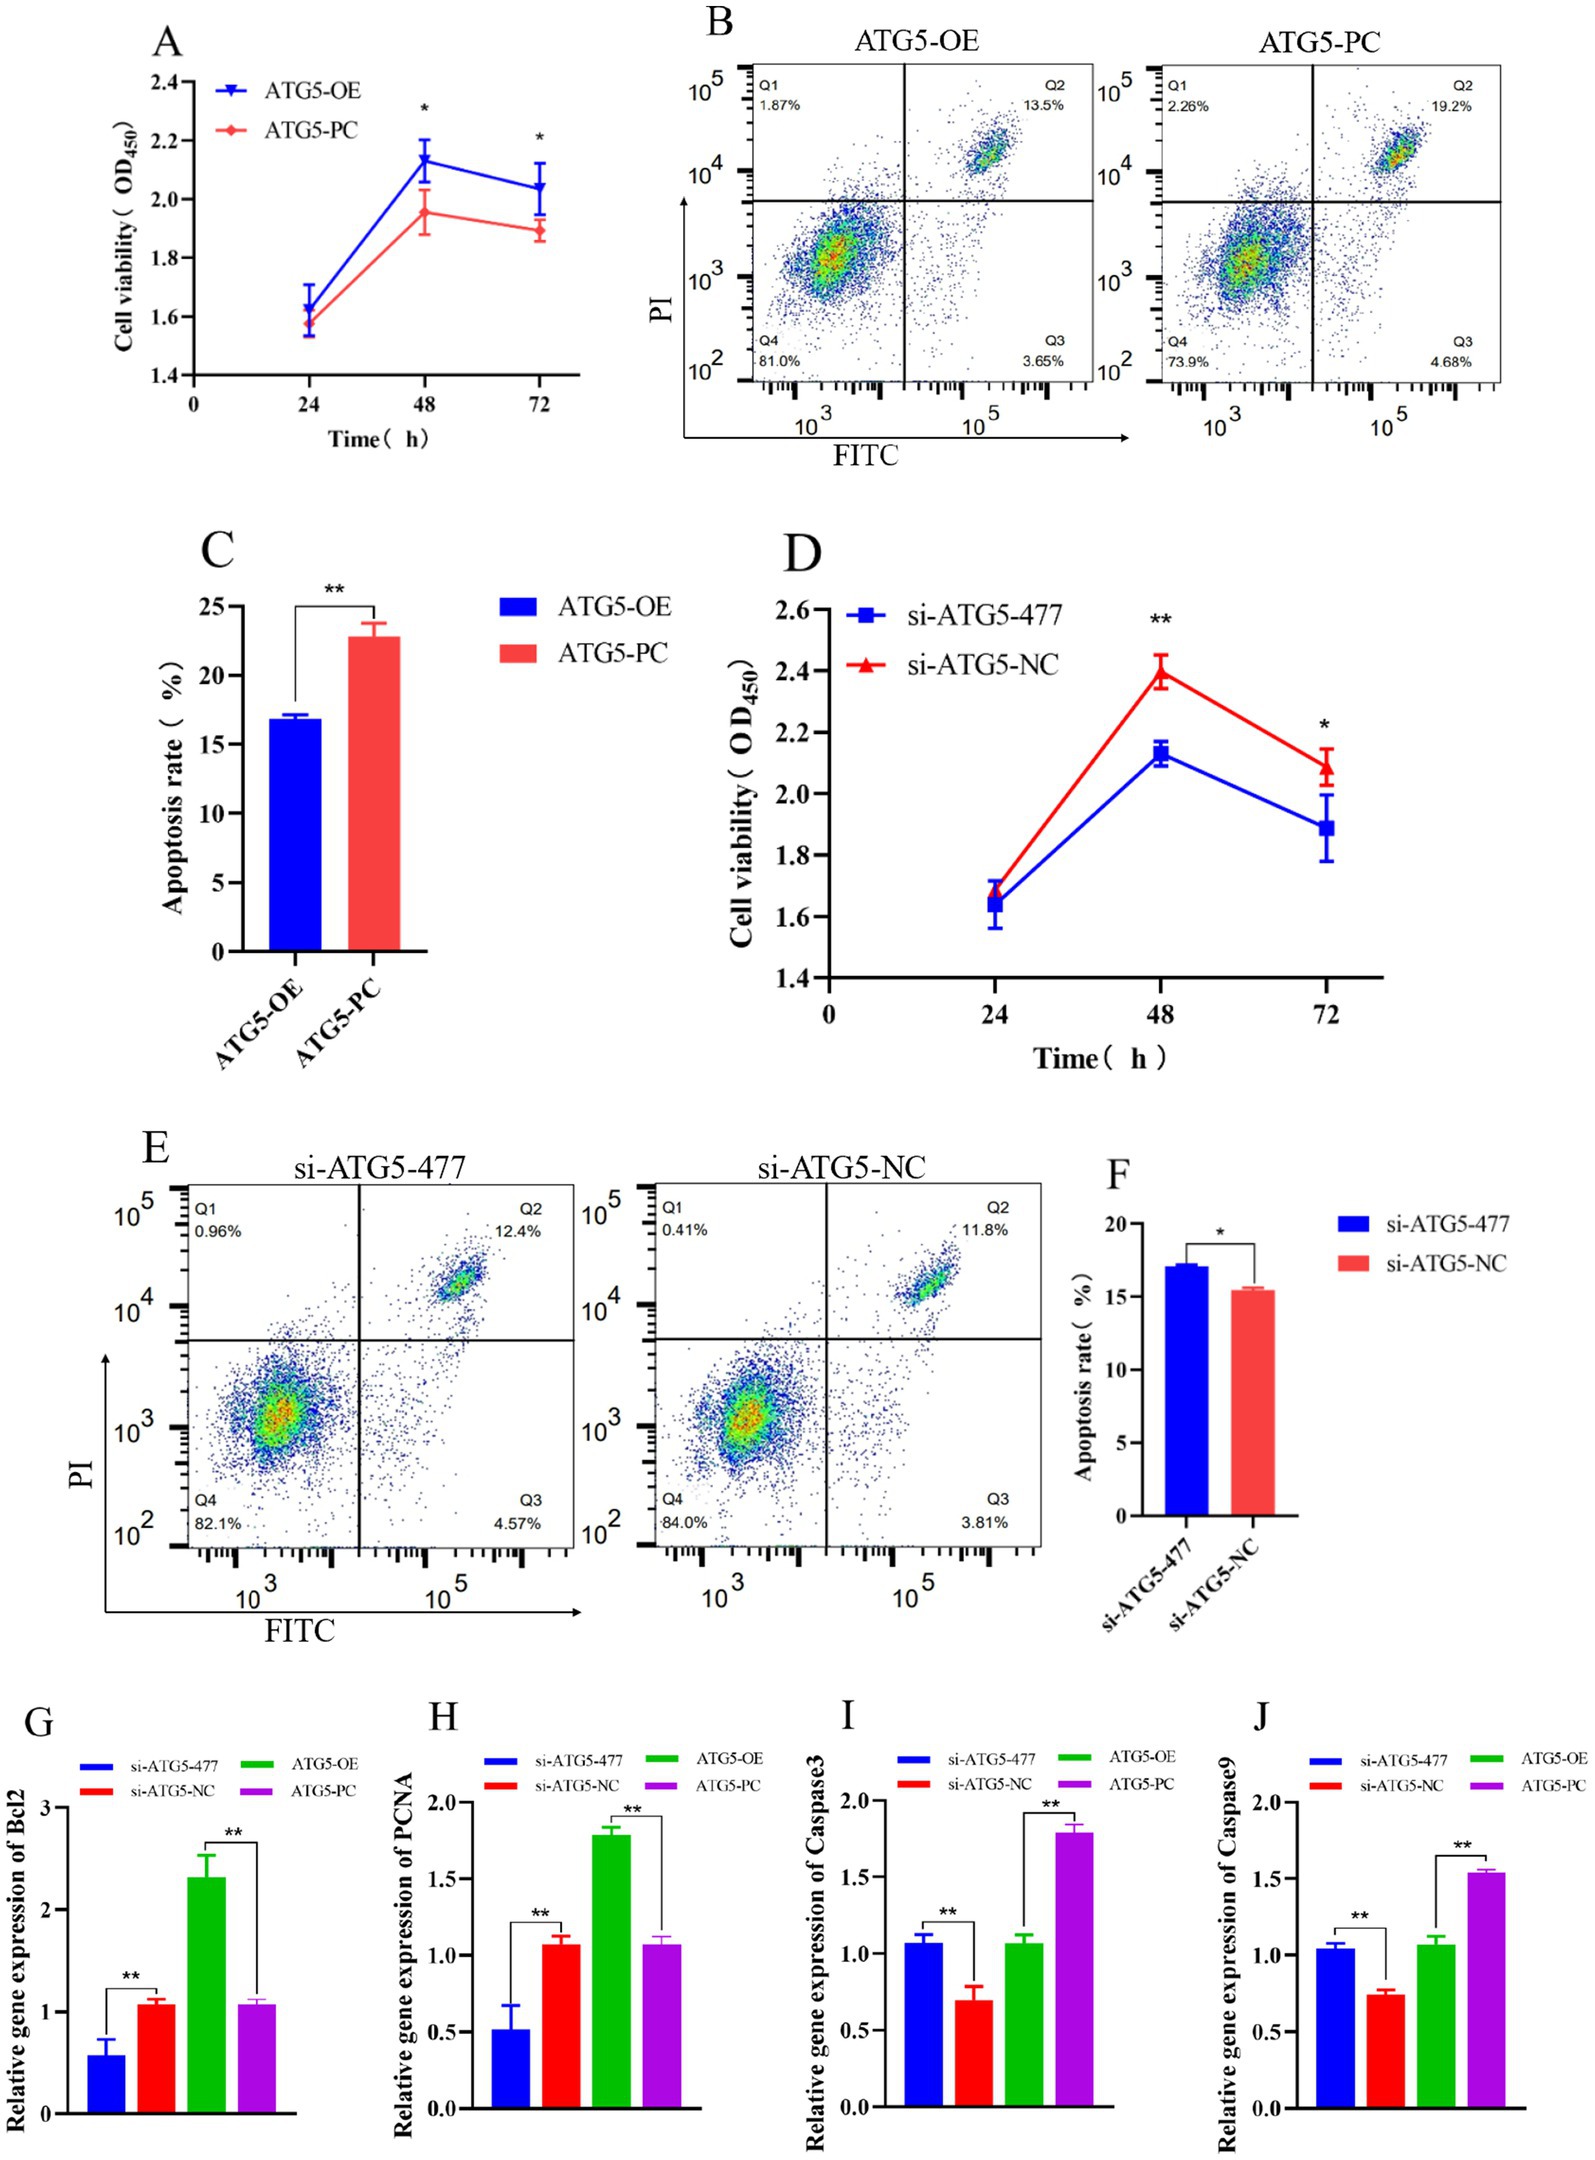
Figure 6. Effect of ATG5 gene silencing or overexpression on the proliferation, apoptosis of Hezuo pig Leydig cells. CCK-8 detects cell proliferation rate after overexpression or silencing ATG5 gene (A,D), Flow cytometry detection cell apoptosis rate after overexpression or silencing ATG5 gene (B,C,E,F), qPCR detection relative gene expression of Bcl2, PCNA, Caspase3 and Caspase9 after overexpression or silencing ATG5 gene (G,H,I,J).
3.7 qPCR detection of autophagy and testosterone synthesized gene expression
qPCR analysis demonstrated that at 48 h post-transfection, the expression levels of autophagy-related genes (BECN1, ATG7 and LC3) in the si-ATG5-477 group were significantly downregulated compared to the si-ATG5-NC group (p < 0.01), while p62 expression was markedly upregulated (p < 0.01). Conversely, the ATG5-OE group showed significantly elevated expression of BECN1, ATG7 and LC3 (p < 0.01), accompanied by a significant reduction in p62 expression (p < 0.01) compared to the empty vector control group. These findings indicate that ATG5 overexpression enhances the expression of autophagy-related genes in Hezuo pig Leydig cells, while ATG5 silencing suppresses this expression (Figure 7).
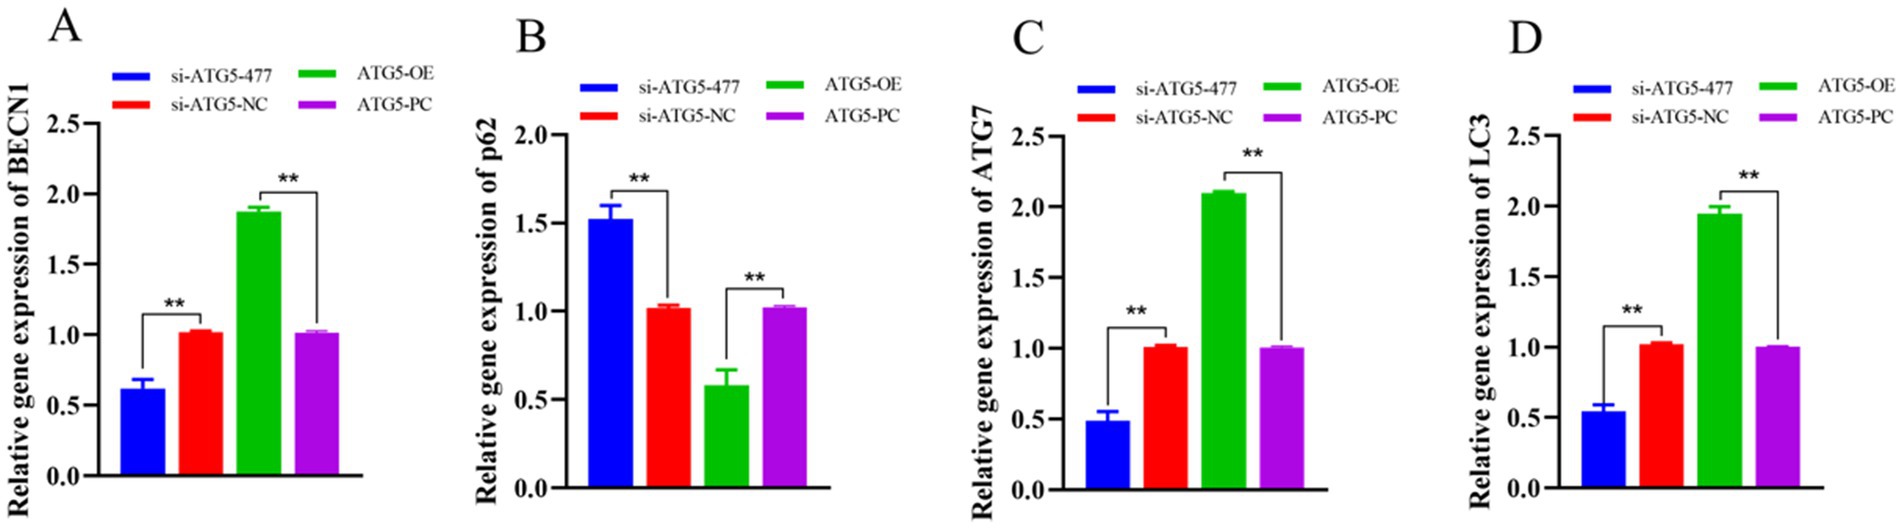
Figure 7. Effect of interference and overexpression of ATG5 gene on BECN1 (A), p62 (B), ATG7 (C), and LC3 (D) genes in Leydig cells of testicular of Hezuo pig.
qPCR analysis revealed that at 48 h post-transfection, the expression levels of testosterone synthesis-related genes (StAR, HSD3B and CYP11A1) in the si-ATG5-477 group were significantly lower than those in the si-ATG5-NC group (p < 0.01). Conversely, the ATG5-OE group exhibited significantly higher expression levels of these steroidogenic genes compared to the empty vector control group (p < 0.01). These results indicate that ATG5 overexpression upregulates the expression of testosterone production-related genes in Hezuo pig Leydig cells, while ATG5 silencing downregulates their expression (Figure 8).
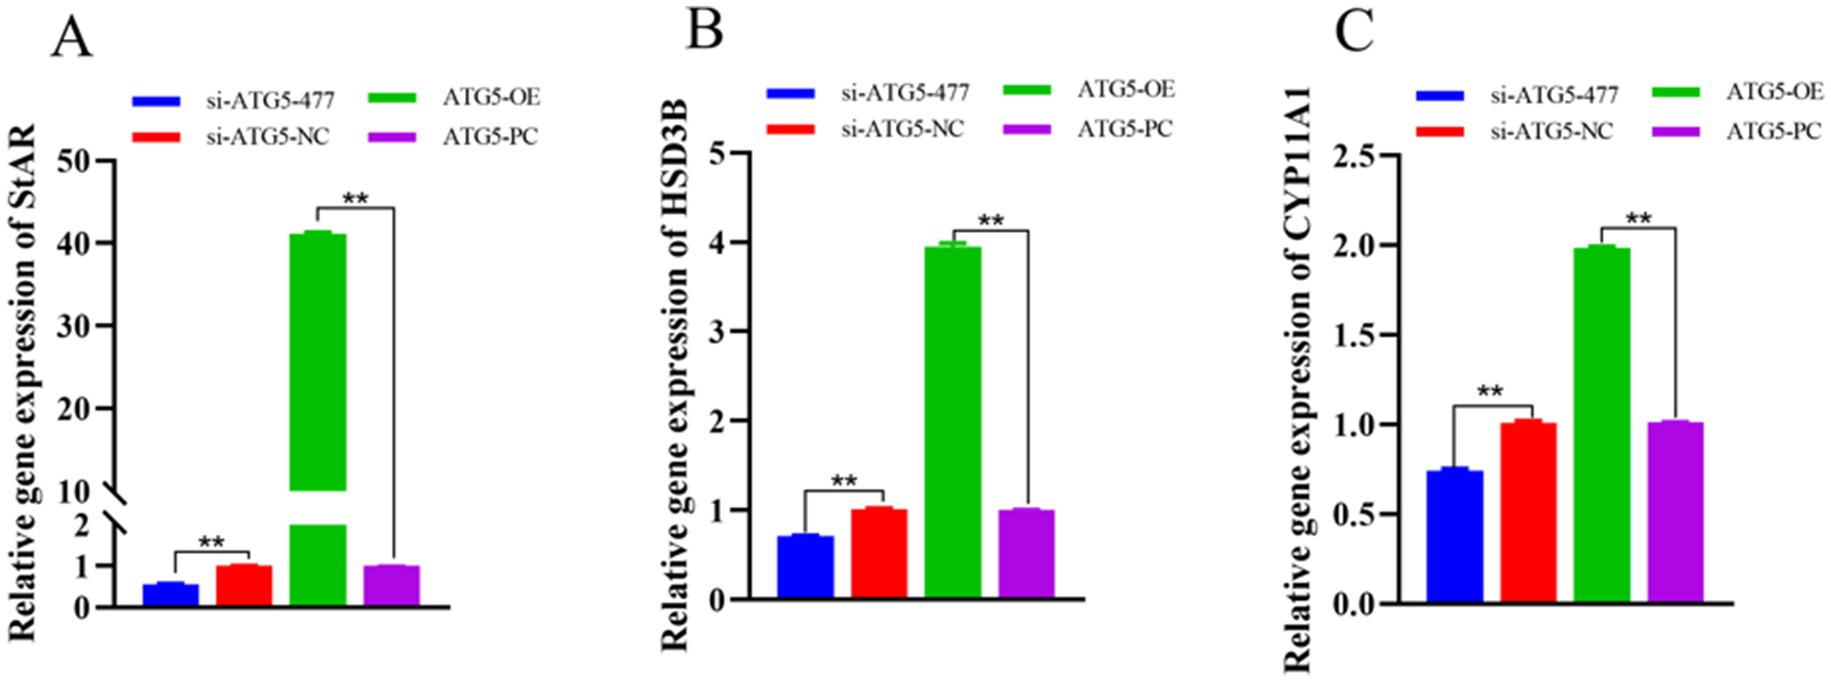
Figure 8. Effect of interference and overexpression of ATG5 gene on StAR (A), HSD3B (B), and CYP11A1 (C) genes in Leydig cells of testicular of Hezuo pig.
3.8 Western blotting detection of ATG5, StAR and LC3 protein expression
Western blotting was used to evaluate the expression levels of ATG5, StAR and LC3 protein. Results showed that compared to the control group, ATG5-OE group significantly increased the expression of ATG5, StAR and LC3 (p < 0.01), and si-ATG5-477 group could significantly reduce the expression of ATG5, StAR and LC3 (p < 0.01). Overexpression of ATG5 promoted the expression of ATG5, StAR and LC3 proteins in Hezuo pig Leydig cells, whereas silencing of ATG5 inhibited the expression of ATG5, StAR and LC3 proteins in Hezuo pig Leydig cells (Figure 9).
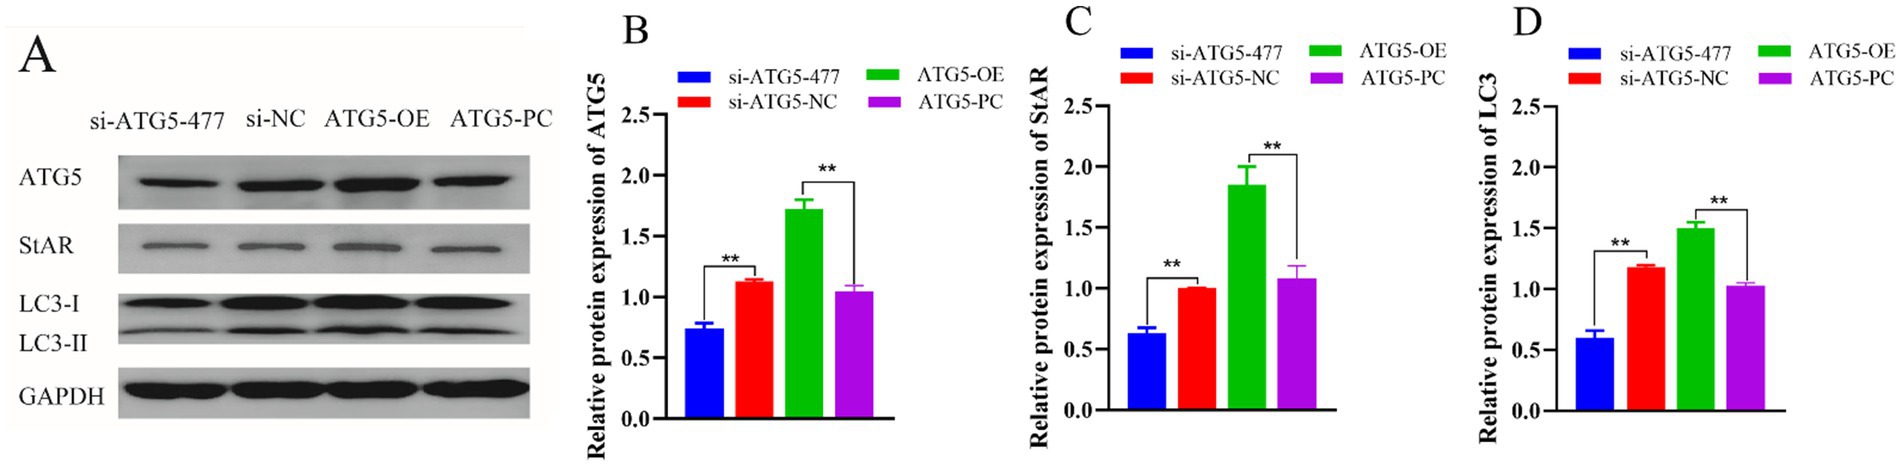
Figure 9. Effect of ATG5 gene silencing or overexpression on expression of ATG5, StAR and LC3 protein of Hezuo pig Leydig cells. Western blot bands in Hezuo pig Leydig cells after silencing or overexpression ATG5 gene (A), Relative protein expression level of ATG5 in Hezuo pig Leydig cells after silencing or overexpression ATG5 gene (B), Relative protein expression level of StAR in Hezuo pig Leydig cells after silencing or overexpression ATG5 gene (C), Relative protein expression level of LC3 in Hezuo pig Leydig cells after silencing or overexpression ATG5 gene (D).
3.9 Effects of ATG5 gene silencing or overexpression on testosterone, autophagy gene BECN1, NPC1L1 and TSPO of Hezuo pig Leydig cells
Overexpression of ATG5 increases the secretion testosterone, autophagy genes BECN1, NPC1L1 and TSPO secretion, while silencing of ATG5 could decreases these levels. In this experiment, the levels of testosterone, autophagy genes BECN1, NPC1L1 and TSPO were quantified using ELISA 48 h post-transfection. The results showed that in the ATG5-OE group, the expression of testosterone, autophagy genes BECN1, NPC1L1 and TSPO of were significantly increased compared to the ATG5-PC group (p < 0.01). Conversely, in the si-ATG5-477 group, these levels were significantly lower than those in the si-ATG5-NC group (p values: testosterone < 0.01, BECN1 < 0.01, NPC1L1 < 0.05, and TSPO < 0.01) (Figure 10).
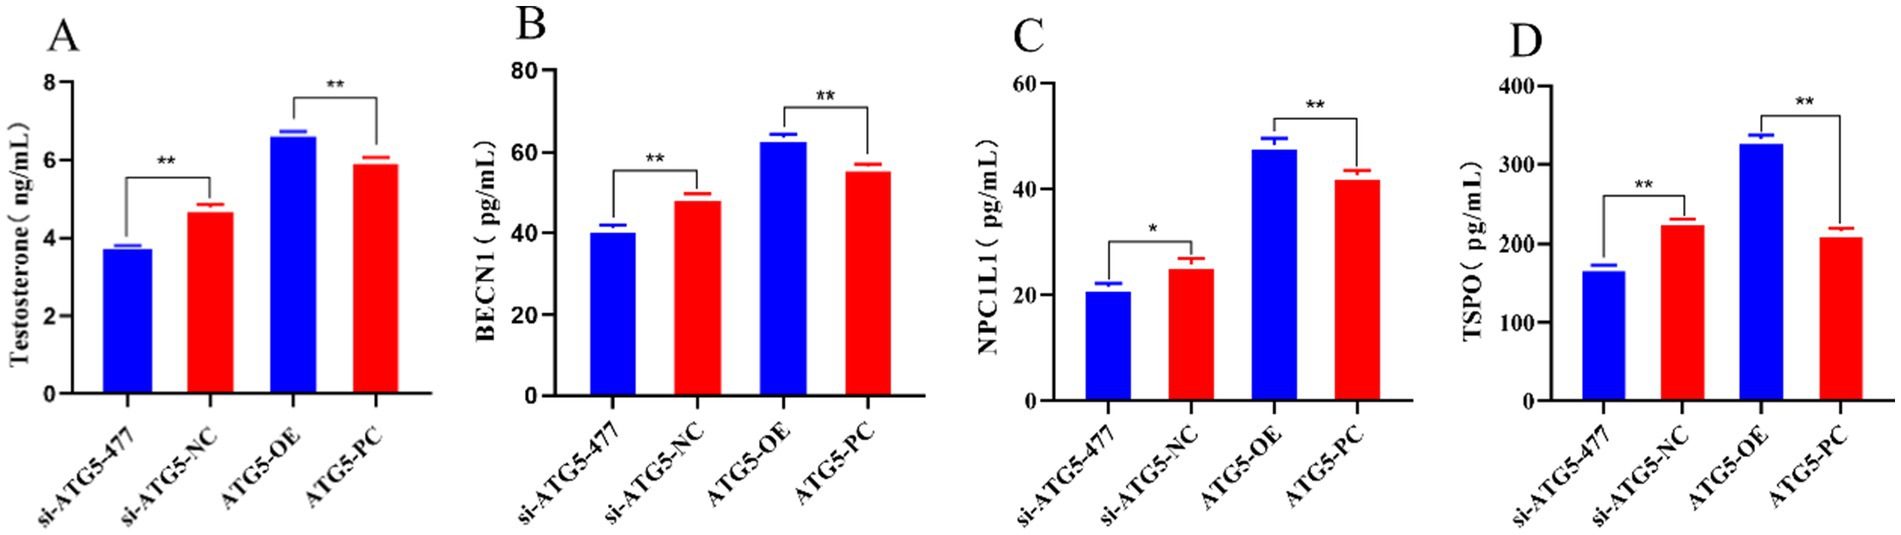
Figure 10. The content of testosterone, autophagy gene BECN1, NPC1L1, and TSPO after silencing and overexpression of ATG5 gene.
4 Discussion
4.1 Function of ATG5 gene and sequence characterization of ATG5 in Hezuo pig
In this study, we obtained the CDS region sequence of ATG5 gene from Hezuo pig. Compared to the reference sequence, the CDS region of the Hezuo pig ATG5 gene is 828 bp long, encoding 275 amino acids. We identified three nucleotide mutations, leading to two amino acid substitutions. These mutations may influence the function of testicular Leydig cells in Hezuo pigs by enhancing autophagy and facilitating the efficient transfer of cholesterol for testosterone and other steroid hormone synthesis, thereby ensuring normal reproductive performance.
The ATG5 gene plays a crucial role in the early stages of autophagosome formation. Studies have shown that changes in ATG5 protein levels (whether increased or decreased), affect autophagy flux. Specifically, knocking down ATG5 blocks autophagosome formation (14). ATG5 can form a complex with ATG12, an ubiquitin-like protein that is highly unstable in its free state and can be directly degraded by ubiquitination. The stability of ATG12 is significantly enhanced upon forming a complex with ATG5. Upon binding with ATG12, ATG5 can form the ATG12-ATG5-ATG16 complex with ATG16, facilitating the elongation of autophagic vesicles. In this process, ATG5 acts as a coupling switch. Additionally, the ATG12-ATG5 complex accelerates the lipidation of ATG8 (LC3), promoting the formation of an E3-like enzyme activity required for autophagy (16, 17). The ATG5 complex binds to the autophagic vesicle membrane and promote the aggregation of LC3 (ATG8) to autophagic vesicles (16). Currently, no studies on the ATG5 gene in Hezuo pig have been reported. Han et al. (40) found that the CDS region of the chicken ATG5 gene is 831 bp long and encode 275 amino acids. Lei et al. (41) report that 828 bp CDS sequence of buffalo ATG5 gene encodes a protein of 275 amino acids, consistent with our findings.
4.2 Effect of ATG5 on proliferation and apoptosis of Leydig cells of Hezuo pig
In this study, we found that overexpression of ATG5 promoted the proliferation and inhibited the apoptosis of testicular Leydig cells in Hezuo pig, while silencing of ATG5 suppressed proliferation and enhanced apoptosis in these cells. There is a close relationship between cellular autophagy and apoptosis. When organisms experience infection, nutritional deficiency, stress, or radiation, they initiate cellular autophagy as a self-protective mechanism. However, if external stimuli persist, self-protection mechanisms fail, leading to the activation of apoptosis. It has been proposed that autophagy may serve as an apoptotic pathway. Consequently, autophagy is often referred to as type II apoptosis, which induces cell death by degrading essential cellular components (e.g., mitochondria), thereby depriving the cell of the energy necessary for survival (42–44). From a molecular perspective, several genes are shared between autophagy and apoptosis, including ATG5, Bcl-2, p53 and ARF. These genes play crucial regulatory roles in both processes, and their activation or silencing influences both pathways. In apoptotic cells, ATG5 is cleaved by calpain, resulting in the translocation of its N-terminal fragment to mitochondria. This fragment mediates the release of cytochrome C by interacting with the pro-survival Bcl-2 family member Bcl-xL (45). Non-conjugated ATG12 binds to Bcl-2 family proteins and promotes apoptosis (46). Beclin-1 is an essential regulator of autophagosome formation and also plays a role in regulating apoptosis. As a BH3-only protein in the Bcl-2 family, Beclin-1 interacts with Bcl-2 localized in the endoplasmic reticulum via its BH3 domain, thereby inhibiting autophagy (47).
4.3 Effect of ATG5 on testosterone production by Leydig cells of Hezuo pig
The results of this study indicated that overexpression of ATG5 significantly increased the expression levels of ATG5, StAR, and LC3 protein, autophagy and testosterone synthesized gene Expression, as well as the contents of testosterone, BECN1, NPC1L1, and TSPO in the testicular Leydig cells of Hezuo pigs. This suggests that ATG5 regulates testosterone production via cellular autophagy, potentially through the modulation of StAR, NPC1L1, and TSPO.
Testosterone is a crucial sex hormone in mammals, playing a key role in reproductive functions including spermatogenesis and the maintenance of secondary sexual characteristics. In male mammals, testicular Leydig cells are the main site of testosterone synthesis. Exposure to environmental stimuli, such as toxins (48) or hypoxia (49), can affect cellular autophagy and alter testosterone secretion. Chen et al. (5) observed that both the steroidogenic activity and ultrastructural features of testicular Leydig cells in dairy goats change with age, based on ex vivo and in vivo experiments. Compared to juveniles, Leydig cells in sexually mature and adult goats contain numerous smooth endoplasmic reticula, mitochondria, and lipid droplets, which form the foundation for testosterone synthesis. Moreover, Leydig cells from sexually mature and adult goats exhibit higher autophagic activity compared to juveniles, indicating that autophagy contributes to testosterone synthesis primarily by degrading mitochondria and endoplasmic reticula in these cells.
Some researchers fed mice a zinc-deficient diet for 8 weeks. The results indicated that compared to the normal diet group, the zinc-deficient diet led to testicular structural abnormalities and impaired autophagy, with significant reductions in ATG5 and Beclin1 expression, as well as a notable decrease in testosterone levels (50). Xiao et al. (51), collected ovarian granulosa cells from patients with polycystic ovary syndrome (PCOS), a common gynecological endocrine disorder characterized by hyperandrogenism, and from patients without PCOS. RT-PCR analysis showed that the mRNA expression of autophagy-related genes ATG5, ATG7, and BECN1 was significantly elevated in the ovarian granulosa cells of PCOS patients. Esmaeilian et al. (52), isolated testicular tissues from males undergoing orchiectomy and either silenced autophagy genes (Beclin1 and ATG5) using siRNA and shRNA or altered autophagy via pharmacological inhibition. Results showed that both approaches significantly decreased the production of testosterone (T), progesterone (P), and estradiol (E2) in isolated testicular tissues. This confirms that the human testis produces steroid hormones including testosterone, estrogen, and progesterone through an autophagy-mediated pathway. Yang et al. (53), observed that autophagy was significantly reduced in the testicular interstitial cells of non-breeding male naked mole-rats (NMRs) compared to breeding NMRs, accompanied by significant decreases in ATG7, ATG5 expression, autophagosome count, and declines in StAR and testosterone production. This reduction correlated with decreased autophagic activity. Li et al. (54), reported that reduced testosterone levels were linked to decreased autophagic activity in aged rat Leydig cells. Furthermore, knockdown of Beclin1 resulted in autophagic deficiency, leading to decreased StAR protein expression and testosterone production. Gong et al. (55), found that enhancing autophagy in porcine Leydig cells increased testosterone levels and StAR protein expression.
TSPO is a drug-and cholesterol-binding protein that is particularly abundant in steroid synthesizing cells (35). Previous studies have demonstrated that TSPO levels decrease in senescent Leydig cells (LCs), and this reduction correlates with lower circulating testosterone levels in aged rats (56). The testosterone-producing activity of Leydig cells is diminished when TSPO expression is entirely absent. TSPO deficiency results in the disruption of mitochondrial function and membrane dynamics. Enhancing mitochondrial fusion might offer a therapeutic approach for maintaining or restoring testosterone levels. The TSPO agonist FGIN-1-27 stimulates testosterone production in Leydig cells, leading to increased serum and intratesticular testosterone levels (34, 57). Recent studies indicate that NPC1L1 is a transmembrane cholesterol transporter crucial for cholesterol uptake, lipid homeostasis regulation, and providing substrates for steroid hormone synthesis. Cholesterol depletion has been linked to autophagy (36, 37).
5 Conclusion
ATG5 in Hezuo pigs showed high expression at 4 months of age, particularly in testicular and lung tissues. Silencing and overexpression vectors for the ATG5 gene were constructed, which effectively reduced or increased ATG5 gene expression in Leydig cells. Overexpression of ATG5 was observed to inhibit apoptosis, enhance cell viability, elevate the expression levels of ATG5, StAR and LC3 proteins, and increase testosterone secretion as well as the expression of autophagy-related genes (BECN1, ATG7 and LC3). In contrast, silencing ATG5 produced opposite effects. These findings suggest that manipulating ATG5 expression-either through interference or overexpression-can regulate testosterone synthesis, potentially via autophagy-mediated cholesterol transport regulation. These findings lay a scientific foundation for investigating testosterone production and reproductive disorders not only in Hezuo pigs but also in other male mammals.
Data availability statement
The original contributions presented in the study are included in the article/supplementary material, further inquiries can be directed to the corresponding author.
Ethics statement
The animal study was approved by Institutional Animal Care and Use Committee of Gansu Agricultural University. The study was conducted in accordance with the local legislation and institutional requirements.
Author contributions
HD: Investigation, Methodology, Writing – original draft. ZY: Formal analysis, Writing – review & editing, Data curation, Methodology. HS: Software, Writing – review & editing, Methodology. SG: Writing – review & editing, Funding acquisition.
Funding
The author(s) declare that financial support was received for the research and/or publication of this article. This work was supported by the Natural Science Foundation of Gansu Provincial Science and Technology Program (25JRRA1025).
Conflict of interest
The authors declare that the research was conducted in the absence of any commercial or financial relationships that could be construed as a potential conflict of interest.
Generative AI statement
The author(s) declare that no Gen AI was used in the creation of this manuscript.
Publisher’s note
All claims expressed in this article are solely those of the authors and do not necessarily represent those of their affiliated organizations, or those of the publisher, the editors and the reviewers. Any product that may be evaluated in this article, or claim that may be made by its manufacturer, is not guaranteed or endorsed by the publisher.
References
1. Gao, H, Khawar, MB, and Li, W. Autophagy in reproduction. Autophagy: biology and diseases: basic. Science. (2019) 1206:453–68. doi: 10.1007/978-981-15-0602-4_21
2. Dikic, I, and Elazar, Z. Mechanism and medical implications of mammalian autophagy. Nat Rev Mol Cell Biol. (2018) 19:349–64. doi: 10.1038/s41580-018-0003-4
3. Zhang, J, Zhao, L, Li, Y, Dong, H, Zhang, H, Zhang, Y, et al. Circadian clock regulates granulosa cell autophagy through NR1D1-mediated inhibition of ATG5. Am J Phys Cell Phys. (2022) 322:C231–45. doi: 10.1152/ajpcell.00267.2021
4. Moura, MT, Latorraca, LB, and Paula-Lopes, FF. Contextualizing autophagy during gametogenesis and preimplantation embryonic development. Int J Mol Sci. (2021) 22:6313. doi: 10.3390/ijms22126313
5. Chen, H, Chen, K, Zhao, F, Guo, Y, Liang, Y, Wang, Z, et al. Macroautophagy involved in testosterone synthesis in Leydig cells of male dairy goat (Capra hircus). Theriogenology. (2022) 180:53–62. doi: 10.1016/j.theriogenology.2021.12.023
6. Tremblay, JJ. Molecular regulation of steroidogenesis in endocrine Leydig cells. Steroids. (2015) 103:3–10. doi: 10.1016/j.steroids.2015.08.001
7. Xiang, J, Liu, X, Ren, J, Chen, K, Wang, H-L, Miao, Y-Y, et al. How does estrogen work on autophagy? Autophagy. (2019) 15:197–211. doi: 10.1080/15548627.2018.1520549
8. Tang, Z, Zhang, Z, Zhang, H, Wang, Y, Zhang, Y, Zhao, J, et al. Autophagy attenuation hampers progesterone synthesis during the development of pregnant corpus luteum. Cells. (2019) 9:71. doi: 10.3390/cells9010071
9. Liu, Q, Gao, H, Yang, F, Zhang, H, and Zeng, S. FSH promotes progesterone synthesis by enhancing autophagy to accelerate lipid droplet degradation in porcine granulosa cells. Front Cell Dev Biol. (2021) 9:626927. doi: 10.3389/fcell.2021.626927
10. Nakashima, A, Tsuda, S, Kusabiraki, T, Aoki, A, Ushijima, A, Shima, T, et al. Current understanding of autophagy in pregnancy. Int J Mol Sci. (2019) 20:2342. doi: 10.3390/ijms20092342
11. Klionsky, DJ. Autophagy: from phenomenology to molecular understanding in less than a decade. Nat Rev Mol Cell Biol. (2007) 8:931–7. doi: 10.1038/nrm2245
12. Matsuura, A, Tsukada, M, Wada, Y, and Ohsumi, Y. Apg1p, a novel protein kinase required for the autophagic process in Saccharomyces cerevisiae. Gene. (1997) 192:245–50. doi: 10.1016/S0378-1119(97)00084-X
13. Mochida, K, Oikawa, Y, Kimura, Y, Kirisako, H, Hirano, H, Ohsumi, Y, et al. Receptor-mediated selective autophagy degrades the endoplasmic reticulum and the nucleus. Nature. (2015) 522:359–62. doi: 10.1038/nature14506
14. Hanada, T, Noda, NN, Satomi, Y, Ichimura, Y, Fujioka, Y, Takao, T, et al. The Atg12-Atg5 conjugate has a novel E3-like activity for protein lipidation in autophagy. J Biol Chem. (2007) 282:37298–302. doi: 10.1074/jbc.C700195200
15. Wible, DJ, Chao, H-P, Tang, DG, and Bratton, SB. ATG5 cancer mutations and alternative mRNA splicing reveal a conjugation switch that regulates ATG12–ATG5-ATG16L1 complex assembly and autophagy. Cell Discov. (2019) 5:42. doi: 10.1038/s41421-019-0110-1
16. Mizushima, N. The ATG conjugation systems in autophagy. Curr Opin Cell Biol. (2020) 63:1–10. doi: 10.1016/j.ceb.2019.12.001
17. Pang, Y, Yamamoto, H, Sakamoto, H, Oku, M, Mutungi, JK, Sahani, MH, et al. Evolution from covalent conjugation to non-covalent interaction in the ubiquitin-like ATG12 system. Nat Struct Mol Biol. (2019) 26:289–96. doi: 10.1038/s41594-019-0204-3
18. Qi, H. Investigation of juema pig breed resources in gannan prefecture. Qinghai J Anim Veteri Sci. (2006) 36:23–4. doi: 10.3969/j.issn.1003-7950.2006.01.012
19. Fau-Chang, Z-JCL. Research on Hezuo pig germplasm resources. Swine Ind Sci. (2013):124–7. doi: 10.3969/j.issn.1673-5358.2013.09.033
20. Zhang, B, Yan, Z, Wang, P, Yang, Q, Huang, X, Shi, H, et al. Identification and characterization of lncRNA and mRNA in testes of landrace and Hezuo boars. Animals. (2021) 11:2263. doi: 10.3390/ani11082263
21. Zhang, B, Yan, Z, Gao, Y, Li, J, Wang, Z, Wang, P, et al. Integrated analysis of miRNA and mRNA expression profiles in testes of landrace and Hezuo boars. Front Vet Sci. (2022) 9:942669. doi: 10.3389/fvets.2022.942669
22. Chen, H, Ge, R-S, and Zirkin, BR. Leydig cells: from stem cells to aging. Mol Cell Endocrinol. (2009) 306:9–16. doi: 10.1016/j.mce.2009.01.023
23. Zirkin, BR, and Papadopoulos, V. Leydig cells: formation, function, and regulation. Biol Reprod. (2018) 99:101–11. doi: 10.1093/biolre/ioy059
24. Neaves, WB, Johnson, L, Porter, JC, JR, CRP, and Petty, CS. Leydig cell numbers, daily sperm production, and serum gonadotropin levels in aging men. J Clin Endocrinol Metabol. (1984) 59:756–63. doi: 10.1210/jcem-59-4-756
25. Zhou, R, Wu, J, Liu, B, Jiang, Y, Chen, W, Li, J, et al. The roles and mechanisms of Leydig cells and myoid cells in regulating spermatogenesis. Cell Mol Life Sci. (2019) 76:2681–95. doi: 10.1007/s00018-019-03101-9
26. Jeung, MC. Delineating roles of Beclin1 and Beclin2 in autophagy. San Diego: University of California (2021).
27. Gonzalez, E. The roles of Beclin1 and Beclin2 in autophagy and Mitophagy. San Diego: University of California (2021).
28. Tran, S, Fairlie, WD, and Lee, EF. BECLIN1: protein structure, function and regulation. Cells. (2021) 10:1522. doi: 10.3390/cells10061522
29. Kuma, A, Komatsu, M, and Mizushima, N. Autophagy-monitoring and autophagy-deficient mice. Autophagy. (2017) 13:1619–28. doi: 10.1080/15548627.2017.1343770
30. Hwang, HJ, Ha, H, Lee, BS, Kim, BH, Song, HK, and Kim, YK. LC3B is an RNA-binding protein to trigger rapid mRNA degradation during autophagy. Nat Commun. (2022) 13:1436. doi: 10.1038/s41467-022-29139-1
31. Kabeya, Y, Mizushima, N, Ueno, T, Yamamoto, A, Kirisako, T, Noda, T, et al. LC3, a mammalian homologue of yeast Apg8p, is localized in autophagosome membranes after processing. EMBO J. (2000) 19:5720–8. doi: 10.1093/emboj/19.21.5720
32. Wang, X, Jin, L, Jiang, S, Wang, D, Lu, Y, and Zhu, L. Transcription regulation of NRF1 on StAR reduces testosterone synthesis in hypoxemic murine. J Steroid Biochem Mol Biol. (2019) 191:105370. doi: 10.1016/j.jsbmb.2019.04.019
33. Wang, X, Pan, L, Zou, Z, Wang, D, Lu, Y, Dong, Z, et al. Hypoxia reduces testosterone synthesis in mouse Leydig cells by inhibiting NRF1-activated StAR expression. Oncotarget. (2017) 8:16401–13. doi: 10.18632/oncotarget.14842
34. Papadopoulos, V, Aghazadeh, Y, Fan, J, Campioli, E, Zirkin, B, and Midzak, A. Translocator protein-mediated pharmacology of cholesterol transport and steroidogenesis. Mol Cell Endocrinol. (2015) 408:90–8. doi: 10.1016/j.mce.2015.03.014
35. Fan, J, Campioli, E, Sottas, C, Zirkin, B, and Papadopoulos, VA-O. Amhr2-Cre-mediated global Tspo knockout. J Endocrine Soc. (2020) 4:bvaa001. doi: 10.1210/jendso/bvaa001
36. Hu, M, Yang, F, Huang, Y, You, X, Liu, D, Sun, S, et al. Structural insights into the mechanism of human NPC1L1-mediated cholesterol uptake. Sci Adv. (2021) 7:eabg3188. doi: 10.1126/sciadv.abg3188
37. Wang, Y, Yang, P, Zhang, B, Ding, Y, Lei, S, Hou, Y, et al. Hepatic NPC1L1 overexpression attenuates alcoholic autophagy in mice. Mol Med Rep. (2019) 20:3224–32. doi: 10.3892/mmr.2019.10549
38. Livak, KJ, and Schmittgen, TD. Analysis of relative gene expression data using real-time quantitative PCR and the 2− ΔΔCT method. Methods. (2001) 25:402–8. doi: 10.1006/meth.2001.1262
39. Du, H, Yan, Z, Shi, H, Yang, Q, Huang, X, Wang, P, et al. Isolation, culture, characterization and the functional study of testicular Leydig cells from Hezuo pig. Reprod Domest Anim. (2024) 59:e14583. doi: 10.1111/rda.14583
40. Qi, H. Construction of overexpression vector and functional verification of Atg5 gene in chicken (Gallus gallus). J Agricul Biotech. (2022) 30:716–25. doi: 10.3969/j.issn.1674-7968.2022.04.010
41. Lei, H, Su, XP, Huang, SH, Shi, DS, and Li, XP. Cloning, sequence analysis of autophagy-related genes in buffalo and their expression pattern in buffalo tissue. Heilongjiang Anim Sci Vet Med. (2015) 12:14–7. doi: 10.13881/j.cnki.hljxmsy.2015.2039
42. Marino, G, Niso-Santano, M, Baehrecke, EH, and Kroemer, G. Self-consumption: the interplay of autophagy and apoptosis. Nat Rev Mol Cell Biol. (2014) 15:81–94. doi: 10.1038/nrm3735
43. Eisenberg-Lerner, A, Bialik, S, Simon, H-U, and Kimchi, A. Life and death partners: apoptosis, autophagy and the cross-talk between them. Cell Death Differ. (2009) 16:966–75. doi: 10.1038/cdd.2009.33
44. Gump, JM, and Thorburn, A. Autophagy and apoptosis: what is the connection? Trends Cell Biol. (2011) 21:387–92. doi: 10.1016/j.tcb.2011.03.007
45. Lépine, S, Allegood, JC, Edmonds, Y, Milstien, S, and Spiegel, S. Autophagy induced by deficiency of sphingosine-1-phosphate phosphohydrolase 1 is switched to apoptosis by calpain-mediated autophagy-related gene 5 (Atg5) cleavage. J Biol Chem. (2011) 286:44380–90. doi: 10.1074/jbc.M111.257519
46. Ma, X, Liu, Y, Muhammad, W, Liu, D, Wang, J, Zhou, H, et al. Autophagy-related protein 12 associates with anti-apoptotic B cell lymphoma-2 to promote apoptosis in gentamicin-induced inner ear hair cell loss. Mol Med Rep. (2017) 15:3819–25. doi: 10.3892/mmr.2017.6458
47. Tsapras, P, and Nezis, IP. Caspase involvement in autophagy. Cell Death Differ. (2017) 24:1369–79. doi: 10.1038/cdd.2017.43
48. Zhang, J, Ye, R, Grunberger, JW, Jin, J, Zhang, Q, Mohammadpour, R, et al. Activation of autophagy by low-dose silica nanoparticles enhances testosterone secretion in leydig cells. Int J Mol Sci. (2022) 23:3104. doi: 10.3390/ijms23063104
49. Zhou, J, Ji, T, He, H-N, Yin, S-Y, Liu, X, Zhang, X, et al. Induction of autophagy promotes porcine parthenogenetic embryo development under low oxygen conditions. Reprod Fertil Dev. (2020) 32:657–66. doi: 10.1071/RD19322
50. Sun, B, Ma, J, Te, L, Zuo, X, Liu, J, Li, Y, et al. Zinc-deficient diet causes imbalance in zinc homeostasis and impaired autophagy and impairs semen quality in mice. Biol Trace Elem Res. (2023) 201:2396–406. doi: 10.1007/s12011-022-03324-1
51. Li, X, Qi, J, Zhu, Q, He, Y, Wang, Y, Lu, Y, et al. The role of androgen in autophagy of granulosa cells from PCOS. Gynecol Endocrinol. (2019) 35:669–72. doi: 10.1080/09513590.2018.1540567
52. Esmaeilian, Y, Hela, F, Bildik, G, Iltumur, E, Yusufoglu, S, Yildiz, C, et al. Autophagy regulates sex steroid hormone synthesis through lysosomal degradation of lipid droplets in human ovary and testis. Cell Death Dis. (2023) 14:342. doi: 10.1038/s41419-023-05864-3
53. Yang, W, Li, L, Huang, X, Kan, G, Lin, L, Cheng, J, et al. Levels of Leydig cell autophagy regulate the fertility of male naked mole-rats. Oncotarget. (2017) 8:98677–90. doi: 10.18632/oncotarget.22088
54. Li, W-R, Chen, L, Chang, Z-J, Xin, H, Liu, T, Zhang, Y-Q, et al. Autophagic deficiency is related to steroidogenic decline in aged rat Leydig cells. Asian J Androl. (2011) 13:881–8. doi: 10.1038/aja.2011.85
55. Gong, T, Mu, Q, Xu, Y, Wang, W, Meng, L, Feng, X, et al. Expression of the umami taste receptor T1R1/T1R3 in porcine testis of: function in regulating testosterone synthesis and autophagy in Leydig cells. J Steroid Biochem Mol Biol. (2024) 236:106429. doi: 10.1016/j.jsbmb.2023.106429
56. Garza, SA-O, Chen, L, Galano, M, Cheung, G, Sottas, C, Li, LA-O, et al. Mitochondrial dynamics, Leydig cell function, and age-related testosterone deficiency. FASEB J. (2022) 36:e22637. doi: 10.1096/fj.202201026R
Keywords: ATG5, autophagy, testosterone, Leydig cells, Hezuo pig
Citation: Du H, Yan Z, Shi H and Gun S (2025) ATG5 gene regulates testosterone synthesis of testicular Leydig cells in Hezuo pig. Front. Vet. Sci. 12:1611919. doi: 10.3389/fvets.2025.1611919
Edited by:
Jose Antonio Tapia, University of Extremadura, SpainReviewed by:
José Javier López Barba, University of Extremadura, SpainMahmoud M. Abouelfetouh, Benha University, Egypt
Copyright © 2025 Du, Yan, Shi and Gun. This is an open-access article distributed under the terms of the Creative Commons Attribution License (CC BY). The use, distribution or reproduction in other forums is permitted, provided the original author(s) and the copyright owner(s) are credited and that the original publication in this journal is cited, in accordance with accepted academic practice. No use, distribution or reproduction is permitted which does not comply with these terms.
*Correspondence: Shuangbao Gun, Z3Vuc2JhbzA1NkAxMjYuY29t