 Wenchen Sun1,2
 Linglan Deng1,2Wanjie Zou1,2Panting Wei1,2Shaobin Hao1,2Huadong Wu2
 Wei Lu1,2
 Yuyong He1,2*
- 1Jiangxi Province Key Laboratory of Animal Nutrition and Feed, Engineering Research Center of Feed Development, Jiangxi Agricultural University, Nanchang, China
- 2College of Animal Science and Technology, Jiangxi Agricultural University, Nanchang, China
The influence of supplementing glycerol, vitamin C and niacinamide on the liver of growing-finishing pigs has not yet been examined. This study investigated the effect of 10% glycerol, 0.06% vitamin C and 0.05% niacinamide supplementation at single or combination on liver of growing-finishing pigs. Compared with pigs supplemented with 0% glycerol, 0% vitamin C and 0% niacinamide, pigs supplemented only with 10% glycerol had higher (p < 0.05) TNF-α concentration, partially hepatic steatosis, higher (p < 0.05) relative abundances of Escherichia_shigella, Prevotellaceae_UCG_003, Lachnospiraceae_XPB1014_group, Coprococcus, Lactococcus and Megamonas, lower (p < 0.05) solute carrier family 7 member 11 (SLC7A11) expression in liver tissue. However, pigs offered the diet with a mixture of 0.06% vitamin C and 0.05% niacinamide had higher (p < 0.05) relative abundance of Faecalibaculum and expression of SLC7A11, lower (p < 0.05) relative abundances of Staphylococcus and Clostridium_sensu_stricto_1 in liver tissue. Supplementation of 10% glycerol, 0.06% vitamin C and 0.05% niacinamide simultaneously to pigs increased (p < 0.05) the ferrous ion level, the relative abundances of Escherichia_Shigella, Lactococcus and Desulfobacterota, the expressions of gene Cryptochrome-1(CRY1) and SLC7A11, but decreased (p < 0.05) the expressions of gene C-reactive protein (CRP) and galactokinase 1 (GALK1) in liver tissue. Supplementation with 0.06% vitamin C and 0.05% niacinamide can alleviate the damage in liver of pigs fed a diet containing 10% glycerol.
1 Introduction
The liver is a very important organ in the body of animals, because it has vital functions in metabolism, secretion, detoxification and immunity (1–3). Failure of hepatic cells to functions is often associated with the inappropriate intake of ingredients in the diet by the development of steatosis, inflammation, fibrosis, or poisoning in liver tissue, which are harmful to the health and performance of animals (4–8).
Glycerol addition can enhance food palatability (9, 10) as well as provide energy (11). It is reported that the metabolism of glycerol largely occurs in liver and it can induce anatomical, physiological, and biochemical changes in the liver when glycerol is included in the food (12, 13). Currently glycerol is one of the most promising ingredients in formulating the diet of animals, owing to it can be used as an alternative energy source to corn in the diet (14), and also some studies reported that inclusion of glycerol to the diet can improve animal performance, meat quality and gut health by sparing the catabolism of dietary amino acids (15–17). However, information about the effect of long-term glycerol intake on the liver of animals is scarce.
Niacinamide and vitamin C are often added to the diet of animals. Niacinamide serves as the precursor of coenzyme I [nicotinamide adenine dinucleotide (NAD)+/NADH] and coenzyme II (NADP+/NADPH) with the participation in glycolysis, tricarboxylic acid cycle, fatty acid synthesis and oxidation, cholesterol synthesis, and gluconeogenesis in redox reaction (18, 19). It also plays a crucial role in lipid metabolism, adipocyte differentiation, post-transcriptional modification, and inflammation inhibition in non-redox reactions (18, 20, 21). Dietary administration with niacinamide from 20 to 640 mg/kg dry matter (DM) decreased the contents of glucose and triglyceride, as well as fat accumulation in liver (1). However, administering niacinamide at a dose of 500 mg/kg body weight (BW) to healthy animals induced hepatotoxicity (22). Vitamin C is a strong antioxidant and it can prevent lipid peroxidation, necrosis, inflammation and fibrosis of liver by scavenging free radicals (23, 24). In addition, Vitamin C can improve meat color by inhibiting phospholipid oxidation and reactive oxygen formation, and increase marbling score and meat quality by enhancing adipocyte differentiation (25, 26). It is reported that addition of vitamin C at a dose of 10 g/steer * d to Angus-cross steers receiving the high S diet significantly increased marbling score and backfat thickness when compared to steers without vitamin C supplementation (27). Vitamin C also has regulatory effect on proinflammatory cytokine secretion in lipopolysaccharide (LPS)-challenged blood mononuclear cells of healthy human (28). Vitamin C administration displayed some protective effects on LPS-induced liver injury with a level at 200 mg/kg BW (29) and reversed hepatotoxicity at 5 mg/mL when combined with niacinamide (30).
Long-term consumption of high level of energy-generating ingredients such as fat, sugar and glycerol has the risks to deteriorate liver functions (31). Niacinamide and vitamin C are the promising candidates in ameliorating high energy consumption-induced liver diseases. Our previous study indicated that addition of 10% glycerol together with 0.06% vitamin C and 0.05% niacinamide significantly increased the muscle redness of longissimus dorsi of finishing pigs crossbred by Duroc, Large White and Landrace (DLL). However, the potential effects of dietary supplementation with 10% glycerol, 0.06% vitamin C and 0.05% niacinamide on the liver and pancreas of DLL pigs are still unclear. In this study, conventional and omics approaches were performed to explore the effects of dietary supplementation with 10% glycerol, 0.06% vitamin C and 0.05% niacinamide on histomorphology, microbiome and trancriptome of liver, and the findings of this study will provide a novel insight into the healthy production of pigs fed glycerol-supplemented diets.
2 Materials and methods
2.1 Feeding experiment
A total of 84 weaned piglets (20.35 ± 2.14 kg, Duroc × Large White × Landrace) were allotted to groups A (0% glycerol+0% vitamin C + 0% niacinamide), B (10% glycerol), C (0.06% vitamin C + 0.05% niacinamide), and D (10% glycerol+0.06% vitamin C + 0.05% niacinamide) at random, each group had three pens and each pen had 7 piglets. All piglets were given access to feed and water ad libitum during the 103-day feeding experiment, and the composition and nutrient level of diet are listed in Table 1 (15). All experimental procedures were conducted in accordance with the Guidelines in the Care and Use of Animals and were approved by the Ethics Committee of Jiangxi Agricultural University (JXAULL-202215).
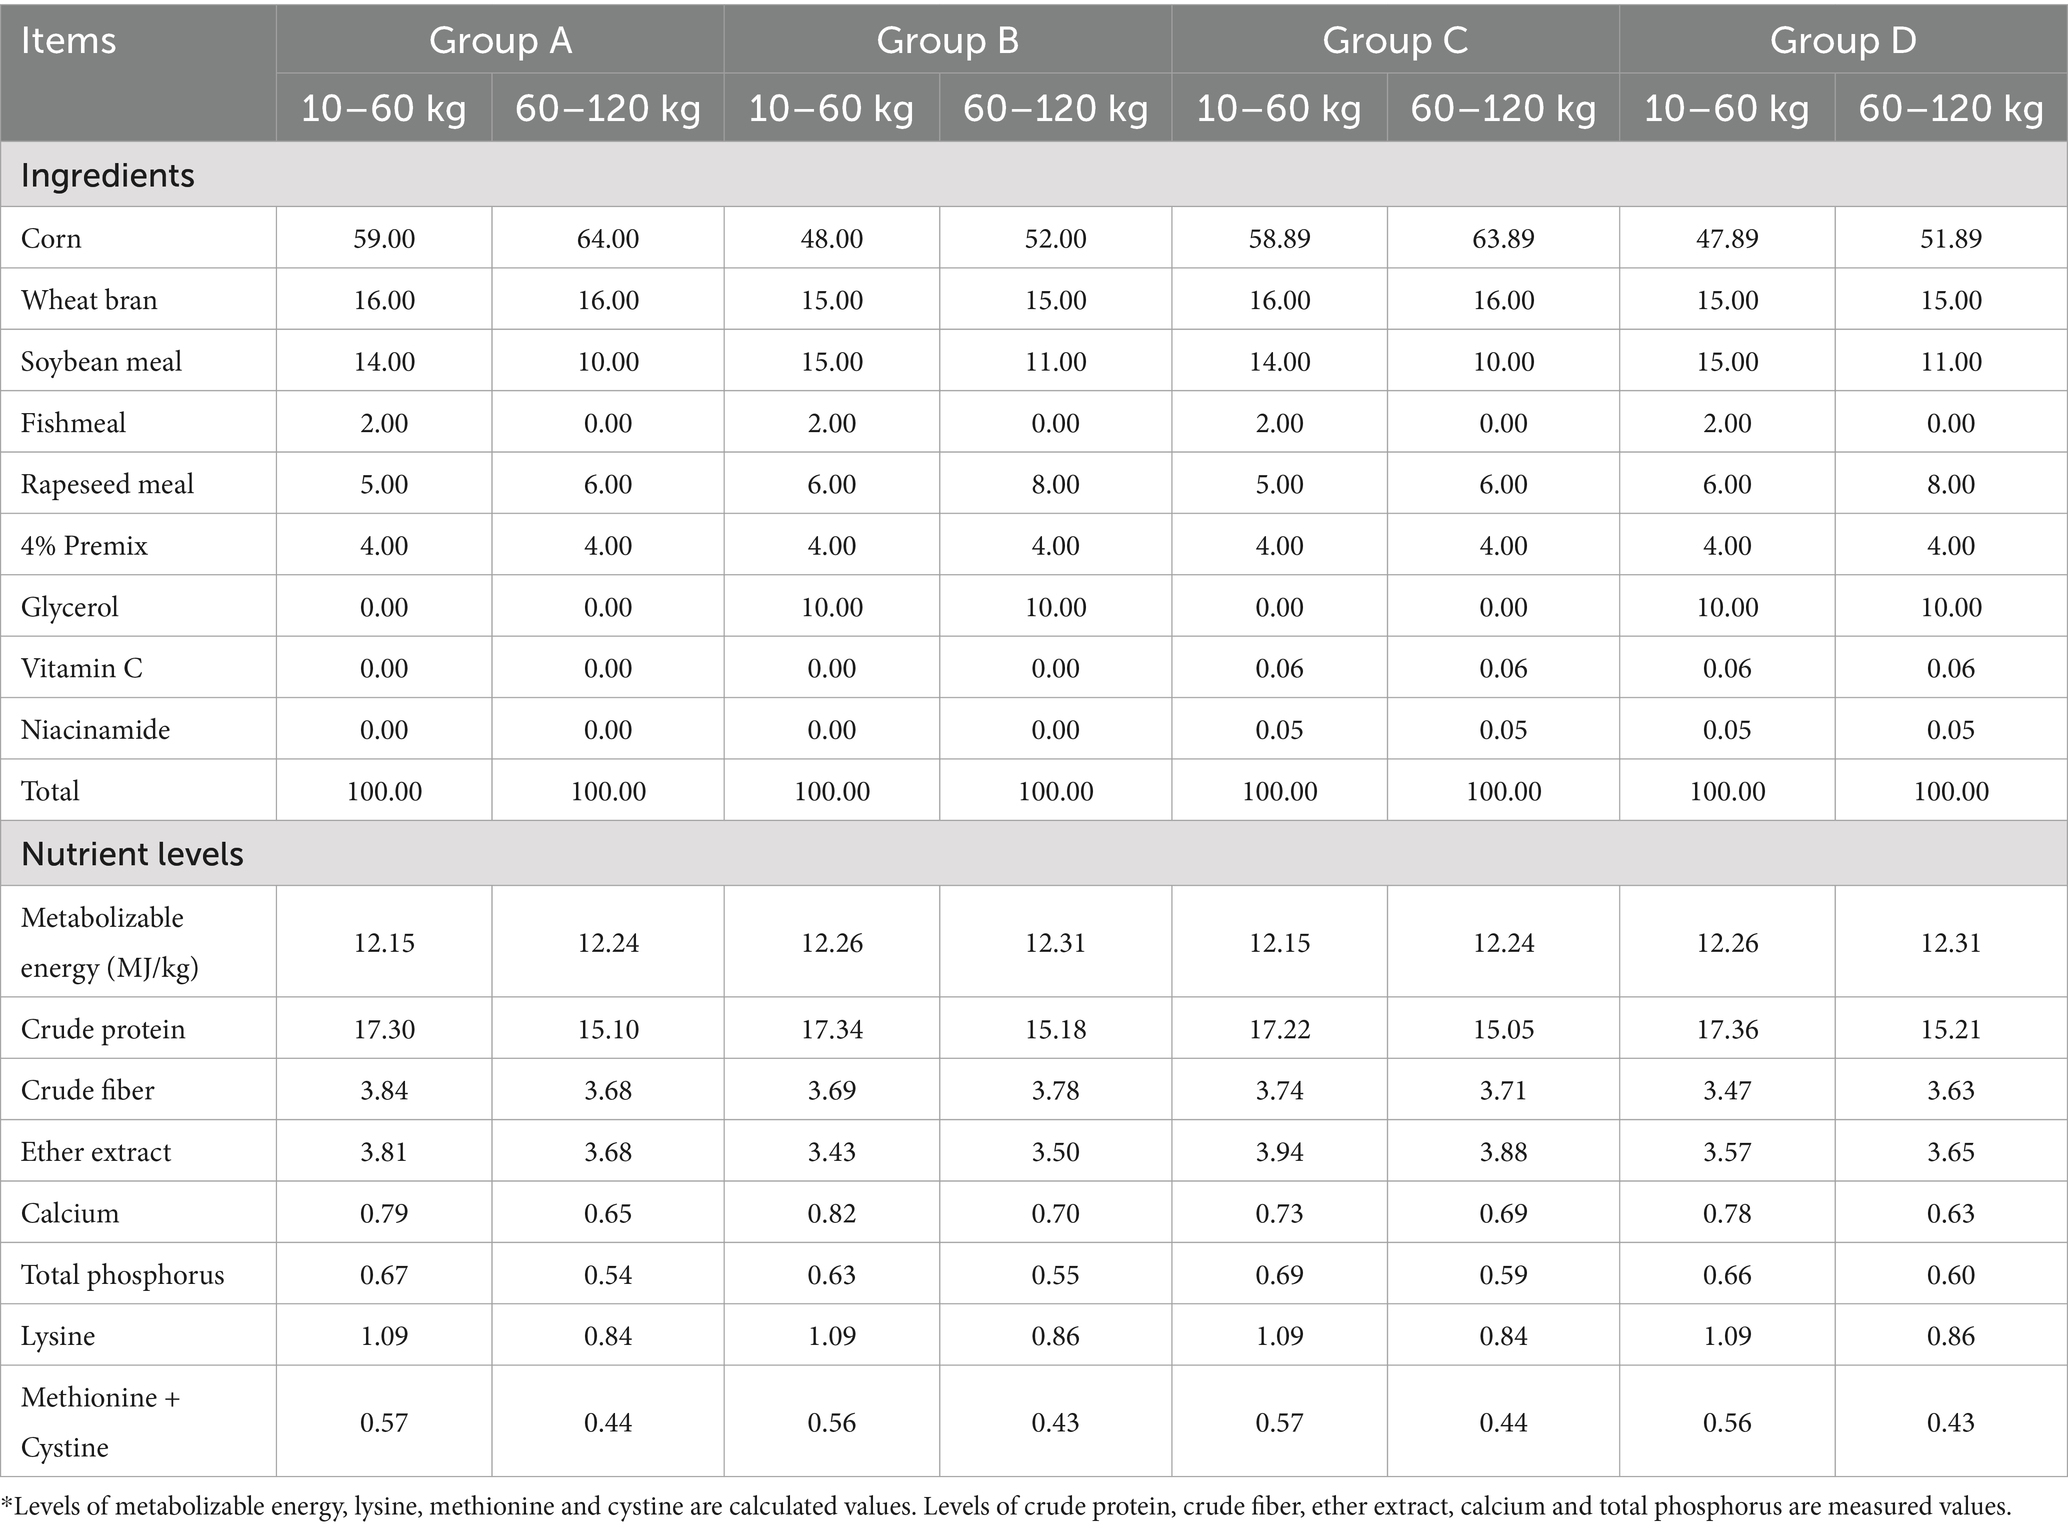
Table 1. Diet composition and nutrient level* (%, on dry matter basis).
2.2 Sampling of liver tissue
A total of 3 pigs were randomly selected from each pen (1 pig/pen) for each group, slaughtered after 12 h of fasting via bleeding with electrical stimulus, then, livers were taken out. After weighing, samples were taken from the left external lobe of liver. The average bodyweight of pigs slaughtered in each group was 106.17 ± 8.39 kg (group A), 106.00 ± 1.41 kg (group B), 102.33 ± 10.21 kg (group C), and 109.17 ± 7.53 kg (group D), respectively.
2.3 Fat measurement of liver tissues
Samples of liver were freeze-dried overnight at −50°C, then, ground into powder with sieve (100 μm). The crude fat content of samples was determined using Soxhlet extraction.
2.4 Histomorphological observation
Liver samples were fixed firstly in 4% paraformaldehyde overnight at 4°C, dehydrated and embedded with paraffin, then sliced into sections with a thickness of 4 mm. Sections were stained with hematoxylin and eosin and finally observed by light microscopy (NIKON ECLIPSE E100, Japan).
2.5 Oil-red O staining
Frozen samples were embedded in optimal cutting temperature compound (Sakura Finetek Japan Co., Ltd., Tokyo), sliced into section with a thickness of 10 μm using a cryostat microtome (HM525 NX U, Thermo Scientific, United States), and stained with oil red O. Images were obtained by a NanoZoomer S360 Digital Slide Scanner C13220-01 (HAMAMATSU PHOTONICS, Hamamatsu city, Japan), the image processing software Image J FIJI (open source, NIH, Bethesda, MD, United States) was used to measure the area of lipid droplets. The IntDen of the lipid droplets regions in sections were calculated by using Image J Fiji. The relative area of lipid droplets = the average IntDen of each treatment group/the average IntDen of the control group.
2.6 Measurement of iron ions and inflammatory markers in liver tissues
The levels of ferric ion and ferrous iron in the liver samples were determined with a ferrozine-based colorimetric assay (32). Concentrations of interleukin 10 (IL-10), tumor necrosis factor-α (TNF-α) and C-reactive protein (CRP) in the liver samples were determined using ELISA kits (Shanghai Enzyme-linked Biotechnology Co. Ltd., Shanghai, China) following the manufacturer’s protocols.
2.7 16S rDNA sequencing
Bacterial genomic DNA was extracted from liver samples using the CTAB (cetyl trimethyl ammonium bromide) method (33). The extracted DNA was quantified by a NanoDrop 1,000 spectrophotometer (Thermo Fisher Scientific, Pittsburgh, PA, United States) and stored at −20°C for use. The primers 341F (5’-CCTAYGGGRBGCASCAG-3′) and 806R (5’-GGACTACNNGGGTATCTAAT-3′) were used to amplify the qualified DNA of samples by targeting the V3-V4 regions. PCR amplifications were carried out in 30 μL reactions containing 15 μL of Phusion High-Fidelity PCR Master Mix, 0.2 μM of forward primer, 0.2 μM of reverse primer and 10 ng of template DNA with the following conditions: initial denaturation at 98°C for 1 min, followed by 30 cycles of denaturation at 98°C for 10 s, annealing at 50°C for 50 s, elongation at 72°C for 30 s, and finally, 72°C for 5 min (34).
The polymerase chain reaction (PCR) products were purified using magnetic beads. After purification, the PCR products were quantified with Qubit 3.0 Fluorometer (Invitrogen, United States) to generate amplicon libraries. The libraries were pooled in equimolar amounts and paired-end sequenced (PE250) at Novogene Co., Ltd. (Beijing, China) on an Illumina NovaSeq 6,000 platform (Illumina, San Diego, CA, United States). Bioinformatics analysis was conducted according to a previously published method (34). Raw data of 16S rDNA sequencing have been submitted to the database of Sequence Read Archive of the National Center for Biotechnology Information with the BioProject ID PRJNA1164983.
2.8 RNA sequencing and data analysis
Trizol kit (Invitrogen, Carlsbad, United States) was used to extract the total RNA of liver samples according to the manufacturer’s instructions. The integrity of isolated RNA was assayed using the RNA Nano 6,000 Assay Kit on the 2,100 Bioanalyzer (Agilent Technologies, Palo Alto, United States). RNA-Seq libraries were constructed using NEBNext® Ultra™ RNA Library Prep Kit for Illumina® (NEB, United States) according to the manufacturer’s instructions. After quality inspection through touch q-PCR system CFX96 (BIO-RAD, CA, United States), the prepared RNA-Seq libraries were sequenced on NovaSeq 6,000 platform (Illumina, San Diego, CA, United States) by Novogene Co., Ltd. (Beijing, China). The raw reads were filtered and trimmed using fastp (version 0.19.7). The obtained clean reads were aligned to reference genome using HISAT2. Fragments Per Kilobase of transcript per Million mapped fragments (FPKM) with Cufflinks were used to calculate the expression levels of each gene, and the read count of each gene were generated by HTSeq. DESeq 2 was used to identify the differentially expressed genes (DEGs) with p-value < 0.05 and |log2 Fold change (logFC)| > 1. KEGG pathway enrichment analysis was carried out to explore the functions of DEGs. Raw data of RNA sequencing have been submitted to the database of Sequence Read Archive of the National Center for Biotechnology Information with the BioProject ID PRJNA1055880.
2.9 Reverse transcription-quantitative polymerase chain reaction
Total RNA of liver samples was isolated using TransZol Up Plus RNA Kit (Transgen, China) and evaluated for the concentration and quality of RNA using NanoDropND1000 Spectrophotometer (Thermo Fisher Scientific, Madison, WI). The qualified RNA samples were reverse transcribed with TransScript Uni All-in-One First-Strand cDNA Synthesis SuperMix for qPCR (TransGen Biotech, Beijing, China). PerfectStart Green qPCR SuperMix (TransGen Biotech, Beijing, China) was used for qPCR using an ABI QuantStudio 5 systems (Thermo Fisher Scientific, United States). The primers information for qRT-PCR is listed in Table 2 and glyceraldehyde 3-phosphate dehydrogenase (GAPDH) served as the reference gene. The 2-ΔΔCt data method was used for analysis.
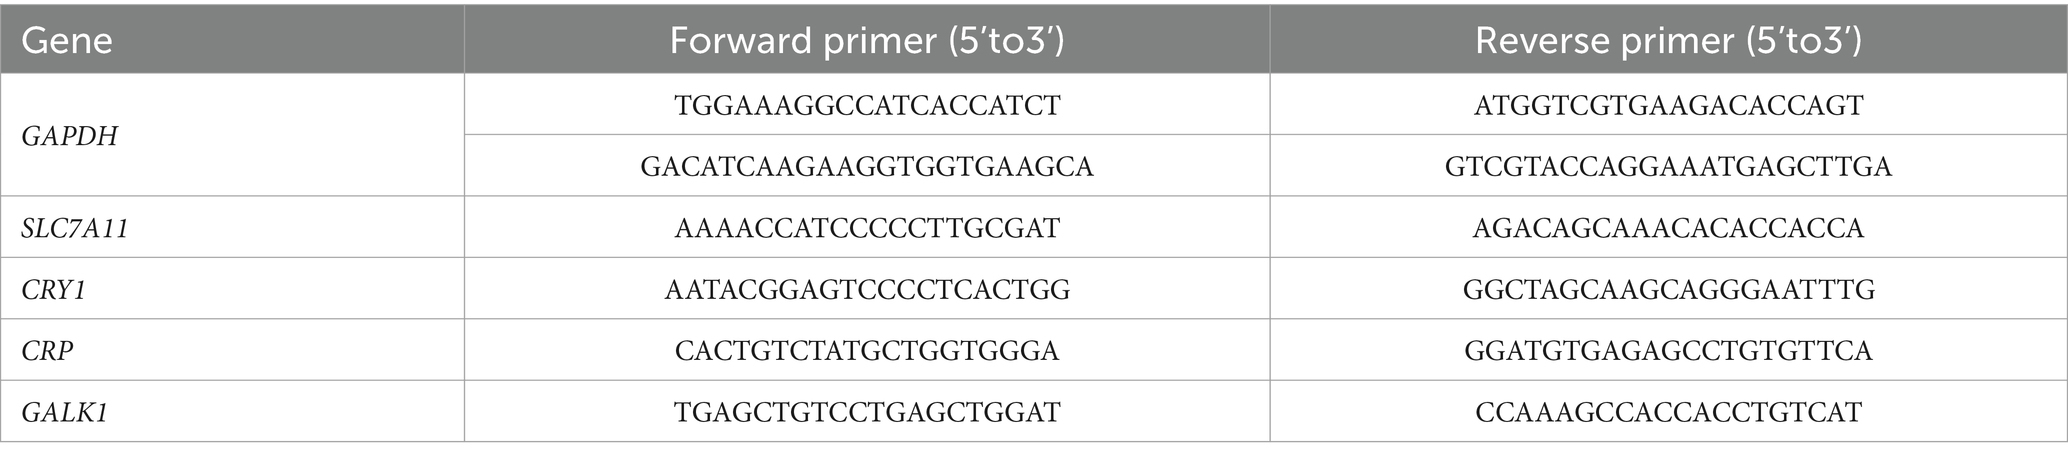
Table 2. Sequences of primers for qPCR.
3 Results
3.1 Change of liver index, iron ions and inflammatory markers
Data in Table 3 indicated that pigs from group C and D had the highest and the lowest liver index respectively, but no significant difference was found in liver index when compared one group to the other groups (p > 0.05). In addition, glycerol, the mixture of vitamin C and niacinamide or interaction between glycerol and mixture of vitamin C and niacinamide did not impose significant effect on liver index of pigs from each group (p > 0.05).
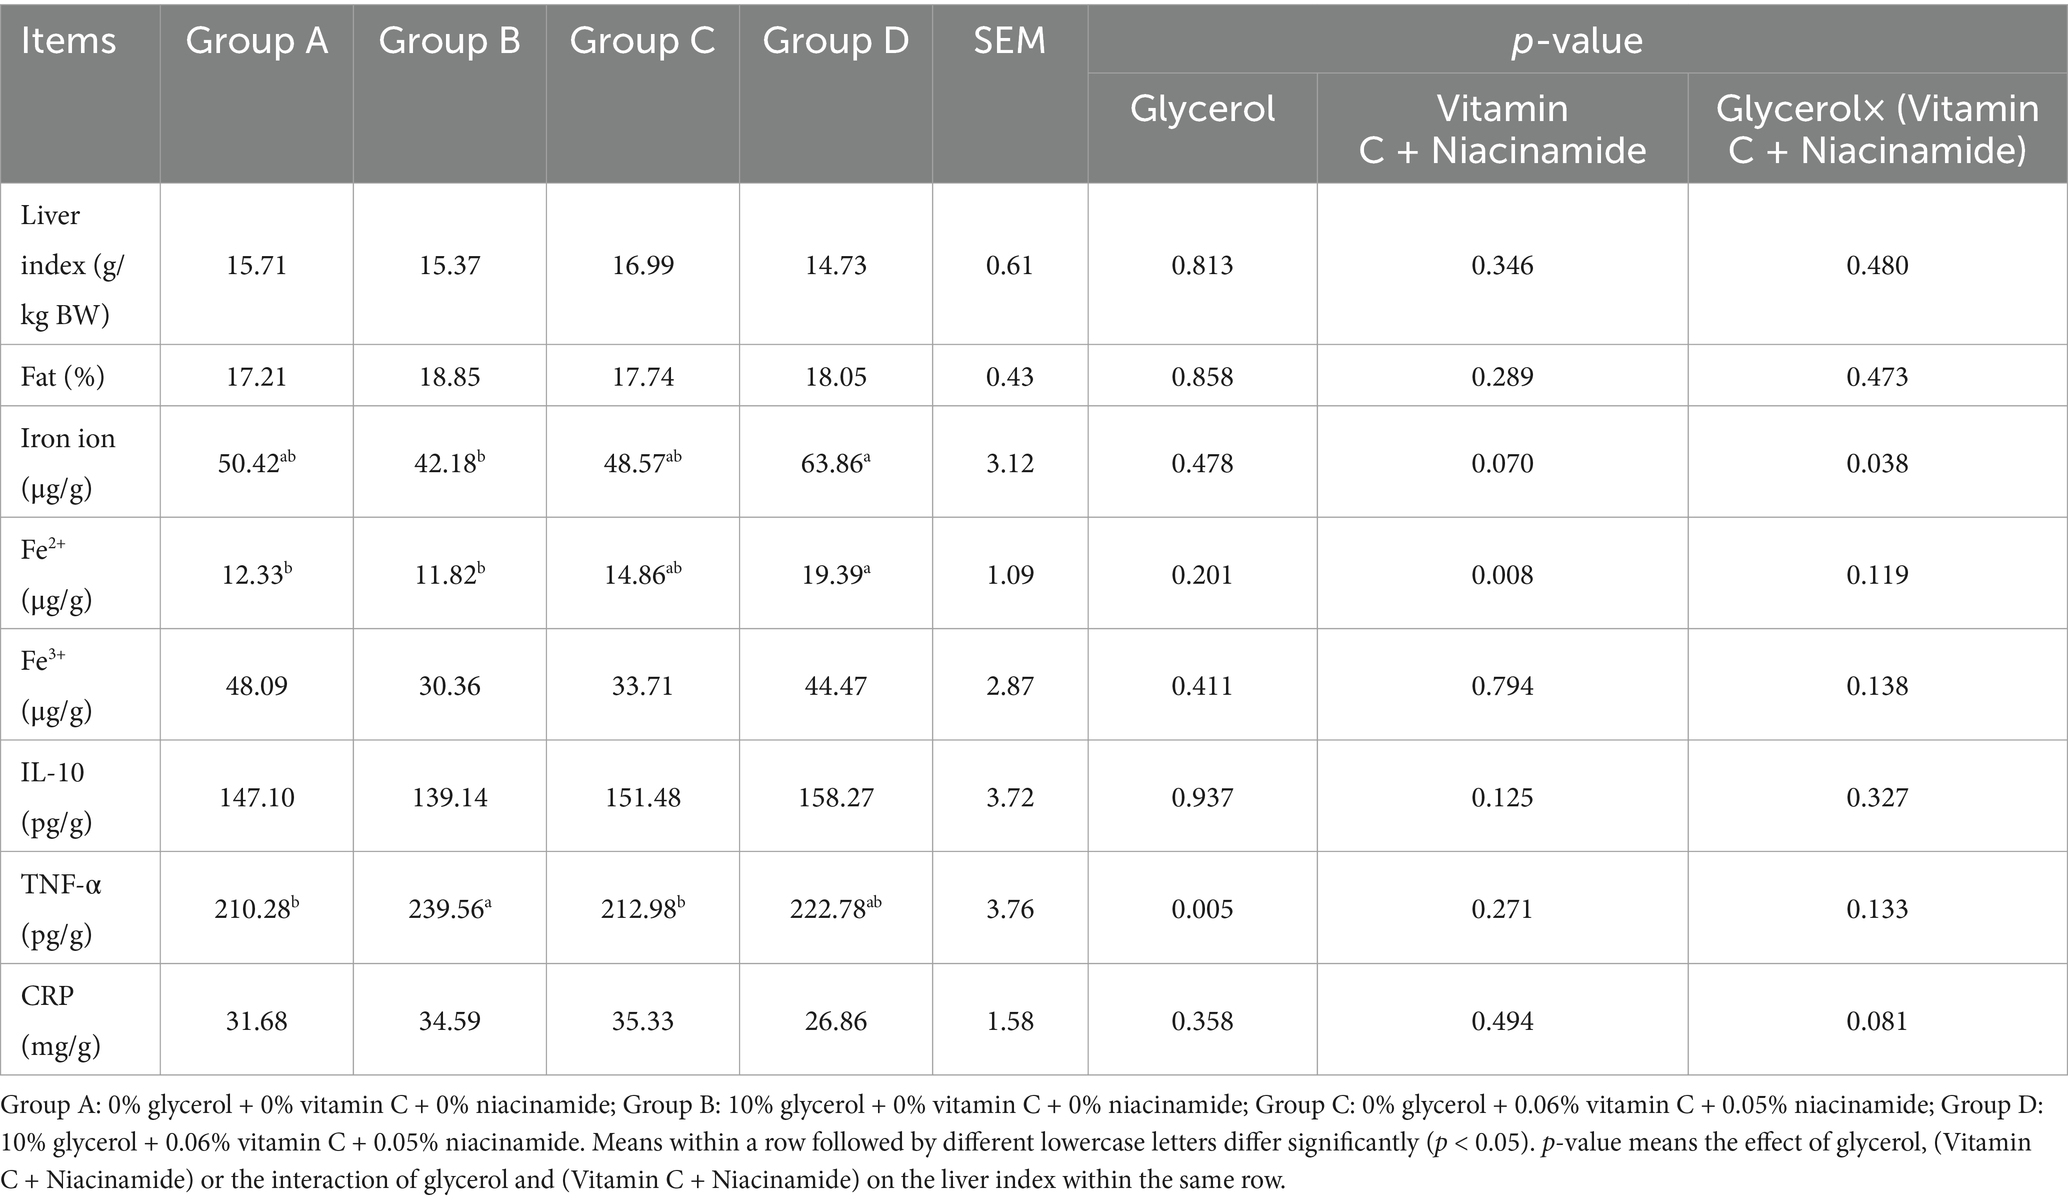
Table 3. Changes of liver index, iron ion and inflammatory markers when supplemented different levels of glycerol, vitamin C and niacinamide to pig.
Pigs from group B had a lower level of total iron ion in liver than pigs from groups A, C and D (p < 0.05), respectively. Pigs from group D had higher Fe2+ level in liver than pigs from groups A and B (p < 0.05), respectively. The TNF-α levels of liver of pigs from groups B and D were higher than that of pigs from groups A and C (p < 0.05), respectively.
3.2 Histomorphological alterations in liver
Results of HE staining showed that the structures of liver lobules of pigs from different treatment groups were clear and intact (Figure 1). Pigs from group B presented partially hepatic steatosis (black arrow) along with small vacuoles in the cytoplasm. Pigs from group D also developed a small amount of hepatic steatosis (black arrow), but the degree of steatosis in liver of pigs from group D was less than that of pigs from group B. No obvious changes were observed in liver histomorphology of pigs between groups A and C. Addition of glycerol or/and the mixture of vitamin C and niacinamide had different effects on the accumulation of lipid droplets in hepatocytes (Figure 2), and the data of oil-red staining in Figure 3 revealed that the significant difference in relative area of lipid droplets was only found in the livers of pigs between group B and group C (p < 0.05).
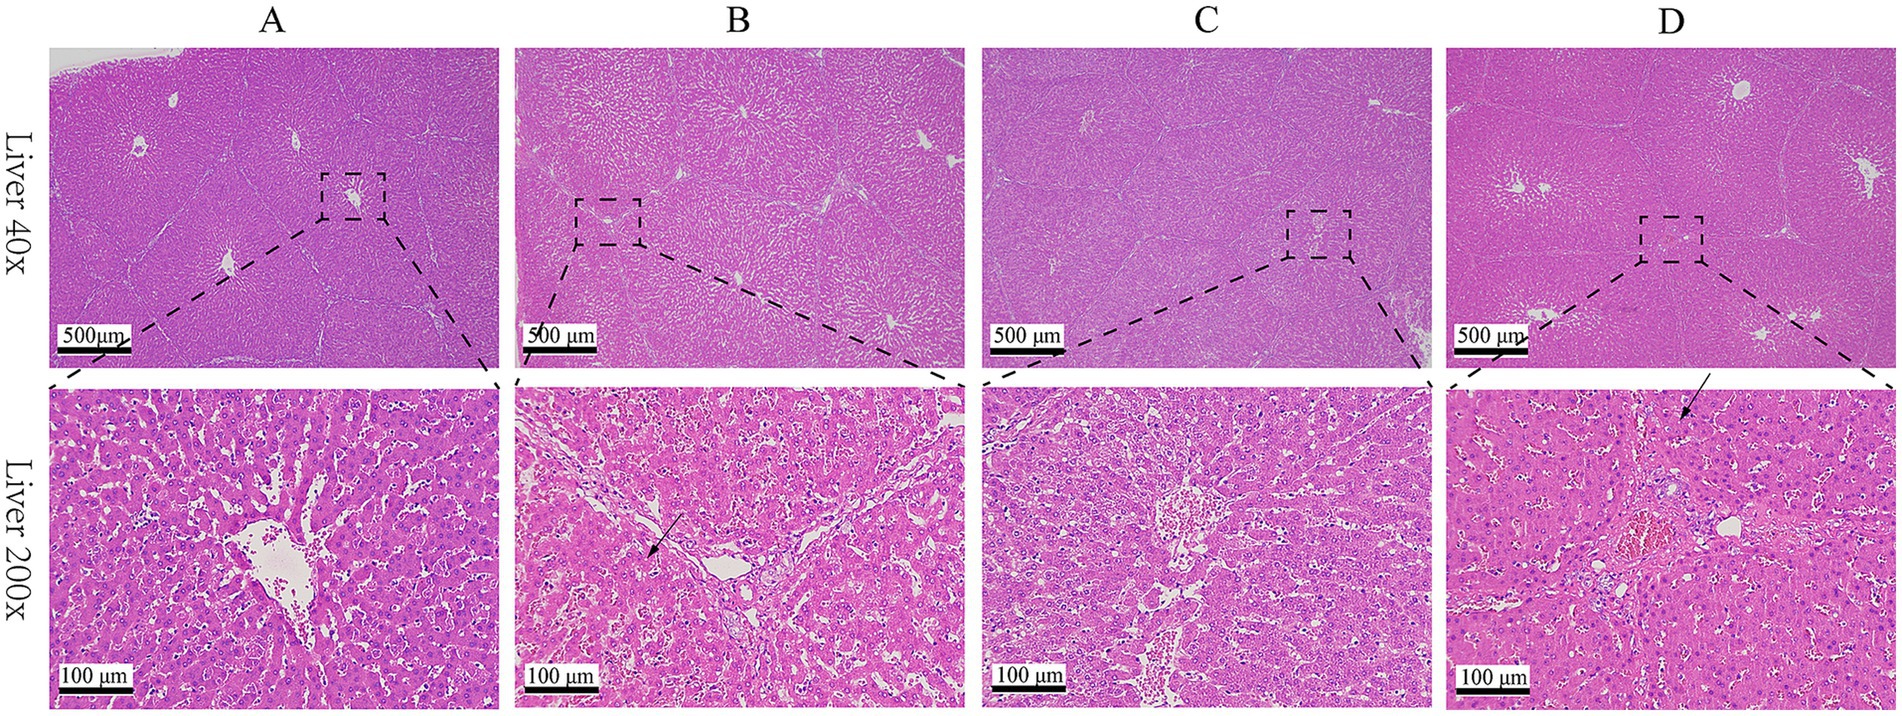
Figure 1. HE staining of liver tissue. (A) 0% glycerol + 0% vitamin C + 0% niacinamide. (B) 10% glycerol. (C) 0.06% vitamin C + 0.05% niacinamide. (D) 10% glycerol + 0.06% vitamin C + 0.05% niacinamide.
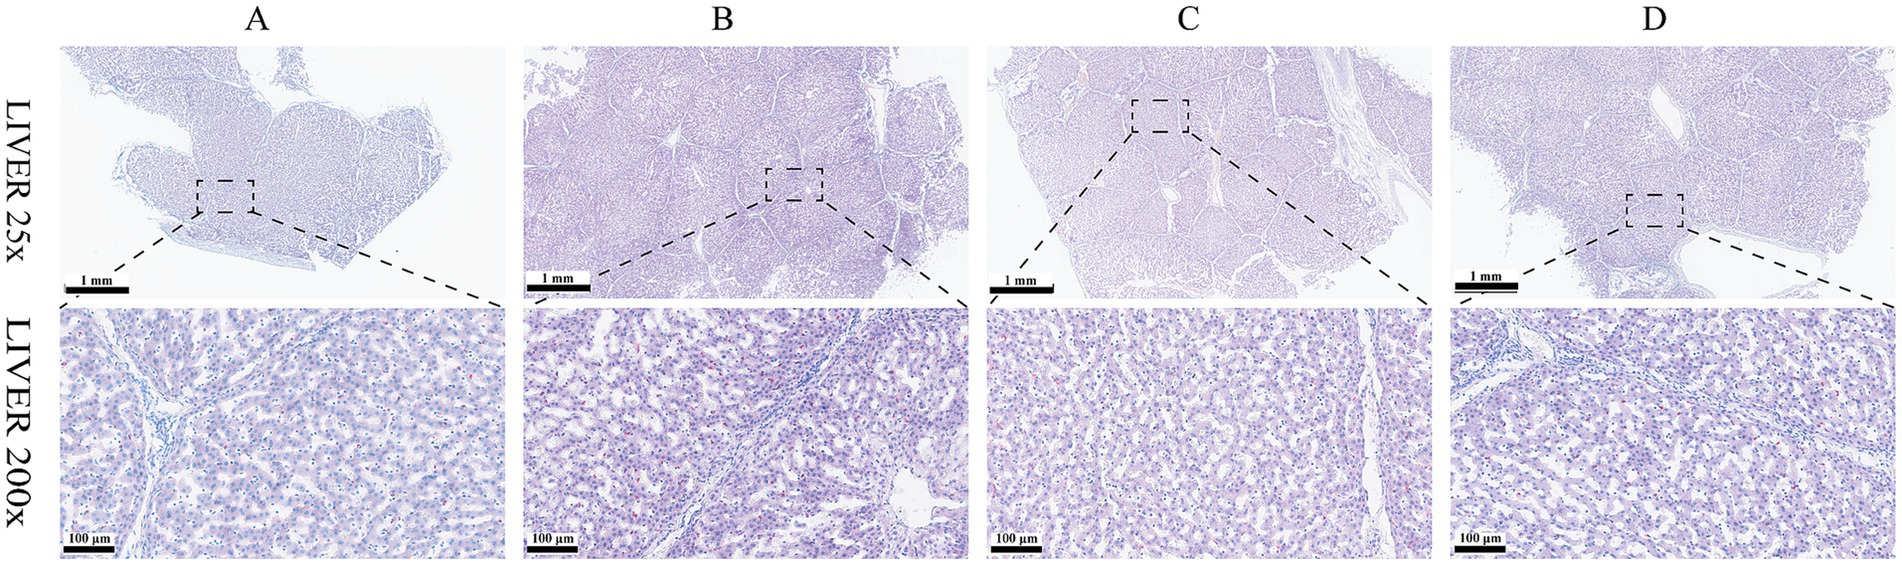
Figure 2. Oil-red O staining of liver tissue. (A) 0% glycerol + 0% vitamin C + 0% niacinamide. (B) 10% glycerol. (C) 0.06% vitamin C + 0.05% niacinamide. (D) 10% glycerol + 0.06% vitamin C + 0.05% niacinamide.
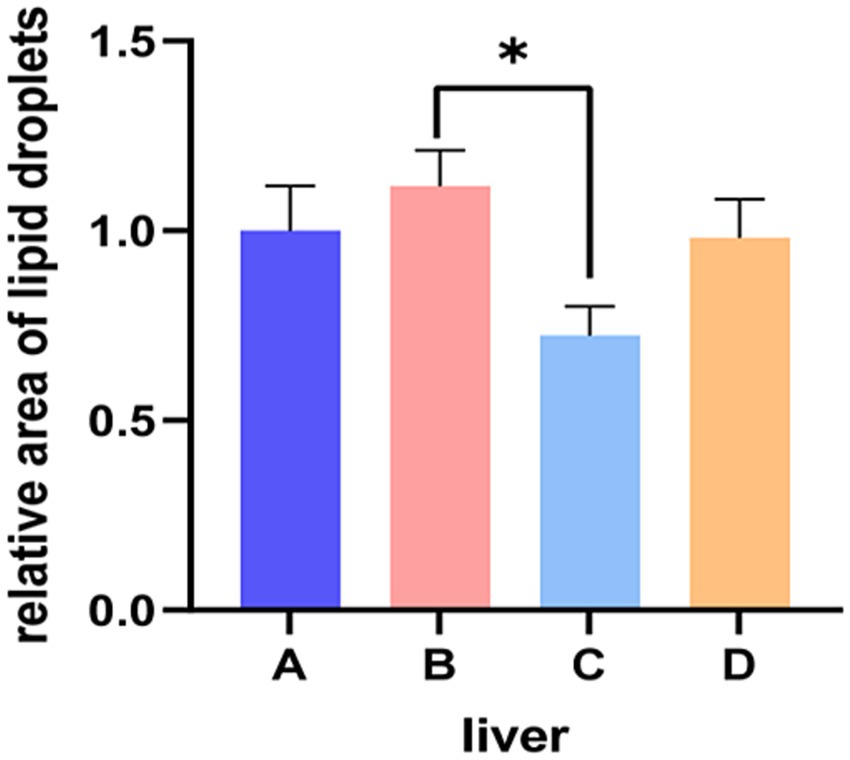
Figure 3. Relative area of lipid droplets in liver tissue. A, 0% glycerol + 0% vitamin C + 0% niacinamide. B, 10% glycerol. C, 0.06% vitamin C + 0.05% niacinamide. D, 10% glycerol + 0.06% vitamin C + 0.05% niacinamide. *p = 0.022.
3.3 Diversity and composition of bacteria in the liver of pigs
Figure 4 illustrated the alpha diversity indexes, and there were no significant differences among four groups in alpha diversity indexes of liver bacterial community of pigs (p > 0.05), but Chao 1 index numerically decreased (p > 0.05) when supplementing 0.06% vitamin C-0.05% niacinamide mixture or 0.06% vitamin C-0.05% niacinamide-10% glycerol mixture to growing-finishing pigs. The beta diversity analysis was performed to investigate the structural variation of bacterial communities. The PCoA results in Figure 5 indicated that there were no obvious intragroup aggregation except for samples in group B, and the separation between groups was not statistically significant. The PCo1 and PCo2 explained 55.25 and 25.96% of the differential contribution rate, respectively.
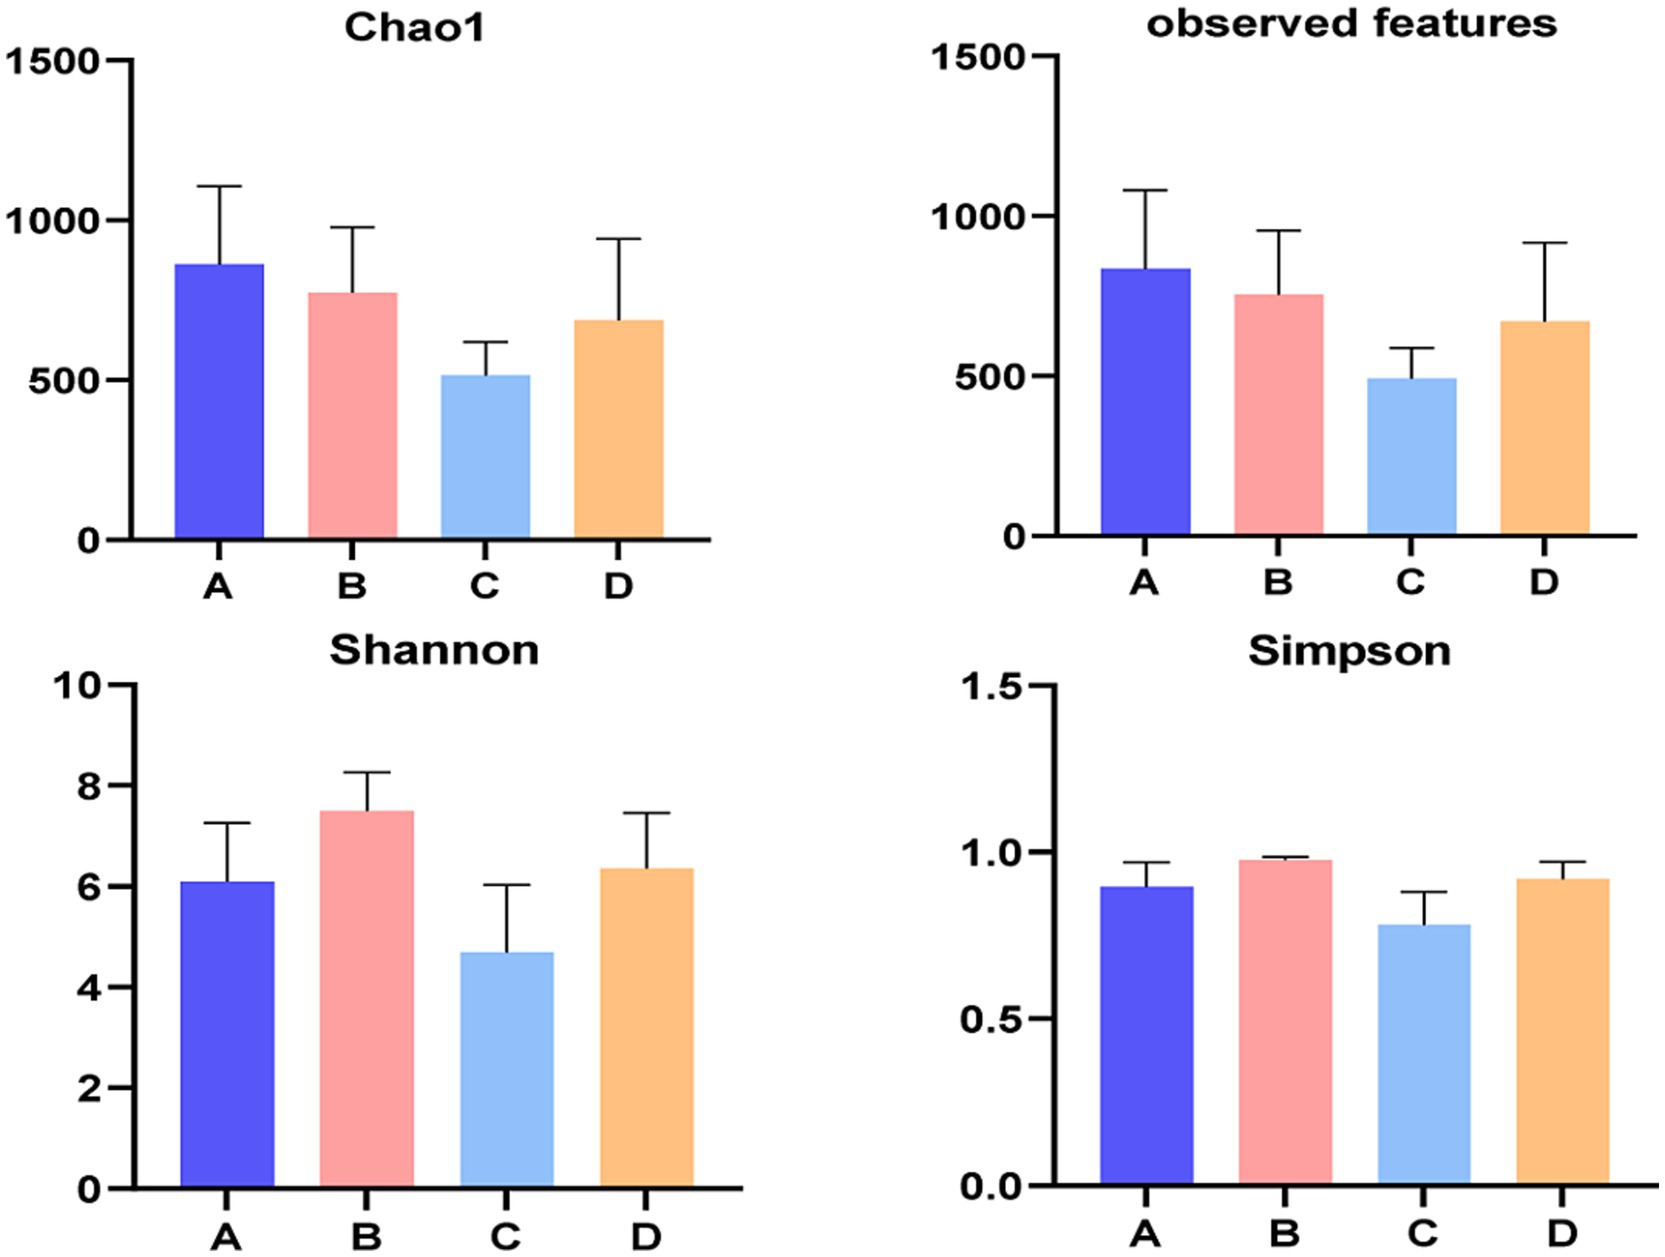
Figure 4. Alpha diversity of liver bacteria. A, 0% glycerol + 0% vitamin C + 0% niacinamide. B, 10% glycerol. C, 0.06% vitamin C + 0.05% niacinamide. D, 10% glycerol + 0.06% vitamin C + 0.05% niacinamide.
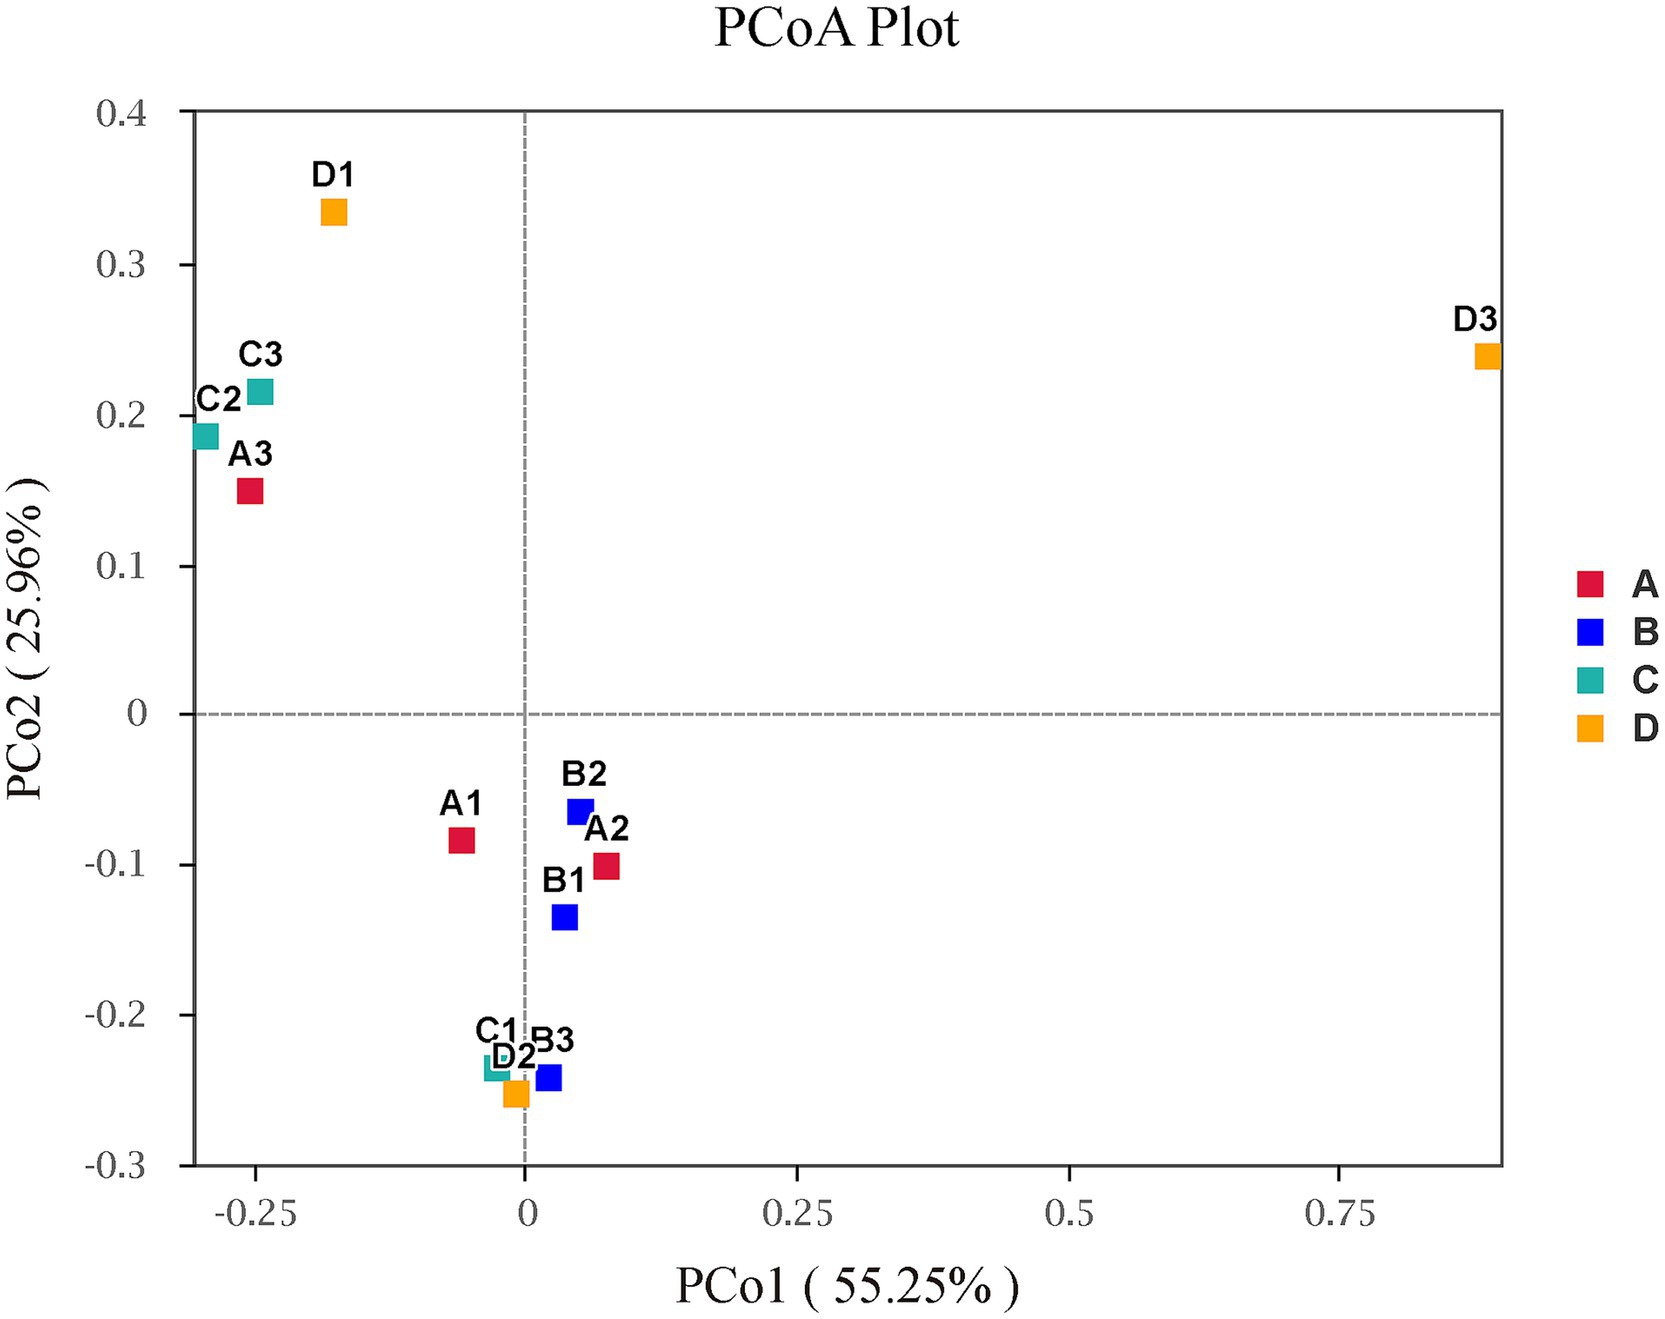
Figure 5. Principal coordinate analysis (PCoA) on beta-diversity with weighted-unifrac. Plots of the principal coordinate analysis (PCoA) of bacteria in liver. Samples in the same group are represented by the same color and shape. The x-axis and y-axis represent the first and second primary coordinates, respectively. The percentage in round brackets of the axis represents the proportion of the sample distance matrix that the corresponding axis can interpret. The distance between sample points indicates the similarity of bacterial communities in the samples, and the closer the sample points are to each other, the more similar the two samples are. A, 0% glycerol + 0% vitamin C + 0% niacinamide. B, 10% glycerol. C, 0.06% vitamin C + 0.05% niacinamide. D, 10% glycerol + 0.06% vitamin C + 0.05% niacinamide.
Figure 6 showed that at phylum level, the dominant bacteria in liver of four treatment groups were Firmicutes, Proteobacteria, Bacteroidota and Actinobacteriota. The relative abundances of these dominant bacteria in livers of pigs from groups A, B, C and D were 38.30, 54.47, 19.80 and 35.69%, respectively, for Firmicutes, were 36.21, 26.83, 49.08 and 27.52%, respectively, for Proteobacteria, were 14.31, 9.51, 25.03 and 19.73%, respectively, for Bacteroidota, were 7.23, 6.30, 3.20 and 5.50%, respectively, for Actinobacteriota. The first dominant phylum bacteria in livers were Firmicutes for pigs from groups A, B and D, but were Proteobacteria for pigs from group C. At genus level, the dominant bacteria in livers were Stenotrophomonas (20.60%), Chryseobacterium (7.31%), Staphylococcus (6.37%), Clostridium_sensu_stricto_1 (5.93%), Terrisporobacter (4.68%) and Delftia (3.04%) for pigs from group A, were Streptococcus (6.81%), Salinivibrio (6.06%), Clostridium_sensu_stricto_1 (4.83%), Terrisporobacter (4.61%), Escherichia-Shigella (4.54%) and Stenotrophomonas (4.35%) for pigs from group B, were Stenotrophomonas (36.26%), Chryseobacterium (11.19%), Delftia (5.43%), Salinivibrio (2.34%), Blautia (1.67%) and Streptococcus (1.37%) for pigs from group C, were Stenotrophomonas (14.41%), Chryseobacterium (5.99%), Delftia (3.54%), Streptococcus (3.21%), Clostridium_sensu_stricto_1 (3.18%) and Salinivibrio (2.37%) for pigs from group D. The first dominant genus bacteria in livers were Stenotrophomonas for pigs from group A, C and D, but were Streptococcus for pigs from group B.
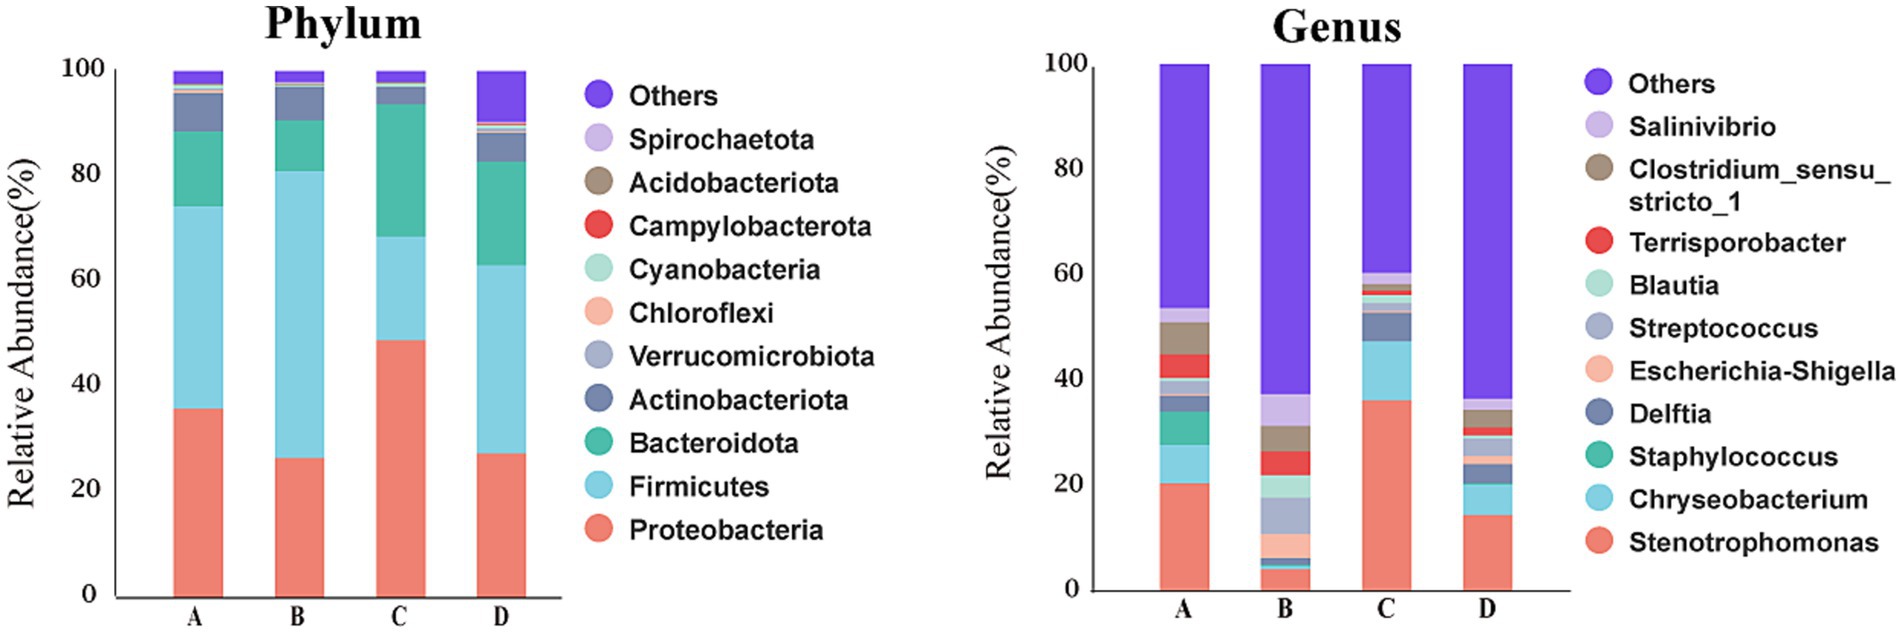
Figure 6. Bacterial composition of liver at different taxa levels. A, 0% glycerol + 0% vitamin C + 0% niacinamide. B, 10% glycerol. C, 0.06% vitamin C + 0.05% niacinamide. D, 10% glycerol + 0.06% vitamin C + 0.05% niacinamide.
3.4 Differential bacterial composition in the liver of pigs
LEfSe analysis was performed to discriminate the differential bacteria with significant difference between groups with the standards of LDA score > 2.0 and p < 0.05. Results in Figure 7 presented that compared with pigs from group A, pigs from group B had higher (p < 0.05) relative abundances of genus Escherichia_shigella, Bifidobacterium, Eubacterium_hallil_group, Coprococcus, Prevotellaceae_UCG_003, Lachnospiraceae_XPB1014_group, Lactococcus and Megamonas, lower (p < 0.05) relative abundances of genus hgcl_clade, Enhydrobacter, Acidovorax, Cellulomonas, Planococcaceae and phylum Chloroflexi in liver. Pigs from group C had higher (p < 0.05) relative abundances of genus Faecalibaculum, Saccharimonadaceae and phylum Patescibacteria, lower (p < 0.05) relative abundances of genus Malaciobacter, Candidatus_Soleaferrea, Facklamia, Psychrobacter, Deinococcus, Eubacterium_ruminantium_gn, Rothia, UCG_005, Clostridium_sensu_stricto_1, Staphylococcus, and phylum Planctomycetes, Deinococcota in livers than pigs from group A. The relative abundances of genus Escherichia_Shigella, Ruminococcus, Unidentified Chloroplast, Desulfovibrio, Lactococcus, Acetitomaculum and phylum Desulfobacterota were higher (p < 0.05) but the relative abundances of genus Malaciobacter, Psychrobacter, Cellulomonas, Blastococcus, Micrococcus, Turicibacter were lower (p < 0.05) when compared pigs from group D with pigs from group A. Compared with pigs from group B, pigs from group C had higher (p < 0.05) relative abundances of genus Mitsuokella and phylum Bacteroidota, but lower (p < 0.05) relative abundances of genus Malaciobacter, Megamonas, Prevotellaceae_UCG_004, Succinivitrio, Prevotellaceae_UCG_003, Collinsella, Pantoea, Coprococcus, Monoglobus, Bifidobacterium, Christensenellaceae_R_7_group, and phylum Planctomycetota, Actinobacteriota and Firmicutes in liver. Pigs from group D had higher (p < 0.05) relative abundances of genus Unidentified_Chlorofleil, Olsenella and phylum Cyanobacteria and Chloroflexl, but lower (p < 0.05) relative abundances of genus Malaclobacter, Turicibacter, Succinivibrio, and phylum Firmicutes in livers than pigs from group B. Pigs from group D had higher (p < 0.05) relative abundances of genus Clostridium_sensu_stricto_1, Ruminococcus, Collinsella, unidentified_Chloroplast, Desulfovibrio, phylum Chloroflexi, lower (p < 0.05) relative abundances of genus Turicibacter in liver than pigs from group C.
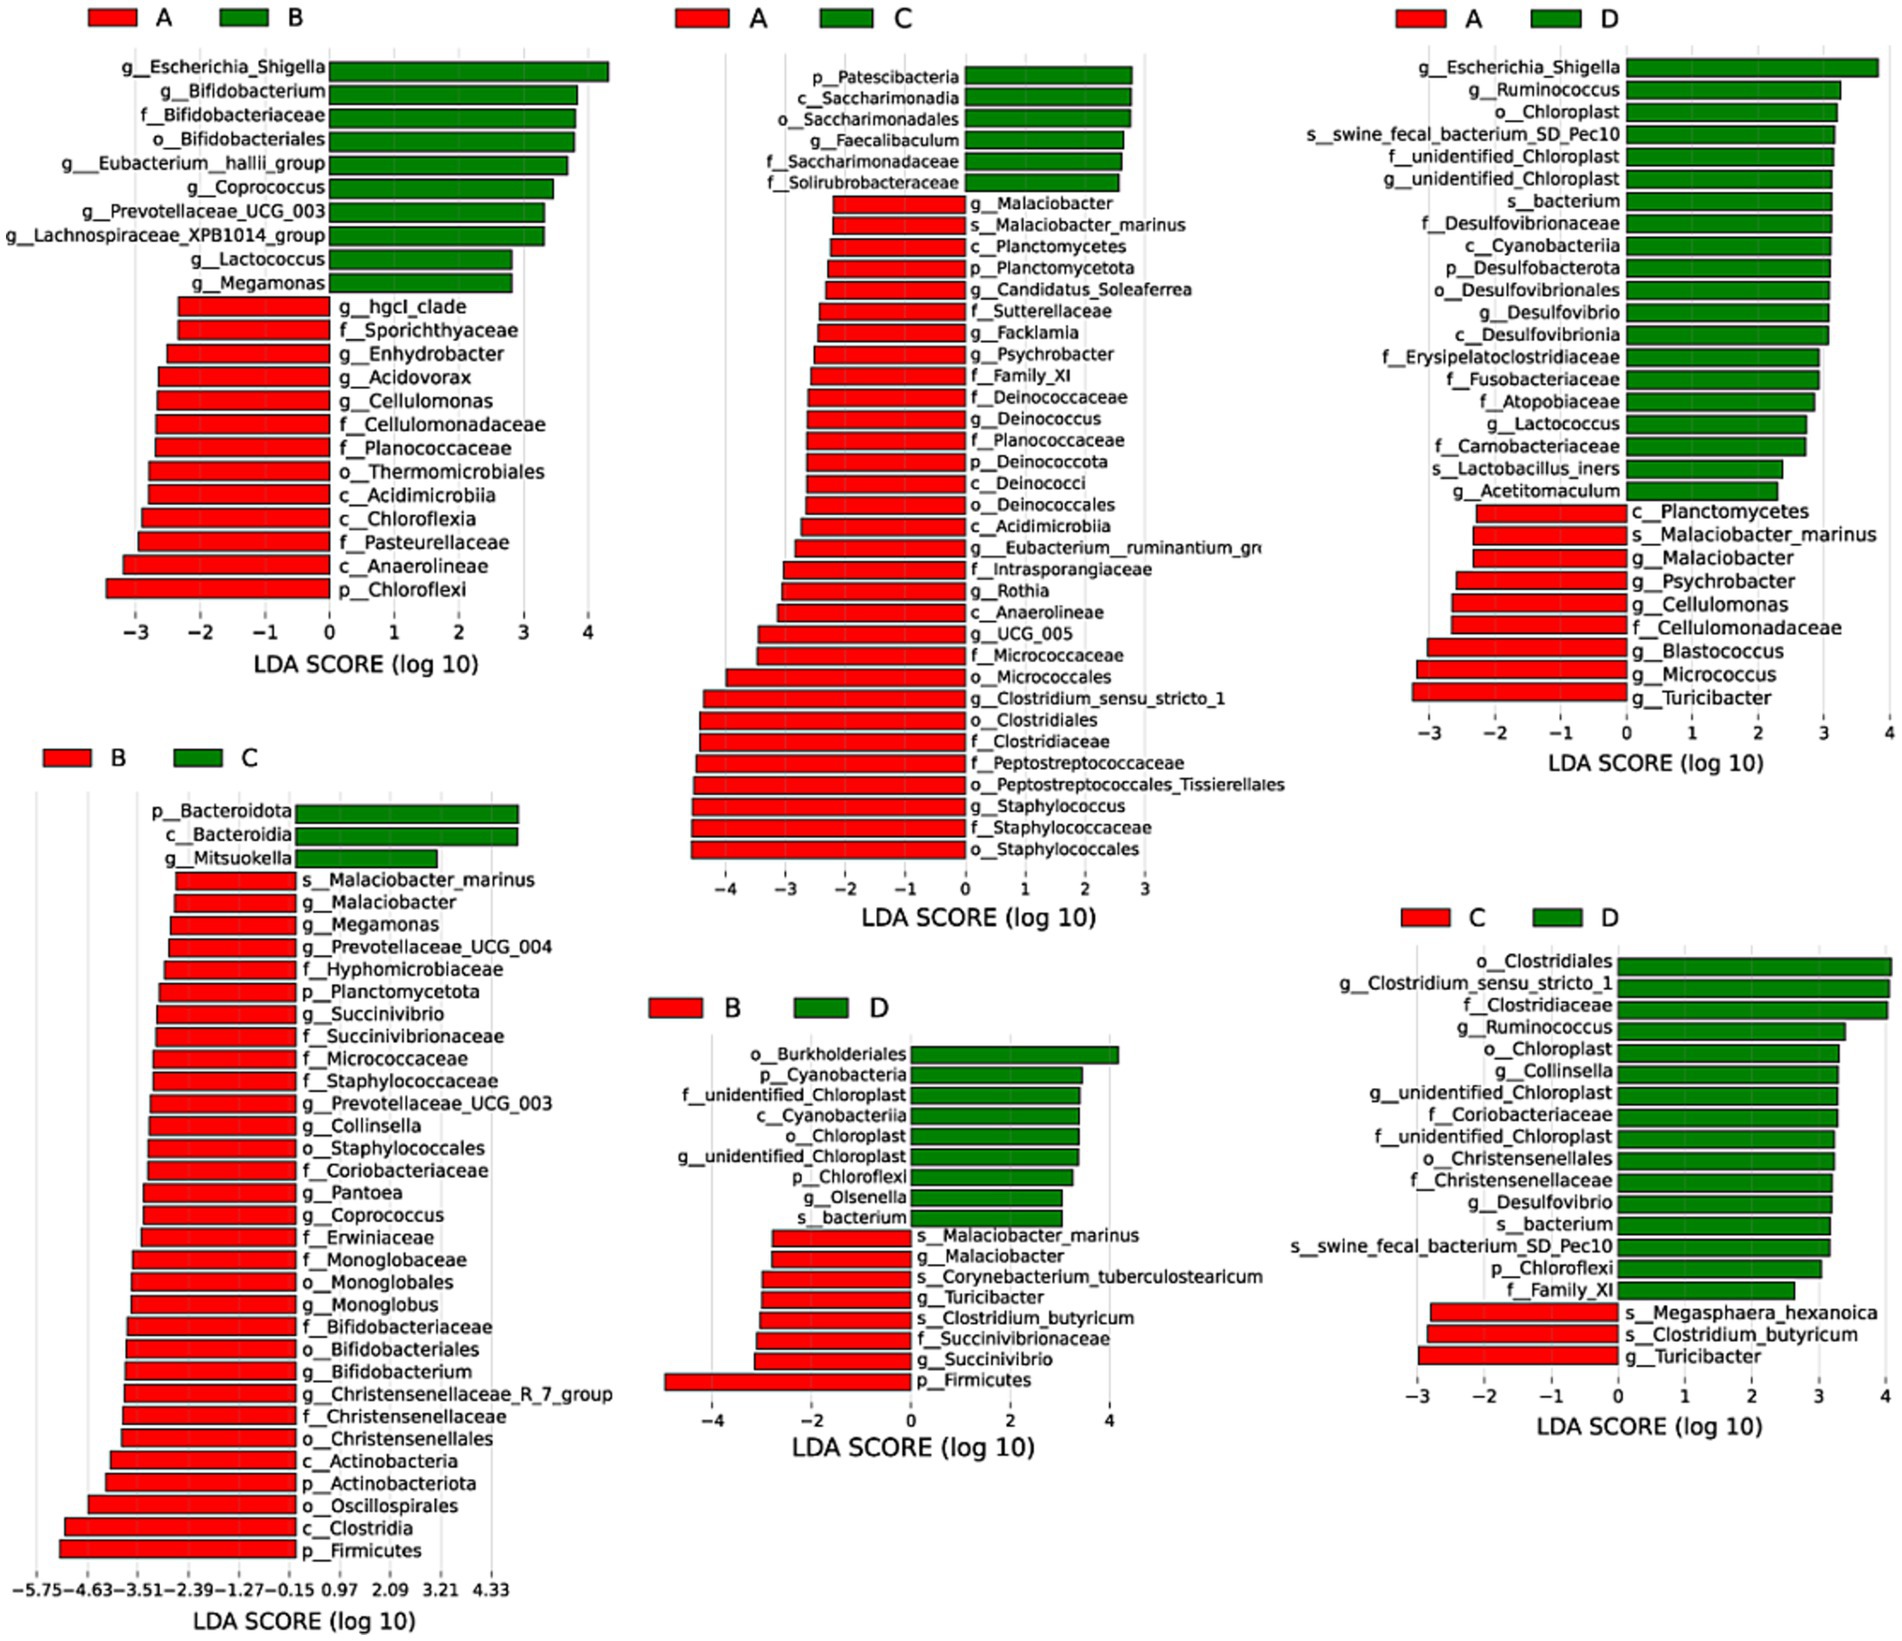
Figure 7. Differential bacterial composition of livers between groups. A, 0% glycerol + 0% vitamin C + 0% niacinamide. B, 10% glycerol. C, 0.06% vitamin C + 0.05% niacinamide. D, 10% glycerol + 0.06% vitamin C + 0.05% niacinamide.
3.5 Differentially expressed genes, Kyoto encyclopedia of genes and genomes pathway enrichment and qPCR validation
RNA sequencing was conducted to trace transcriptome changes, |log2(FoldChange)| ≥ 1 and p < 0.05 were used to screen the differentially expressed genes of livers between groups. Figure 8 showed that the numbers of differential genes with significant difference were 232 (166 up, 66 down) between groups A and B, 1293 (269 up, 1,024 down) between groups A and C, 499 (216 up, 283 down) between groups A and D, 1625 (355 up, 1,270 down) between groups B and C, 491 (185 up, 306 down) between groups B and D, 1018 (818 up, 200 down) between groups C and D, respectively. The differentially expressed genes between groups were mapped into KEGG biochemical pathways, and the 20 most abundant KEGG pathways between groups are presented in Figure 9.
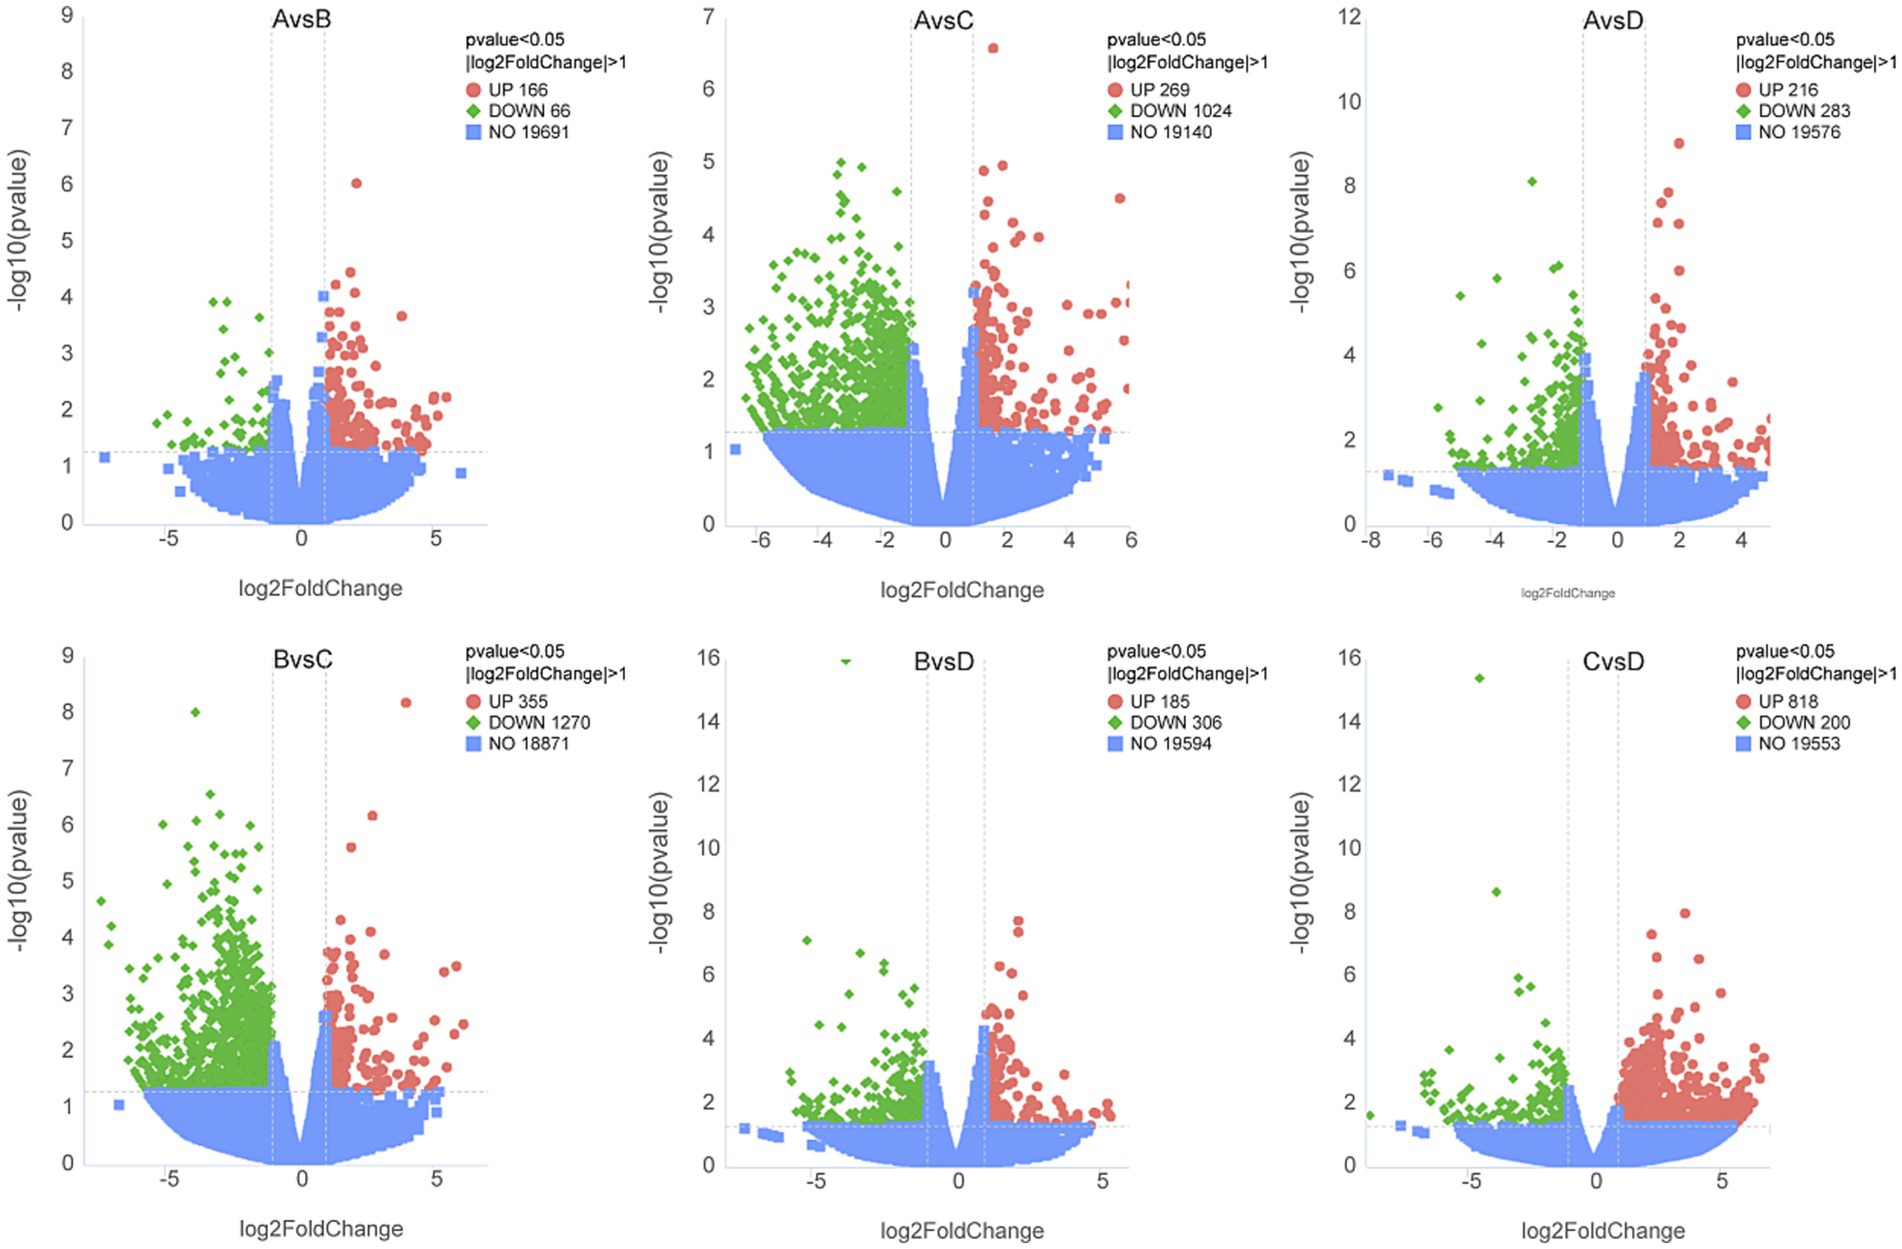
Figure 8. Volcano plot of differentially expressed genes in livers between groups. A, 0% glycerol + 0% vitamin C + 0% niacinamide. B, 10% glycerol. C, 0.06% vitamin C + 0.05% niacinamide. D, 10% glycerol + 0.06% vitamin C + 0.05% niacinamide. The abscissa represents the fold changes in gene expression. The ordinate represents the statistical significance of the variations in gene expression. The red dots represent significantly differentially expressed genes.
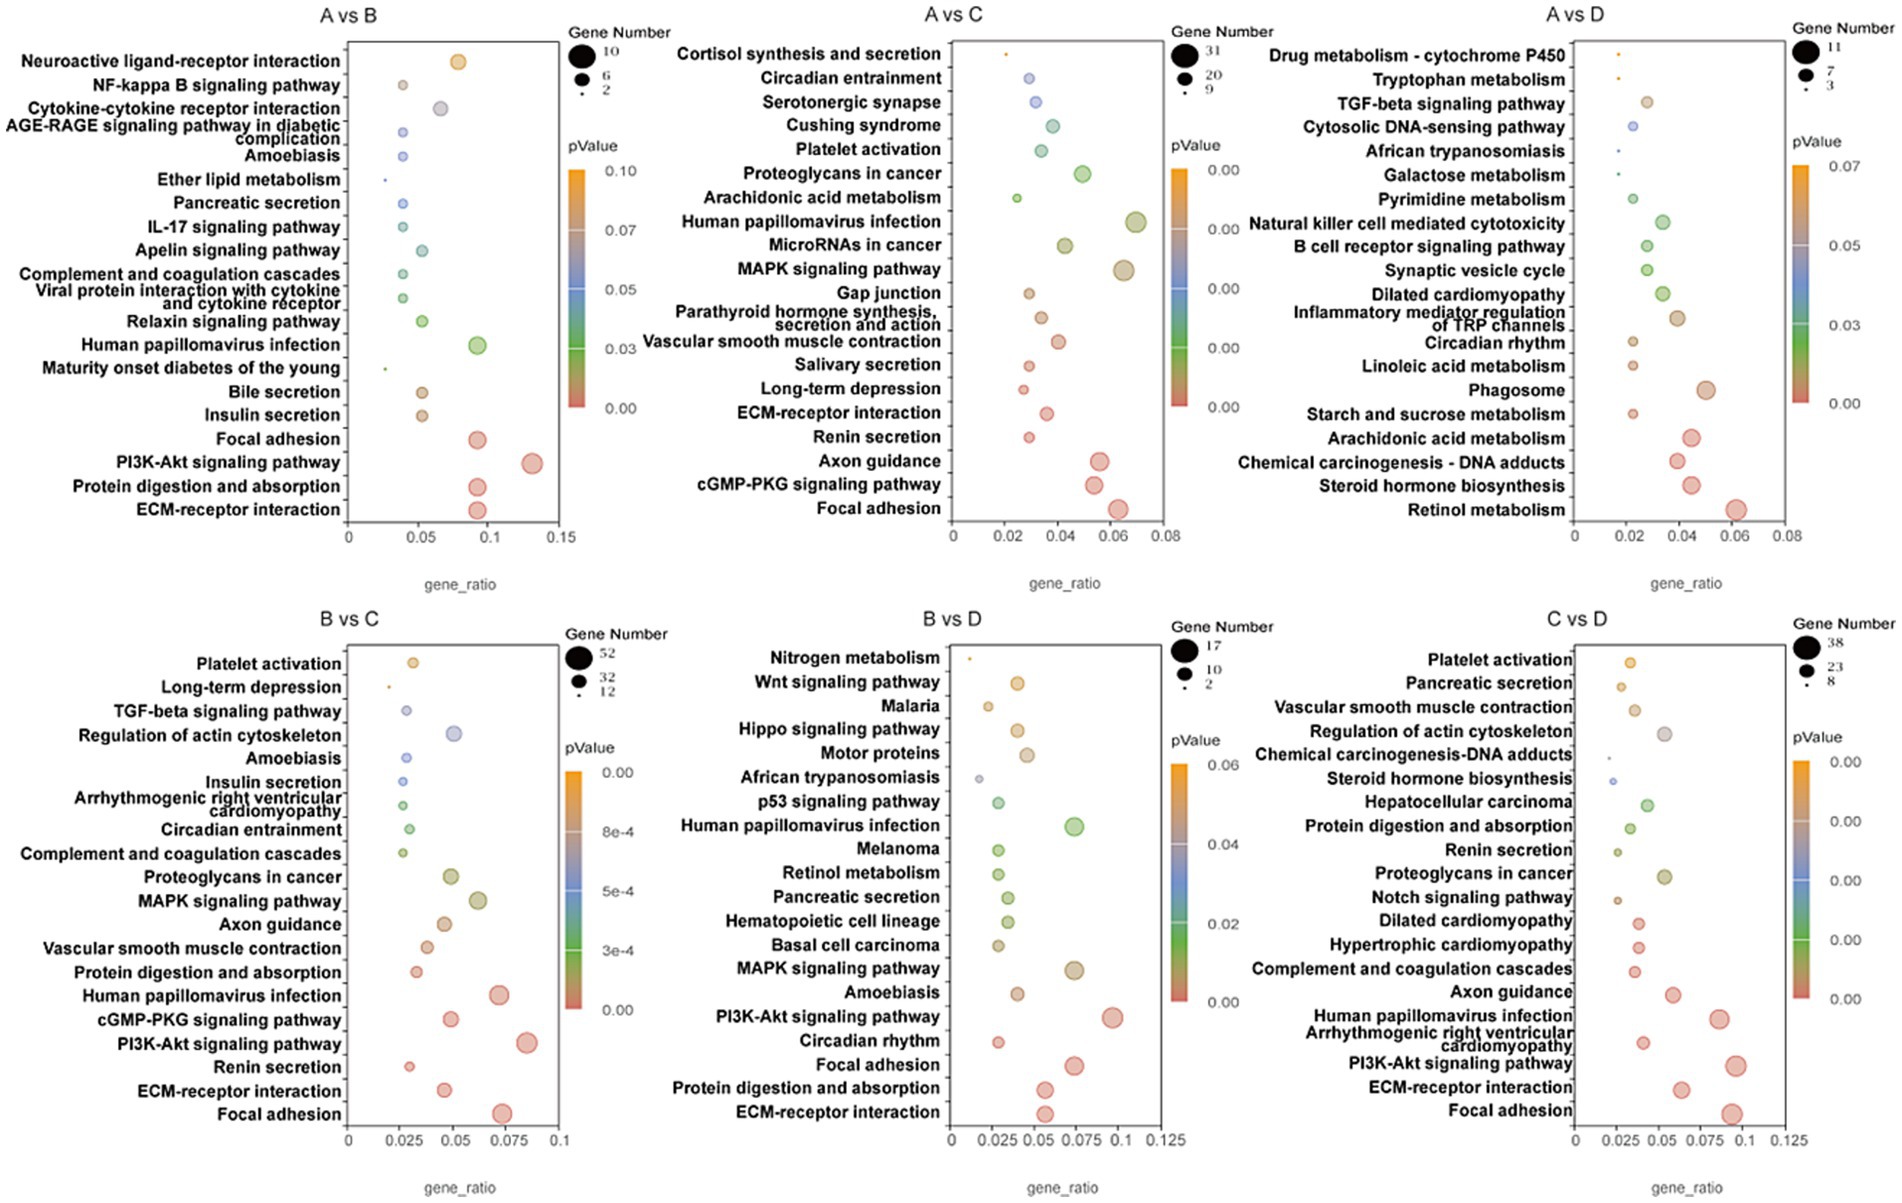
Figure 9. KEGG pathways of differentially expressed genes in livers between groups. A, 0% glycerol + 0% vitamin C + 0% niacinamide. B, 10% glycerol. C, 0.06% vitamin C + 0.05% niacinamide. D, 10% glycerol + 0.06% vitamin C + 0.05% niacinamide.
Thirteen KEGG pathways were related to the nutrition metabolism and disease occurrence in liver, including protein digestion and absorption, bile secretion, viral protein interaction with cytokine and cytokine receptor, PI3K-Akt signaling pathway, steroid hormone biosynthesis, arachidonic acid metabolism, starch and sucrose metabolism, linoleic acid metabolism, focal adhesion, phagosome, inflammatory mediator regulation of TRP channels, hematopoietic cell lineage and circadian rhythm. Differentially expressed genes involved in inflammation and lipid metabolism in these KEGG pathways are listed in Table 4.
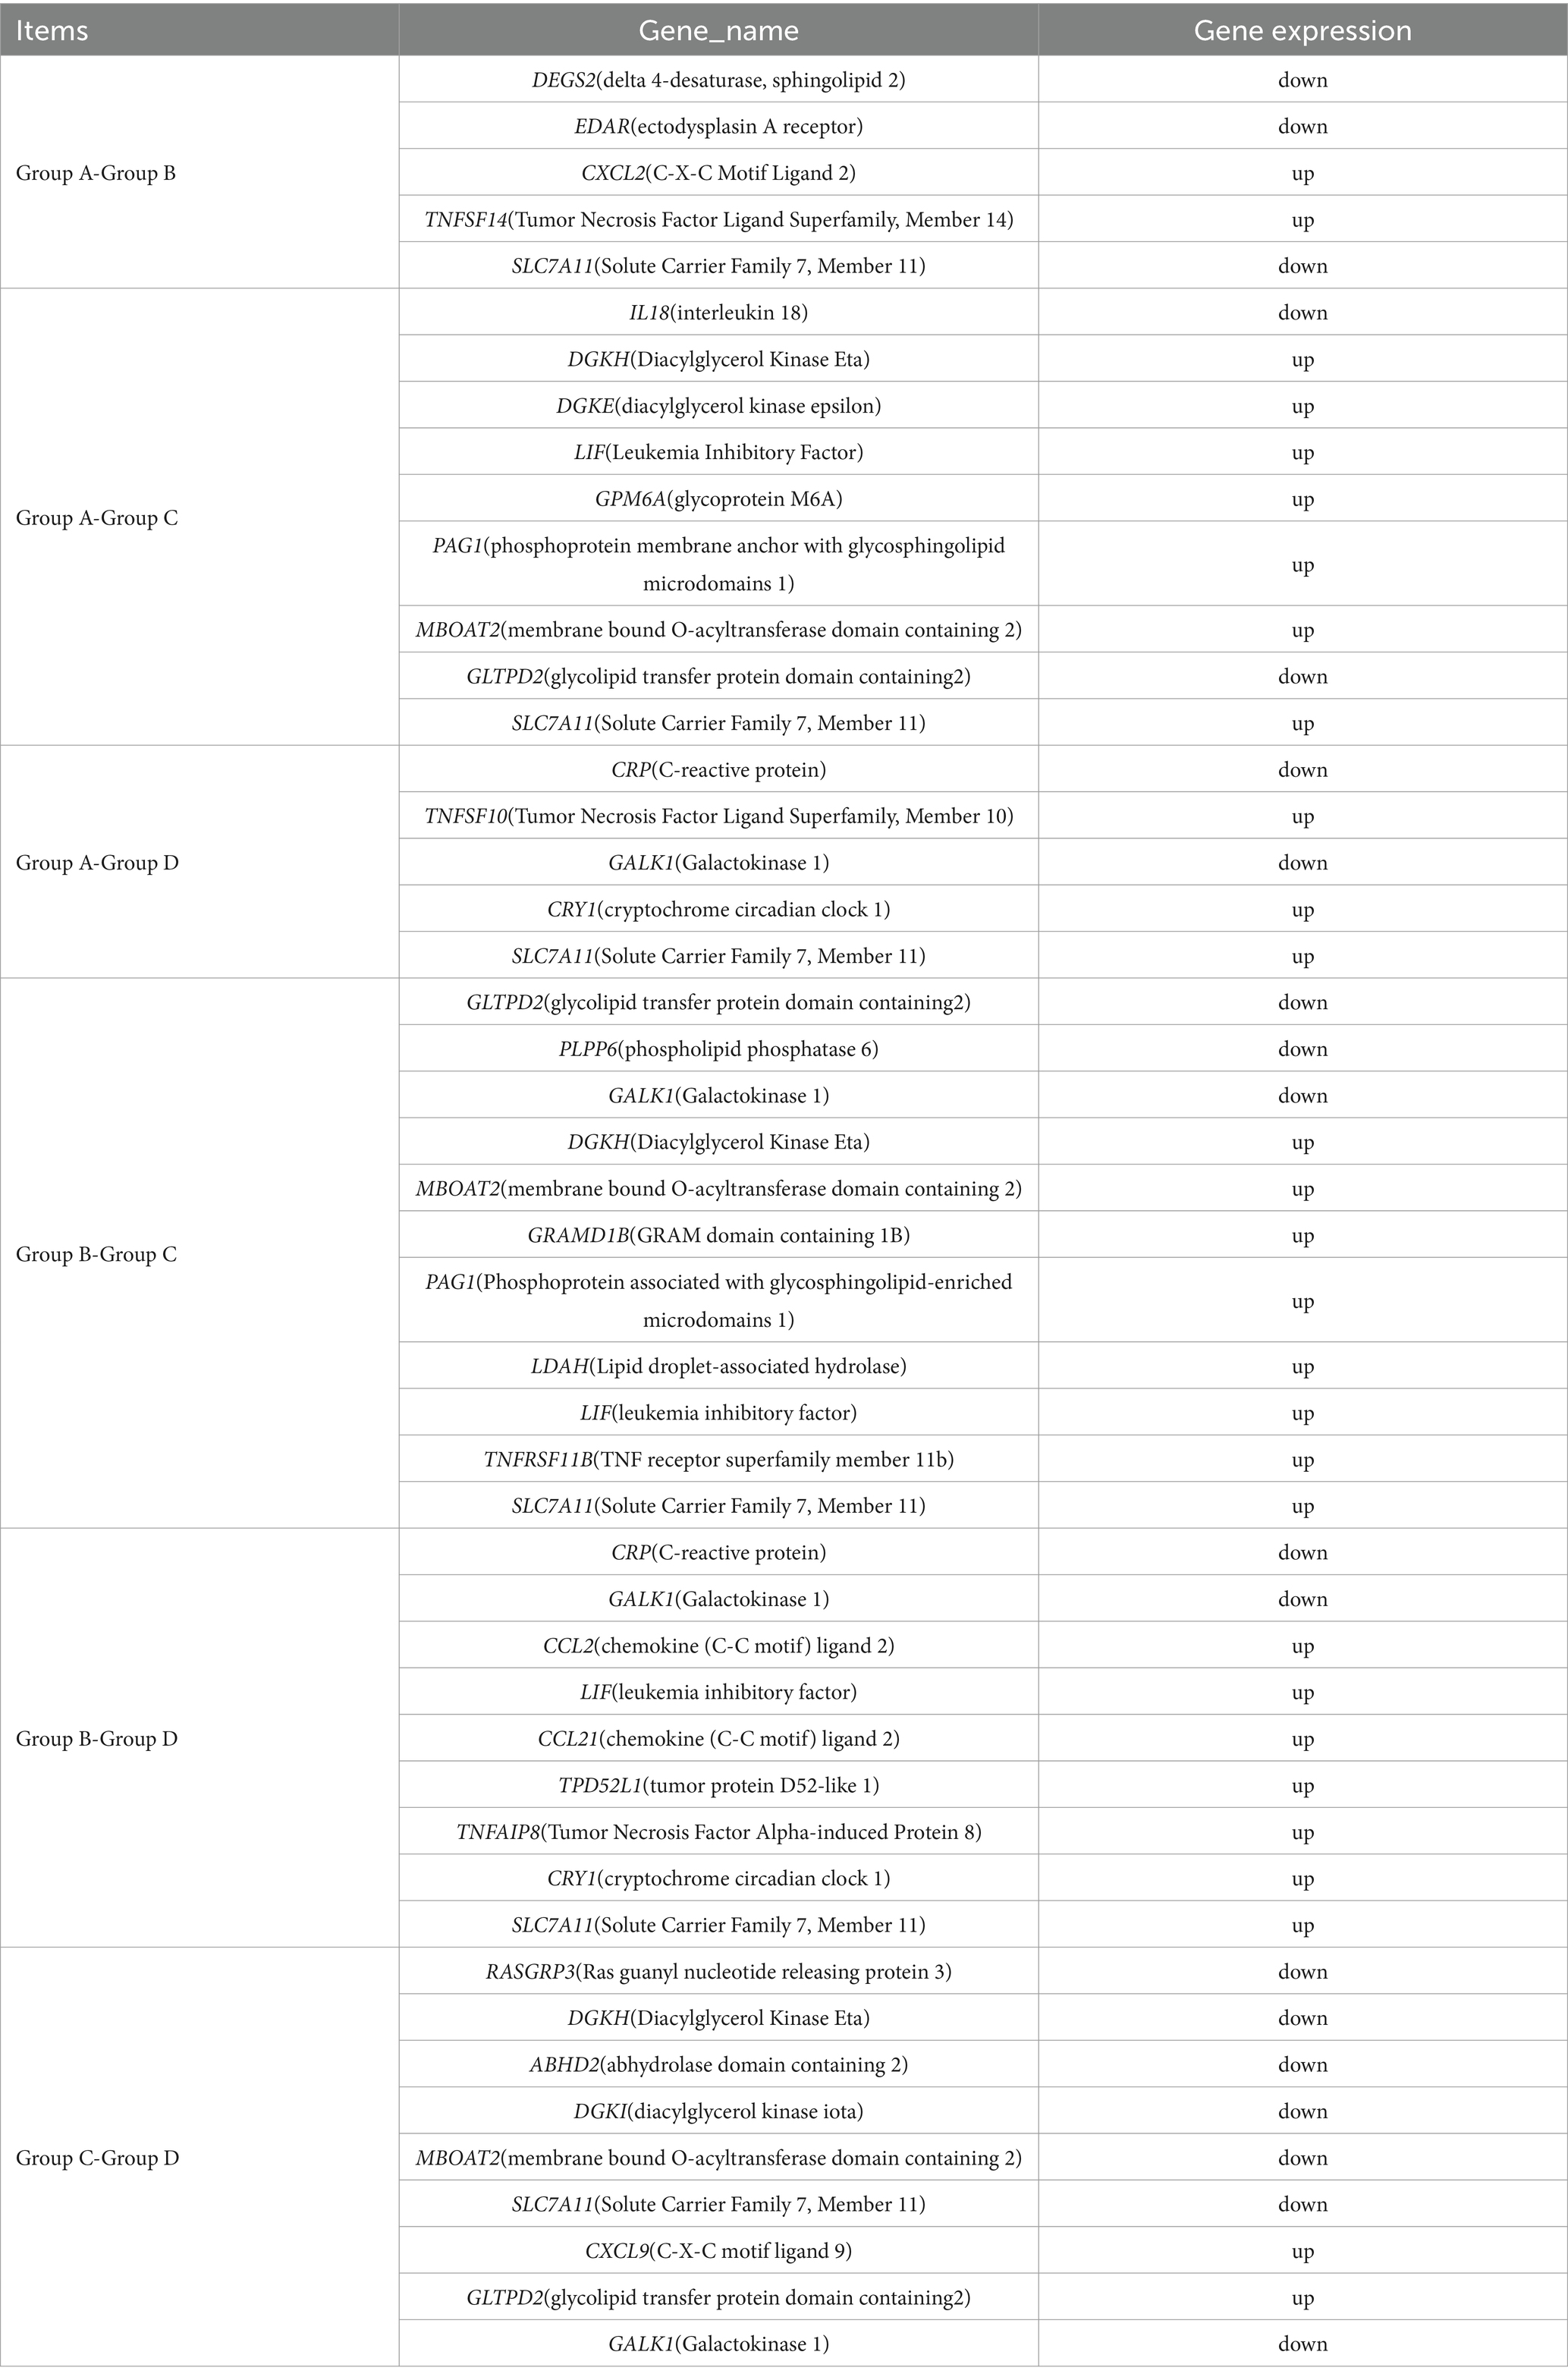
Table 4. Genes regulating inflammation and lipid metabolism.
In order to validate the accuracy of gene expression level generated by RNA-Sequencing, four differentially expressed genes including CRP, CRY1, GALK1 and SLC7A11, which were transcription factors related to inflammation and lipid metabolism, were selected to perform qPCR assays. The results of Figure 10 indicated the trends of relative expression levels of CRP, CRY1, GALK1 and SLC7A11 of qPCR were similar to that calculated by transcriptome sequencing, confirming the reliability of transcriptome data. qPCR data showed that pigs from group D had higher CRY1 expression in liver than pigs from groups A, B and C (p < 0.01), respectively. Pigs from group B had higher CRP expression in liver than pigs from group C (p < 0.05). There was no significant difference in the relative abundance of GALK1 of livers among four groups but pigs from group B had the numerically highest GALK1 expression when compared to pigs from the other three groups. Pigs from group B had the lowest SLC7A11 expression but pigs from group D had the highest SLC7A11 expression in liver, pigs from group B had lower SLC7A11 expression than pigs from group A (p < 0.05), pigs from groups C and D had higher SLC7A11 expression in liver than pigs from group B (p < 0.01), respectively.
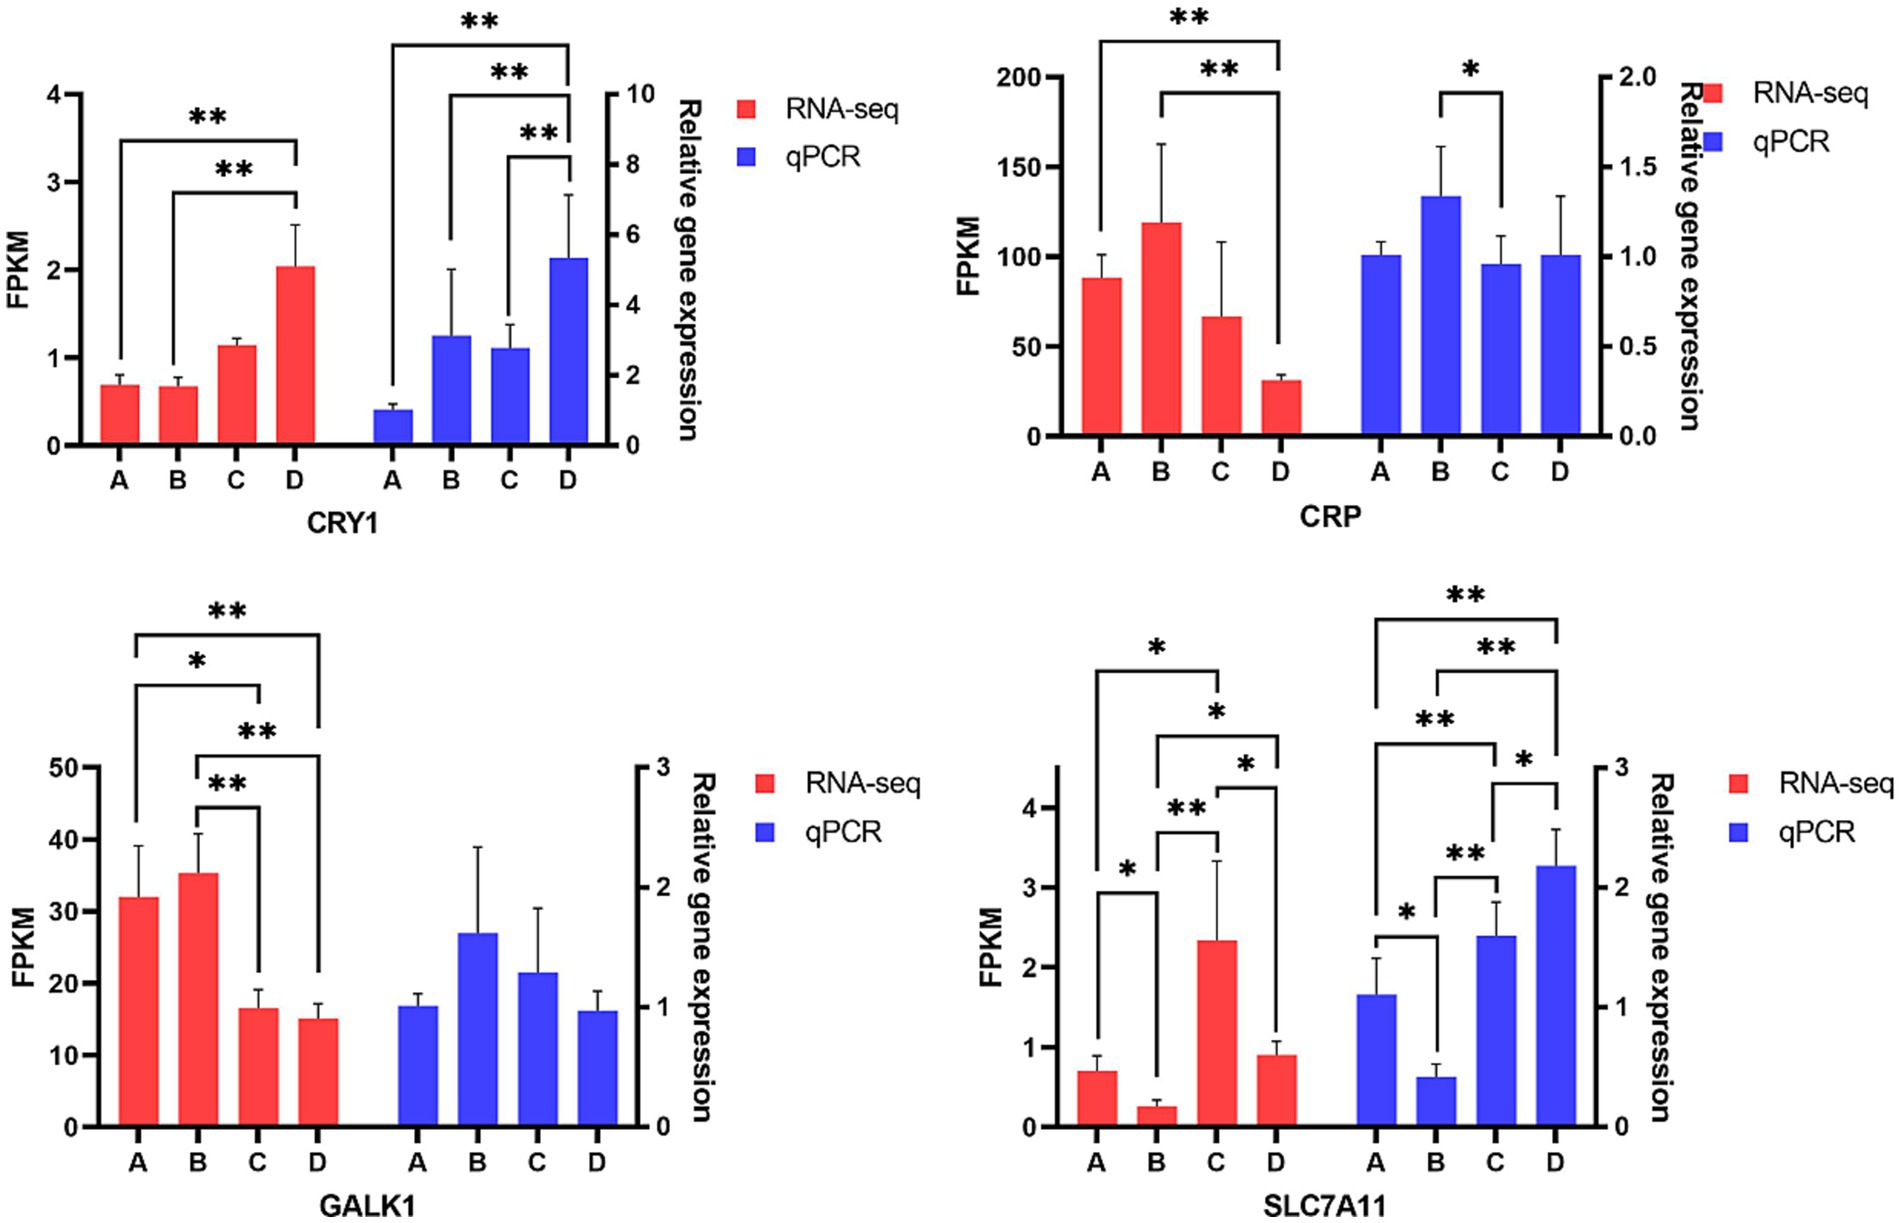
Figure 10. Comparison of genes expression level in liver. A, 0% glycerol + 0% vitamin C + 0% niacinamide. B, 10% glycerol. C, 0.06% vitamin C + 0.05% niacinamide. D, 10% glycerol + 0.06% vitamin C + 0.05% niacinamide. *p < 0.05, **p < 0.01.
4 Discussion
The liver plays important roles in keeping health and high production of animals, diet ingredients can influence the health and functions of liver via regulating energy metabolism, fat deposition, inflammation and microbiota composition (35, 36). Glycerol is often used in the diet, it can yield energy through the glycolytic and tricarboxylic acid pathways because it is an intermediate in the lipogenesis and gluconeogenesis pathways (37). Long-term inappropriate consumption of food containing glycerol may lead to liver diseases by changing the growth and histomorphology of liver with the accumulation of fat and trace elements. Studies indicated that the index or weight of liver can be altered by feeding glycerol to animals. It is reported that liver index significantly increased when increasing glycerol level (2.5, 5.0, 7.5, 10%) in the diet of broilers from day 1 to day 21 (38), and 3% glycerol addition reduced the liver weight of 40-d-old broilers (39), however, Topal and Ozdogan (40) reported dietary addition of glycerol at 5 or 8% had no effects on liver size of broilers. In addition, dietary glycerol supplementation also had influences on liver histomorphology, supplementing glycerol to postpartum goats improved liver morphology (41), but the liver histomorphology of growing-finishing pigs offered a corn-soybean meal-based diets was not influenced by glycerol addition whenever at levels of 5% or 10% (42). Results of this study showed that dietary glycerol supplementation at level of 10% to the diet of growing-finishing pigs numerically reduced liver index, increased liver fat content and developed partially hepatic steatosis along with small vacuoles in the cytoplasm. Hepatic steatosis is accompanied by the increase of fat content and the formation of vacuoles of different sizes in liver cells, which can lead to dysfunction, necrosis, fibrosis, or cirrhosis of liver (43). Previous studies showed that increasing niacinamide supplementation (10, 30, 1,000 mg/kg diet) recovered liver morphology to normal structure by alleviating hepatocyte steatosis (44). Niacinamide addition at high levels has potential risk to liver, because water drinking with niacinamide at 1% or 0.25% had a trend to reduce the liver size of mice (45) and supplementation of niacinamide with 500 mg/kg BW to healthy animals induced hepatotoxicity (22). Hepatotoxicity of niacinamide addition in this study did not occur, it might be the hepatoprotective effect of vitamin C, Abd-Allah et al. reported that administrating niacinamide together with vitamin C can reverse hepatotoxicity (30). Skat-Rørdam et al. also demonstrated that supplementing vitamin C at a level of 2000 mg/kg to high fat diet decreased liver cell ballooning of rats (46).
Hepatic steatosis, iron overload and pathogen infection can cause various liver diseases, including metabolic-associated fatty liver conditions such as steatohepatitis and fatty liver. The former is defined as the presence of macrovesicular steatosis in addition to hepatocyte ballooning degeneration, lobular inflammation, and/or fibrosis, the latter is characterized as macrovesicular steatosis without ballooned hepatocytes (47–49). Steatohepatitis has been shown to be associated with inflammatory factors, especially pro-inflammatory cytokines such as TNF-α. Eltahir et al. reported that glycerol injection increased serum TNF- α level of rats (50). Dietary vitamin C addition can promote iron absorption from gut content (51), and iron overload in liver can cause inflammation, promote hepatic steatosis and fibrosis, or trigger ferroptosis of hepatocyte through Fenton reaction and reactive oxygen species (ROS) accumulation (52). Vitamin C addition at the level of 2000 mg/kg diet significantly decreased inflammation in hepatic tissue of rats subjected to high fat diet (46). Bae et al. also found that vitamin C addition decreased the TNF-α level of liver tissue in Gulo(−/−) mice maintained on the vitamin C supplemented water (3.3 g ascorbate/L) (53). Lots of studies demonstrated that niacinamide has anti-inflammatory property (54, 55), and niacinamide addition to the diet can increase IL-10 level but decrease TNF-α level of ApoE-deficient mice (45). TNF-α is the cytokine responsible for steatohepatitis progression, patients with steatohepatitis have higher TNF-α levels, which play an important role in hepatic fibrosis (56), insulin resistance and type 2 diabetes (57, 58). Results of this study indicated that pigs only supplemented with 0.06% vitamin C and 0.05% niacinamide mixture had higher level of ferrous ion in liver, but had less steatosis and lower concentration of TNF-α in liver compared with pigs offered with 10% glycerol alone. This may be due to the antioxidant function of vitamin C, as it can reduce the production of ROS by alleviating ferroptosis, thereby reducing the damage of iron ion accumulation to the liver, because high dietary vitamin C intake can improve glucose metabolism and liver function by reducing iron accumulation (59).
Liver also harbors microbiota and the microbial composition has impacts on the health and functions of liver. It is reported that cattle with liver abscess had the most abundant Fusobacteriota and Bacteroidota, Fusobacterium and Bacteroides in liver tissue (60–63). Bacteroidota and Faecalibacterium were significantly expressed in both fatty liver and steatohepatitis patients, but Megamonas and Fusobacterium were also found in the steatohepatitis patients (64). Escherichia_Shigella can induce hepatic steatosis, ballooning, hepatic inflammation and fibrosis by inhibiting the expression of hepatic peroxisome proliferator activated receptor PPARα (65). Lachnospiraceae_XPB1014_group is positively correlated with TNF-α, liver index and liver weight, respectively (66). Desulfobacterotam, Lactococcus and Faecalibaculum can induce inflammation (66–68). Megamonas is also known to enrich in inflammatory diseases such as non-alcoholic fatty liver disease (69–71). It is reported vitamins can affect the community structure, richness and diversity as well as the relative abundance of microbiota in hepatic tissue of animals (72), but prenatal supplementation with vitamin A, D and E had no significant effects on the composition and relative abundance of microbiota in hepatic tissue of calves (72). Results of this study demonstrated that single addition of 10% glycerol significantly increased the relative abundances of Escherichia_shigella, Lachnospiraceae_XPB1014_group, Lactococcus and Megamonas in liver tissue, which were the contributors for the increased TNF-α level. The addition of 0.06% vitamin C and 0.05% niacinamide mixture significantly increased the relative abundance of Faecalibaculum in liver, but there was no strong positive correlation between Faecalibaculum and TNF-α (66), this might be the reason why the TNF-α level was not significantly increased in liver tissue of pigs supplemented with mixture of 0.06% vitamin C and 0.05% niacinamide.
Gene expression in liver tissue also has influences on liver health and functions. The proinflammatory cytokines can be inhibited by CRY1 gene expression (73) or enhanced by CRP gene expression (74). It is reported that CRP plays important roles in the production of cytokines, particularly interleukin-6 and tumor necrosis factor-α, the elevated CRP gene expression can increase the concentration of TNF-α (75). In this study, the highest TNF-α concentration in the liver of pigs supplemented with only 10% glycerol should be contributed to the highest CRP gene expression. Pigs supplemented with 10% glycerol together with 0.06% vitamin C and 0.05% niacinamide had the similar CRP gene expression but had the lowest CRP concentration in liver, this could be explained by the highest CRY1 expression in the liver of pigs. GALK1 gene is involved in fat deposition (76), and SLC7A11 gene has the function of inhibiting ferroptosis in liver cells (77). Data of this study indicated that addition of 10% glycerol increased the expression levels of gene CRY1, CRP and GALK1 but decreased the expression level of gene SLC7A11, the decreased SLC7A11 expression should be one of the contributors to increase TNF-α level of liver by increasing ferroptosis. Supplementation of 0.06% vitamin C and 0.05% niacinamide mixture enhanced SLC7A11 gene expression, the elevated SLC7A11 gene expression might be the important factor why the mixture of 0.06% vitamin C and 0.05% niacinamide increased liver iron content without causing liver organ damage.
5 Study limitations and future directions
An outbreak and rapid spread of infectious disease occurred in some experimental pigs approaching the end of experiment. In order to prevent the spread and transmission of this infectious disease, experimental pigs had to be transported out for harmless treatment. Prior to being transported away of pigs, we did not have time to collect sufficient samples, only three pigs without disease symptoms were selected from each group for slaughter to collect liver and pancrea samples, resulting in an insufficient sample size of liver and pancrea. Data of this preliminary experiment indicated that dietary addition of glycerol together with or without mixture of vitamin C and niacinamide had different effects on the health and function of the liver and pancreas of growing-finishing pigs. In the near future, larger scale experiment will be conducted together with pig farms to harvest sufficient samples of liver, pancrea and gut digesta to verify the current data, assay the long-term toxicity and disclose the causality between microbiota shifts and hepatic inflammation.
6 Conclusion
Dietary addition with 10% glycerol only increased TNF-α concentration, steatosis, relative abundances of Escherichia_shigella, Lachnospiraceae_XPB1014_group, Coprococcus, Lactococcus and Megamonas, but decreased SLC7A11 expression in liver of growing-finishing pigs. However, supplementation of the mixture with 0.06% Vitamin C and 0.05% niacinamide alleviated steatosis and inflammation in liver of growing-finishing pigs fed diets containing 10% glycerol by reducing the numbers of harmful microbiota and increasing the expressions of CRY1 and SLC7A11.
Data availability statement
The datasets presented in this study can be found in online repositories. The names of the repository/repositories and accession number(s) can be found in the article/supplementary material.
Ethics statement
The animal study was approved by the Ethics Committee of Jiangxi Agricultural University (JXAULL-202215). The study was conducted in accordance with the local legislation and institutional requirements.
Author contributions
WS: Formal analysis, Writing – original draft, Visualization, Investigation. LD: Investigation, Formal analysis, Writing – original draft. WZ: Writing – original draft, Investigation. PW: Formal analysis, Writing – original draft, Investigation. SH: Writing – original draft, Investigation, Formal analysis. HW: Writing – review & editing, Investigation. WL: Project administration, Funding acquisition, Writing – review & editing. YH: Writing – review & editing, Conceptualization, Writing – original draft, Project administration.
Funding
The author(s) declare that financial support was received for the research and/or publication of this article. This research was funded by the Jiangxi Modern Agricultural Research Collaborative Innovation Project (JXXTCX2016003-02).
Conflict of interest
The authors declare that the research was conducted in the absence of any commercial or financial relationships that could be construed as a potential conflict of interest.
Generative AI statement
The author(s) declare that no Gen AI was used in the creation of this manuscript.
Publisher’s note
All claims expressed in this article are solely those of the authors and do not necessarily represent those of their affiliated organizations, or those of the publisher, the editors and the reviewers. Any product that may be evaluated in this article, or claim that may be made by its manufacturer, is not guaranteed or endorsed by the publisher.
References
1. Song, W, Chao, B, Yu, M, Jin, R, Chen, X, Zhang, Y, et al. Dietary nicotinamide improves growth performance and ameliorates liver lipid profiles by alleviating glycerophospholipid and sphingolipids metabolism in swamp eel (Monopterus albus). Aquacult Rep. (2024) 39:102361. doi: 10.1016/j.aqrep.2024.102361
2. Zhang, W-J, Xu, X-P, Song, X-H, Zhang, Z-R, Zhang, X-R, Yang, B, et al. Liver function linked to bone health: a bibliometric of the liver-bone Axis. World J Hepatol. (2025) 17:103016. doi: 10.4254/wjh.v17.i2.103016
3. Zhao, J, Lei, H, Wang, T, and Xiong, X. Liver-bone crosstalk in non-alcoholic fatty liver disease: clinical implications and underlying pathophysiology. Front Endocrinol. (2023) 14:1161402. doi: 10.3389/fendo.2023.1161402
4. Iori, S, Lahtela-Kakkonen, M, D’Onofrio, C, Maietti, F, Mucignat, G, Bardhi, A, et al. New insights into aflatoxin B1 mechanistic toxicology in cattle liver: an integrated approach using molecular docking and biological evaluation in Cyp1a1 and Cyp3a74 knockout Bfh12 cell lines. Arch Toxicol. (2024) 98:3097–108. doi: 10.1007/s00204-024-03799-y
5. Singh, V, and Vijay-Kumar, M. Beneficial and detrimental effects of processed dietary fibers on intestinal and liver health: health benefits of refined dietary fibers need to be redefined! Gastroenterol Rep. (2020) 8:85–9. doi: 10.1093/gastro/goz072
6. Uehara, E, Hokazono, H, and Miura, N. Effects of heat killed Lactiplantibacillus plantarum N1487-7 intake in humans with impaired liver function: a randomized, double-blind, placebo-controlled, parallel-group study. Funct Foods Health Dis. (2025) 15:1–18. doi: 10.31989/ffhd.v15i1.1529
7. Xiang, M, Tian, X, Wang, H, Gan, P, and Zhang, Q. Inappropriate diet exacerbates metabolic dysfunction-associated Steatotic liver disease via abdominal obesity. Nutrients. (2024) 16:4208. doi: 10.3390/nu16234208
8. Yadav, R, Gerrard, SD, Lima, MRM, Southard, TL, Sunny, NE, and El-Kadi, SW. The onset of steatosis occurs as early as seven days and progresses to nonalcoholic steatohepatitis in a pediatric pig model of nonalcoholic fatty liver disease. J Nutr. (2025) 155:211–23. doi: 10.1016/j.tjnut.2024.11.009
9. Katsimichas, A, Dimopoulos, G, Dermesonlouoglou, E, and Taoukis, P. The application of osmodehydrated tomato and spinach in ready-to-eat mixed salad products: design, development, and shelf life study. Appl Sci. (2024) 14:5863. doi: 10.3390/app14135863
10. Mitri, S, Louka, N, Rossignol, T, Maroun, RG, and Koubaa, M. Brewer's spent grain and crude glycerol: sustainable substrates for 2-phenylethanol production by Yarrowia lipolytica. Future Foods. (2025) 11:100569. doi: 10.1016/j.fufo.2025.100569
11. Eastridge, M. Feeding glycerol to transition dairy cows (2024). Available online at: https://www.farmanddairy.com/columns/feeding-glycerol-to-transition-dairycows/817131.html [Accessed March 27, 2025]
12. Lechasseur, A, Mouchiroud, M, Tremblay, F, Bouffard, G, Milad, N, Pineault, M, et al. Glycerol contained in vaping liquids affects the liver and aspects of energy homeostasis in a sex-dependent manner. Phys Rep. (2022) 10:e15146. doi: 10.14814/phy2.15146
13. Park, JM, Lin, S-H, Baxter, JD, Harrison, CE, Leary, J, Mozingo, C, et al. Disrupted metabolic flux balance between pyruvate dehydrogenase and pyruvate carboxylase in human fatty liver. Metabolism. (2025) 165:156151. doi: 10.1016/j.metabol.2025.156151
14. Zawadzki, F, Martin do Prado, R, Ornaghi, MG, Carvalho, VM, Avila, VAD, Ramos, TR, et al. Replacement of corn by glycerine and vegetal oils (cashew and Castor oils) as alternative additives feeds in diets of Purunã bulls finished in feedlot. Livest Sci. (2021) 253:104695. doi: 10.1016/j.livsci.2021.104695
15. Deng, L, Hao, S, Zou, W, Wei, P, Sun, W, Wu, H, et al. Effects of supplementing growing–finishing crossbred pigs with glycerin, vitamin C and niacinamide on carcass characteristics and meat quality. Animals. (2023) 13:3635. doi: 10.3390/ani13233635
16. Rito, J, Viegas, I, Pardal, MÂ, Metón, I, Baanante, IV, and Jones, JG. Utilization of glycerol for endogenous glucose and glycogen synthesis in seabass (Dicentrarchus labrax): a potential mechanism for sparing amino acid catabolism in carnivorous fish. Aquaculture. (2019) 498:488–95. doi: 10.1016/j.aquaculture.2018.08.066
17. Wei, P, Sun, W, Hao, S, Deng, L, Zou, W, Wu, H, et al. Dietary supplementation of crossbred pigs with glycerol, vitamin C, and Niacinamide alters the composition of gut Flora and gut Flora-derived metabolites. Animals. (2024) 14:2198. doi: 10.3390/ani14152198
18. Shi, H-J, Li, X-F, Xu, C, Zhang, D, Zhang, L, Xia, S-L, et al. Nicotinamide improves the growth performance, intermediary metabolism and glucose homeostasis of blunt snout bream Megalobrama amblycephala fed high-carbohydrate diets. Aquac Nutr. (2020) 26:1311–28. doi: 10.1111/anu.13088
19. Yang, SJ, Choi, JM, Kim, L, Park, SE, Rhee, EJ, Lee, WY, et al. Nicotinamide improves glucose metabolism and affects the hepatic Nad-Sirtuin pathway in a rodent model of obesity and type 2 diabetes. J Nutr Biochem. (2014) 25:66–72. doi: 10.1016/j.jnutbio.2013.09.004
20. Hwang, ES, and Song, SB. Possible adverse effects of high-dose nicotinamide: mechanisms and safety assessment. Biomol Ther. (2020) 10:687. doi: 10.3390/biom10050687
21. Sahin, K, Kucuk, O, Orhan, C, Tuzcu, M, Durmus, AS, Ozercan, IH, et al. Niacinamide and Undenatured type ii collagen modulates the inflammatory response in rats with Monoiodoacetate-induced osteoarthritis. Sci Rep. (2021) 11:14724. doi: 10.1038/s41598-021-94142-3
22. Mahmoud, YI, and Mahmoud, AA. Role of nicotinamide (vitamin B3) in acetaminophen-induced changes in rat liver: nicotinamide effect in acetaminophen-Damged liver. Exp Toxicol Pathol. (2016) 68:345–54. doi: 10.1016/j.etp.2016.05.003
23. Ghosh, M, Ghosh, MK, Devbhuti, D, Dasgupta, S, and Devbhuti, P. An in vitro study on impact of vitamin-C on cefuroxime mediated alterations in bio-parameters associated with free radical linked lipid decomposition. Res J Pharm Technol. (2024) 17:1795–8. doi: 10.52711/0974-360X.2024.00285
24. Zhuang, Y, and Xiao, X. Effects of high-dose vitamin C on liver function, systemic inflammatory and immune responses in patients with severe acute pancreatitis. Curr Top Nutraceut Res. (2024) 22:629–34. doi: 10.37290/ctnr2641-452x.22:629-634
25. İmi̇k, H, Atasever, M, Koc, M, Atasever, M, and Ozturan, K. Effect of dietary supplementation of some antioxidants on growth performance, carcass composition and breast meat characteristics in quails reared under heat stress. Czeh J Anim Sci. (2010) 55:209–20. doi: 10.17221/147/2009-cjas
26. Matsui, T. Vitamin C nutrition in cattle. Asian Australas J Anim Sci. (2012) 25:597–605. doi: 10.5713/ajas.2012.r.01
27. Pogge, DJ, and Hansen, SL. Supplemental vitamin C improves marbling in feedlot cattle consuming high sulfur diets. J Anim Sci. (2013) 91:4303–14. doi: 10.2527/jas.2012-5638
28. Lauer, A, Burkard, M, Niessner, H, Leischner, C, Renner, O, Vollbracht, C, et al. Ex vivo evaluation of the Sepsis triple therapy high-dose vitamin C in combination with vitamin B1 and hydrocortisone in a human peripheral blood mononuclear cells (Pbmcs) model. Nutrients. (2021) 13:2366. doi: 10.3390/nu13072366
29. Fisher, BJ, Seropian, IM, Kraskauskas, D, Thakkar, JN, Voelkel, NF, Fowler, AAI, et al. Ascorbic acid attenuates lipopolysaccharide-induced acute lung injury*. Crit Care Med. (2011) 39:1454. doi: 10.1097/CCM.0b013e3182120cb8
30. Abd-Allah, H, Nasr, M, Ahmed-Farid, OAH, Ibrahim, BMM, Bakeer, RM, and Ahmed, RF. Nicotinamide and ascorbic acid nanoparticles against the hepatic insult induced in rats by high fat high fructose diet: a comparative study. Life Sci. (2020) 263:118540. doi: 10.1016/j.lfs.2020.118540
31. Mouzaki, M, and Allard, JP. The role of nutrients in the development, progression, and treatment of nonalcoholic fatty liver disease. J Clin Gastroenterol. (2012) 46:457–67. doi: 10.1097/MCG.0b013e31824cf51e
32. Riemer, J, Hoepken, HH, Czerwinska, H, Robinson, SR, and Dringen, R. Colorimetric Ferrozine-based assay for the quantitation of Iron in cultured cells. Anal Biochem. (2004) 331:370–5. doi: 10.1016/j.ab.2004.03.049
33. Budd, AM, Cooper, MK, Port, AL, Schils, T, Mills, MS, Deinhart, ME, et al. First detection of critically endangered scalloped hammerhead sharks (Sphyrna Lewini) in Guam, Micronesia, in five decades using environmental DNA. Ecol Indic. (2021) 127:107649. doi: 10.1016/j.ecolind.2021.107649
34. Hao, S, Sun, W, Wei, P, Wu, H, Lu, W, and He, Y. Supplementation with rare earth-chitosan chelate improves tibia quality, disease resistance capacity, and performance in nursery pigs. Int J Mol Sci. (2025) 26:2409. doi: 10.3390/ijms26062409
35. Abugomaa, A, and Elbadawy, M. Olive leaf extract modulates glycerol-induced kidney and liver damage in rats. Environ Sci Pollut Res. (2020) 27:22100–11. doi: 10.1007/s11356-020-08371-6
36. Gena, P, Mastrodonato, M, Portincasa, P, Fanelli, E, Mentino, D, Rodríguez, A, et al. Liver glycerol permeability and Aquaporin-9 are dysregulated in a murine model of non-alcoholic fatty liver disease. PLoS One. (2013) 8:e78139. doi: 10.1371/journal.pone.0078139
37. da Costa, DV, Jorge, D, Rita, C, Priscila Vieira, R, and Engrola, S. Partition and metabolic fate of dietary glycerol in muscles and liver of juvenile Tilapia. Arch Anim Nutr. (2017) 71:165–74. doi: 10.1080/1745039X.2017.1281579
38. Mandalawi, HA, Kimiaeitalab, MV, Obregon, V, Menoyo, D, and Mateos, GG. Influence of source and level of glycerin in the diet on growth performance, liver characteristics, and nutrient digestibility in broilers from hatching to 21 days of age. Poult Sci. (2014) 93:2855–63. doi: 10.3382/ps.2014-04156
39. Suchý, P, Straková, E, Kroupa, L, and Herzig, I. Pure and raw glycerol in the diet of broiler chickens, its effect on the production parameters and slaughter value. Arch Anim Breed. (2011) 54:308–18. doi: 10.5194/aab-54-308-2011
40. Topal, E, and Ozdogan, M. Effects of glycerol on the growth performance, internal organ weights, and drumstick muscle of broilers. J Appl Poult Res. (2013) 22:146–51. doi: 10.3382/japr.2012-00589
41. Kalakappa, K, Ajithkumar, S, Habeeb, BP, Murugan, SS, Krishnan, A, David, PV, et al. Haemotobiochemical changes and management of post-partum fatty liver syndrome in Malabari goats. J Vet Anim Sci. (2023) 54:670–7. doi: 10.51966/jvas.2023.54.3.670-677
42. Lammers, PJ, Kerr, BJ, Weber, TE, Dozier, WA, Kidd, MT, Bregendahl, K, et al. Digestible and metabolizable energy of crude glycerol for growing pigs. J Anim Sci. (2008) 86:602–8. doi: 10.2527/jas.2007-0453
43. Wikan, N, Tocharus, J, Sivasinprasasn, S, Kongkaew, A, Chaichompoo, W, Suksamrarn, A, et al. Capsaicinoid Nonivamide improves nonalcoholic fatty liver disease in rats fed a high-fat diet. J Pharmacol Sci. (2020) 143:188–98. doi: 10.1016/j.jphs.2020.03.008
44. Tupe, RS, Tupe, SG, and Agte, VV. Dietary nicotinic acid supplementation improves hepatic zinc uptake and offers Hepatoprotection against oxidative damage. Br J Nutr. (2011) 105:1741–9. doi: 10.1017/S0007114510005520
45. Méndez-Lara, KA, Letelier, N, Farré, N, Diarte-Añazco, EMG, Nieto-Nicolau, N, Rodríguez-Millán, E, et al. Nicotinamide prevents apolipoprotein B-containing lipoprotein oxidation, inflammation and atherosclerosis in apolipoprotein E-deficient mice. Antioxidants. (2020) 9:1162. doi: 10.3390/antiox9111162
46. Skat-Rørdam, J, Pedersen, K, Skovsted, GF, Gregersen, I, Vangsgaard, S, Ipsen, DH, et al. Vitamin C deficiency may delay diet-induced Nash regression in the guinea pig. Antioxidants. (2022) 11:69. doi: 10.3390/antiox11010069
47. Cohen, JC, Horton, JD, and Hobbs, HH. Human fatty liver disease: old questions and new insights. Science. (2011) 332:1519–23. doi: 10.1126/science.1204265
48. Sakamoto, M, Tsujikawa, H, Effendi, K, Ojima, H, Harada, K, Zen, Y, et al. Pathological findings of nonalcoholic steatohepatitis and nonalcoholic fatty liver disease. Pathol Int. (2017) 67:1–7. doi: 10.1111/pin.12485
49. Watanabe, S, Hashimoto, E, Ikejima, K, Uto, H, Ono, M, Sumida, Y, et al. Evidence-based clinical practice guidelines for nonalcoholic fatty liver disease/nonalcoholic steatohepatitis. J Gastroenterol. (2015) 50:364–77. doi: 10.1007/s00535-015-1050-7
50. Eltahir, HM, Elbadawy, HM, Alalawi, A, Aldhafiri, AJ, Ibrahim, SR, Mohamed, GA, et al. Alpha-Mangostin ameliorates acute kidney injury via modifying levels of circulating Tnf-Α and Il-6 in glycerol-induced rhabdomyolysis animal model. Acta Biochim Pol. (2023) 70:277–84. doi: 10.18388/abp.2020_6509
51. Li, X-Y, Meng, L, Shen, L, and Ji, H-F. Regulation of gut microbiota by vitamin C, vitamin E and β-carotene. Food Res Int. (2023) 169:112749. doi: 10.1016/j.foodres.2023.112749
52. Xing, G, Meng, L, Cao, S, Liu, S, Wu, J, Li, Q, et al. Pparα alleviates Iron overload-induced Ferroptosis in mouse liver. EMBO Rep. (2022) 23:e52280. doi: 10.15252/embr.202052280
53. Bae, S, Cho, C-H, Kim, H, Kim, Y, Kim, H-R, Hwang, Y-i, et al. In vivo consequence of vitamin C insufficiency in liver injury: vitamin C ameliorates T-cell-mediated acute liver injury in Gulo (−/−) mice. Antioxid Redox Signal. (2013) 19:2040–53. doi: 10.1089/ars.2012.4756
54. Lappas, M, and Permezel, M. The anti-inflammatory and Antioxidative effects of nicotinamide, a vitamin B3 derivative, are elicited by Foxo3 in human gestational tissues: implications for preterm birth. J Nutr Biochem. (2011) 22:1195–201. doi: 10.1016/j.jnutbio.2010.10.009
55. Yanez, M, Jhanji, M, Murphy, K, Gower, RM, Sajish, M, and Jabbarzadeh, E. Nicotinamide augments the anti-inflammatory properties of resveratrol through Parp1 activation. Sci Rep. (2019) 9:10219. doi: 10.1038/s41598-019-46678-8
56. Tomita, K, Tamiya, G, Ando, S, Ohsumi, K, Chiyo, T, Mizutani, A, et al. Tumour necrosis factor Α signalling through activation of Kupffer cells plays an essential role in liver fibrosis of non-alcoholic steatohepatitis in mice. Gut. (2006) 55:415–24. doi: 10.1136/gut.2005.071118
57. Akash, MSH, Rehman, K, and Liaqat, A. Tumor necrosis factor-alpha: role in development of insulin resistance and pathogenesis of type 2 diabetes mellitus. J Cell Biochem. (2018) 119:105–10. doi: 10.1002/jcb.26174
58. Idriss, HT, and Naismith, JH. Tnfα and the Tnf receptor superfamily: structure-function relationship (S). Microsc Res Tech. (2000) 50:184–95. doi: 10.1002/1097-0029(20000801)50:3<184::AID-JEMT2>3.0.CO;2-H
59. Luo, X, Zhang, W, He, Z, Yang, H, Gao, J, Wu, P, et al. Dietary vitamin C intake is associated with improved liver function and glucose metabolism in Chinese adults. Front Nutr. (2022) 8:779912. doi: 10.3389/fnut.2021.779912
60. O'Hara, E, Zaheer, R, Andrés-Lasheras, S, McAllister, TA, and Gruninger, RJ. Evaluating the liver abscess microbiota of beef cattle during a reduction in Tylosin supplementation shows differences according to abscess size and fraction. FEMS Microbiol Ecol. (2024) 100:002–12. doi: 10.1093/femsec/fiae002
61. Pinnell, LJ, and Morley, PS. The microbial ecology of liver abscesses in cattle. Vet Clin North Am Food Anim Pract. (2022) 38:367–81. doi: 10.1016/j.cvfa.2022.08.004
62. Pinnell, LJ, Whitlow, CW, Huebner, KL, Bryant, TC, Martin, J, Belk, KE, et al. Not all liver abscesses are created equal: the impact of Tylosin and antibiotic alternatives on bovine liver abscess microbial communities and a first look at Bacteroidetes-dominated communities. Front Microbiol. (2022) 13:882419. doi: 10.3389/fmicb.2022.882419
63. Staton, GJ, Sullivan, LE, Blowey, RW, Carter, SD, and Evans, NJ. Surveying bovine digital dermatitis and non-healing bovine foot lesions for the presence of Fusobacterium Necrophorum, Porphyromonas Endodontalis and Treponema Pallidum. Vet Rec. (2020) 186:450. doi: 10.1136/vr.105628
64. Huang, F, Lyu, B, Xie, F, Li, F, Xing, Y, Han, Z, et al. From gut to liver: unveiling the differences of intestinal microbiota in Nafl and Nash patients. Front Microbiol. (2024) 15:1366744. doi: 10.3389/fmicb.2024.1366744
65. Xin, F-Z, Zhao, Z-H, Liu, X-L, Pan, Q, Wang, Z-X, Zeng, L, et al. Escherichia Fergusonii promotes nonobese nonalcoholic fatty liver disease by interfering with host hepatic lipid metabolism through its own Msrna 23487. Cell Mol Gastroenterol Hepatol. (2022) 13:827–41. doi: 10.1016/j.jcmgh.2021.12.003
66. Mu, H-N, Zhou, Q, Yang, R-Y, Tang, W-Q, Li, H-X, Wang, S-M, et al. Caffeic acid prevents non-alcoholic fatty liver disease induced by a high-fat diet through gut microbiota modulation in mice. Food Res Int. (2021) 143:110240. doi: 10.1016/j.foodres.2021.110240
67. Figliuolo, VR, dos Santos, LM, Abalo, A, Nanini, H, Santos, A, Brittes, NM, et al. Sulfate-reducing Bacteria stimulate gut immune responses and contribute to inflammation in experimental colitis. Life Sci. (2017) 189:29–38. doi: 10.1016/j.lfs.2017.09.014
68. Cao, S-Y, Zhao, C-N, Xu, X-Y, Tang, G-Y, Corke, H, Gan, R-Y, et al. Dietary plants, gut microbiota, and obesity: effects and mechanisms. Trends Food Sci Technol. (2019) 92:194–204. doi: 10.1016/j.tifs.2019.08.004
69. Zhou, J, Zhang, Q, Zhao, Y, Zou, Y, Chen, M, Zhou, S, et al. The relationship of Megamonas species with nonalcoholic fatty liver disease in children and adolescents revealed by metagenomics of gut microbiota. Sci Rep. (2022) 12:22001. doi: 10.1038/s41598-022-25140-2
70. Dai, L, Tang, Y, Zhou, W, Dang, Y, Sun, Q, Tang, Z, et al. Gut microbiota and related metabolites were disturbed in ulcerative colitis and partly restored after Mesalamine treatment. Front Pharmacol. (2021) 11:620724. doi: 10.3389/fphar.2020.620724
71. Ji, Y, Yang, Y, and Wu, Z. Programming of metabolic and autoimmune diseases in canine and feline: linkage to the gut microbiome. Microb Pathog. (2023) 185:106436. doi: 10.1016/j.micpath.2023.106436
72. Luecke, SM, Holman, DB, Schmidt, KN, Gzyl, KE, Hurlbert, JL, Menezes, ACB, et al. Whole-body microbiota of newborn calves and their response to prenatal vitamin and mineral supplementation. Front Microbiol. (2023) 14:1207601. doi: 10.3389/fmicb.2023.1207601
73. Xiao, H, Sun, X, Lin, Z, Yang, Y, Zhang, M, Xu, Z, et al. Gentiopicroside targets Paqr3 to activate the Pi3k/Akt signaling pathway and ameliorate disordered glucose and lipid metabolism. Acta Pharm Sin B. (2022) 12:2887–904. doi: 10.1016/j.apsb.2021.12.023
74. Sutherland, TE, Dyer, DP, and Allen, JE. The extracellular matrix and the immune system: a mutually dependent relationship. Science. (2023) 379:eabp8964. doi: 10.1126/science.abp8964
75. Sproston, NR, and Ashworth, JJ. Role of C-reactive protein at sites of inflammation and infection. Front Immunol. (2018) 9:754. doi: 10.3389/fimmu.2018.00754
76. Rowe, CJ, Nwaolu, U, Salinas, D, Hong, J, Nunez, J, Lansford, JL, et al. Inhibition of focal adhesion kinase 2 results in a macrophage polarization shift to M2 which attenuates local and systemic inflammation and reduces heterotopic ossification after Polysystem extremity trauma. Front Immunol. (2023) 14:1280884. doi: 10.3389/fimmu.2023.1280884
Keywords: liver, microbiota, RNA sequence, histomorphology, glycerol, vitamins, pig
Citation: Sun W, Deng L, Zou W, Wei P, Hao S, Wu H, Lu W and He Y (2025) Effects of dietary glycerol, vitamin C and niacinamide supplementation on liver of growing-finishing pigs. Front. Vet. Sci. 12:1620128. doi: 10.3389/fvets.2025.1620128
Edited by:
Kang Xu, Chinese Academy of Sciences (CAS), ChinaReviewed by:
Yawei Fu, Chinese Academy of Sciences (CAS), ChinaWeiguo He, Cornell University, United States
Copyright © 2025 Sun, Deng, Zou, Wei, Hao, Wu, Lu and He. This is an open-access article distributed under the terms of the Creative Commons Attribution License (CC BY). The use, distribution or reproduction in other forums is permitted, provided the original author(s) and the copyright owner(s) are credited and that the original publication in this journal is cited, in accordance with accepted academic practice. No use, distribution or reproduction is permitted which does not comply with these terms.
*Correspondence: Yuyong He, d2xraDEwMTJAMTYzLmNvbQ==