 Soo Jeong Park1†
 Tran Xuan Ngoc Huy
 Suk Kim
 Beomjin Park
- 1Institute of Animal Medicine, College of Veterinary Medicine, Gyeongsang National University, Jinju, Gyeongsangnam-do, Republic of Korea
- 2Hanaro Veterinary Clinic, Daedong, Daejeon, Republic of Korea
- 3Department of Information and Statistics, Gyeongsang National University, Jinju, Gyeongsangnam-do, Republic of Korea
Objective: This study aims to evaluate the blood gas results in various rabbit disease models and to establish the reference interval of venous and arterial blood gas parameters for clinically healthy and diseased rabbits. The primary purpose of this study is to evaluate various disease effects on acid-base and electrolyte disturbance and to examine the clinical value of blood gas analysis in rabbits.
Methods: Two hundred rabbits with various breeds were included in the study. Rabbits were divided into dental, gastrointestinal, musculoskeletal, and urologic disease model groups and one clinically healthy group. Venous and arterial blood gas analyses were performed with a point-of-care blood gas analyzer, i-Smart 300 VET Blood Gas Analyzer (i-SENSE, Korea). The reference intervals for the blood gas results were established. Reference intervals for each diseased group were compared with a clinically healthy control group to analyze the disease's effect on blood gas values.
Results: Several acid-base and electrolyte derangements were confirmed. The dental disease model had lower pH (power of hydrogen), PCO2 (partial pressure of carbon dioxide), and HCO3 (bicarbonate) than the control group (p-values < 0.001 by t-tests for both pH and HCO3, and p-value < 0.01 by a t-test for arterial PCO2). The gastrointestinal disease model demonstrated hyponatremia and hypocalcemia compared to the control group, with the p-values < 0.01 by t-tests for both sodium and calcium. The musculoskeletal disease model had lower Hct (hematocrit) and HGB (hemoglobin) than the control (p-values < 0.01 by t-tests for both Hct and HGB). The urologic disease group did not have a statistically significant difference in the reference interval of blood gas results.
Conclusions: The results indicated that various disease models in rabbits alter blood gas values. Diseases in body systems correlated with acid-base and electrolyte regulation are more likely to induce blood gas derangements. However, blood gas evaluation in various rabbit diseases is limited. Further studies with more cases in equivalent distribution and other disease models are needed.
Clinical relevance: This study is the first to present the reference interval for venous and arterial blood gas results in various disease models of rabbits. Also, this study presented the clinical value of point-of-care blood gas analysis in rabbit diseases. Blood gas analysis has potential diagnostic and prognostic value on various rabbit diseases.
1 Introduction
Blood gas analysis is routinely employed in veterinary medicine to evaluate physiological parameters such as acid-base status and electrolyte balance, whose imbalances can indicate underlying disease processes that require immediate clinical attention (1, 2). Critical electrolytes, including sodium, chloride, potassium, and calcium, assessed through blood gas analysis, are essential for maintaining physiological homeostasis, including fluid balance and cellular electrochemical gradients; imbalances in these parameters can pose severe risks and necessitate prompt clinical intervention (2).
Blood gas analyses can be performed using either venous or arterial blood samples, each reflecting distinct physiological states and diagnostic utility. Venous blood primarily reflects tissue-level oxygenation and cellular metabolic status, making it particularly suitable for assessing acid-base balance at the cellular level and evaluating tissue perfusion. In contrast, arterial blood analysis remains the golden standard for accurately assessing oxygenation and pulmonary ventilation, providing precise measurements of partial pressure of oxygen (PO2), partial pressure of carbon dioxide (PCO2), and oxygen saturation of hemoglobin (SO2) (3, 4). Consequently, arterial blood samples are routinely employed in clinical settings to monitor patients with respiratory disorders or those undergoing anesthesia (2).
The pH measurement in blood gas analysis indicates the severity of acid-base disturbances, with a normal reference value around 7.4 in humans, dogs, and rabbits (4). Classification of acid-base disorders as metabolic, respiratory, or mixed relies on evaluating bicarbonate (HCO3) and PCO2, facilitating identification of primary etiologies and compensatory mechanisms. Respiratory disturbances typically arise from dysfunction in the respiratory system or related neurological, muscular, or hematologic disorders, as the respiratory system primarily regulates homeostasis by controlling the levels of PO2 and PCO2 through pulmonary gas exchange. Conversely, metabolic disturbances generally stem from gastrointestinal, urinary, hepatic, or endocrine pathologies because electrolyte and pH homeostasis is predominantly maintained by electrolyte absorption and excretion via the gastrointestinal and urinary systems (3).
Rabbits often exhibit non-specific clinical signs and are particularly vulnerable to electrolyte disturbances due to limited compensatory renal function and complex gastrointestinal physiology (5). Additionally, blood parameters in rabbits are influenced by breed, sex, and age (5). Despite the widespread utilization of rabbits in laboratory research, most reported blood gas reference values derive from specific biomedical models without adequate consideration of breed, sex, or underlying disease (4). Studies conducted on clinically healthy New Zealand White rabbits constitute a significant portion of existing literature (6). Venous blood gas analysis has been performed in rabbits experiencing specific conditions such as pregnancy (7), pneumoperitoneum (8), and gastric stasis or dilation (9). Arterial blood gas studies in conscious rabbits (10) and those under anesthesia (11) or mechanical ventilation (12) have underscored the value of this method in evaluating respiratory function.
Comprehensive blood gas data across various rabbit breeds, compared to other companion species such as dogs and cats, remain scarce (4–6). Research explicitly evaluating the influence of diseases on both arterial and venous blood gas parameters is notably limited. Furthermore, established reference intervals for blood gas variables vary among veterinary species (6), highlighting the necessity of tailored reference standards for rabbits.
The present study aims to enhance the clinical applicability of blood gas analysis in rabbits by examining both healthy and clinically diseased subjects, thereby assessing the impact of gastrointestinal, urologic, dental, and musculoskeletal diseases on acid-base and electrolyte parameters. Additionally, this research aims to establish robust reference intervals for blood gas measurements, taking into consideration potential variability in these parameters associated with clinical factors, including sex and blood sample type.
Conducted on a substantial sample size comprising 200 rabbits encompassing diverse breeds, sexes, blood sample types, and clinical disease categories, this study seeks to deliver comprehensive clinical assessments. These comparative evaluations and the generated reference intervals reflecting multiple clinical factors will provide foundational data crucial for the development of laboratory-based diagnostic criteria and prognostic markers in rabbit medicine.
2 Materials and methods
2.1 Study design and animals
A total of 200 domestic rabbits (126 males, 74 females), weighing between 1.5 and 4.5 kg, were admitted to Hanaro Veterinary Clinic (Daejeon, Republic of Korea) from August 1, 2024, to January 31, 2025. Breeds were selected based on their prevalence in research and common usage as pets. The breeds included Mongrel, Lionhead, Lop Eared, Mixed, Dwarf, Dutch, Rex, and New Zealand White rabbits. Mongrels were most frequently represented (n = 72), followed by Lionheads (n = 65), Lop Eared (n = 22), Mixed breeds (n = 18), and Dwarfs (n = 10).
Rabbits were classified into five groups: one clinically healthy control group (Normal) and four groups with clinically evident diseases. The disease groups included gastrointestinal (GI), dental (Dn), musculoskeletal (Mus), and urologic (Uro) conditions. The detailed distribution of rabbits according to disease group, sex, and blood sample type is summarized in Table 1.
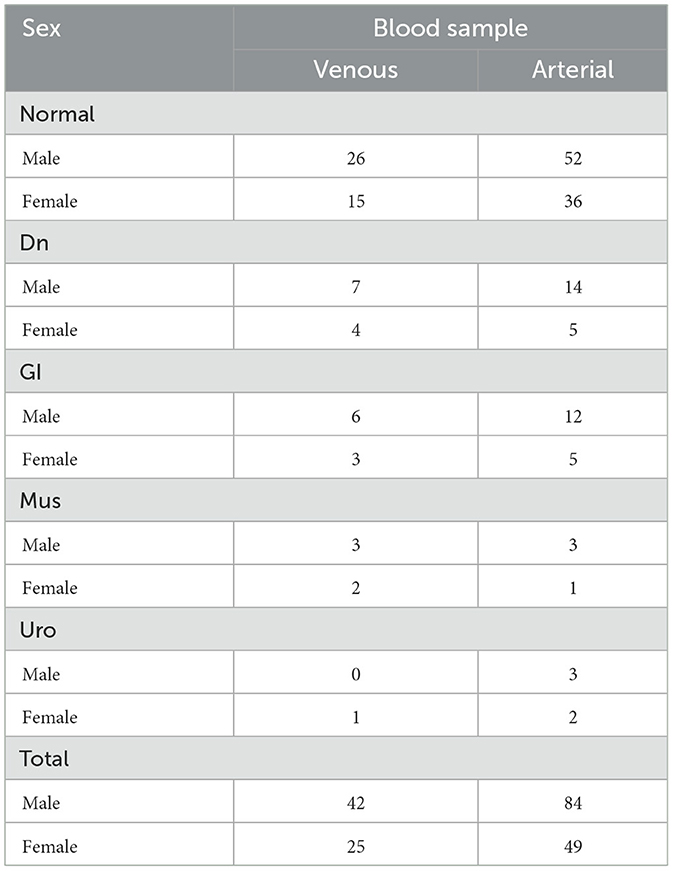
Table 1. Number of rabbits according to the disease group, sex, and blood sample.
2.2 Sample collection
Rabbits were sedated using isoflurane administered via face mask to minimize stress and pain during the sampling procedure. Isoflurane sedation is routinely employed due to its minimal influence on blood gas and biochemical parameters, thus accurately reflecting the animal's physiological status at the time of sample collection (3, 4). Subsequently, anesthesia was induced in all rabbits using intravenous sodium pentobarbital (25 mg/kg) administered through the ear vein. The adequacy of anesthesia was confirmed by assessing the absence of a response to painful stimuli. Blood samples were then anaerobically collected from either the central auricular artery or marginal ear vein. A total volume of 0.5 ml of arterial or venous blood was obtained using a preheparinized syringe fitted with a 27-gauge needle and immediately processed for blood gas analysis. Following blood collection, rabbits were closely monitored to ensure complete recovery from sedation. No adverse effects were observed in any rabbits post-procedure.
2.3 Blood gas analysis
Blood gas analyses were performed using the i-Smart 300 VET Blood Gas Analyzer (i-SENSE, Korea), a device recognized for its accuracy and reliability within veterinary practice (13). This point-of-care analyzer was chosen due to its widespread application in veterinary medicine and its capability to deliver prompt results (13). Calibration and quality control procedures were strictly followed according to the manufacturer's guidelines to ensure the accuracy and validation of the obtained measurements. Parameters evaluated are summarized in Table 2. Blood gas analyses were conducted immediately following blood collection, and results were available within minutes, allowing for rapid assessment of each rabbit's physiological condition.
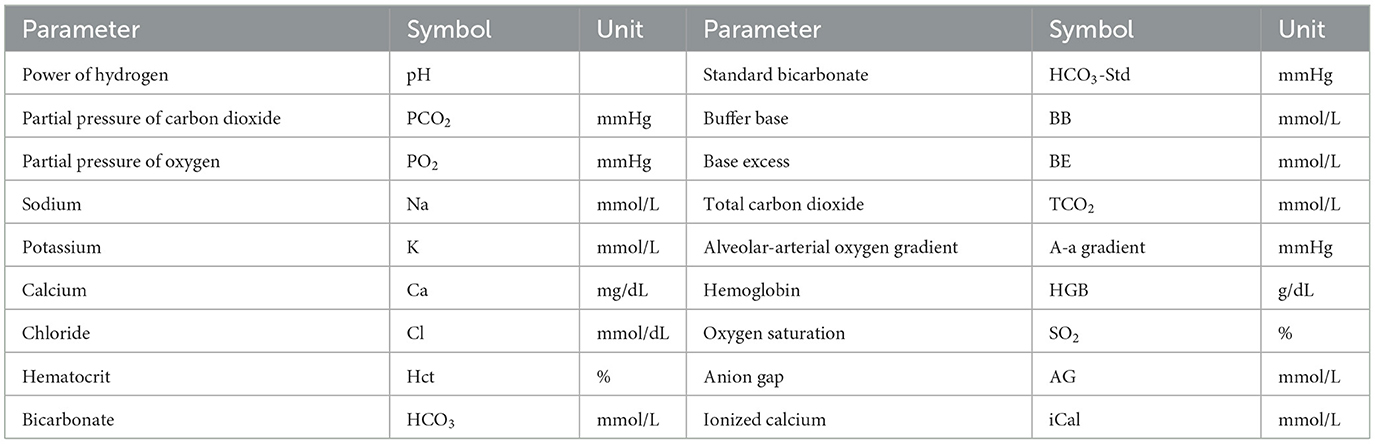
Table 2. Evaluated blood gas parameters with corresponding symbols and measurement units.
2.4 Statistical analysis
All statistical analyses were performed using R software version 4.4.1 (R Project for Statistical Computing), employing the MASS package (version 7.3-65) to perform Box-Cox transformations and the referenceIntervals (version 1.3.1) for the determination of reference intervals. Prior to statistical analysis, all collected data were thoroughly inspected to identify potential outliers, which were generally defined as data points significantly deviating beyond specific standard deviations from the mean. Any identified outliers were excluded from subsequent analyses. While the removal of outliers generally changes statistical results, their inclusion can introduce inaccuracies in the determination of reference intervals (14). To enhance the reliability and validity of the findings, Horn's method (14) was employed to detect multiple outliers within the dataset. Additionally, rabbit cases containing incomplete or missing values were also excluded from the analysis to prevent potential bias. Only cases with complete datasets were included in the final analysis.
2.4.1 Identifying distributional differences
All measurements were collected with consideration of specific factors, including sex, blood sample type, and disease category. However, in the absence of significant distributional differences related to a given factor, combining data across related categories can enhance statistical power and precision in establishing reference intervals. To identify potential distributional differences in measurements, the two-sample Kolmogorov-Smirnov test was employed, comparing distributions across sexes and blood sample types within each disease group. The Kolmogorov-Smirnov test assumes that the measurements are independent and identically distributed samples drawn from continuous distributions (15). These assumptions, generally considered weak conditions, were met by all measurements in this study.
Due to the diverse measurements analyzed, multiple statistical tests were anticipated, increasing the possibility of type I errors. To mitigate this risk, the significance level was adjusted using the Bonferroni correction (16). Additionally, samples from rabbits with musculoskeletal and urologic diseases were excluded from this analysis because of insufficient sample sizes.
2.4.2 Analysis of reference interval
Reference intervals for physiological measurements were established using samples obtained from normal, healthy rabbits. Based on preliminary analyses, specific parameters, including PCO2, PO2, TCO2, SO2, and HCO3, were analyzed separately for arterial and venous blood samples. A-a gradient was analyzed exclusively for arterial samples.
Reference intervals are commonly established through two statistical approaches: parametric and non-parametric. The parametric approach assumes that the data follow a specific probability distribution, commonly a normal distribution. This assumption is utilized to define the interval that contains a given probability, such as 0.95, under the assumed probability distribution. In contrast, the non-parametric approach derives the reference interval from sample quantiles, which are calculated based on the empirical distribution.
The non-parametric approach is advantageous because it does not require assumptions about the underlying distribution. However, it is generally recommended for use when the number of reference individuals within a group is large, typically at least 120 (17, 18). Moreover, if there is sufficient statistical evidence suggesting that the data adheres to a specific distribution, the parametric approach is more suitable because it provides asymptotically more efficient estimates compared to the non-parametric approach. Therefore, following the guidelines established in (18), the choice between parametric and non-parametric methods was based on the following criteria: the non-parametric approach was employed when the sample size is at least equal to 120; otherwise, the parametric approach is utilized if the data was found to be normally distributed by the Shapiro-Wilk test. If the data was not normally distributed, the data was transformed with a Box-Cox transformation. In instances where the Box-Cox transformation was ineffective, the robust method in (19) was applied.
2.4.3 Comparison of reference intervals between healthy and disease groups
The reference intervals derived in this study were compared against intervals covering the majority of measurements obtained from diseased subjects. For the purpose of clarity and consistency with terminology previously established in (20), intervals determined from healthy populations are referred to as “healthy-associated reference intervals,” whereas those pertaining specifically to diseased groups are designated as “disease-associated reference intervals.” It is important to recognize, as previously highlighted in (21), that reference intervals may not inherently be optimal tools for disease diagnosis. By statistical design, ~5% (or 10%, depending upon the selected probability threshold) of clinically healthy individuals may fall outside established reference intervals. Moreover, established reference intervals do not account for the sensitivity necessary for the identification of specific diseases, potentially limiting their clinical utility in diagnostic applications. Nevertheless, comparative analysis between healthy-associated and disease-associated intervals offers valuable insights into disease-induced variations in specific parameters. Such analysis aids not only in enhancing differential diagnostic accuracy but also informs subsequent clinical management decisions and therapeutic interventions.
Disease-associated reference intervals were generated utilizing methodologies consistent with those employed for healthy populations. Furthermore, statistical comparisons were made between healthy and diseased groups by evaluating the 90% confidence intervals (CIs) of reference limits and conducting t-tests accompanied by Levene's test for homogeneity of variance to identify statistically significant differences.
3 Results
3.1 Identifying distributional differences
All measurements derived from arterial and venous blood samples across disease categories showed no statistically significant differences between sexes, as evaluated at a significance level of 0.05. Nonetheless, specific measurements exhibited statistically significant differences between arterial and venous samples when stratified by sex and disease category. Particularly, in data analysis from clinically healthy subjects, statistically significant differences were identified in the distributions of PCO2, PO2, and SO2.
Figures 1A–E illustrate the distributions of measurements for which statistically significant distributional differences were identified by blood sample type and sex within clinically healthy individuals. The figure distinctly shows varying distribution patterns according to blood sample type. In particular, as shown in Figures 1B, E, PO2 and SO2 measurements were predominantly higher in arterial samples compared to venous samples, whereas PCO2, shown in Figure 1A, was generally elevated in venous samples relative to arterial samples. Furthermore, the variability of these measurements differed between arterial and venous samples; for example, PO2 values in venous samples were concentrated within a relatively narrow range compared to those in arterial samples, while SO2 values in arterial samples clustered within the 95%−100% but spanned a broader range of 60%−98% in venous samples. These observed distributional differences highlight the necessity for separate clinical interpretations of arterial and venous blood gas parameters, as failing to distinguish between these sample types may introduce bias and lead to artificially widened reference interval estimates.
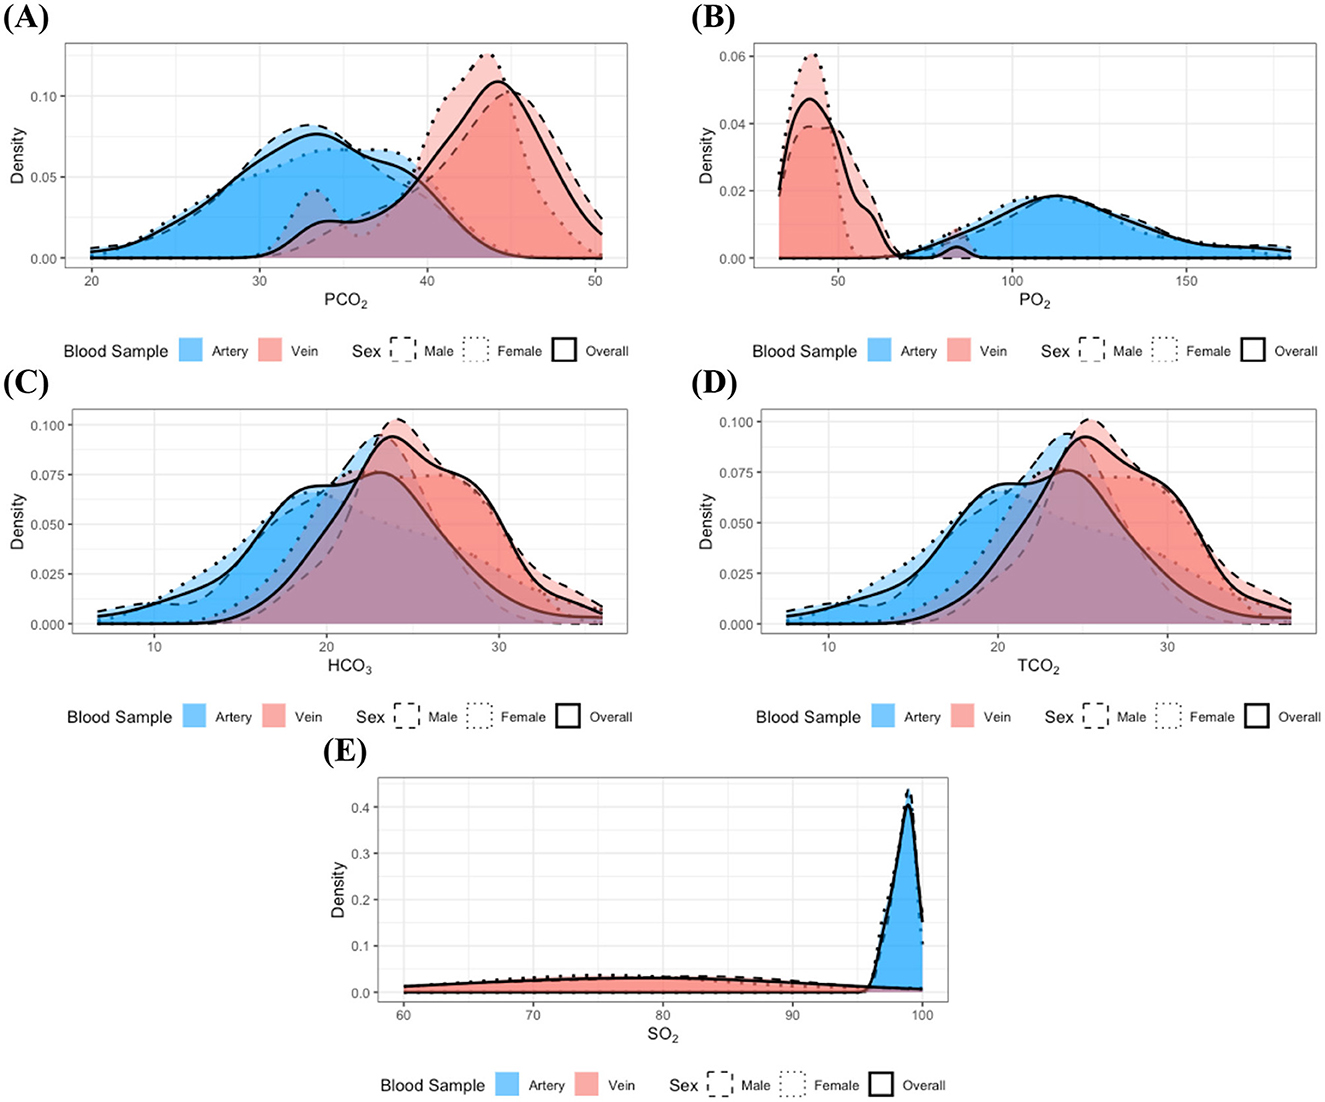
Figure 1. Distributions of the measurements with identified statistically significant distributional differences in the clinically healthy group: (A) PCO2, (B) PO2, (C) HCO3, (D) TCO2, and (E) SO2. Dashed, dotted, and solid lines correspond to distributions for male, female, and the combined group, respectively. Red and blue colors denote arterial and venous samples. All distributions were estimated using the kernel density estimation method. The overall distributions obtained by pooling data across sexes closely resemble the distributions of each individual sex group, indicating no significant distributional differences according to sex. In contrast, notable differences in the distributions of measurement are evident between arterial and venous samples.
Although HCO3 and TCO2 did not achieve statistical significance, their p-values closely approached the Bonferroni-adjusted significance level. Moreover, elevated values of HCO3 and TCO2 (Figures 1C, D) were more frequently observed in venous samples compared to arterial samples. These findings suggest that the distributions of HCO3 and TCO2 may also differ between blood sample types. Furthermore, examination of Figure 1 indicates that most of the measurements approximate a normal distribution, and the observed similarity in distributions between sexes supports the findings from previous analyses.
In the study of individuals with dental disease, stratified analyses of measurements by blood sample type and sex did not reveal any statistically significant differences in distribution. This absence of significant findings could be attributed to the small sample size of the dental disease group, which may result in a lack of statistical power to detect true differences. To further investigate this, subsequent integration of data by sex, informed by prior analytical results, led to the identification of statistically significant differences in the distributions of the same measurements as analyzed in the healthy group, depending on blood sample type. Moreover, the results depicted in Figure 2 further corroborate these findings. The distributions of PO2 and SO2 (Figures 2B, E) indicate that the majority of values observed in venous samples did not overlap with those found in arterial samples. Additionally, PO2 measurements in arterial samples exhibited greater variability compared to venous samples, whereas SO2 values in venous samples had a larger variance than those in arterial samples. On the other hand, for PCO2 (Figure 2A), lower measurement values were more frequently observed in arterial samples compared to venous samples. Furthermore, high measurement values of HCO3 and TCO2 constituted a larger proportion of observations in venous samples than in arterial samples (see Figures 2C, D).
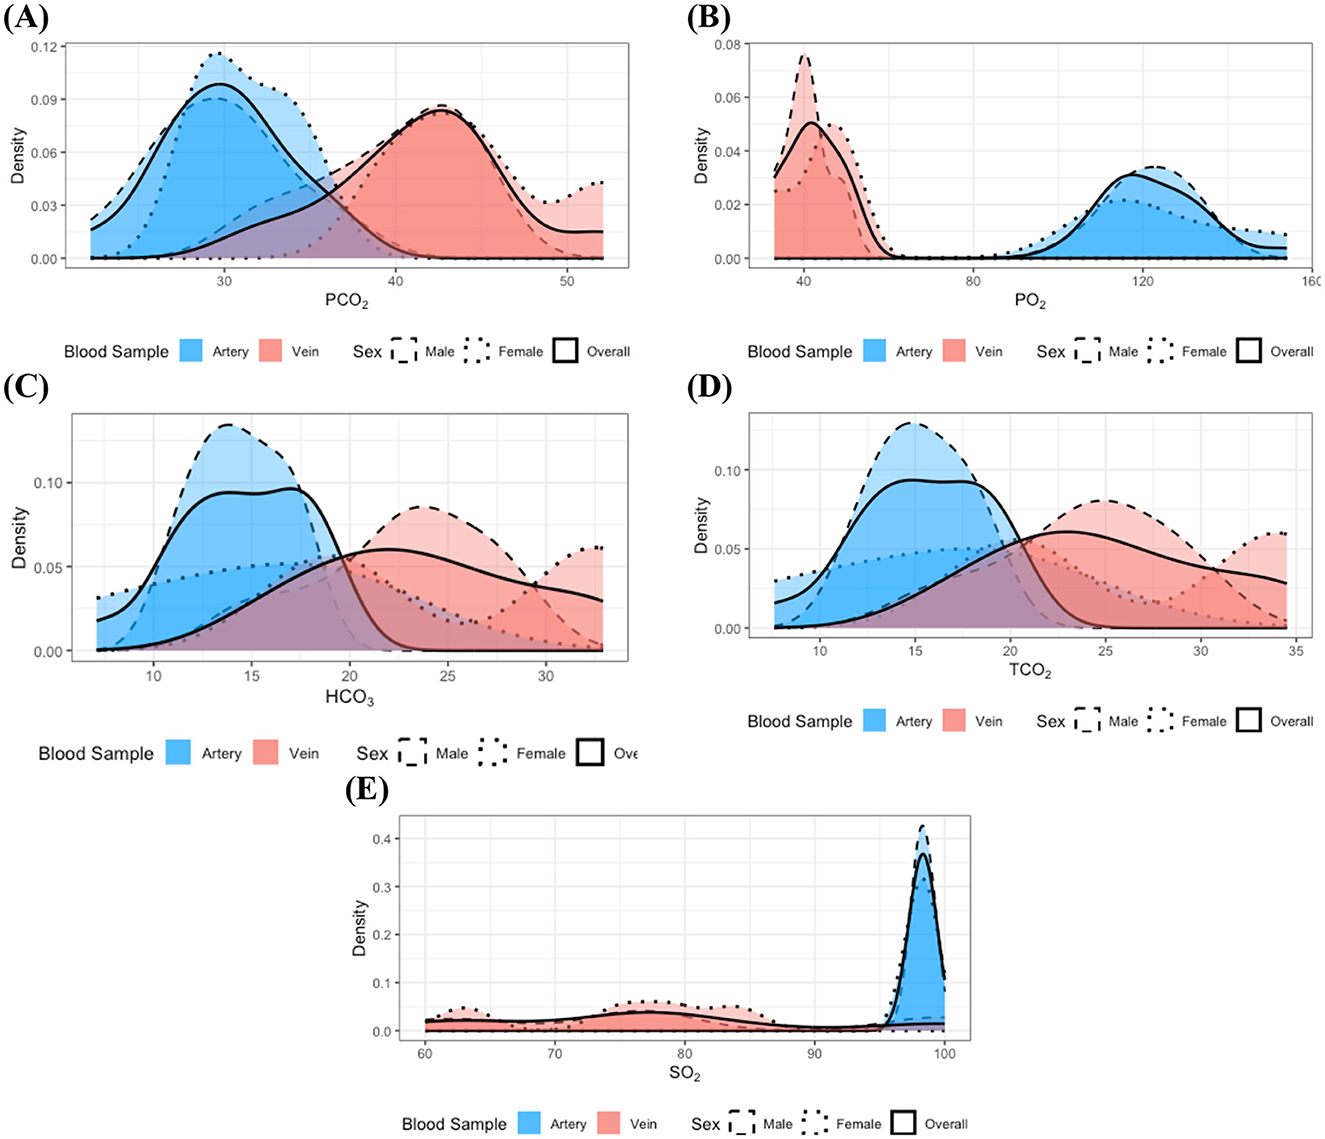
Figure 2. Distributions of the measurements with identified statistically significant distributional differences in the dental disease group: (A) PCO2, (B) PO2, (C) HCO3, (D) TCO2, and (E) SO2. Dashed, dotted, and solid lines correspond to distributions for male, female, and the combined group, respectively. Red and blue colors denote arterial and venous samples. All distributions were estimated using the kernel density estimation method. Although clear sex-specific distributional differences are not readily apparent in these measurements, pronounced differences between arterial and venous sample types are evident.
In the analysis of individuals classified within the gastrointestinal disease group, no statistically significant differences were observed in the distributions of all measurements, even following the integration of samples by sex. Nevertheless, it is important to remain cautious regarding measurements previously identified as exhibiting distributional differences because of the relatively small sample size within this group. Consistent with the findings in the clinically healthy and dental disease groups, the distributions of PO2 and SO2 (Figures 3B, E) appeared bimodal, with each mode corresponding to a distinct blood sample type; a similar bimodal distribution was also observed for PCO2 (Figure 3A). In contrast, the distributions of HCO3 and TCO2 (Figures 3C, D) did not exhibit clear bimodality but were characterized by a greater concentration of lower values in arterial samples. These observations suggest that distributional differences in these measurements may still exist in the gastrointestinal disease group.
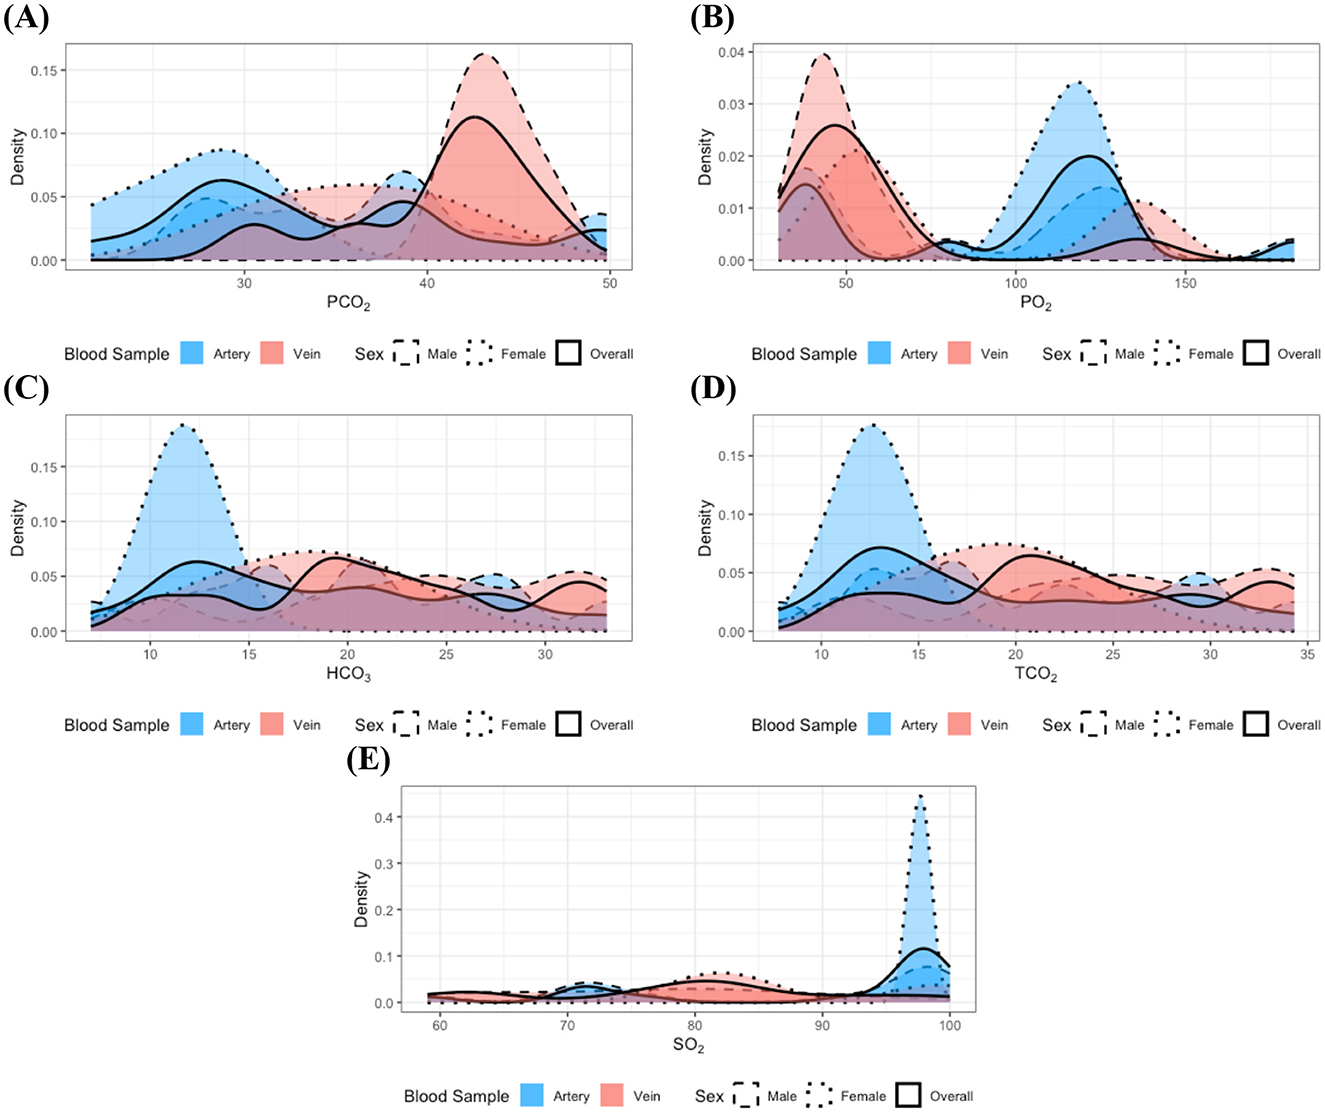
Figure 3. Distributions of the measurements with identified statistically significant distributional differences in the gastrointestinal disease group: (A) PCO2, (B) PO2, (C) HCO3, (D) TCO2, and (E) SO2. Dashed, dotted, and solid lines correspond to distributions for male, female, and the combined group, respectively. Red and blue colors denote arterial and venous samples. All distributions were estimated using the kernel density estimation method. Although the limited sample size in the gastrointestinal disease group makes it challenging to clearly delineate the distributional patterns, potential differences according to blood sample type can still be inferred.
The sample sizes in the musculoskeletal and urologic disease groups were insufficient to achieve the statistical power necessary for the Kolmogorov-Smirnov test to detect significant distributional differences. Despite this limitation, the previous findings suggest a hypothesis that the distributions of several measurements—specifically PCO2, PO2, HCO3, TCO2, and SO2–may vary based on blood sample types in these disease groups. Accordingly, subsequent analyses were conducted with data stratified by blood sample type for these specific measurements in the musculoskeletal and urologic disease groups.
3.2 Analysis of reference interval
The 95% reference intervals for blood gas parameters, along with summarized descriptive statistics, are presented in Table 3. The reference intervals for arterial samples established in the current study closely correspond to those previously reported by (10). Minor observed discrepancies may be attributed to variations in samples and differences in the statistical methods employed to estimate the reference intervals. For example, in this study, the reference interval for arterial PCO2 was estimated using the parametric approach based on observation suggesting that PCO2 followed a normal distribution and the sample size was <120. In contrast, the non-parametric approach was utilized in (10). A notable advancement of the present study compared to previous investigations is the establishment of reference intervals for both arterial and venous blood samples. Providing these intervals confers practical advantages by diminishing the requirement for selectively targeting specific blood vessels during sampling, thus simplifying clinical procedures.
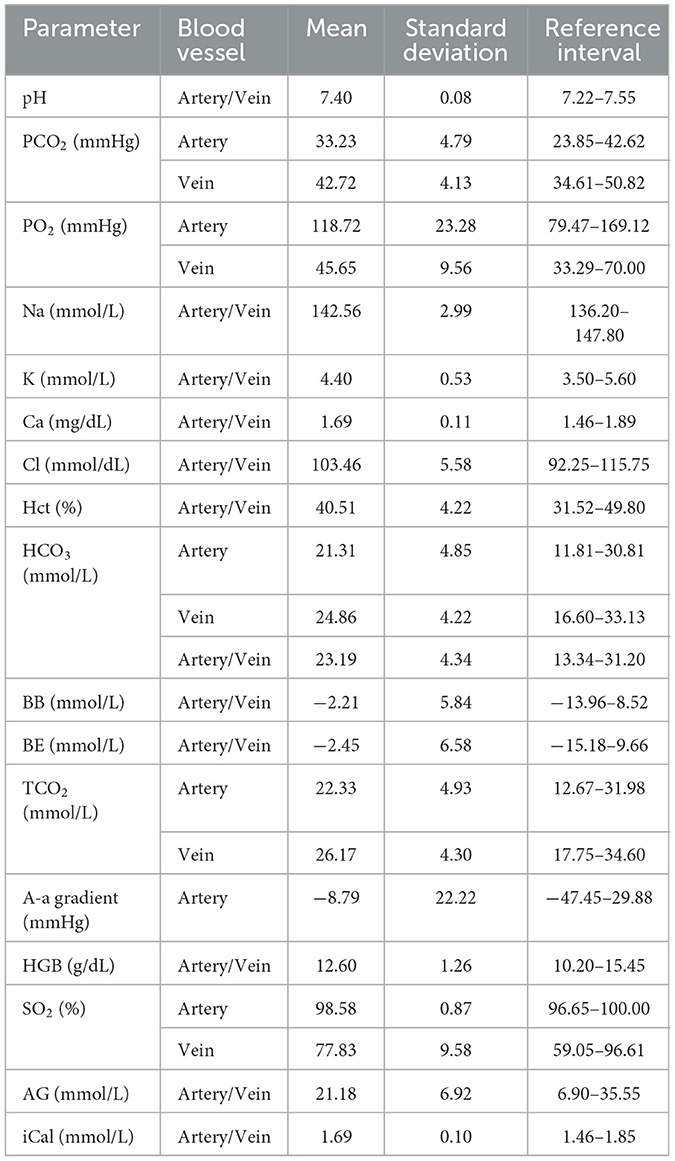
Table 3. 95% reference intervals and summary statistics for blood gas parameters in the clinically healthy group.
3.3 Comparison of reference intervals between healthy and disease groups
The estimated disease-associated reference intervals are detailed in Table 4. Analysis demonstrated that although some overlap existed between the heathy-associated and disease-associated reference intervals, several notable differences were identified. Specifically, both the lower and upper limits of the reference interval for pH in dental disease group were lower compared to those derived from the healthy group. Statistical analysis using a t-test along with Levene's test confirmed significant differences between the means of pH for the healthy and dental groups (p-value < 0.001). Moreover, the lower limit of the disease-associated reference interval was significantly lower compared to that of the healthy reference interval in terms of the 90% CIs. In addition, subjects within the dental disease group more frequently exhibited lower pH values relative to their healthy counterparts; specifically, ~23% of individuals exhibited pH measurements falling below the established lower reference limit for the clinically healthy group (see Figure 4A).
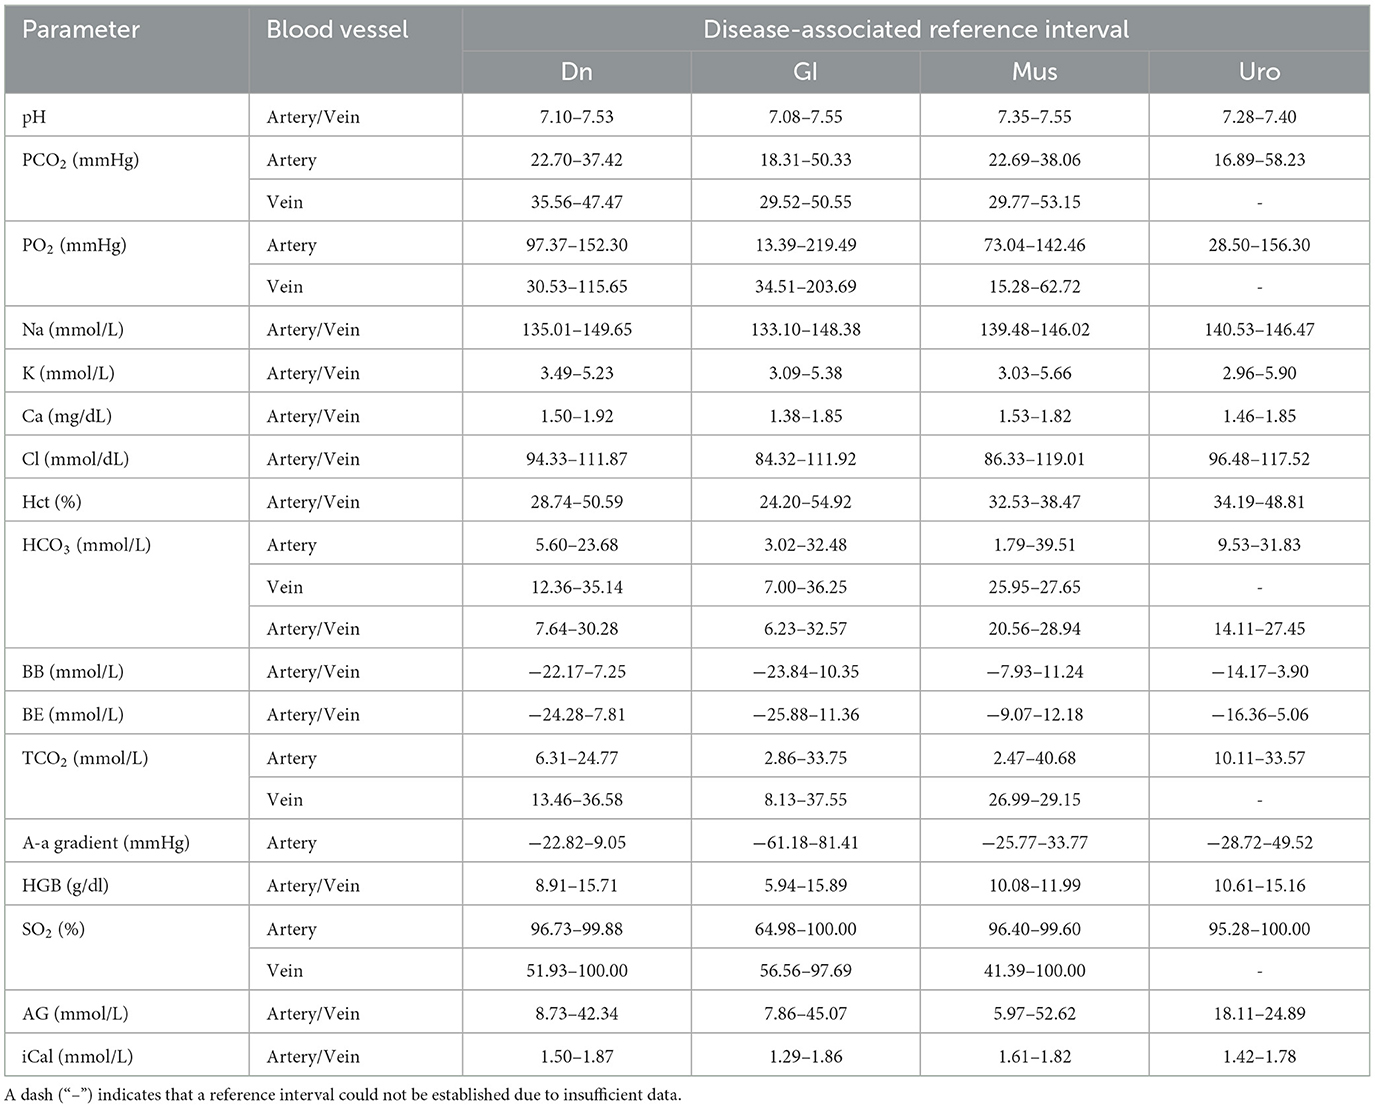
Table 4. 95% reference intervals for blood gas parameters according to disease groups.
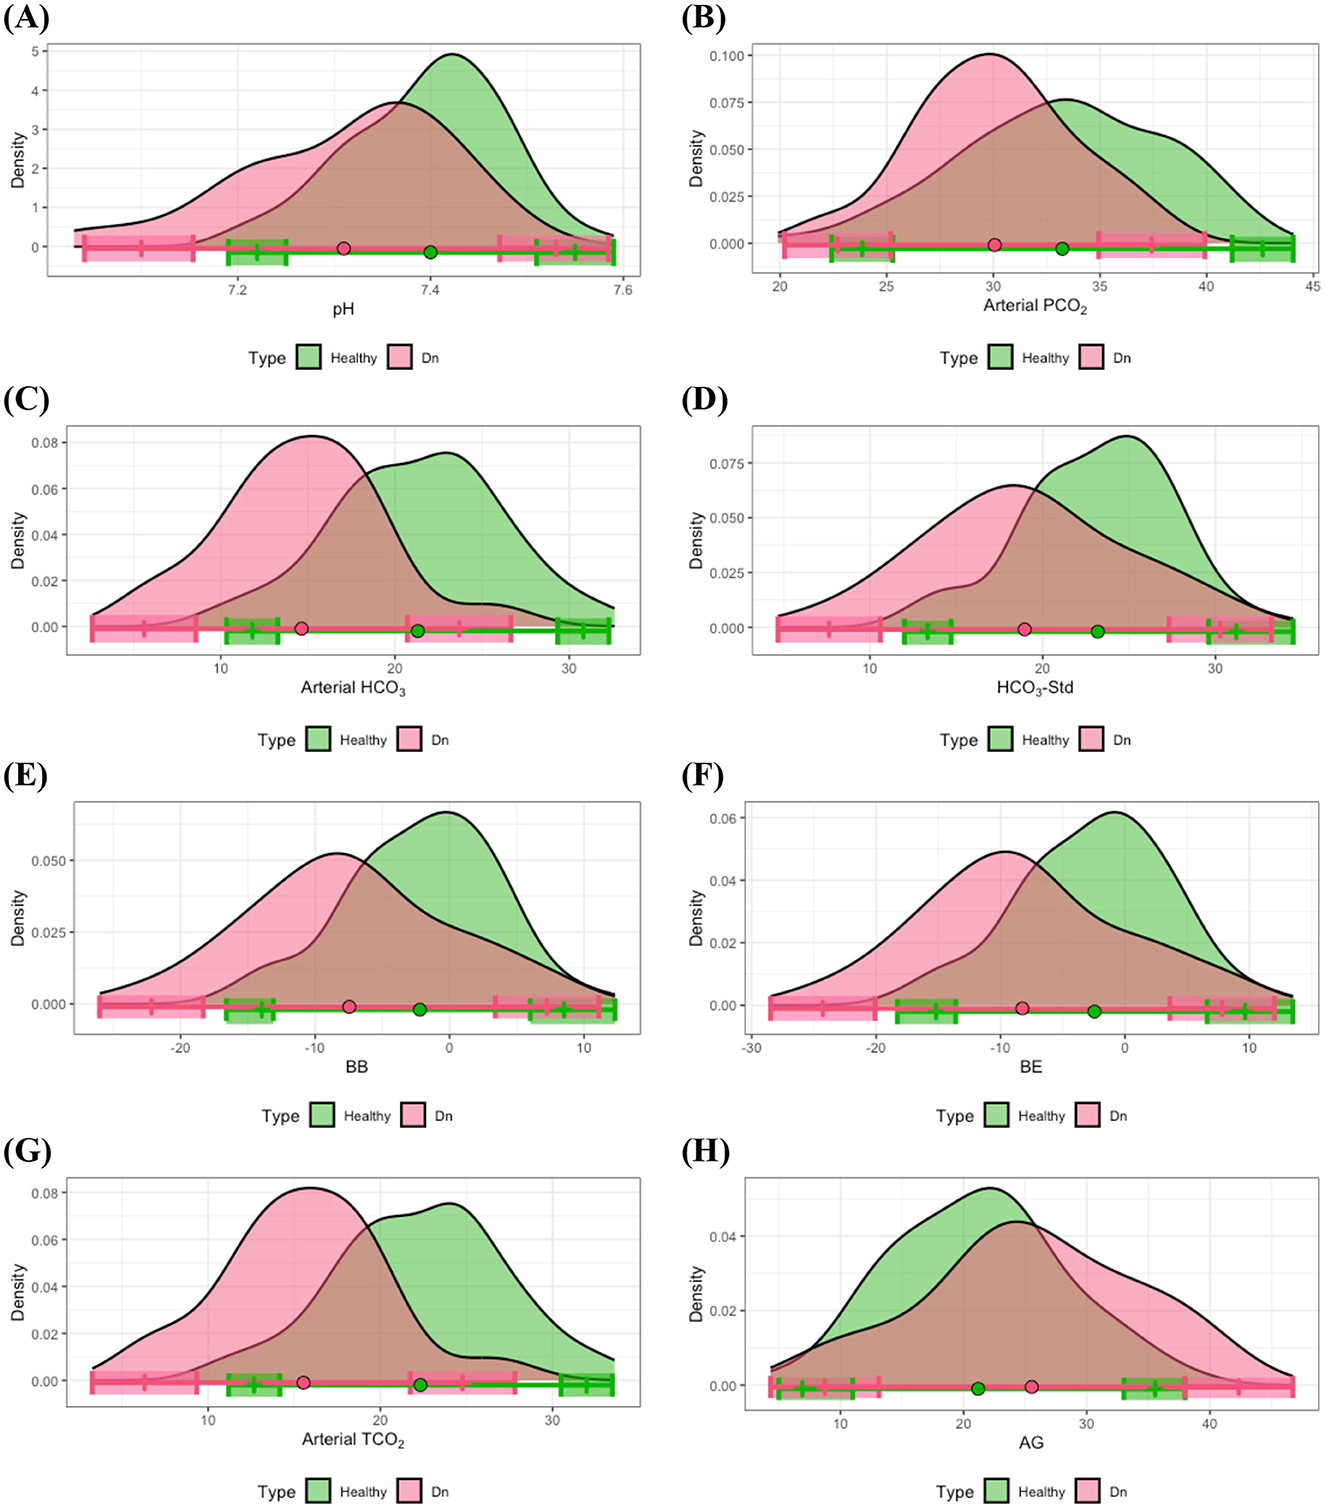
Figure 4. Distributional comparisons and reference intervals for clinically healthy and dental disease groups: (A) pH, (B) arterial PCO2, (C) arterial HCO3, (D) HCO3-Std, (E) BB, (F) BE, (G) arterial TCO2, and (H) AG. Colored dots represent the mean values for each group, while shaded regions denote the 90% CIs of the respective reference limits. Notably, at least one of the 90% CIs for either the lower or upper reference interval limits is non-overlapping between the healthy and dental disease groups, signifying significant differences in reference intervals between these groups.
Further differences in reference intervals for the dental disease group were observed in arterial PCO2, arterial HCO3, HCO3-Std, BB, BE, arterial TCO2, and AG. T-tests substantiated that the mean values of these parameters significantly differed from those in the healthy group, with all corresponding p-values < 0.01. Additionally, significant differences were noted in at least one of the lower or upper limits of the reference intervals between healthy and dental groups. As illustrated in Figures 4B–H, individuals within the dental disease group commonly exhibited lower values for arterial PCO2, arterial HCO3, HCO3-Std, BB, BE, and arterial TCO2 compared to healthy subjects, whereas AG levels were frequently higher in dental disease subjects than in their healthy counterparts.
Another notable observation concerned sodium levels. Specifically, in the gastrointestinal disease group, the lower limit of the reference interval for Na was substantially lower compared to the healthy group (Figure 5B). A t-test indicated a statistically significant difference between the means of these groups, and the distribution of Na in the gastrointestinal disease group demonstrated a heavy left tail, suggesting that gastrointestinal disease subjects frequently presented with lower Na concentrations. Similarly, the lower limits of the reference intervals for pH, Ca, Cl, HCO3-Std, and iCal were also reduced in the gastrointestinal disease group compared to healthy controls. The result from the t-tests, combined with the comparison of 90% CI of the reference limits and the distribution patterns shown in Figures 5A, C–F, indicated that gastrointestinal disease patients commonly presented with reduced levels of pH, Ca, Cl, HCO3-Std, and iCal levels relative to healthy individuals.
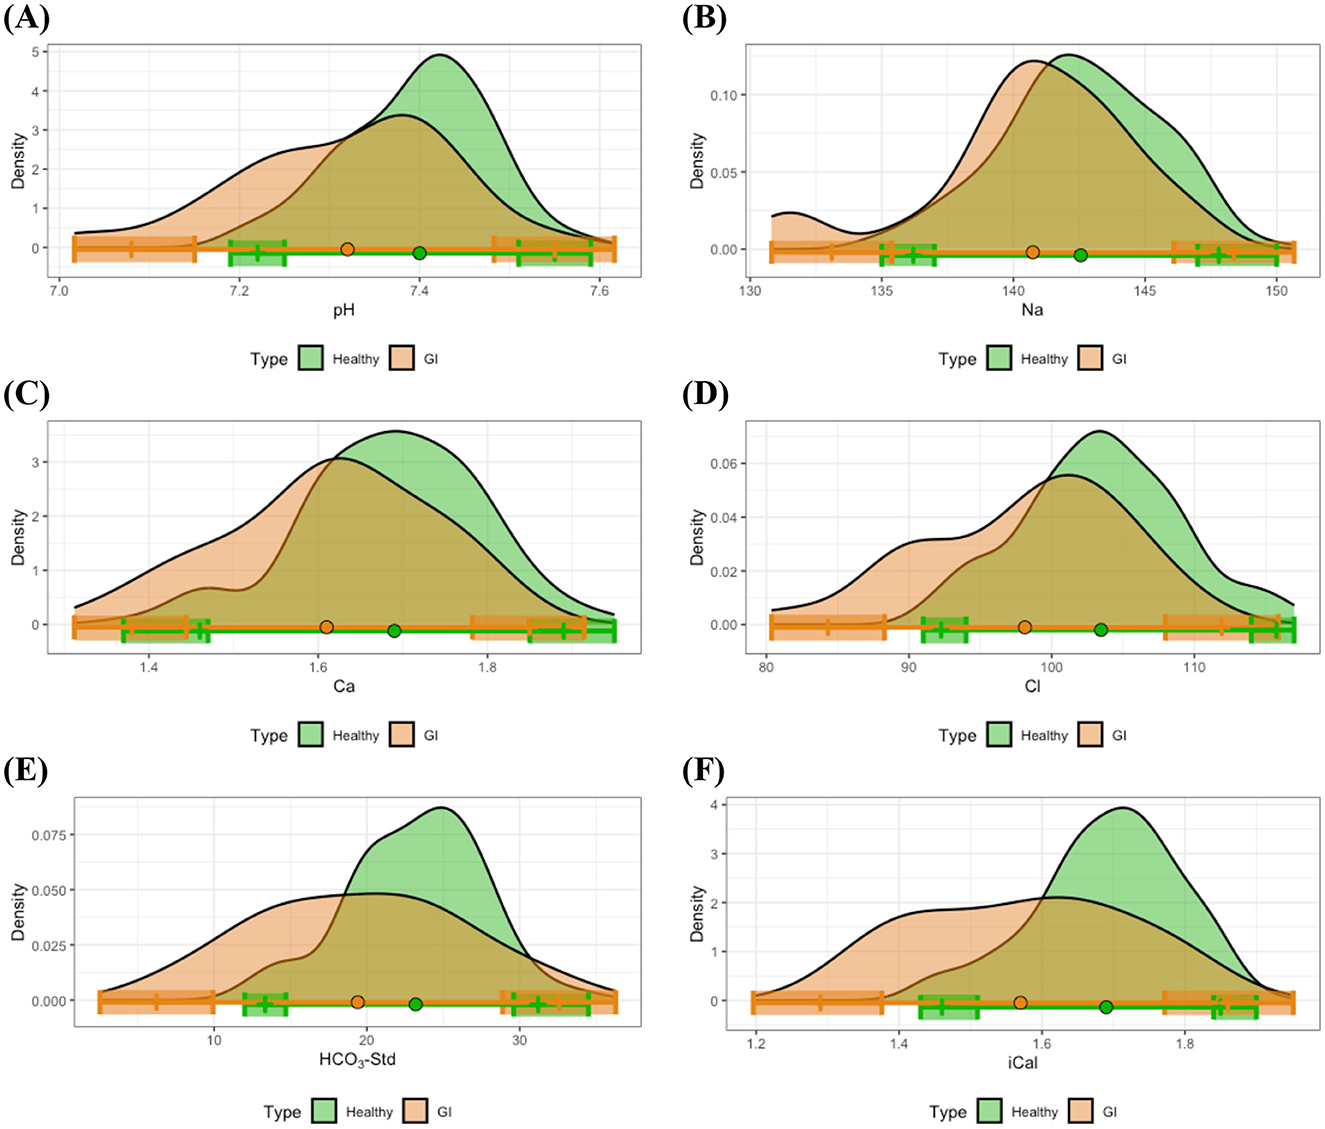
Figure 5. Distributional comparisons and reference intervals for clinically healthy and gastrointestinal disease groups: (A) pH, (B) Na, (C) Ca, (D) Cl, (E) HCO3-Std, and (F) iCal. Colored dots represent the mean values for each group, while shaded regions denote the 90% CIs of the respective reference limits. For the majority of measurements, at least one of the 90% CIs for either the lower or upper reference interval limits does not overlap between the healthy and gastrointestinal disease groups, indicating statistically significant differences in reference intervals between these groups.
In contrast to other disease groups, the musculoskeletal disease group exhibited distinct differences from the healthy group regarding Hct and HGB. Specifically, as depicted in Figures 6A, B, most individuals in the musculoskeletal disease group presented with lower levels of Hct and HGB compared to the means observed in healthy individuals. Examination of the 90% CIs for reference limits demonstrated significantly reduced upper limits for Hct and HGB within the musculoskeletal disease group relative to healthy controls. Statistical analysis using t-tests further confirmed significant differences between the means of these measurements for the musculoskeletal and healthy groups.
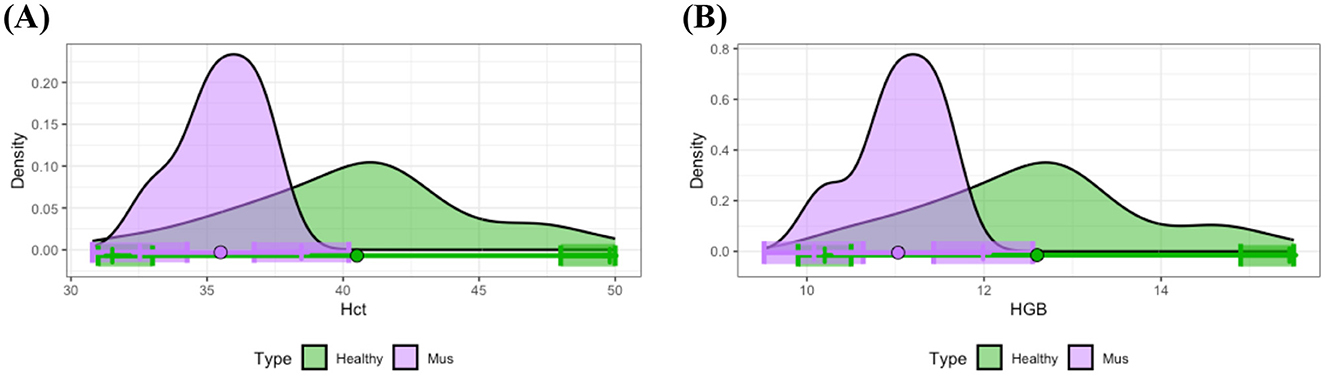
Figure 6. Distributional comparisons and reference intervals for clinically healthy and musculoskeletal disease groups: (A) Hct and (B) HGB. Colored dots represent the mean values for each group, while shaded regions denote the 90% CIs of the respective reference limits. For each parameter, at least one of the 90% CIs for either the lower or upper reference interval limits does not overlap between the healthy and musculoskeletal disease groups, thereby demonstrating statistically significant differences in reference intervals between these groups.
In the urological disease group, no statistically significant differences were identified in measured parameters compared to the healthy group. This is likely attributed to the small sample size of rabbits with urological disease, resulting in reduced statistical power for detecting group differences.
4 Discussion
This study established reference intervals for venous and arterial blood gas analysis parameters in both healthy and diseased rabbits. Rabbits with dental, gastrointestinal, musculoskeletal, and urological disease models were evaluated and compared to the healthy control group. Distributional analysis according to the blood sample revealed higher PO2 and lower PCO2 in the arterial blood. These findings align with previous veterinary reports involving dogs, cats, and rabbits (3, 4). The observed differences are attributed to gas exchange processes occurring in the pulmonary circulation, leading to higher PO2 and lower PCO2 values in arterial blood (3). Specifically, the established reference intervals of PCO2 for healthy rabbits in this study, with the mean values of 33.23 mmHg in arterial blood and 42.72 mmHg in venous blood, closely matched previously reported values (4, 10).
Rabbits diagnosed with dental disease exhibited lower levels of pH, PCO2, HCO3, HCO3-Std, BB, BE, and TCO2 compared to clinically healthy rabbits, indicative of metabolic acidosis. Frequently, values below the established normal ranges were observed within the dental disease group. Dental disease is prevalent in rabbits and commonly results in clinical signs such as anorexia, hypersalivation, gastrointestinal stasis, and the potential spread of periodontal infection to adjacent anatomical areas (22, 23). Bicarbonate loss following hypersalivation in dental disease could explain the results in this study, as metabolic acidosis following hypersalivation has been demonstrated in equine and bovine studies (24). Additionally, anorexia induces metabolic acidosis in rabbits (9). Anorexia causes hypoglycemia, which results in lipolysis through beta-oxidation, producing ketone bodies, which cause ketoacidosis. Also, lipid deposits in the liver develop hepatic lipidosis (23, 25).
Oral flora is maintained by acid-base adaptation, and dental diseases are associated with disturbances in oral pH (26). However, whether acid-base disturbances in oral flora caused by dental disease can precipitate systemic disturbances in the bloodstream remains unclear. In studies involving humans and dogs, the association between dental disease and systemic inflammatory response syndrome (SIRS) has been speculated, wherein the translocation of periodontal bacteria into the bloodstream induces systemic inflammation (27). SIRS is frequently accompanied by severe metabolic acidosis (27). However, the extent of the reduction of pH and bicarbonate in this study was not as extreme as that of SIRS.
Previous research has demonstrated a plausible connection between periodontal disease and renal pathology. In canine studies, dental disease has been identified as a possible risk factor for the development of chronic kidney disease (28). Furthermore, clinical reports in human medicine have indicated a potential link between dental disease and renal tubular acidosis (29). Renal tubular function plays a pivotal role in maintaining electrolyte and acid-base homeostasis through the regulated reabsorption and excretion of hydrogen ions and bicarbonate. Consequently, dental diseases that impact renal function can hypothetically result in alterations in blood gas parameters due to impaired acid-base and electrolyte regulation. However, evidence supporting a relationship between dental disease and renal dysfunction in rabbits remains lacking.
The findings of the present study contrast with those reported in previous literature. Earlier research demonstrated that rabbits with advanced dental disease exhibited reduced serum calcium concentrations (22). In addition, rabbits diagnosed with acquired dental disease showed evidence of hypocalcemia accompanied by elevated serum parathyroid hormone levels (22). These alterations have been attributed to osteodystrophy and impaired calcification processes affecting both bone and dental tissues, which are implicated in the pathogenesis of acquired dental disease in rabbits (22). Consistently, studies conducted in humans and rats have also reported associations between dietary calcium intake and dental health, wherein inadequate calcium intake was linked to an increased incidence of periodontal disease (30).
Several studies have investigated the sequelae of gastrointestinal disease in rabbits. Diarrhea in rabbits is commonly associated with dehydration and hypokalemia due to gastrointestinal fluid losses (23). Additionally, appendicitis in rabbits has been reported to cause hypocalcemia and hypoglycemia (31). Gastrointestinal stasis—also referred to as gastrointestinal syndrome—has been linked to metabolic acidosis (9). Hyponatremia has been identified as a negative prognostic indicator in gastrointestinal syndrome, and both electrolyte and acid-base imbalances have been shown to progressively worsen in the absence of timely medical intervention (9). In this study, acid-base imbalance within the gastrointestinal disease group was evidenced by decreased values of both pH and standard bicarbonate. In addition, rabbits in the gastrointestinal disease group demonstrated significantly lower serum concentrations of sodium, chloride, and calcium when compared to the clinically healthy control group. These findings regarding electrolyte derangements are consistent with those reported in previous studies (9, 31).
One of the potential mechanisms contributing to the development of metabolic acidosis in rabbits with gastrointestinal disease is hepatic lipidosis. Hepatic lipidosis is a common complication of gastrointestinal stasis (25). Also, any gastrointestinal tract disease causing anorexia develops hepatic lipidosis, especially for obese rabbits or rabbits having high-fat diets. In the absence of adequate nutritional intake, free fatty acids are mobilized and metabolized in the liver as alternative energy substrates to glucose and volatile fatty acids. This metabolic shift leads to the production of ketone bodies, which, when elevated, result in ketoacidosis (23).
However, small animals, including dogs and cats, have several different blood gas values that result from gastrointestinal disease. Acid-base disturbance related to the gastrointestinal system depends on the primary manifestation of the disease. Diarrhea results in metabolic acidosis by bicarbonate loss, whereas vomiting results in metabolic alkalosis due to the loss of hydrogen ions (32, 33). The gastrointestinal tract, especially the jejunum, is highly permeable to absorb sodium, potassium, and chloride (32). Therefore, hyponatremia, hypokalemia, and hypochloremia may frequently occur as a consequence of loss throughout the gastrointestinal tract (2). However, gastrointestinal disease rarely alters calcium, which is mainly associated with renal, endocrine disease, or malignancy (34).
The pathophysiological mechanisms linking musculoskeletal disease to acid-base or electrolyte imbalances remain poorly understood. Diagnostic evaluation of musculoskeletal disorders generally relies on specific biomarkers rather than blood gas parameters, as the musculoskeletal system is not primarily involved in the regulation of acid-base balance and electrolyte homeostasis, unlike the gastrointestinal, urologic, and respiratory systems. In equine medicine, a field in which musculoskeletal disorders are particularly prevalent, commonly utilized biomarkers include creatinine kinase and serum aspartate aminotransferase (35). Studies with musculoskeletal disease models in rabbits revealed several pathognomonic serum biomarkers, such as C-telopeptide of type II collagen, bone morphogenic protein 2, and cartilage oligomeric matrix protein (36).
Therefore, it is logical to conclude that the results of the musculoskeletal disease model in this study are clinically insignificant. The musculoskeletal disease model in this study showed lower levels of Hct and HGB compared to healthy rabbits. The observed decrease in Hct may indicate anemia or fluid shifts; however, its specific clinical implications in musculoskeletal disorders remain unclear and require further investigation. The complete blood count analyzer remains the golden standard for hemoglobin measurement, as previous studies have indicated that point-of-care blood gas analyzer tends to underestimate hemoglobin levels compared to standard measurements (37). Thus, reliance solely on blood gas values is not recommended for decisions regarding transfusion or estimating blood loss (37). Given these findings, further research is necessary to determine if these hematologic changes are directly related or clinically meaningful in musculoskeletal disorders.
Research on acid-base disturbances or electrolyte imbalances in musculoskeletal disease has indicated that blood gas derangements are usually risk factors or causes rather than consequences. Studies in rabbits report higher potassium concentrations in venous compared to arterial blood (23). Metabolic causes of muscle weakness in rabbits include hypocalcemia and hypokalemia (23, 25). Rabbits on diets with unbalanced calcium-phosphorus ratios may develop nutritional osteodystrophy, driven by hypocalcemia and subsequent secondary hyperparathyroidism, leading to increased bone resorption, a known mechanism in metabolic bone disease pathogenesis (22, 23, 38). Certain skeletal disorders, such as osteolytic bone tumors, can induce electrolyte imbalance and hypercalcemia (38).
In human medicine, systemic acidosis adversely impacts bone and skeletal muscle, activating osteoclasts to increase bone resorption and inhibiting osteoblasts, reducing mineral deposition (39). Additionally, metabolic acidosis impairs skeletal muscle function and protein turnover, contributing to muscle wasting (40). Equine studies also document acid-base and electrolyte disturbances associated with muscular diseases, such as atypical myopathy, characterized by lactic acidosis, hyponatremia, hypochloremia, hyperkalemia, hyperphosphatemia, and hypocalcemia due to rhabdomyolysis (41). Exercise-induced electrolyte disturbances in equine species, such as hypokalemia from sweating and hyperkalemia from muscular potassium release, are also well-documented (23). Nevertheless, evidence regarding similar blood gas disturbances in musculoskeletal diseases, specifically in rabbits, remains limited.
Rabbits have distinctive urinary tract characteristics compared to other species. Calcium homeostasis in rabbits highly depends on urinary excretion, while dietary calcium absorption occurs primarily through the gastrointestinal tract. Rabbits exhibit higher and broader blood calcium ranges due to dietary calcium being absorbed passively, independent of Vitamin D3-mediated active transport typical in other mammals (38). Calcium excretion in rabbits predominantly occurs as calcium carbonate precipitate in urine, proportional to dietary intake. This renal excretion process is regulated by parathyroid hormone and 1,25-dihydroxyvitamin D (23, 38). However, rabbits exhibit lower renal tubular calcium reabsorption rates than dogs and humans (38).
Furthermore, rabbits possess limited renal capabilities in electrolyte and acid-base regulation. Their capacity to excrete hydrogen ions via urine is restricted due to two factors: rabbit renal tubular epithelium lacks carbonic anhydrase, which is essential for converting carbon dioxide to bicarbonate and subsequently excreting hydrogen ions; additionally, rabbits exhibit limited glutamine deamination, which is crucial for ammonium ion-mediated hydrogen ion excretion. Consequently, rabbits are highly vulnerable to metabolic acidosis (23).
In this study, rabbits with urological disease did not exhibit statistically significant differences compared to healthy controls, which is inconsistent with previous research (23, 25). Rabbit with acute kidney injury and chronic kidney disease results in hypercalcemia (25). Typically, chronic renal failure in rabbits reduces calcium excretion without impacting calcium absorption, thus causing hypercalcemia; however, this phenomenon was not observed in the current study. Chronic renal failure in rabbits may also lead to hyponatremia and hyperkalemia due to impaired renal concentrating ability, wherein rapid urine flow through renal tubules hinders effective sodium-potassium exchange, reducing potassium excretion (23).
Comparable electrolyte and acid-base disturbances occur in other species, such as dogs and cats, with urinary tract disorders. Typically, renal diseases induce metabolic acidosis through impaired bicarbonate reabsorption and elevated chloride levels, along with potential disturbances in sodium, potassium, and calcium concentrations (32).
This study is novel to analyze arterial and venous samples for blood gas analysis in the context of various breeds and disease models. Reference intervals were established for blood gas and electrolyte parameters in rabbits diagnosed with dental, gastrointestinal, urological, and musculoskeletal diseases, and these were systematically compared with values from a clinically healthy control group. This comparative approach enables the evaluation of disease-specific trends in acid-base and electrolyte disturbances. Current literature provides limited evidence regarding blood gas abnormalities associated with specific disease states in rabbits (9, 42). The clinical significance of the present study lies in its contribution to understanding the impact of various pathological conditions on the blood gas values of rabbits. This study will benefit in providing diagnostic clues and possible prognostic indicators for various rabbit diseases.
This study also provides validation for the use of a point-of-care blood gas analyzer in rabbits. Blood gas analysis serves as an essential diagnostic tool for assessing critically ill patients, as severe acid-base and electrolyte imbalances can have life-threatening consequences. Additionally, deviations in blood gas parameters may offer valuable insights into underlying pathological conditions. The utility of a point-of-care device lies in its capacity to deliver rapid, clinically actionable results. Previous studies have demonstrated that this point-of-care analyzer is validated for canine, feline, and bovine patients (13). However, data supporting its application in rabbits has been limited. Prior research in rabbits reported poor agreement between the point-of-care device and in-house reference analyzer, except for pH measurements, which remained consistent between both platforms (42). In the present study, blood gas values obtained from healthy rabbits using the i-Smart 300 VET Blood Gas Analyzer were consistent with previously reported reference data from an in-house analyzer. These findings suggest that the point-of-care device is reliable for the rabbit species.
There are several limitations in this study. First, the evaluation of disease groups had limitations. No specific diseases were stated for each group. Even diseases in the same body system can result in different blood gas values, and this study did not reveal those detailed variations within the same disease model. The clinical outcome of cases in the diseased group was also not stated. Critical disease states like sepsis, which causes significant changes in blood gas values, cannot be determined only with a single blood test method. Furthermore, this study compared disease and healthy groups regarding reference range, which does not examine individual values. While reference intervals provide a framework for evaluating general trends and parameter distributions, they do not allow for detailed analysis of individual variability or the detection of specific increases or decreases in individual values.
Second, the composition of the study sample presents certain limitations. The sample size and sex distribution were not uniform across the different disease groups, which may have introduced statistical bias. In particular, certain disease types, such as urologic disease, were represented by very small sample sizes. This limitation may have substantially reduced the statistical power to detect significant differences or distinct distributional patterns within their subgroups, as the sensitivity of statistical methods to discern such differences is largely dependent on the adequacy of sample size. Additionally, although rabbits from multiple breeds were included in the study, their representation was uneven across disease groups, and the analysis did not account for potential breed-related variation in blood gas parameters. Given that breed-specific physiological differences may exist, the uneven distribution of breeds could have introduced bias in the estimated reference intervals.
Finally, the selection of disease models in this study was limited. Arterial blood gas analysis is routinely used for monitoring anesthetic and ventilatory status, as well as for assessing respiratory function (10, 11). However, this study did not include a respiratory disease model. Blood samples were collected under light anesthesia, but this study did not consider the procedural effect of anesthesia or sedation on the blood gas value. Isoflurane, an inhalant anesthetic used in this study, is well known for inducing cardiovascular and respiratory depression in veterinary species, including rabbits (43). Due to isoflurane-induced hypoventilation, related blood gas values are likely to vary, potentially misleading the comparison between disease and healthy groups. Therefore, further research with more cases, equal distribution of cases within each group, other disease models, and anesthesia/sedation models known to affect blood gas is recommended.
Data availability statement
The raw data supporting the conclusions of this article will be made available by the authors, without undue reservation.
Ethics statement
The animal studies were approved by Institutional Animal Care and Use Committee (IACUC) of Gyeongsang National University (approval number: GNU-240802-B0155). The studies were conducted in accordance with the local legislation and institutional requirements. Written informed consent was obtained from the owners for the participation of their animals in this study.
Author contributions
SJP: Conceptualization, Investigation, Methodology, Writing – original draft, Writing – review & editing. SEC: Conceptualization, Investigation, Methodology, Writing – original draft, Writing – review & editing. TXNH: Validation, Visualization, Writing – original draft. SK: Conceptualization, Methodology, Supervision, Writing – original draft, Writing – review & editing. SHK: Investigation, Resources, Writing – original draft. BP: Formal analysis, Methodology, Software, Writing – original draft, Writing – review & editing.
Funding
The author(s) declare that financial support was received for the research and/or publication of this article. This work was supported by the National Research Foundation of Korea (NRF) grant funded by the Korea government (MSIT) (RS-2025-00520073) and the Glocal University 30 Project Fund of Gyeongsang National University in 2025.
Conflict of interest
The authors declare that the research was conducted in the absence of any commercial or financial relationships that could be construed as a potential conflict of interest.
Correction note
This article has been corrected with minor changes. These changes do not impact the scientific content of the article.
Generative AI statement
The author(s) declare that no Gen AI was used in the creation of this manuscript.
Publisher's note
All claims expressed in this article are solely those of the authors and do not necessarily represent those of their affiliated organizations, or those of the publisher, the editors and the reviewers. Any product that may be evaluated in this article, or claim that may be made by its manufacturer, is not guaranteed or endorsed by the publisher.
References
1. Villiers E, Ristic J. BSAVA Manual of Canine and Feline Clinical Pathology. 3rd ed. Gloucester: British Small Animal Veterinary Association (2016).
2. Silverstein DC, Hopper K. Small Animal Critical Care Medicine. 3rd ed. St. Louis, MO: Elsevier Saunders (2023).
3. Batemann SW. Making sense of blood gas results. Vet Clin North Am Small Anim Pract. (2008) 38:543–57. doi: 10.1016/j.cvsm.2008.01.002
4. Ardiaca M, Bonvehi C, Montesinos A. Point-of-care blood gas and electrolyte analysis in rabbits. Vet Clin North Am Exot Anim Pract. (2013) 16:175–95. doi: 10.1016/j.cvex.2012.10.005
5. Melillo A. Rabbit clinical pathology. J Exot Pet Med. (2007) 16:135–45. doi: 10.1053/j.jepm.2007.06.002
6. Özkan C, Kaya A, Akgül Y. Normal values of hematological and some biochemical parameters in serum and urine of New Zealand White rabbits. World Rabbit Sci. (2012) 20:253–9. doi: 10.4995/wrs.2012.1229
7. Barzago MM, Bortolotti A, Omarini D, Aramayona JJ, Bonati M. Monitoring of blood gas parameters and acid-base balance of pregnant and non-pregnant rabbits (Oryctolagus cuniculus) in routine experimental conditions. Lab Anim. (1992) 26:73–9. doi: 10.1258/002367792780745904
8. Sümpelmann R, Schuerholz T, Marx G, Härtel D, Hecker H, Ure BM, et al. Haemodynamic, acid-base and blood volume changes during prolonged low pressure pneumoperitoneum in rabbits. Br J Anaesth. (2006) 96:563–8. doi: 10.1093/bja/ael045
9. Brezina T, Fehr M, Neumüller M, Thöle M. Acid-base-balance status and blood gas analysis in rabbits with gastric stasis and gastric dilation. J Exot Pet Med. (2020) 32:18–26. doi: 10.1053/j.jepm.2019.11.001
10. Eatwell K, Mancinelli E, Hedley J, Benato L, Shaw DJ, Self I, et al. Use of arterial blood gas analysis as a superior method for evaluating respiratory function in pet rabbits (Oryctolagus cuniculus). Vet Rec. (2013) 173:166. doi: 10.1136/vr.101218
11. Benato L, Chesnel M, Eatwell K, Meredith A. Arterial blood gas parameters in pet rabbits anaesthetized using a combination of fentanyl-fluanisone-midazolam-isoflurane. J Small Anim Pract. (2013) 54:343–6. doi: 10.1111/jsap.12081
12. Sei K, Fujita M, Okawa S, Hirasawa T, Kushibiki T, Sasa H, et al. Appropriate timing of blood sampling for blood gas analysis in the ventilated rabbit. J Surg Res. (2016) 206:325–36. doi: 10.1016/j.jss.2016.08.007
13. Kim HJ, Lee HR, Park YS, Kyung SG, Do SH. Assessment of the accuracy and precision of the i-Smart 30 VET Electrolyte Analyzer in dogs, cats, cattle and pigs. Vet Clin Pathol. (2015) 44:410–9. doi: 10.1111/vcp.12267
14. Horn PS, Feng L, Li Y, Pesce AJ. Effect of outliers and nonhealthy individuals on reference interval estimation. Clin Chem. (2001) 47:2137–45. doi: 10.1093/clinchem/47.12.2137
15. Finner H, Gontscharuk V. Two-sample Kolmogorov–Smirnov-type tests revisited: old and new tests in terms of local levels. Ann Stat. (2018) 46:3014–37. doi: 10.1214/17-AOS1647
16. Bland JM, Altman DG. Multiple significance tests: the Bonferroni method. BMJ. (1995) 310:170. doi: 10.1136/bmj.310.6973.170
17. Geffré A, Concordet D, Braun JP, Trumel C. Reference value advisor: a new freeware set of macroinstructions to calculate reference intervals with Microsoft Excel. Vet Clin Pathol. (2011) 40:107–12. doi: 10.1111/j.1939-165X.2011.00287.x
18. Friedrichs KR, Harr KE, Freeman KP, Szladovits B, Walton RM, Barnhart KF, et al. ASVCP reference interval guidelines: determination of de novo reference intervals in veterinary species and other related topics. Vet Clin Pathol. (2012) 41:441–53. doi: 10.1111/vcp.12006
19. Horn PS, Pesce AJ, Copeland BE. A robust approach to reference interval estimation and evaluation. Clin Chem. (1998) 44:622–31. doi: 10.1093/clinchem/44.3.622
20. Mikkelsen G, Lillebo B, Faxvaag A. Disease-associated reference intervals for twenty laboratory tests in patients with rheumatoid arthritis, Crohn's disease or ulcerative colitis. Pract Lab Med. (2021) 25:e00225. doi: 10.1016/j.plabm.2021.e00225
21. Ozarda Y Sikaris K Streichert T Macri J IFCC IFCC Committee on Reference intervals and Decision Limits (C-RIDL). Distinguishing reference intervals and clinical decision limits–a review by the IFCC Committee on Reference Intervals and Decision Limits. Crit Rev Clin Lab Sci. (2018) 55:420–31. doi: 10.1080/10408363.2018.1482256
22. Harcourt-Brown FM, Baker SJ. Parathyroid hormone, haematological and biochemical parameters in relation to dental disease and husbandry in rabbits. J Small Anim Pract. (2001) 42:130–6. doi: 10.1111/j.1748-5827.2001.tb02009.x
24. Jaramillo-López E, Itza-Ortiz MF, Peraza-Mercado G, Carrera-Chávez JM. Ruminal acidosis: strategies for its control. Austral J Vet Sci. (2017) 49:139–48. doi: 10.4067/S0719-81322017000300139
25. Meredith A, Lord B. BSAVA Manual of Rabbit Medicine. Gloucester: British Small Animal Veterinary Association (2016).
26. Nyvad B, Takahashi N. Integrated hypothesis of dental caries and periodontal diseases. J Oral Microbiol. (2020) 12:1710953. doi: 10.1080/20002297.2019.1710953
27. Kouki MI, Papadimitriou SA, Kazakos GM, Savas I, Bitchava D. Periodontal disease as a potential factor for systemic inflammatory response in the dog. J Vet Dent. (2013) 30:26–9. doi: 10.1177/089875641303000103
28. Hall JA, Forman FJ, Bobe G, Farace G, Yerramilli M. The impact of periodontal disease and dental cleaning procedures on serum and urine kidney biomarkers in dogs and cats. PLoS ONE. (2021) 16:e0255310. doi: 10.1371/journal.pone.0255310
29. Ferreira SB, e Silva AC, Pereira PC, Della Coletta R, Júnior HM. Dental findings in patients with renal tubular acidosis. J Clin Pediatr Dent. (2016) 4:78. doi: 10.4103/2321-6646.194378
30. Nishida M, Grossi SG, Dunford RG, Ho AW, Trevisan M, Genco RJ. Calcium and the risk for periodontal disease. J Periodontol. (2000) 71:1057–66. doi: 10.1902/jop.2000.71.7.1057
31. Di Girolamo N, Petrini D, Szabo Z, Volait-Rosset L, Oglesbee BL, Nardini G, et al. Clinical, surgical, and pathological findings in client-owned rabbits with histologically confirmed appendicitis: 19 cases (2015-2019). J Am Vet Med Assoc. (2021) 260:82–93. doi: 10.2460/javma.20.08.0446
32. DiBartola SP. Fluid, Electrolyte, and Acid-Base Disorders in Small Animal Practice. St. Louis, MO: Elsevier Saunders (2012). doi: 10.1016/B978-1-4377-0654-3.00017-2
33. Lozano BA, Yankin I, Perry S, Rutter CR. Acid-base and electrolyte evaluation in dogs with upper GI obstruction: 115 dogs (2015-2021). J Small Anim Pract. (2023) 64:696–703. doi: 10.1111/jsap.13656
34. Creedon JMB, Davis H. Advanced monitoring and Procedures for Small Animal Emergency and Critical Care. 2nd ed. Wiley Blackwell. (2023).
35. Peat FJ, Kawcak CE. Musculoskeletal pathology. Vet Clin North Am Equine Pract. (2015) 31:407–24. doi: 10.1016/j.cveq.2015.04.003
36. Zuo H, Jiang L, Qu N, Wang J, Cui X, Yao W. The biomarkers changes in serum and the correlation with quantitative MRI markers by histopathologic evaluation of the cartilage in surgically-induced osteoarthritis rabbit model. PLoS ONE. (2015) 10:e0124717. doi: 10.1371/journal.pone.0124717
37. Gibert C, Mestrallet F, Desmurs L, Chardon L, Lours C, Nougier C. Hemoglobin determination with point-of-care testing, performance evaluation compared to central laboratory analyzers in transfusion decision, an in vitro and retrospective study. Int J Lab Hematol. (2023) 45:678–84. doi: 10.1111/ijlh.14102
38. Eckermann-Ross C. Hormonal regulation and calcium metabolism in the rabbit. Vet Clin North Am Exot Anim Pract. (2008) 11:139–52. doi: 10.1016/j.cvex.2007.09.002
39. Arnett TR. Extracellular pH regulates bone cell function. J Nutr. (2008) 138:415S−8S. doi: 10.1093/jn/138.2.415S
40. Ho JQ, Abramowitz MK. Clinical consequences of metabolic acidosis—muscle. Adv Chronic Kidney Dis. (2022) 29:395–405. doi: 10.1053/j.ackd.2022.04.010
41. Van Galen G, Cerri S, Porter S, Saegerman C, Lefere L, Roscher K, et al. Traditional and quantitative assessment of acid-base and shock variables in horses with atypical myopathy. J Vet Int Med. (2013) 27:186–93. doi: 10.1111/jvim.12003
42. Selleri P, Di Girolamo N. Point-of-care blood gases, electrolytes, chemistries, hemoglobin, and hematocrit measurement in venous samples from pet rabbits. J Am Anim Hosp Assoc. (2014) 50:305–14. doi: 10.5326/JAAHA-MS-6114
Keywords: blood gas analysis, reference interval, rabbit, disease models, acid-base, electrolyte
Citation: Park SJ, Cho SE, Huy TXN, Kim S, Kim SH and Park B (2025) Comparative evaluation of point-of-care blood gas analysis in rabbit disease models. Front. Vet. Sci. 12:1621912. doi: 10.3389/fvets.2025.1621912
Received: 02 May 2025; Accepted: 09 June 2025;
Published: 27 June 2025; Corrected: 28 October 2025.
Edited by:
Carlos Alberto Antunes Viegas, University of Trás-os-Montes and Alto Douro, PortugalReviewed by:
Ravikanthreddy Poonooru, University of Missouri, United StatesMusadiq Idris, Islamia University of Bahawalpur, Pakistan
Copyright © 2025 Park, Cho, Huy, Kim, Kim and Park. This is an open-access article distributed under the terms of the Creative Commons Attribution License (CC BY). The use, distribution or reproduction in other forums is permitted, provided the original author(s) and the copyright owner(s) are credited and that the original publication in this journal is cited, in accordance with accepted academic practice. No use, distribution or reproduction is permitted which does not comply with these terms.
*Correspondence: Beomjin Park, YmpwYXJrQGdudS5hYy5rcg==
†These authors have contributed equally to this work