 Junjie Guo1Xiaoqian Chen2
 Huiling Zhu2
 Kan Xiao2Yanbing Zhang3,4Shiwei Zhao3,4
 Guoshun Chen1
 Yulan Liu1,2*
- 1College of Animal Science and Technology, Gansu Agricultural University, Lanzhou, China
- 2Hubei Key Laboratory of Animal Nutrition and Feed Science, Wuhan Polytechnic University, Wuhan, China
- 3Shandong Zhongmu Feed Technology Co., Ltd., Binzhou, Shandong, China
- 4Shandong Crelipids Biotechnology Co., Ltd., Binzhou, Shandong, China
The proportion of n-6 and n-3 polyunsaturated fatty acid (PUFA) in commercial pig feed is severely unbalanced. This study was conducted to investigate the effects of different n-6/n-3 PUFA ratios on growth performance and lipid metabolism of nursery pigs. A total of 240 nursery pigs (Duroc × Large White × Landrace) were fed diets with different n-6/n-3 PUFA ratios, including 10:1, 5:1, 3:1, and 1.5:1. Pigs fed diet with n-6/n-3 PUFA ratio of 1.5:1 or 3:1 had optimum average daily gain and feed to gain ratio (p < 0.05). The levels of serum lipids including total cholesterol, triglyceride, high density lipoprotein and low density lipoprotein were the lowest in pigs fed diet with n-6/n-3 PUFA ratio of 1.5:1 (p < 0.05). The concentrations of serum insulin, adiponectin and leptin were the highest in pigs fed diet with n-6/n-3 PUFA ratio of 3:1 (p < 0.05). Pigs fed diet with n-6/n-3 PUFA ratio of 3:1 had the highest abundance of genes associated with fatty acid absorption and transportation (FATP4, and PPARγ), synthesis and storage (FAS and GPAT) and degradation (ATGL, HSL, and MAGL) in intestine (p < 0.05). Pigs fed diet with n-6/n-3 PUFA ratio of 1.5:1 had the lowest abundance of genes associated with fatty acid absorption (CD36 and FABP4), synthesis and storage (ACC, FAS, ACLY, PAP, AGPAT, and GPAT) and degradation (CPT1 and HSL) in gastrocnemius muscle (p < 0.05). The mRNA expression of genes associated with fatty acid metabolism (FATP2, FATP5, FABP1, FABP4, LPL, ACS, ACLY, AGPAT, GPAT, CPT1, ATGL, and MAGL) was up-regulated in liver and subcutaneous fat of pigs fed diet with n-6/n-3 PUFA ratios of 1.5:1–5:1 (p < 0.05). In summary, diets with lower n-6/n-3 PUFA ratios improve growth performance, reduce blood lipids, facilitate lipid metabolism in intestine, liver and subcutaneous fat, and inhibit fatty acid absorption, synthesis and storage in gastrocnemius muscle in pigs.
Introduction
Fatty acids are one of the body’s main sources of energy. Essential fatty acids, including n-3 polyunsaturated fatty acids (PUFA) and n-6 PUFA, cannot be synthesized from scratch by animal bodies and must be obtained from the diet to meet the demand. These two types of PUFA cannot convert to each other and have opposite physiological functions (1). It is well established that the oxidized lipids produced by n-6 PUFA can promote the release of inflammatory factors more than those produced by n-3 PUFA (2, 3). In addition, intake of a diet containing a high proportion of n-6/n-3 PUFA is associated with the development of diseases such as obesity, diabetes and angiocardiopathy (4, 5). It has been reported that dietary n-6 and n-3 PUFA have become severely unbalanced in humans over the past few decades, reaching 20:1 instead of 1:1 that was during evolution (6). Current commercial swine diets are rich in n-6 PUFA, with an n-6/n-3 PUFA ratio of 10:1, which is also considered not to be the optimal n-6/n-3 PUFA ratio (7). Among plant-derived oils, linseed oil exhibits the highest concentration of n-3 PUFAs, making it the most efficient option for modulating the dietary n-6/n-3 PUFA ratio (8). Therefore, an appropriate n-6/n-3 PUFA ratio is particularly important for growth and development of animals.
Animal growth and development are closely related to fat metabolism. Both n-6 PUFA and n-3 PUFA belong to long-chain PUFA, which are absorbed and metabolized slowly in mammals. The metabolic process of these fatty acids includes absorption and transportation, synthesis and storage, and decomposition and release of fatty acids (9). Free fatty acids are absorbed and transported into cells by the fatty acid transport protein (FATP) family and fatty acid translocase (FAT; CD36), and then transported to the smooth endoplasmic reticulum by fatty acid-binding protein (FABP) for fatty acid synthesis (10). The synthesis of fatty acids mainly includes monoacylglycerol acyltransferase (MGAT) pathway and glycerol 3 phosphate (G3P) pathway (11). The triglycerides (TAG) in gut are mainly synthesized by sn-2 monoacylglycerol and fatty acyl-CoA catalyzed by MGAT, accounting for about 80% (10). The G3P pathway mainly occurs in liver, skeletal muscle and adipose tissue cells, involving in key enzymes such as glycerol 3 phosphate acyltransferase (GPAT), acylglycerol 3 phosphate acyltransferase (AGPAT), phosphatidic acid phosphatase (PAP) and diacylglycerol acyltransferases (DGAT) (10, 12). Triglycerides stored in lipid droplets release three fatty acids under hydrolysis of adipose triglyceride lipase (ATGL), hormone sensitive lipase (HSL) and monoacylglycerol lipase (MAGL) (9). The β-oxidation process in mitochondria is the main mode of complete fat degradation, and the main rate-limiting enzyme in this process is carnitine palmitoyl transferase 1 (CPT1) (13). Previous studies have shown that diet enriched with n-3 PUFA can affect fatty acid metabolism in liver of Polish Landrace pig (14). It is well known that excess n-6 PUFA competes with n-3 PUFA in the same group of desaturases, elongases, and oxygenases to complete metabolism and is associated with the presence or development of obesity, inflammation, lipid toxicity, imbalance of lipid metabolism, and abnormal lipid accumulation (15, 16). However, limited data on how n-6/n-3 PUFA ratio affects the metabolism of fatty acids in the gut, liver, skeletal muscle, and adipose tissue.
To the best of our knowledge, while previous studies have extensively investigated fatty acid metabolism in finishing pigs, gestating sows, lactating sows, and suckling piglets, the nursery pig stage remains unexplored (1, 7, 17–20). The nursery phase represents a critical developmental window for pigs. The survival rate and growth performance of piglets in this phase significantly influence the economic efficiency of swine production. Thus, the purpose of this study was to determine the effect of different proportions of dietary n-6/n-3 PUFA on growth performance and lipid metabolism in nursery pigs. Our study will provide a new reference for the rational utilization of n-6 and n-3 PUFA in diets and for understanding the metabolism of fatty acids in nursery pigs.
Materials and methods
Animals and experimental design
All experimental procedures for nursery pigs in the present study were approved by the Animal Care and Use Committee of Wuhan Polytechnic University (Wuhan, China) (WPU202306006). A total of 240 male cross-bred pigs (Duroc × Large White × Landrace) with a similar initial weight of 7.89 ± 0.18 kg were obtained from Aodeng Agriculture and Animal Husbandry Technology Co., Ltd., Hubei, China. They were assigned to 4 groups using a randomized complete block design based on body weight, each consisting of 6 replicates of 10 pigs each. Ten piglets were raised in a 3 × 3 m pen with plastic slatted flooring to allow for natural waste removal. The pigs were fed one of corn-soybean meal-based diets containing 3% oil as follows: 3% soybean oil (Yihai Kerry Arawana Holdings Co., Ltd., Wuhan, China), 2.25% soybean oil and 0.75% linseed oil (Yihai Kerry Arawana Holdings Co., Ltd., Wuhan, China), 1.5% soybean oil and 1.5% linseed oil, and 3% linseed oil, resulting in dietary n-6/n-3 ratios of approximately 10:1, 5:1, 3:1, and 1.5:1, respectively. The composition and nutritional levels of the diets are shown in Table 1. The fatty acid composition of the diets is listed in Table 2. All pigs had ad libitum access to experimental diets and water for 28 days. On days 14 and 28 of the experiment, body weight of each piglet and feed intake of each pen were recorded, and average daily gain (ADG), average daily feed intake (ADFI) and feed to gain ratio (F/G) in each pen were calculated (n = 6).
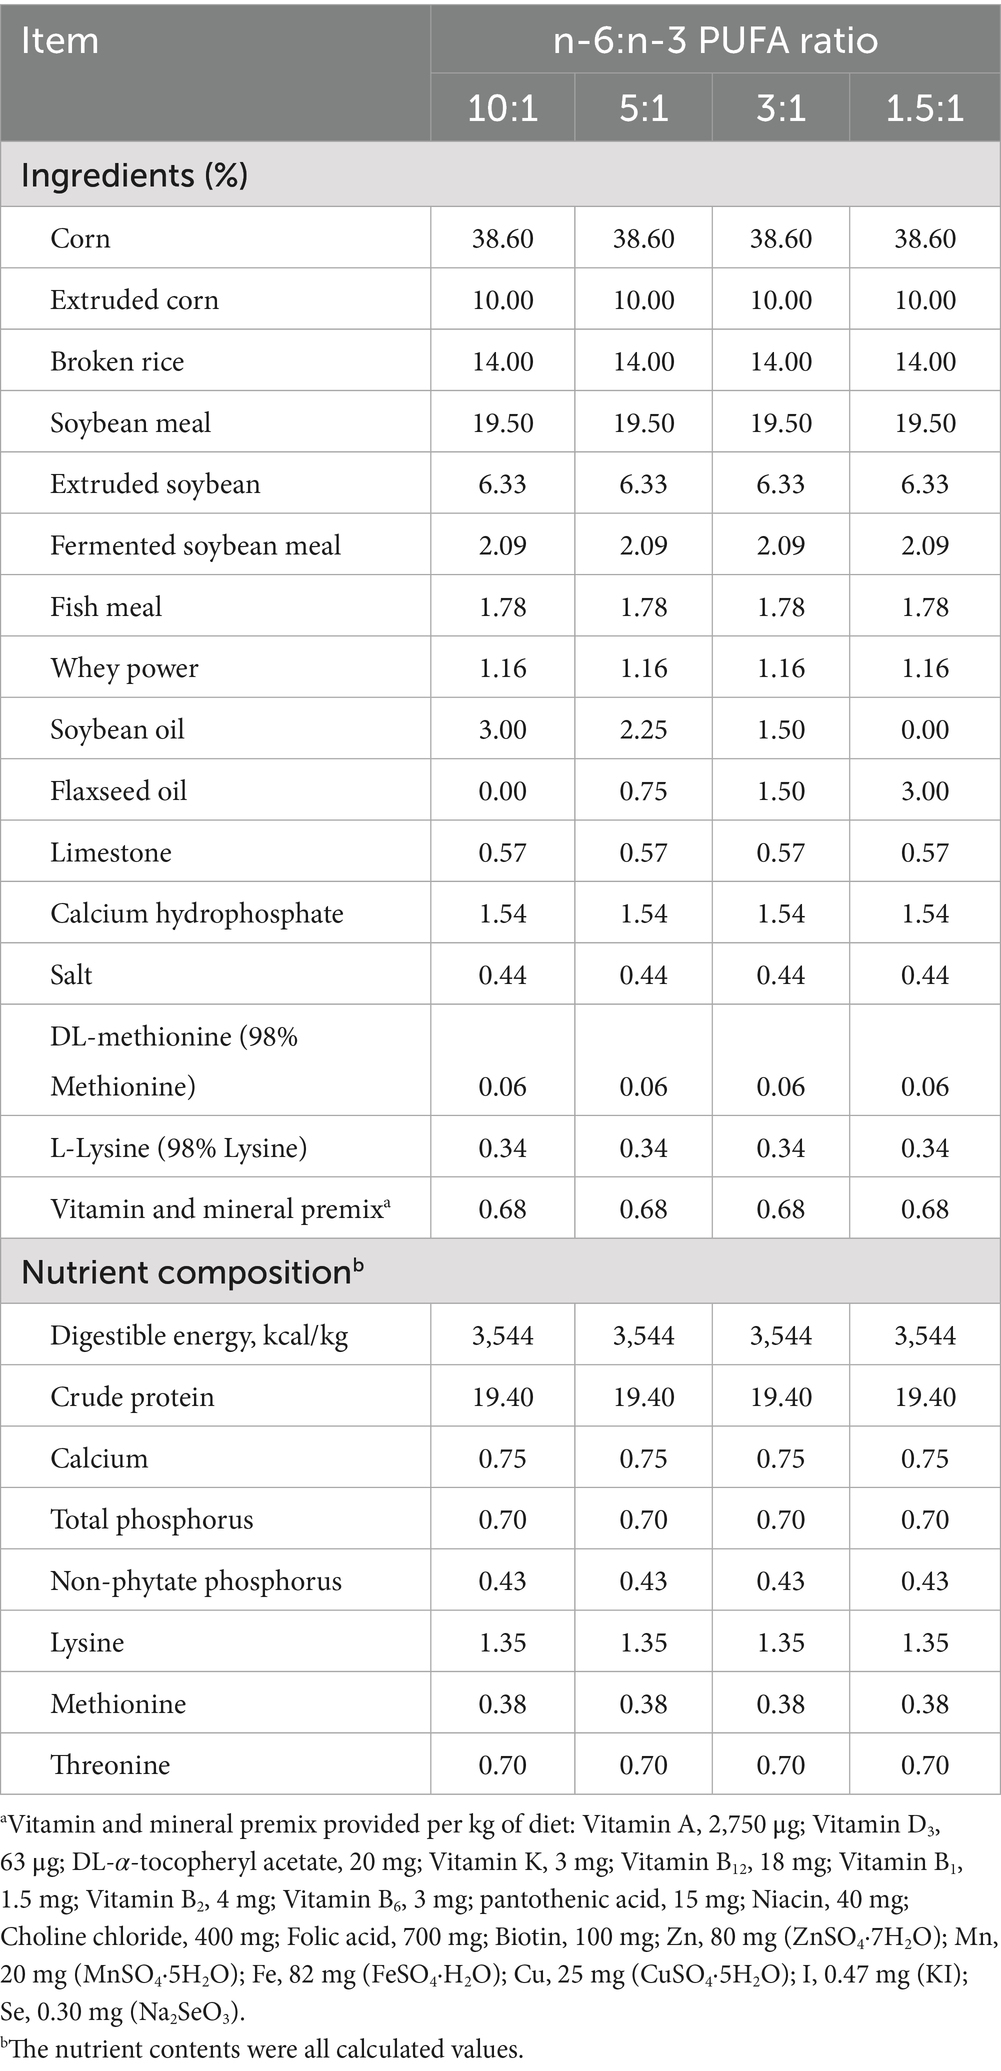
Table 1. Composition and nutrient contents of the diets (as fed basis).
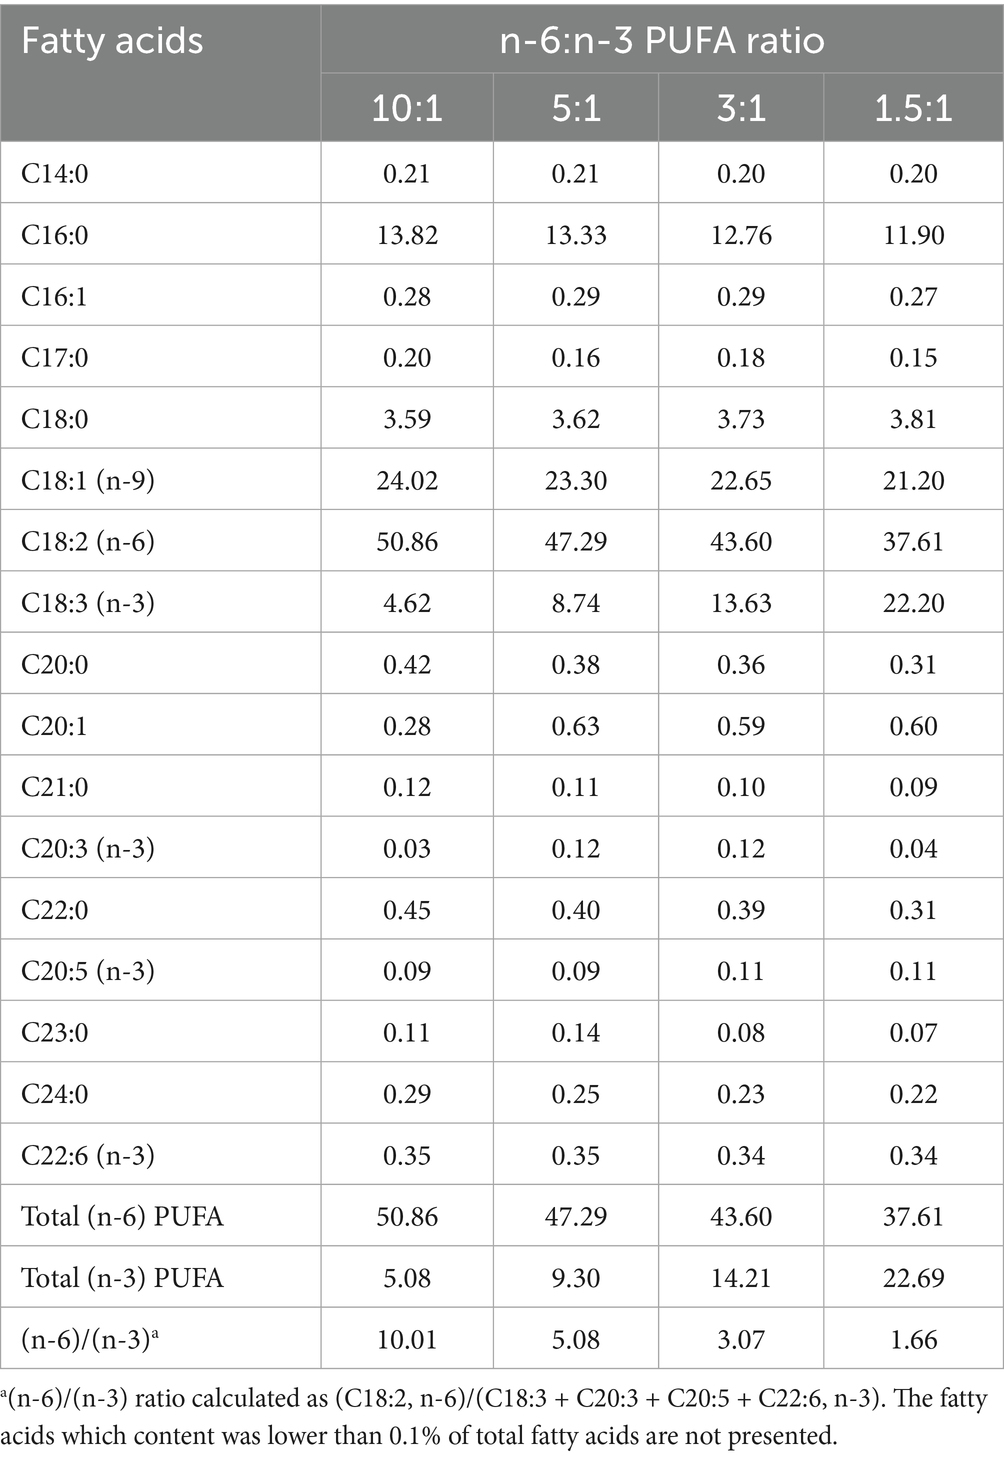
Table 2. Fatty acid composition of diets (% of total fatty acids).
Sample collection
On day 28, one pig with average body weight was selected from each replicate pen to collect blood from the anterior vena cava with a 10 mL vacuum tube, and then slaughtered under anesthesia. Subsequently, approximately 10 g tissue samples were collected from the jejunal mucosa (middle section), the left and right outer lobes of the liver, gastrocnemius muscle, and subcutaneous fat located in the gastrocnemius muscle. All samples were immediately snap-frozen in liquid nitrogen and stored at −80 °C for subsequent analysis.
Fatty acid composition analysis
The fatty acid composition of the feed was determined using a modified one-step derivatization method based on Lepage and Roy (21). Briefly, samples were extracted with a mixture of acetyl chloride-methanol (1:10 v/v). Then, total fat was converted into fatty acid methyl esters (FAMEs) and determined by Agilent 7890b gas chromatography, which was equipped with a flame ionization detector (Agilent Technologies, Inc., Santa Clara, California, USA). A HP-88 fused silica capillary column (Agilent Technologies, Inc., Santa Clara, California, USA) was used to separate FAMEs. Fatty acids were identified by matching both retention times and peak areas with corresponding authentic standards. The relative content of each fatty acid was calculated as a percentage of the total fatty acid content.
Serum lipid analysis
All blood samples were centrifuged at 3000 g for 10 min to collect serum. The contents of total cholesterol (TC), triglyceride (TG), high density lipoprotein (HDL), low density lipoprotein (LDL), and glucose in serum were determined by HITEC 7100 automatic biochemical analyzer.
Serum hormone measurement
The concentrations of insulin, adiponectin and leptin in the serum were measured by commercial enzyme-linked immunosorbent assay (ELISA) kits (Quanzhou Ruixin Biotechnology Co., Ltd., Fujian, China). All experimental processes were performed according to the manufacturer’s instructions.
mRNA abundance determination
Total RNA was extracted from the jejunal mucosa, liver, gastrocnemius muscle and subcutaneous fat using the trizol reagent (Nanjing Vazyme Biotech Co., Ltd., Nanjing, China). The concentration and purity of RNA were determined by NanoDrop2000 spectrophotometer (Thermo Fisher Scientific, Inc.). The degradation of RNA was detected by 1% agarose gel electrophoresis. The synthesis of cDNA and quantitative PCR (n = 3) were carried out by PrimeScript® RT kit (Nanjing Vazyme Biotech Co., Ltd., Nanjing, China) and SYBR® Premix Ex Taq™ (Tli RNaseH Plus) qPCR kit (Nanjing Vazyme Biotech Co., Ltd., Nanjing, China), respectively. The primer sequences of target genes 5′ and 3′ are listed in Table 3. β-actin, a house-keeping gene, was used as an internal control to normalize the expression of target genes. As Livak et al. previously reported, the relative expression of target genes was calculated according to the 2-△△CT method (22).
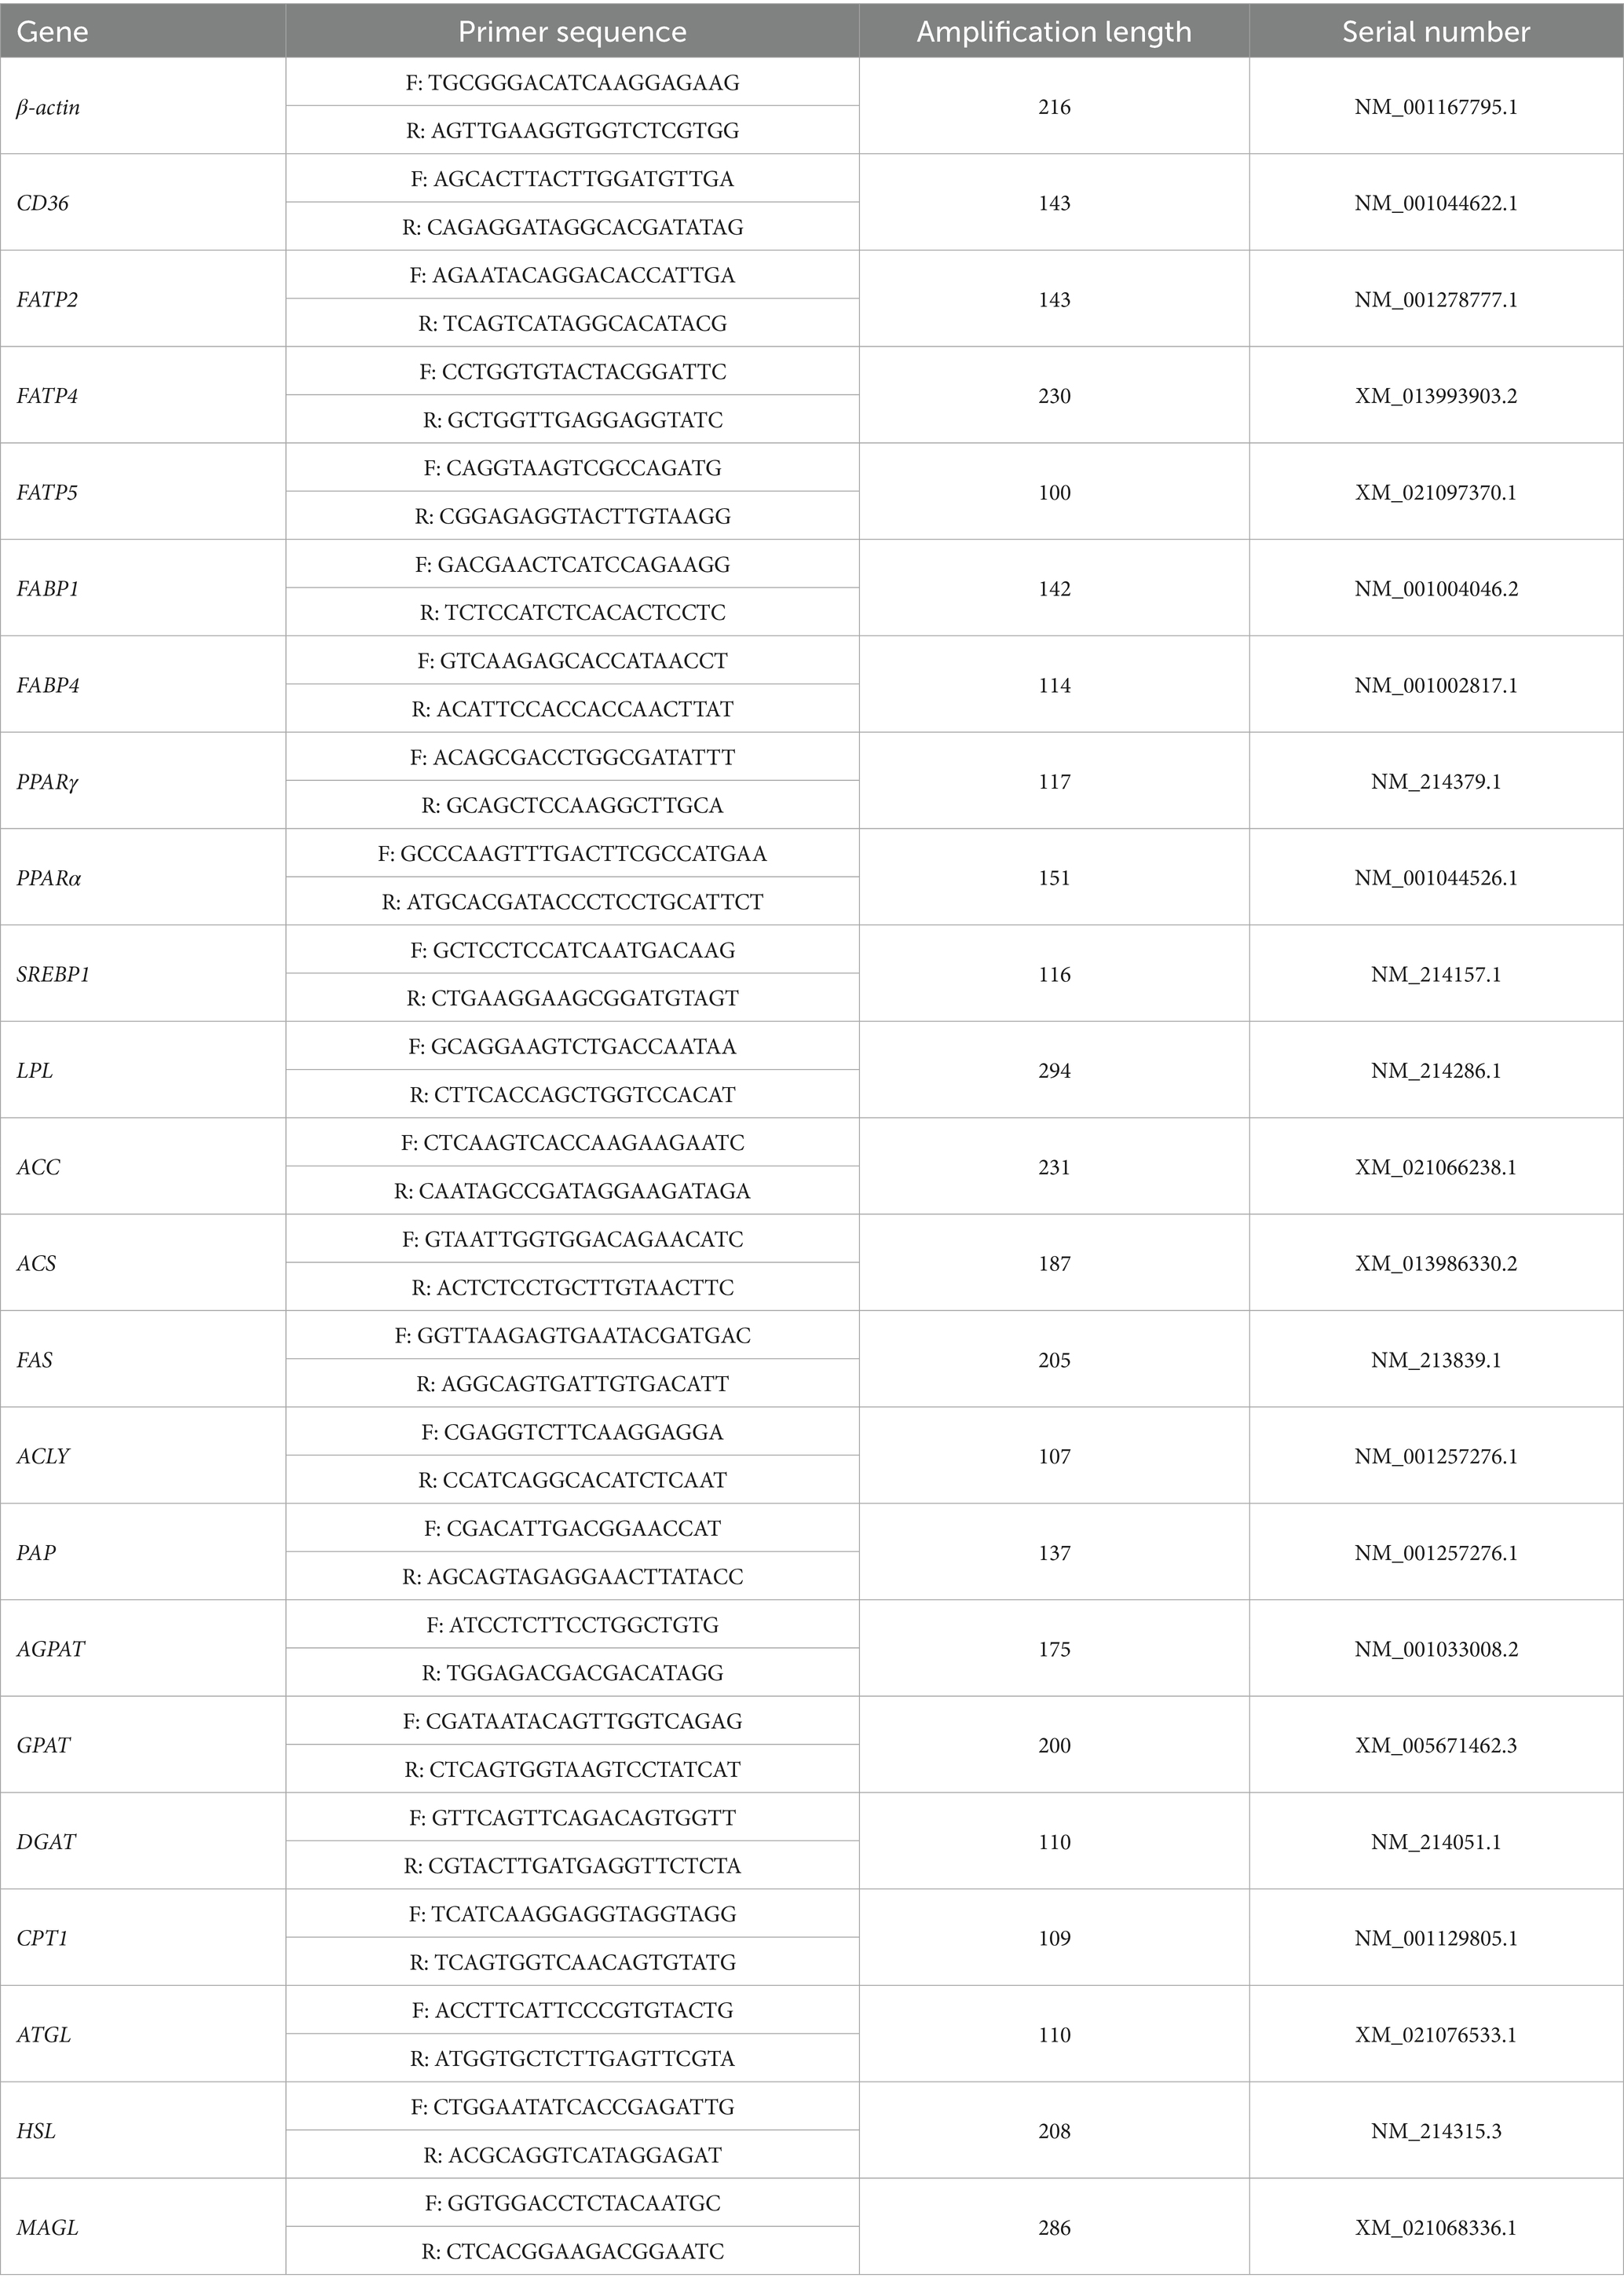
Table 3. The primer sequences of the target genes.
Statistical analysis
All the experimental data were analyzed using one-way ANOVA in SPSS Statistics 20 software (SPSS Inc., USA), followed by Duncan’s multiple comparisons. Furthermore, the linear and quadratic effects of decreasing dietary n-6/n-3 PUFA ratio were analyzed using orthogonal comparisons. All data in the tables are expressed as means ± SE. Differences were considered to be statistically significant at p < 0.05 and trends at 0.05 ≤ p < 0.10.
Results
Effect of different n-6/n-3 PUFA ratios on growth performance in nursery pigs
With the decrease of dietary n-6/n-3 PUFA ratios, ADG during 1–14 days (linear, p < 0.05; quadratic, p < 0.10), and ADG during 1–28 days (linear, p < 0.10) were increased, and F/G ratio during 1–14 (linear, p < 0.01; quadratic, p < 0.01), 14–28 (linear, p < 0.01; quadratic, p < 0.01) and 1–28 days (linear, p < 0.001; quadratic, p < 0.001) was decreased (Table 4). However, ADFI was not affected by n-6/n-3 PUFA ratios. Pigs fed diet with n-6/n-3 PUFA ratio of 3 had higher ADG during 1–14 days (p < 0.05) and lower F/G ratio during 1–28 days (p < 0.001) than those of 10:1 and 5:1. Pigs fed diet with n-6/n-3 PUFA ratio of 1.5:1 had the lowest F/G ratio during 1–14 (p < 0.01), 14–28 (p < 0.05) and 1–28 days (p < 0.001).
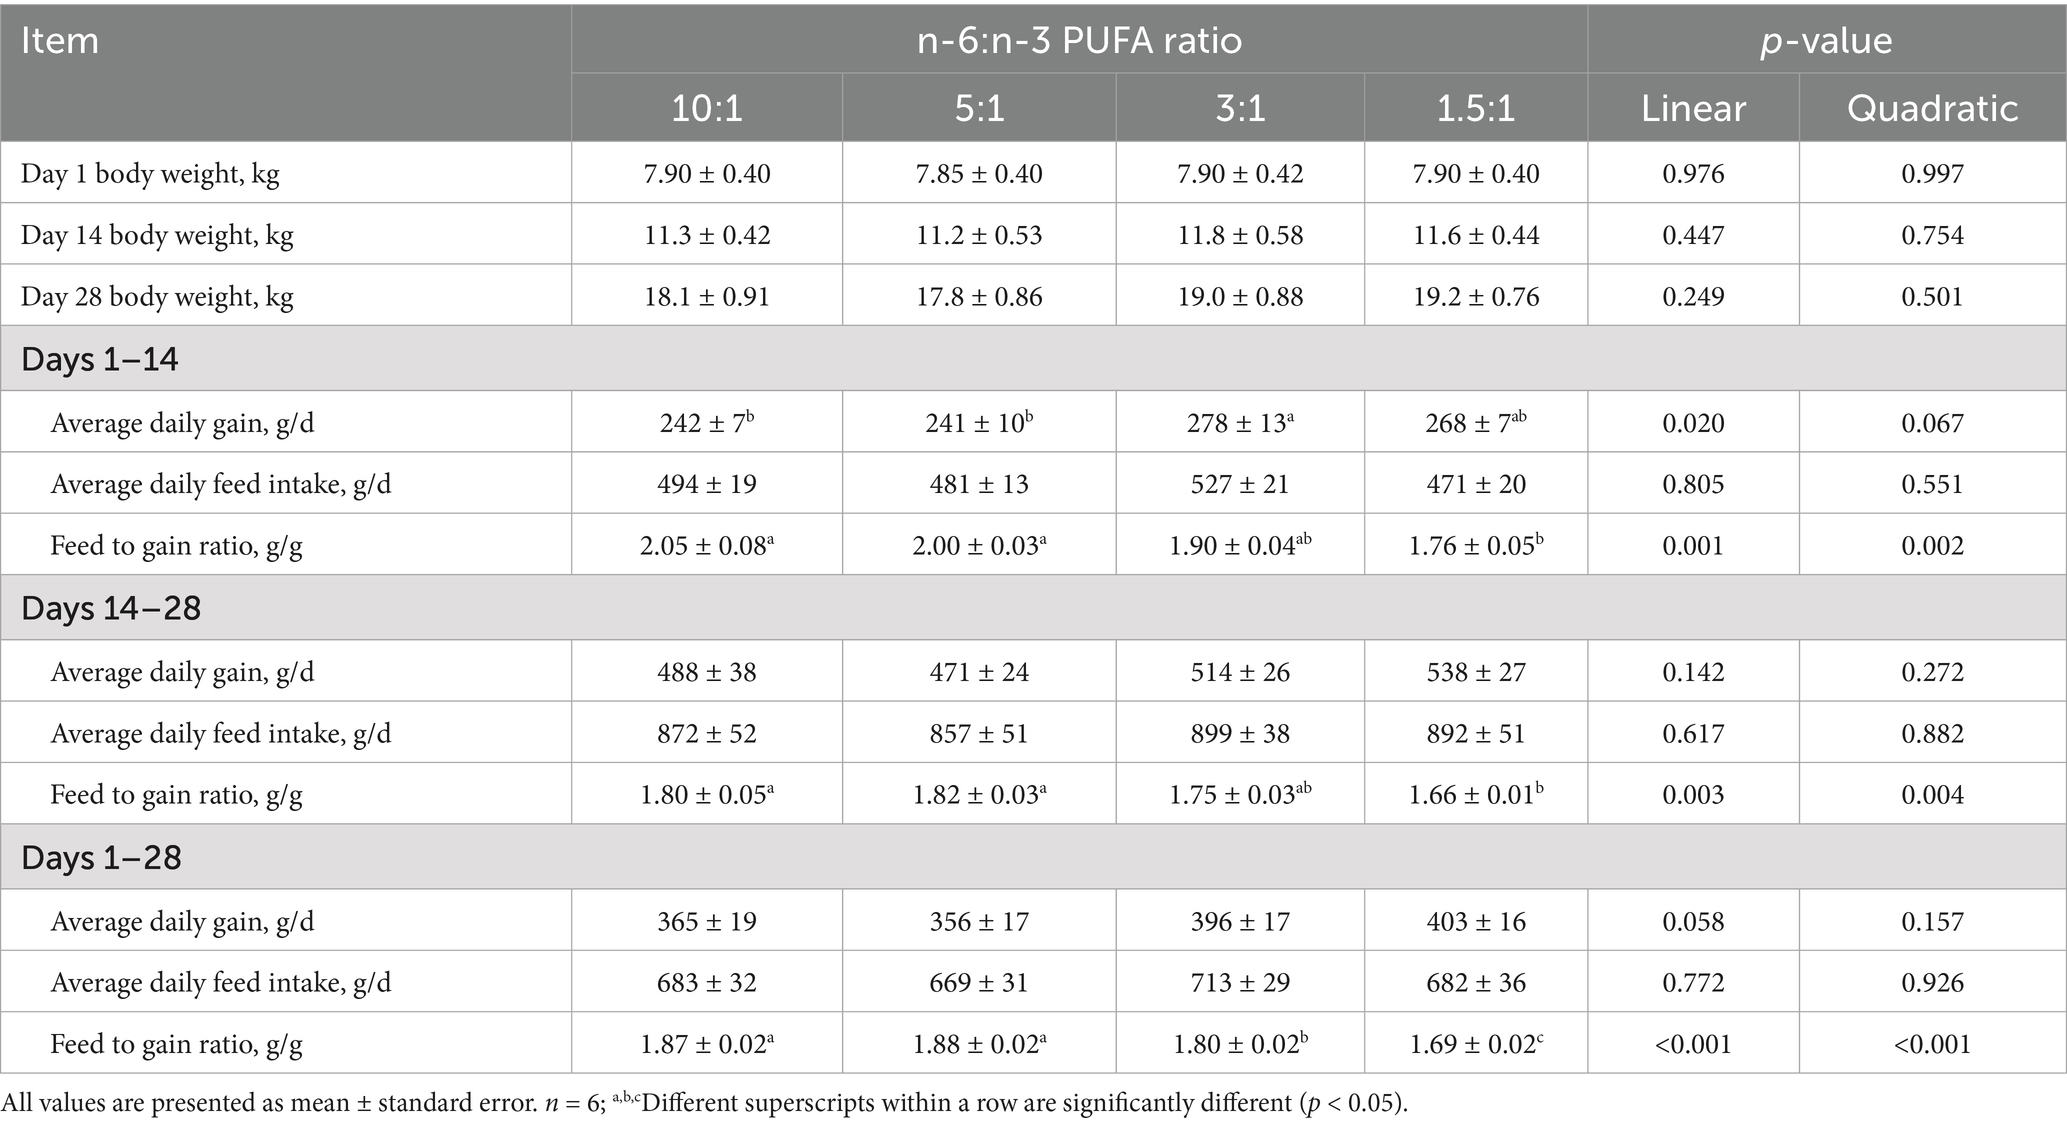
Table 4. Effect of different n-6/n-3 PUFA ratio on growth performance in nursery pigs.
Effect of different n-6/n-3 PUFA ratios on contents of serum lipids in nursery pigs
With the decrease of dietary n-6/n-3 PUFA ratio, the contents of TC (p < 0.01; p < 0.05), TG (p < 0.01; p < 0.01), HDL (p < 0.05; p < 0.05) and LDL (p < 0.05; p < 0.10) in serum were decreased linearly and quadratically, respectively (Table 5). Furthermore, compared with diets with n-6/n-3 PUFA ratios of 10:1, 5:1 and 3:1, pigs fed diet with n-6/n-3 PUFA ratio of 1.5:1 had the lowest contents of TC, TG, HDL and LDL in serum (p < 0.05).
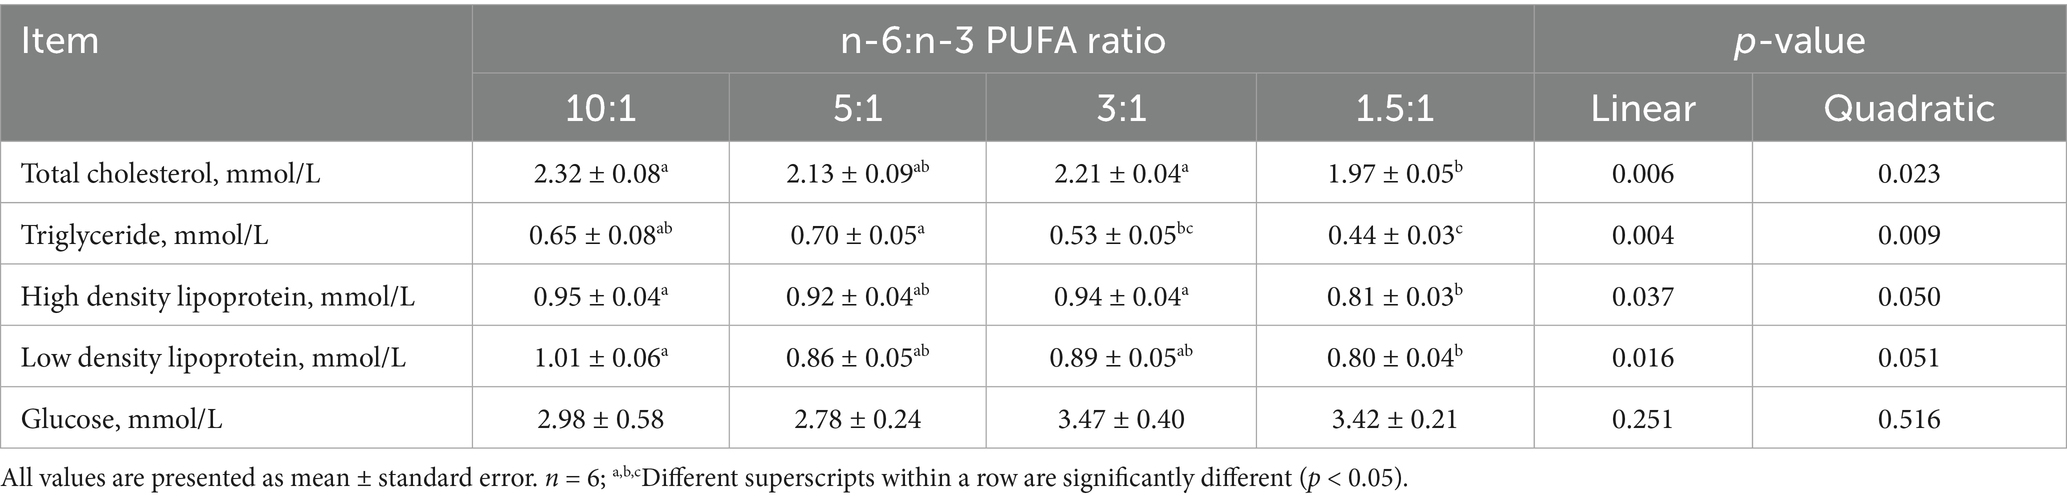
Table 5. Effect of different n-6/n-3 PUFA ratio on serum biochemical indices in nursery pigs.
Effect of different n-6/n-3 PUFA ratios on serum hormone levels in nursery pigs
With the decrease of dietary n-6/n-3 PUFA ratios, the concentrations of insulin (quadratic, p < 0.01), adiponectin (quadratic, p < 0.05) and leptin (linear, p < 0.10; quadratic, p < 0.05) in the serum was increased (Table 6). Pigs fed diet with n-6/n-3 PUFA ratio of 3:1 had the highest concentrations of insulin, adiponectin and leptin in the serum compared with diets with n-6/n-3 PUFA ratios of 10:1, 5:1 and 1.5:1 (p < 0.05).

Table 6. Effect of different n-6/n-3 PUFA ratio on serum hormone levels in nursery pigs.
Effect of different n-6/n-3 PUFA ratios on gene expression related to fatty acid metabolism in jejunum, liver, gastrocnemius muscle and subcutaneous fat
With the decrease of dietary n-6/n-3 PUFA ratio, the mRNA expression of FATP2 (p < 0.05; p < 0.10) and FATP5 (p < 0.01; p < 0.01) in jejunum was decreased linearly and quadratically, respectively (Table 7). With the decrease of dietary n-6/n-3 PUFA ratios, the mRNA expression of FATP4 (p < 0.01), peroxisome proliferator activated receptor (PPAR)γ (p < 0.10), FAS (p < 0.10), GPAT (p < 0.10), ATGL (p < 0.05), and HSL (p < 0.01) in jejunum was increased quadratically. Pigs fed diet with n-6/n-3 PUFA ratio of 3:1 had the highest mRNA expression of FATP4, ATGL, and HSL in jejunum compared with diets with n-6/n-3 PUFA ratios of 10:1, 5:1 and 1.5:1 (p < 0.05). Compared with diet with n-6/n-3 PUFA ratio of 10:1, pigs fed diets with n-6/n-3 PUFA ratios of 5:1 and 1.5:1 had the lowest mRNA expression of FATP2 and FATP5 in jejunum (p < 0.05).
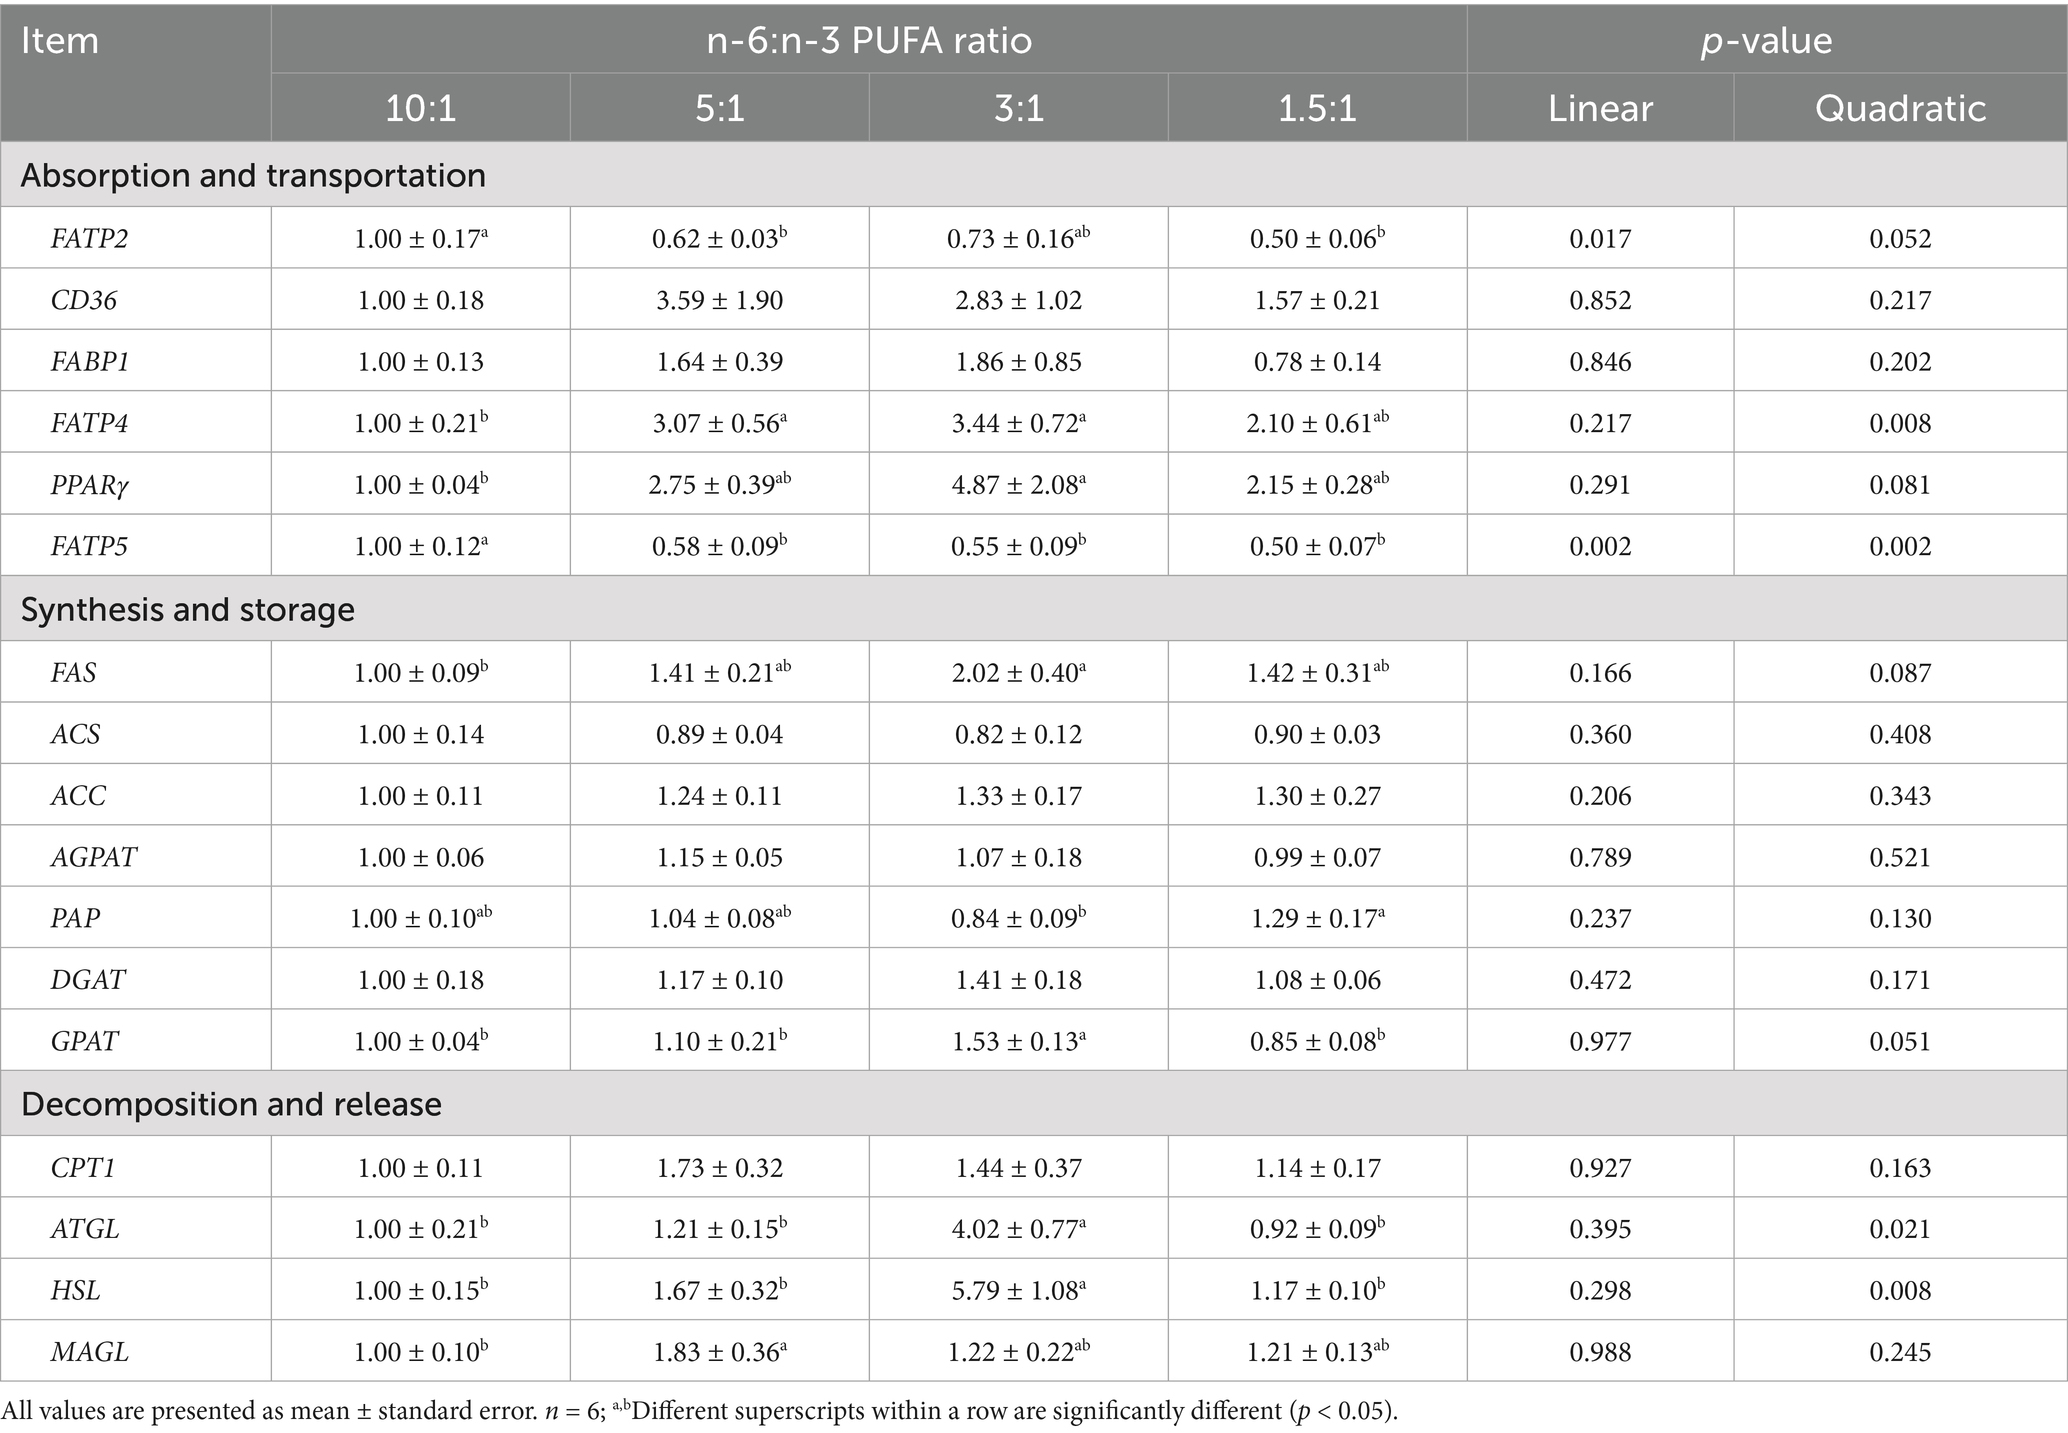
Table 7. Effect of different n-6/n-3 PUFA ratio on gene expression related to fatty acid metabolism in jejunum.
The mRNA expression of sterol regulatory element binding protein 1 (SREBP1) in liver was decreased linearly (p < 0.05) and quadratically (p < 0.05) with the decrease of dietary n-6/n-3 PUFA ratio (Table 8). With the decrease of dietary n-6/n-3 PUFA ratio, the mRNA expression of ATP citrate lyase (ACLY) (linear, p < 0.05; quadratic, p < 0.05), GPAT (linear, p < 0.01; quadratic, p < 0.05), ATGL (linear, p < 0.05; quadratic, p < 0.05), MAGL (linear, p < 0.10; quadratic, p < 0.01) and FATP5 (linear, p < 0.05; quadratic, p < 0.05), PAP (linear, p < 0.10), AGPAT (quadratic, p < 0.10) and CPT1 (quadratic, p < 0.01) in liver was increased. Compared with the other treatment groups, pigs fed diet with n-6/n-3 PUFA ratio of 1.5:1 had the highest mRNA expression of ACLY, GPAT, FATP2 and FATP5 in liver (p < 0.05). Compared with the other three treatment groups, pigs fed diet with n-6/n-3 PUFA ratio of 5:1 had the highest mRNA expression of acyl CoA synthetase (ACS), CPT1, GPAT, MAGL and FABP1 in liver (p < 0.05). In contrast, the mRNA expression of ATGL was significantly higher and the mRNA expression of SREBP1 was significantly lower in pigs fed diets with n-6/n-3 PUFA ratios of 3:1 and 1.5:1 (p < 0.05) than that of 10:1.
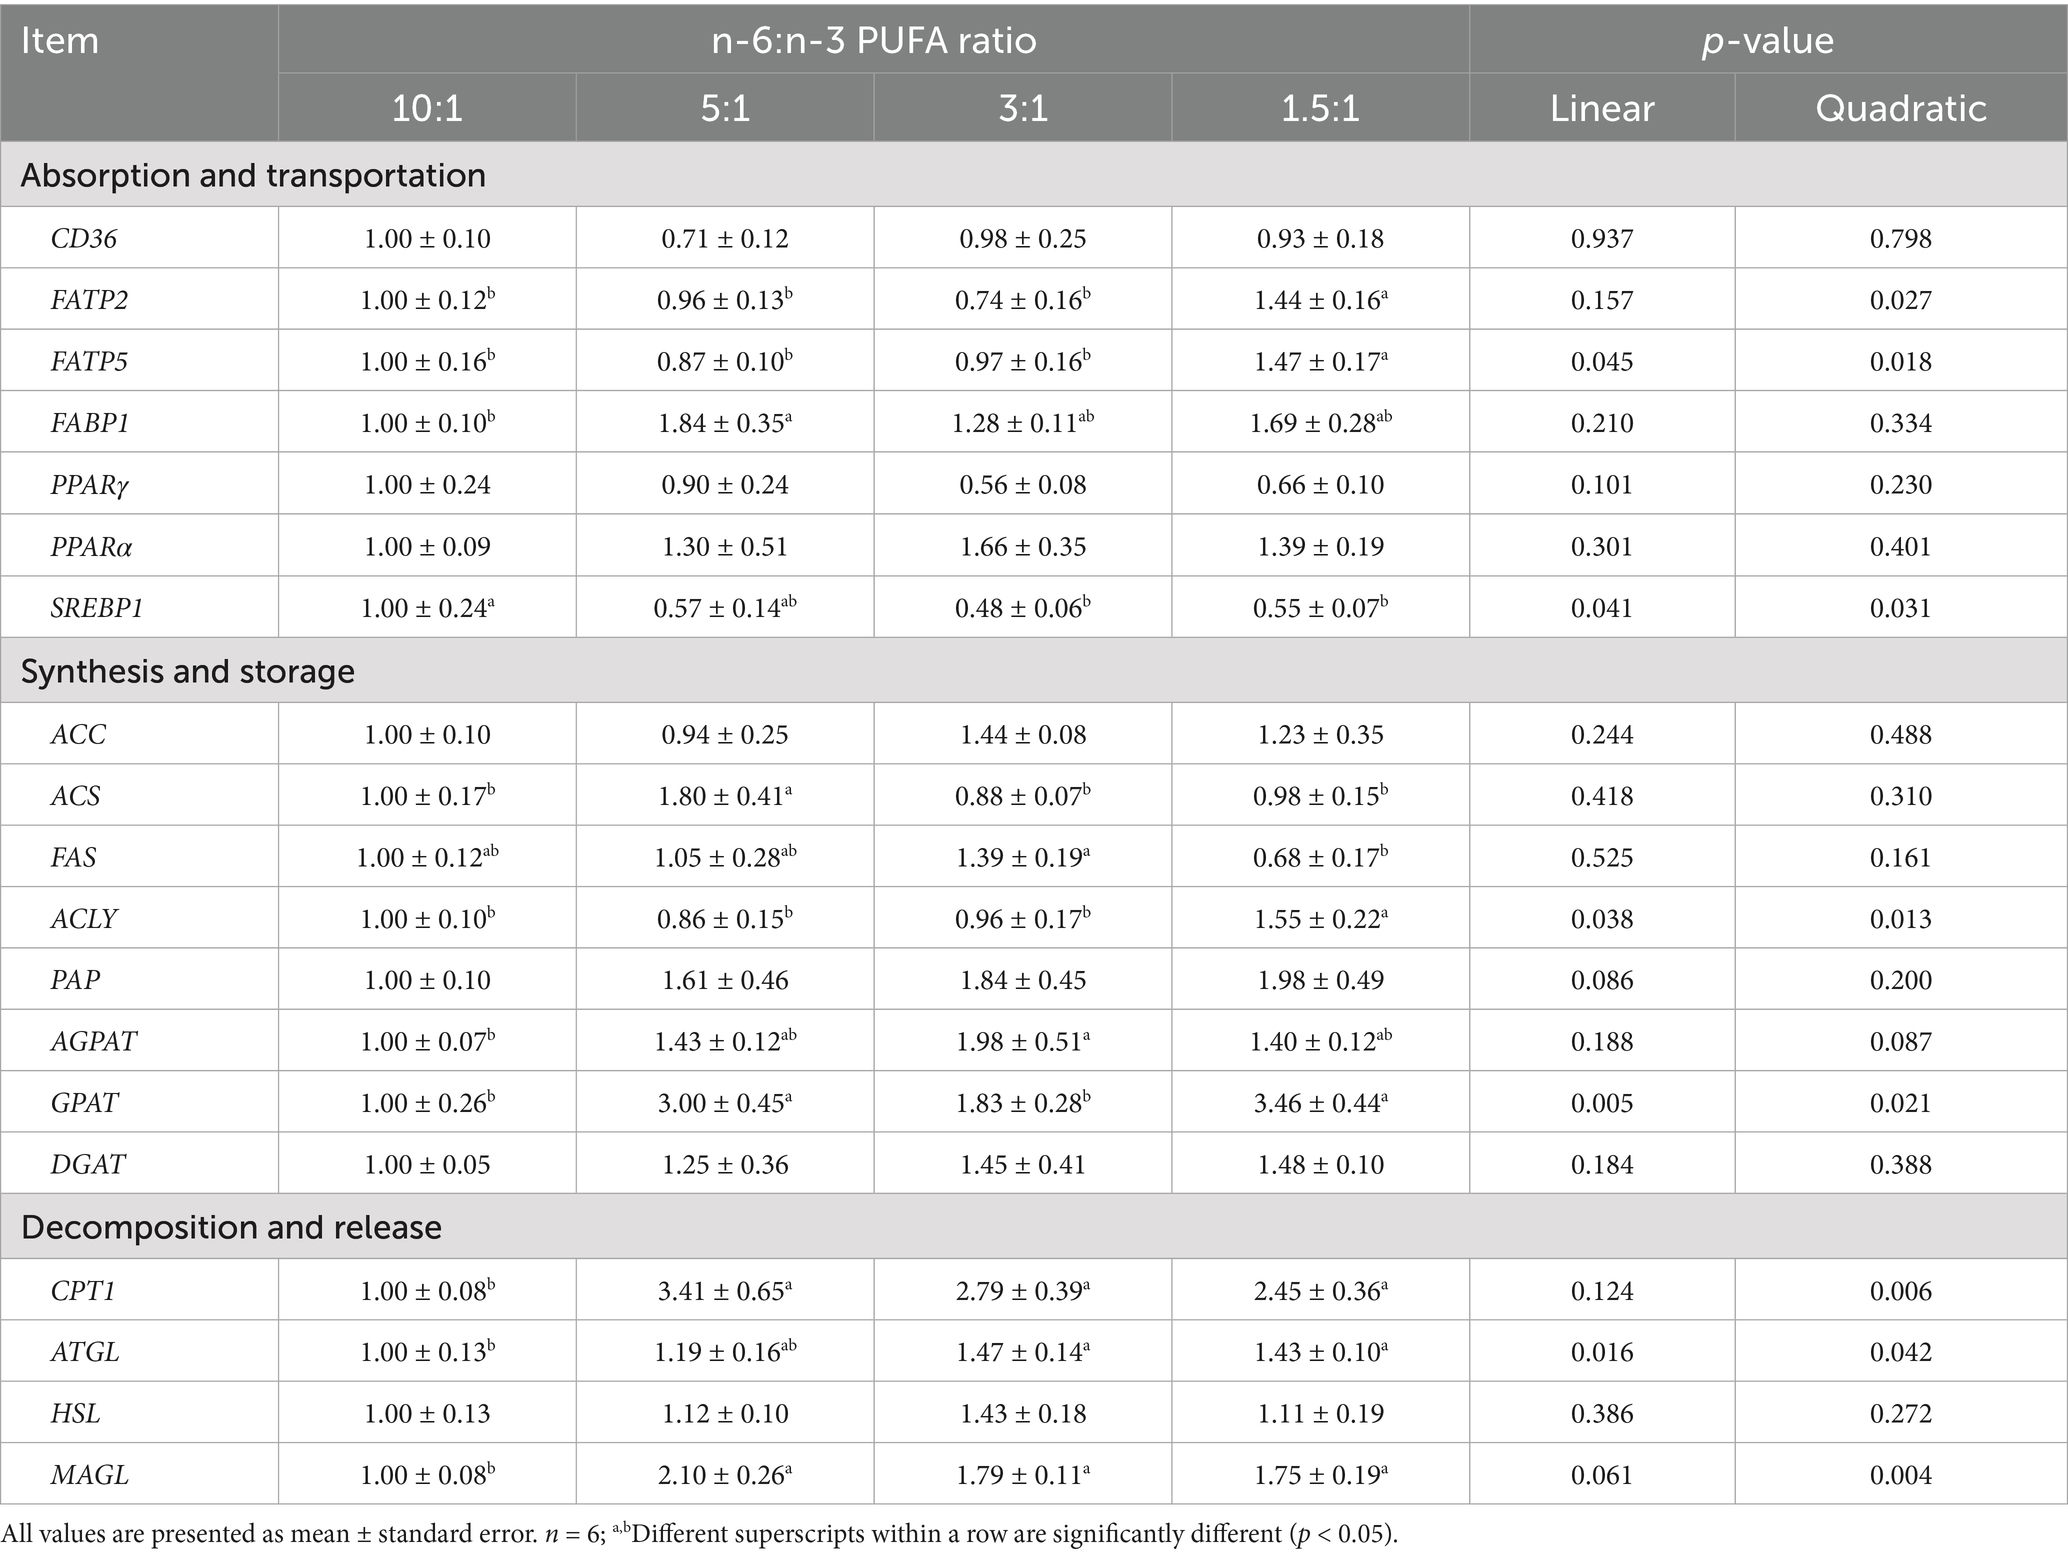
Table 8. Effect of different n-6/n-3 PUFA ratio on gene expression related to fatty acid metabolism in liver.
The mRNA expression of CD36 (linear, p < 0.001; quadratic, p < 0.01), FABP4 (linear, p < 0.01; quadratic, p < 0.001), PPARγ (quadratic, p < 0.05), acetyl CoA carboxylase (ACC) (linear, p < 0.01; quadratic, p < 0.01), ACS (linear, p < 0.10), ACLY (linear, p < 0.001; quadratic, p < 0.001), AGPAT (linear, p < 0.05; quadratic, p < 0.01), GPAT (linear, p < 0.10), DGAT (quadratic, p < 0.01), CPT1 (linear, p < 0.05; quadratic, p < 0.10) and HSL (linear, p < 0.01; quadratic, p < 0.001) in gastrocnemius muscle was decreased with decreasing ratios of dietary n-6/n-3 PUFA (Table 9). With the decreased ratios of dietary n-6/n-3 PUFA, the mRNA expression of FABP1 (linear, p < 0.05; quadratic, p < 0.05), FATP4 (linear, p < 0.05; quadratic, p < 0.10), PAP (quadratic, p < 0.10) and MAGL (quadratic, p < 0.01) in gastrocnemius muscle was increased. Pigs fed diets with n-6/n-3 PUFA ratio of 5:1 had the lowest mRNA expression of FABP4, PPARγ, AGPAT, GPAT, ATGL, and HSL (p < 0.05) in gastrocnemius muscle compared with diets with n-6/n-3 PUFA ratios of 10:1, 3:1 and 1.5:1. Pigs fed diet with n-6/n-3 PUFA ratio of 3:1 had the highest mRNA expression of FATP1 and MAGL (p < 0.05) and the lowest mRNA expression of ACC and DGAT (p < 0.05) in gastrocnemius muscle compared with other treatment groups. Compared with diets with n-6/n-3 PUFA ratios of 10:1, 5:1 and 3:1, pigs fed diets with n-6/n-3 PUFA ratio of 1.5:1 had the lowest mRNA expression of CD36 and ACLY in gastrocnemius muscle (p < 0.05).
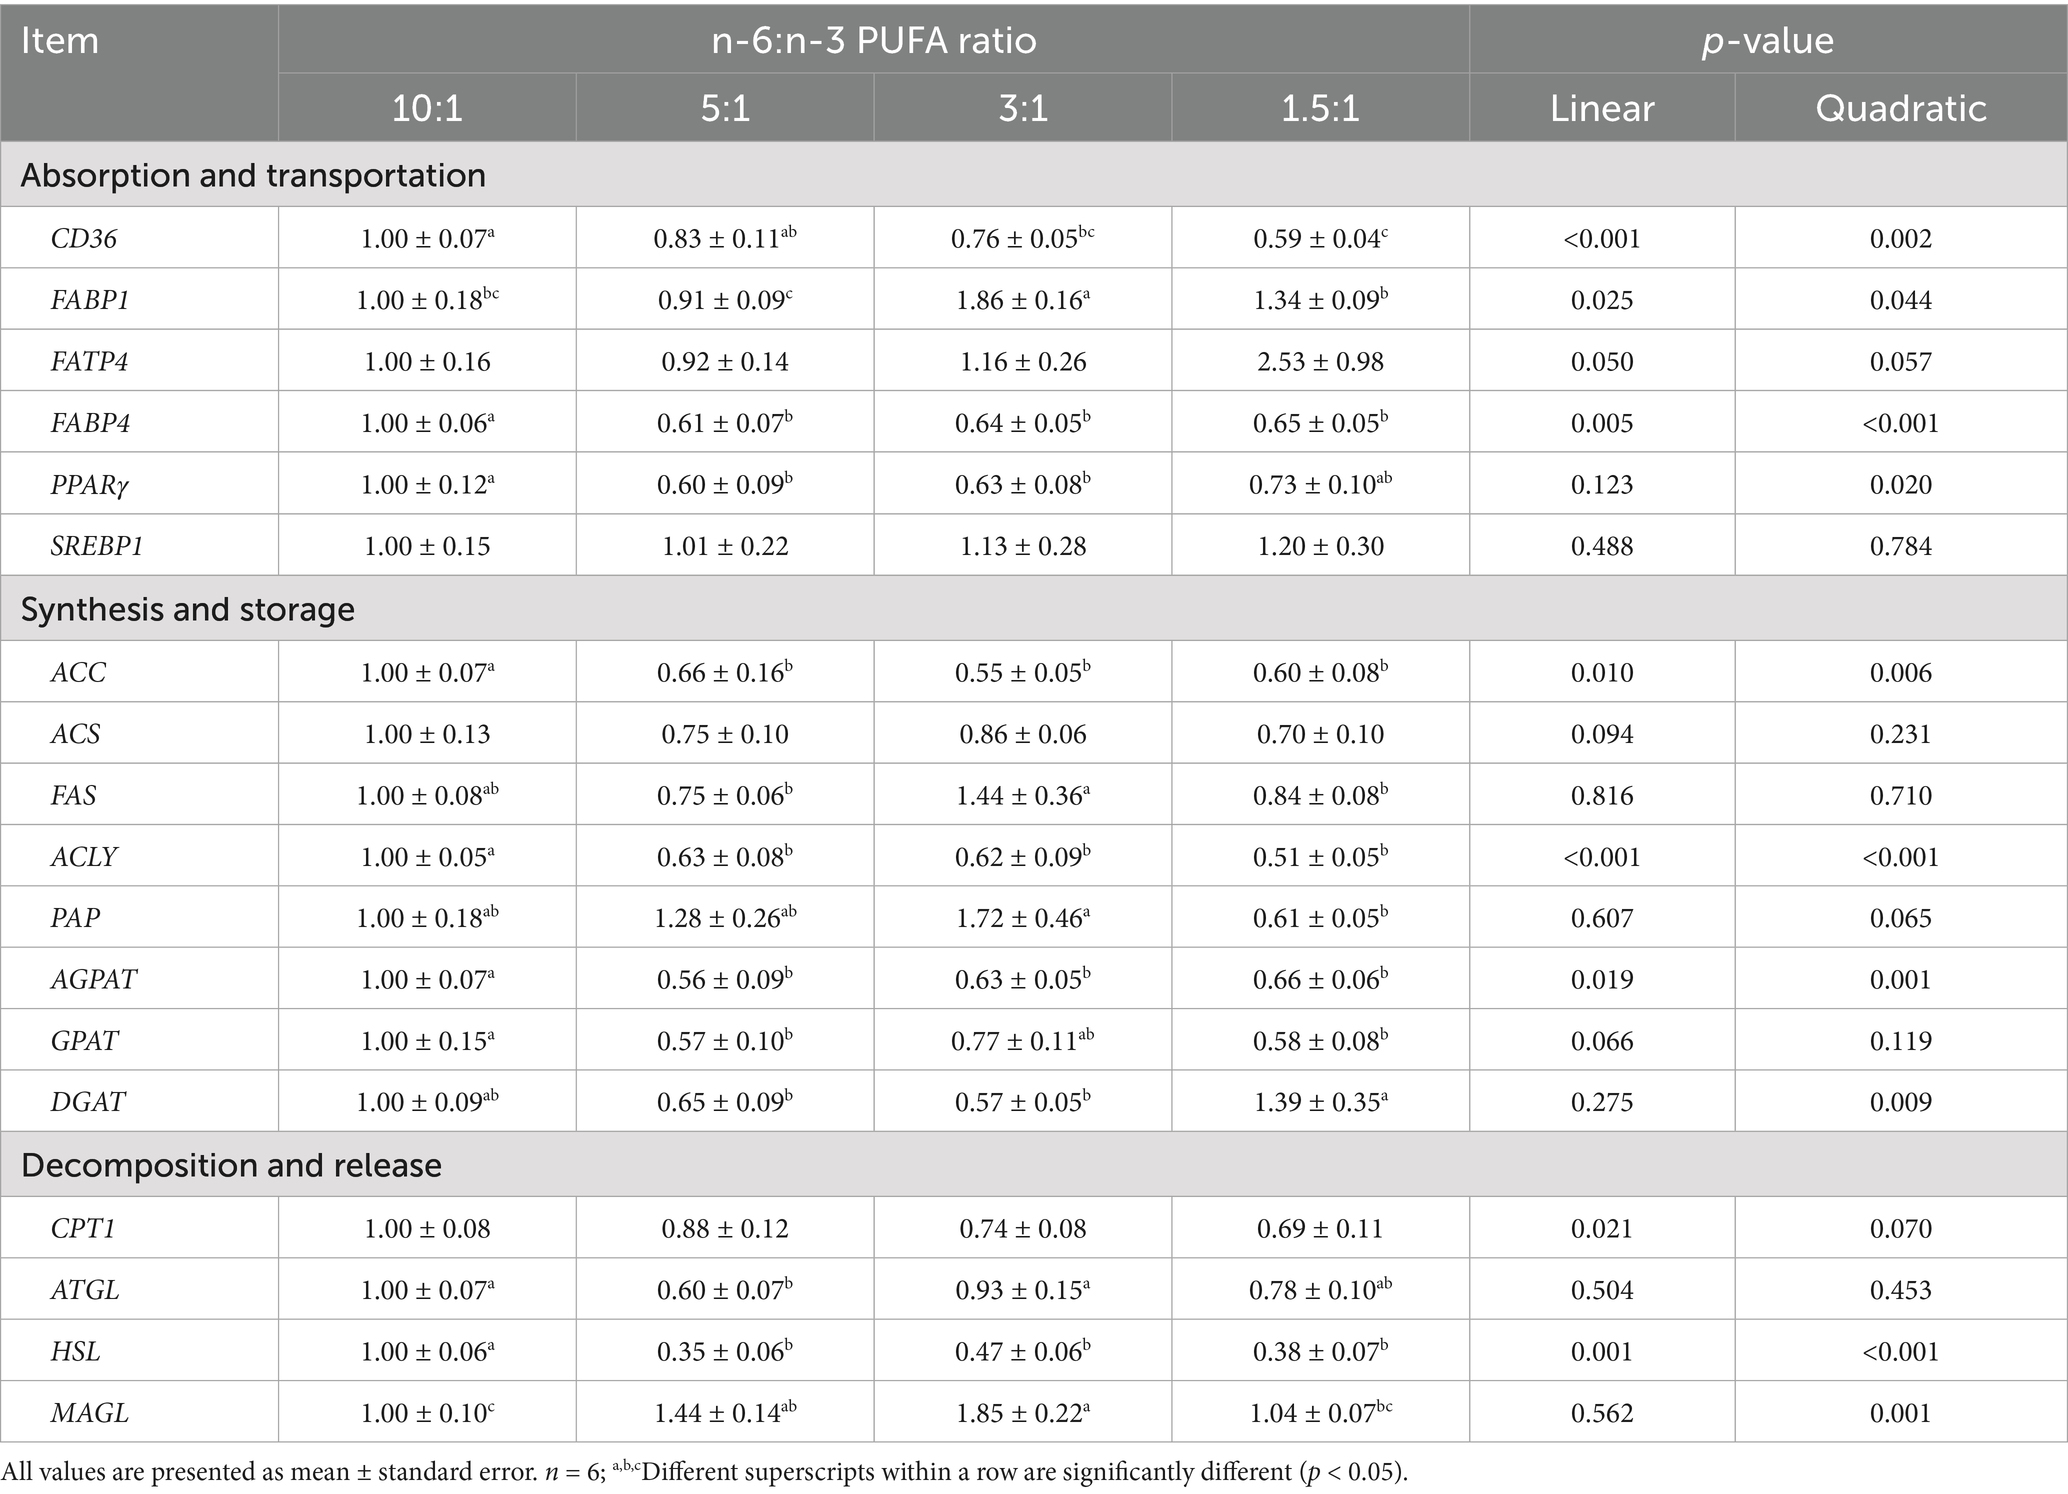
Table 9. Effect of different n-6/n-3 PUFA ratio on gene expression related to fatty acid metabolism in gastrocnemius muscle.
The mRNA expression of FABP4 (linear, p < 0.01; quadratic, p < 0.01), PPARγ (linear, p < 0.05; quadratic, p < 0.05), ACC (linear, p < 0.05; quadratic, p < 0.05), CPT1 (linear, p < 0.05; quadratic, p < 0.10), PAP (linear, p < 0.05; quadratic, p < 0.05), AGPAT (linear, p < 0.05; quadratic, p < 0.05), GPAT (linear, p < 0.01; quadratic, p < 0.05), ATGL (linear, p < 0.05) and MAGL (linear, p < 0.05; quadratic, p < 0.10) was increased with decreasing ratios of dietary n-6/n-3 PUFA (Table 10). With the decreased ratios of dietary n-6/n-3 PUFA, the mRNA expression of ACS (p < 0.05), ACLY (p < 0.10), HSL (p < 0.05), CD36 (p < 0.05), and lipoprotein lipase (LPL) (p < 0.05) in gastrocnemius muscle was increased quadratically. Compared with diets with n-6/n-3 PUFA ratios of 10:1, 3:1 and 1.5:1, pigs fed diets with n-6/n-3 PUFA ratios of 5:1 had the highest mRNA expression of SREBP1 (p < 0.10), ACLY (p < 0.05) and AGPAT (p < 0.01) in gastrocnemius muscle. Pigs fed diets with n-6/n-3 PUFA ratios of 3:1 had the highest mRNA expression of CD36, LPL, ACS, PAP and HSL (p < 0.05) in subcutaneous fat compared with diets with n-6/n-3 PUFA ratios of 10:1, 5:1 and 1.5:1. The group of diets with n-6/n-3 PUFA ratios of 1.5:1 had the highest mRNA expression of FABP4, PPARγ, ACC, GPAT, ATGL and MAGL (p < 0.05) in subcutaneous fat compared with other treatments.
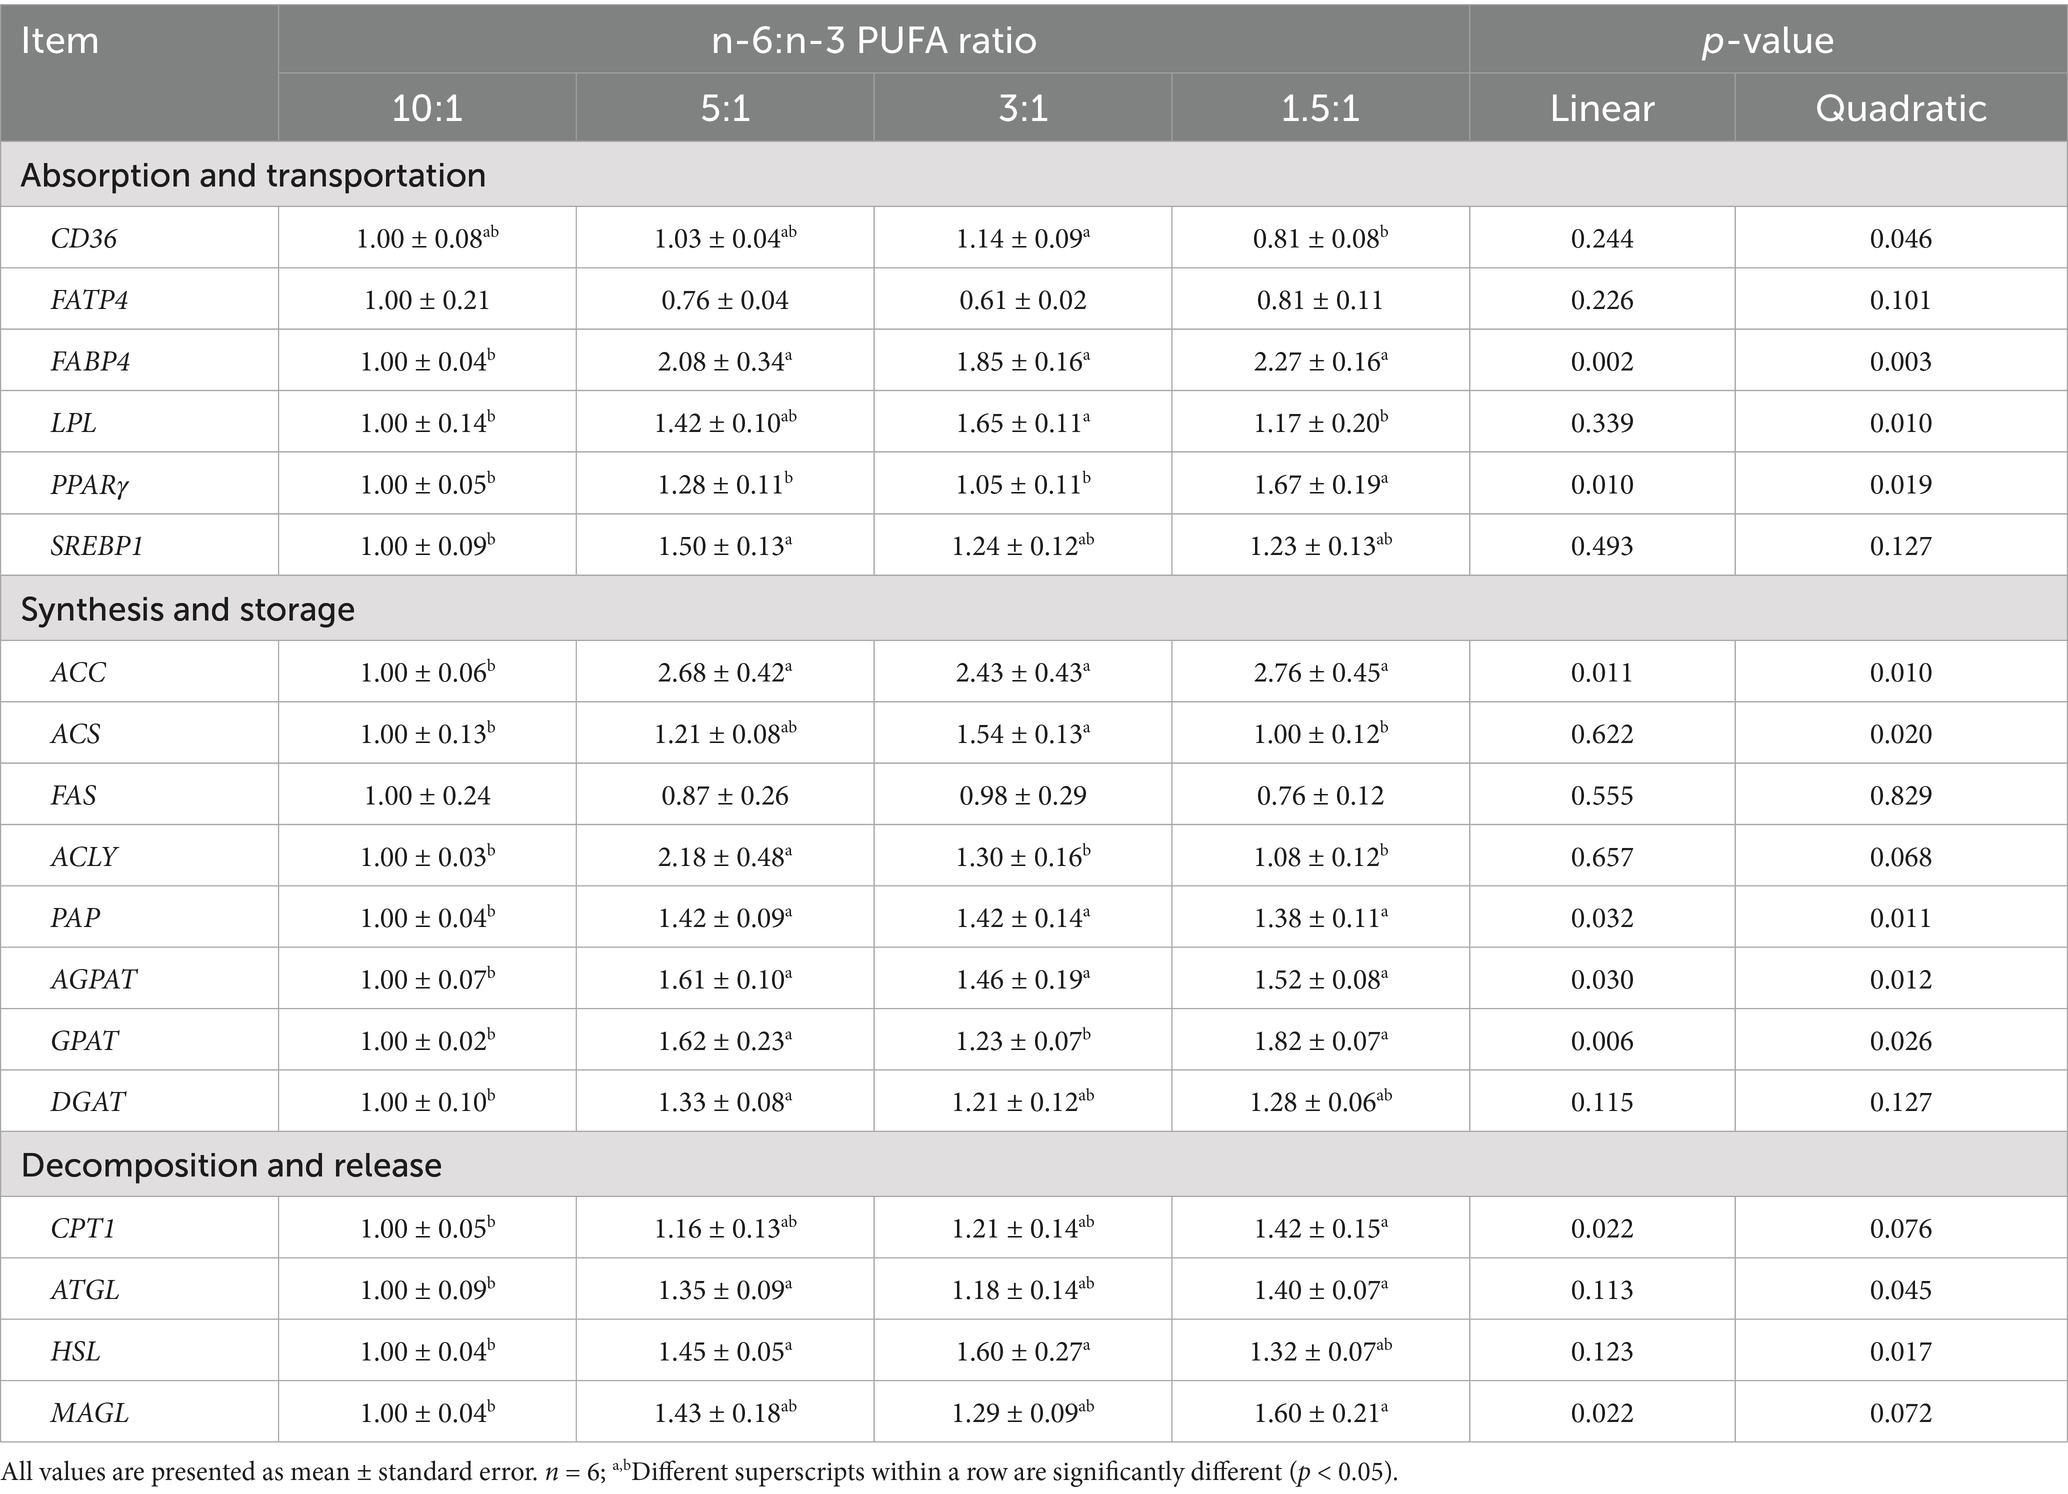
Table 10. Effect of different n-6/n-3 PUFA ratio on gene expression related to fatty acid metabolism in subcutaneous fat.
Effect of different n-6/n-3 PUFA ratios on the differentially expressed genes associated with fatty acid metabolism in different tissues
Figure 1A illustrates the differentially expressed genes (DEGs) associated with fatty acid metabolism in response to dietary n-6/n-3 PUFA ratios of 10 and 5 across four tissues: subcutaneous fat (10 DEGs), gastrocnemius muscle (9 DEGs), jejunum (5 DEGs), and liver (4 DEGs). Among these, six DEGs were shared between subcutaneous fat and gastrocnemius muscle. Tissue-specific DEGs included three in the jejunum, three in the liver, and three in subcutaneous fat, while one was unique to the gastrocnemius muscle. Additionally, one DEG was common to gastrocnemius muscle, liver, and jejunum; one to subcutaneous fat, gastrocnemius muscle, and liver; one to subcutaneous fat, gastrocnemius muscle, and jejunum; and one to subcutaneous fat, gastrocnemius muscle, and liver. In Figure 1B, treatment groups with n-6/n-3 PUFA ratios of 10 and 3 exhibited DEGs in gastrocnemius muscle (7), subcutaneous fat (9), jejunum (7), and liver (5). 4 DEGs were specific to the jejunum, three to subcutaneous fat, 3 to gastrocnemius muscle, and 2 to the liver. Shared DEGs included two between subcutaneous fat and gastrocnemius muscle, one between liver and jejunum, one among liver, jejunum, and gastrocnemius muscle (repeated twice), and one among subcutaneous fat, gastrocnemius muscle, and liver. Figure 1C displays DEGs in response to n-6/n-3 PUFA ratios of 10 and 1.5, with subcutaneous fat (9 DEGs), gastrocnemius muscle (8 DEGs), liver (8 DEGs), and jejunum (2 DEGs) showing differential expression. Three DEGs were unique to gastrocnemius muscle, three were shared between subcutaneous fat and liver, and three between subcutaneous fat and gastrocnemius muscle. Two DEGs were common to liver and jejunum, two were liver-specific, and one was gastrocnemius muscle-specific. Additionally, one DEG was shared between liver and gastrocnemius muscle, and one among subcutaneous fat, gastrocnemius muscle, and liver.
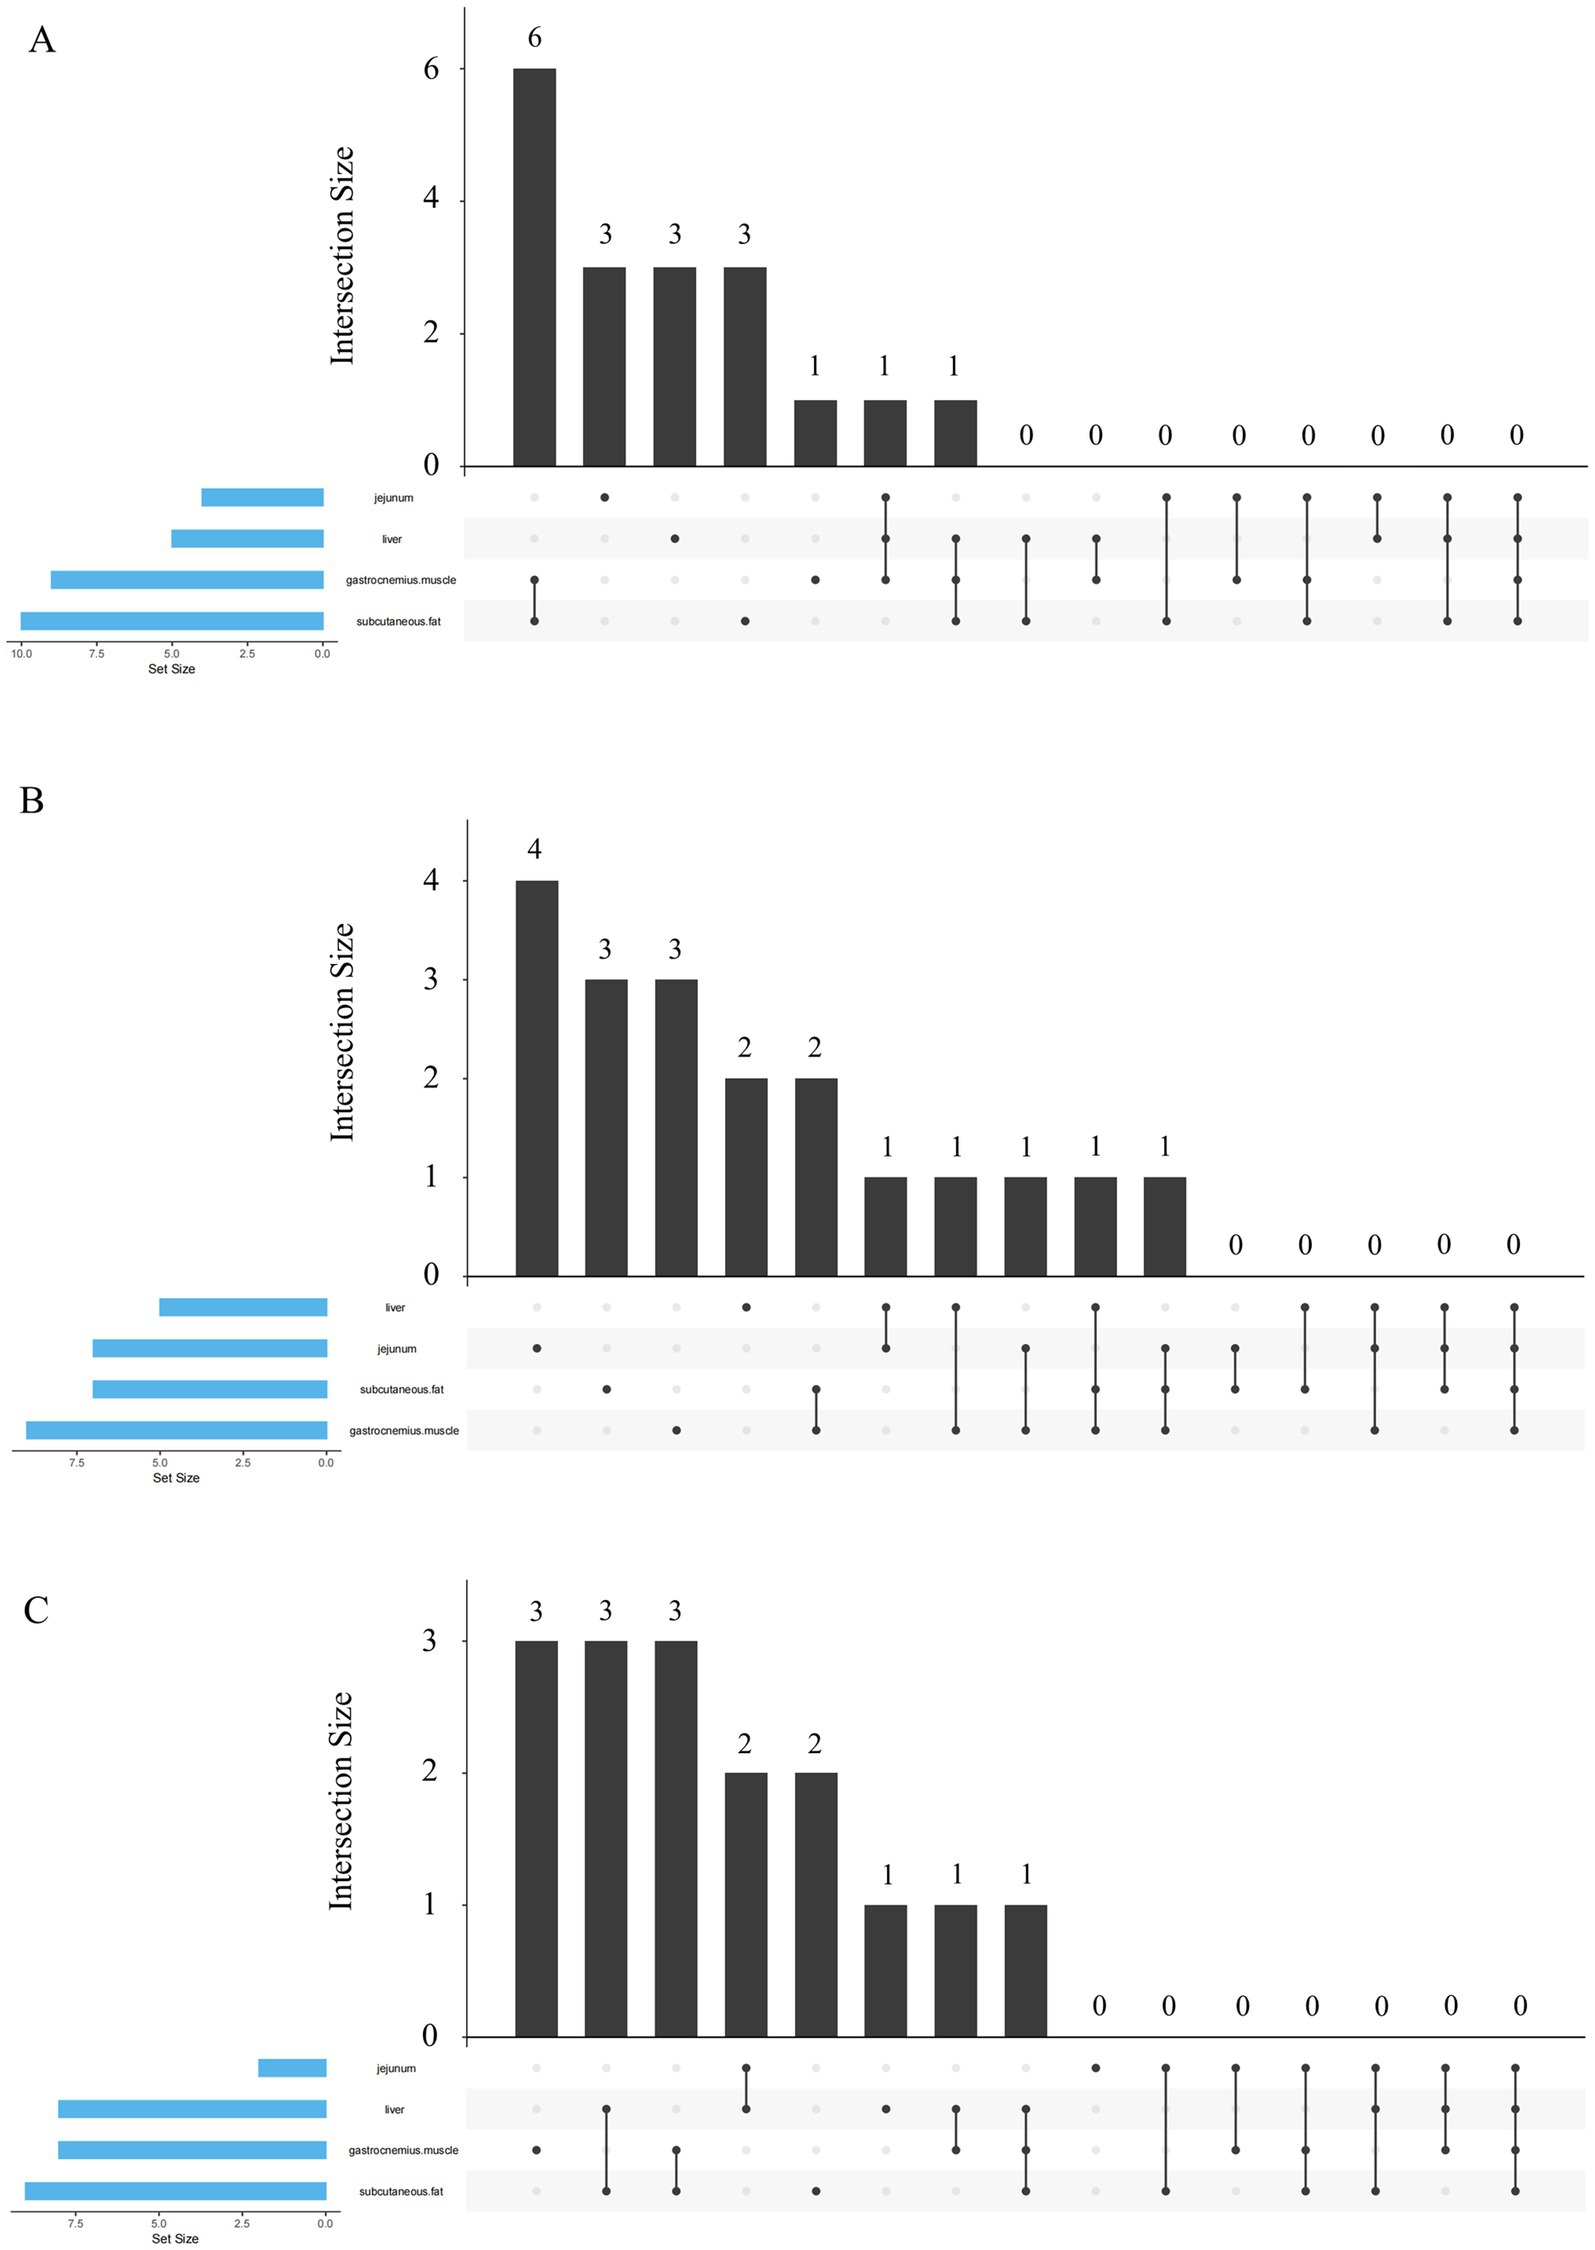
Figure 1. Upset plot analysis of the differentially expressed genes associated with fatty acid metabolism in different tissues. (A) Upset plot analysis of treatment groups with dietary n-6/n-3 PUFA ratios of 10 and 5. (B) Upset plot analysis of treatment groups with dietary n-6/n-3 PUFA ratios of 10 and 3. (C) Upset plot analysis of treatment groups with dietary n-6/n-3 PUFA ratios of 10 and 1.5.
Discussion
The role of dietary n-6 and n-3 PUFA balance in the growth and development (1), heredity (23, 24) and resistance to inflammation (25) of livestock and poultry has been paid more and more attention by scientists. Furthermore, n-6 and n-3 PUFA have important regulatory effects on the metabolism of fatty acids in livestock and poultry. The metabolism of fatty acids in different tissues and organs of animals at different growth stages is also obvious different (26). Therefore, we mainly aimed to investigate the effects of dietary n-6/n-3 PUFA ratio on growth performance and fatty acid metabolism in intestine, liver, muscle and adipose tissue of nursery pigs. Our previous studies demonstrated that the fatty acid profiles of intestinal mucosa, liver, and muscle tissue of nursery pigs largely mirrored the composition of dietary fatty acids (27–29). After 4 weeks of feeding, growth performance of pigs fed diets with n-6/n-3 PUFA ratios of 1.5:1 and 3:1 was significantly improved, which is indicated by higher ADG and lower F/G ratio. Our results are in line with the observations by Doaa et al. that chickens fed a diet with 1:1 ratio of sunflower oil to linseed oil (dietary n-6/n-3 PUFA ratio of 3:1) had the optimum growth performance (25). Previous studies have shown that lower ratios of n-6/n-3 PUFA (i.e., 1.5:1–5:1) promoted the absorption and utilization of fatty acids and free amino acids, and improved muscle and fat composition of finishing pigs (18). Our data suggest that lower dietary ratios of n-6 and n-3 PUFA (i.e., 1.5:1–3:1) are more beneficial to pig growth.
The contents of blood lipids such as TC, TG, HDL and LDL are closely related to the absorption and transport of fatty acids in the diet, and are also important indexes indicating the health status of the body (30–32). Our data showed that the contents of TC, TG, HDL and LDL in serum of pigs fed diet with n-6/n-3 PUFA ratio of 1.5:1 were markedly reduced compared with the other treatment groups. Consistent with our findings, Liu et al. and Doaa et al. reported that lowering n-6/n-3 PUFA ratios in diets could significantly reduce serum TC, TG and LDL contents in pigs (33), chickens (25) and ducks (34). Wang et al. showed that the contents of blood lipids and the composition of long-chain fatty acids in serum changed with the variation of dietary n-6/n-3 PUFA ratios (20). This indicates that blood lipids are closely related to dietary lipid composition. In addition, insulin, adiponectin and leptin in the blood are not only key hormones that regulate blood lipids, but also are affected by the intake of n-3 PUFA (35, 36). Our results demonstrated that pigs fed diet with n-6/n-3 PUFA ratio of 3:1 had the highest concentrations of insulin, adiponectin and leptin in the serum compared with diets with the other treatment groups. However, the blood glucose level of pigs was not affected by dietary n-6/n-3 PUFA ratios. It is well known that blood glucose level is regulated not only by insulin but also by counter-regulatory hormones such as glucagon, adrenaline, cortisol, and growth hormone, which collectively maintain glucose homeostasis (37). Therefore, we propose that the combined influence of these counter-regulatory hormones might counteracts insulin’s glucose-reducing effects. Fan et al. found that the contents of blood adiponectin and leptin of pigs fed diet supplemented with Mulberry leaf increased, while the concentrations of serum TG and TC decreased (38). Lower n-6/n-3 PUFA ratios mean higher levels of n-3 PUFA in the diet. A large number of studies have shown that n-3 PUFA have the effect of lowering blood lipids (32, 39). The above results show that reducing dietary n-6/n-3 PUFA ratios (i.e., 1.5:1) is more advantageous to reduce blood lipid levels.
The contents of n-6 and n-3 PUFA in the diet can directly affect the metabolism of fatty acids in the body, including the absorption and transportation, synthesis and storage, decomposition and release of fatty acids (11). The small intestine is the main place for the digestion and absorption of fatty acids, so we first researched the metabolism of fatty acids in jejunum. The results showed that mRNA expression of fatty acid intake and transport-related genes such as FATP2 and FATP5 in jejunum was significantly decreased with the decrease of dietary n-6/n-3 PUFA ratio, while mRNA expression of fatty acid decomposition and release-related genes (ATGL, HSL and MAGL) was significantly increased. ATGL and HSL are the main novel triglyceride lipases in animals and are important targets for regulating fat deposition and improving meat quality (40, 41). FATP, a family of membrane binding proteins, can catalyze the ATP-dependent esterification of long-chain fatty acids to their acyl derivatives, and has been shown to stimulate fatty acid intake and transport (42). We also observed the same result in gastrocnemius muscle. With the decrease of n-6/n-3 PUFA ratio in the diet, mRNA expression levels of genes associated with fatty acid intake and transport (CD36, FABP4, and PPARγ) and synthesis and storage (ACC, ACLY, PAP, GPAT, and DGAT) in gastrocnemius muscle were significantly decreased, while mRNA expression of decomposition and release related genes (MAGL) was increased. Li et al. found that the expression levels of FATP1 and FATP4 were decreased in skeletal muscle of pigs fed diets with n-6/n-3PUFA ratios of 3:1 and 1:1 (18). A balanced n-6/n-3 PUFA ratio in the diet is linked to improving body composition, and reducing intermuscular, visceral and subcutaneous fat while preserving lean muscle mass, thereby enhancing overall muscle quality (43–45). In agreement with our results, Nong et al. showed that the reduction of the dietary n-6/n-3 PUFA ratio could promote the expression of HSL and CPT1 in longissimus dorsi muscle of Heigai pigs (19). According to our data, we demonstrate that reducing the dietary n-6/n-3 PUFA ratios (i.e., 1.5:1–5:1) inhibits the intake of fatty acids to intestine and muscle tissue, and promotes the breakdown of these fatty acids.
The liver is the main site of oxidative breakdown of fatty acids. Further analysis showed that mRNA expression levels of genes associated with intake and transport (FATP2, FATP5, and FABP1), synthesis and storage (ACLY and GPAT), and decomposition and release (CPT1, ATGL, and MAGL) of fatty acids in liver were obviously increased with the reduction of n-6/n-3 PUFA ratio in the diet. Dierge et al. demonstrated that treatment with either n-6 or n-3 PUFAs alone increased free fatty acid accumulation in lipid droplets across different cell types (46). Our study revealed that subcutaneous fat exhibited the highest number of DEGs associated with fatty acid metabolism across all treatment groups. This finding aligns with the well-established role that adipose tissue is the central organ of fat synthesis and deposition (47). The results showed that mRNA expression levels of genes related to intake and transport (CD36, FABP4, LPL, PPARγ, and SREBP1), synthesis and storage (ACC, ACS, ACLY, PAP, AGPAT, GPAT, and DGAT), and decomposition and release (CPT1, ATGL, HSL, and MAGL) of fatty acids in subcutaneous fat were significantly increased with the reduction of n-6/n-3 PUFA ratio in the diet. These observations can be supported by Shan and colleagues who found that the mRNA expression levels of pATGL and HSL were higher in the subcutaneous adipose tissue of lean-type pigs compared with fat-type pigs (41). Diets with lower n-6/n-3 PUFA ratios increased the expression of genes related to decomposition and release of fatty acids in subcutaneous fat, thereby promoting the decomposition and release of lipids in adipose tissue. CD36 binds to long-chain PUFA to regulate PPARγ transcription and then up-regulate FABP4 expression, thus playing an important role in lipid uptake and metabolic homeostasis regulation in adipose tissue (48). In addition, the increase of FATP1 accelerates the rate of long-chain fatty acid transport and channel, but does not increase liver lipid accumulation (49). More importantly, FATP4 plays an important role in regulating lipid metabolism as a fatty cyl-CoA synthetase (50). Consistent with our results, Nong et al. showed that reducing dietary n-6/n-3 PUFA ratio increased the levels of FABP4, HSL and CPT1 in subcutaneous adipose tissue of Heigai pigs (19). Therefore, it is suggested that diets with lower n-6/n-3 PUFA ratios (i.e., 1.5:1–5:1) can promote the metabolism of fat in liver and adipose tissue of pigs.
In our research, the n-3/n-6 PUFA balance not only improved the growth performance of nursery pigs but also modulated lipid metabolism. Lipid metabolism plays a crucial role in regulating the growth performance of pigs through its dual effects on energy partitioning and endocrine regulation. From an energetic perspective, enhanced intestinal lipid absorption and transport facilitate the release of lipids into circulation, which are subsequently delivered to hepatic and adipose tissues. This metabolic shift promotes lipolysis and fat mobilization, thereby redirecting energy substrates toward muscle tissue rather than adipose deposition. Concurrently, lipid metabolism influences endocrine signaling pathways that modulate growth. Insulin stimulates muscle protein synthesis, while adipokines such as leptin and adiponectin function to suppress excessive fat accumulation. These coordinated mechanisms collectively contribute to improved growth performance in pig.
Conclusion
In conclusion, diets with lower n-6/n-3 PUFA ratios improve growth performance, reduce blood lipids, facilitate lipid metabolism in intestine, liver and subcutaneous fat, and inhibit fatty acid absorption, synthesis and storage in gastrocnemius muscle in nursery pigs. The dietary n-6/n-3 PUFA ratio of 1.5:1 appears optimal for growth performance. Nevertheless, when considering cost effectiveness, the ratio of 3:1 may represent a more practical choice. This finding has a good reference value for formulating nursery pig feed with appropriate ratio of n-6/n-3 PUFA.
Data availability statement
The original contributions presented in the study are included in the article/supplementary material, further inquiries can be directed to the corresponding author.
Ethics statement
The animal studies were approved by Animal Care and Use Committee of Wuhan Polytechnic University. The studies were conducted in accordance with the local legislation and institutional requirements. Written informed consent was obtained from the owners for the participation of their animals in this study.
Author contributions
JG: Formal analysis, Investigation, Data curation, Software, Writing – review & editing, Validation, Methodology, Writing – original draft. XC: Methodology, Conceptualization, Visualization, Validation, Writing – original draft, Formal analysis, Investigation. HZ: Resources, Investigation, Writing – review & editing, Visualization. KX: Supervision, Conceptualization, Writing – review & editing. YZ: Writing – review & editing, Project administration, Conceptualization, Resources. SZ: Methodology, Writing – review & editing, Conceptualization, Project administration. GC: Writing – review & editing, Conceptualization, Supervision. YL: Methodology, Conceptualization, Funding acquisition, Writing – review & editing, Resources, Project administration.
Funding
The author(s) declare that financial support was received for the research and/or publication of this article. This study was supported by Key R&D Program of Hubei Province (2023BBB047).
Conflict of interest
YZ and SZ were employed by Shandong Zhongmu Feed Technology Co., Ltd, Shandong Crelipids Biotechnology Co., Ltd.
The remaining authors declare that the research was conducted in the absence of any commercial or financial relationships that could be construed as a potential conflict of interest.
Correction note
A correction has been made to this article. Details can be found at: 10.3389/fvets.2025.1729211.
Generative AI statement
The authors declare that no Gen AI was used in the creation of this manuscript.
Any alternative text (alt text) provided alongside figures in this article has been generated by Frontiers with the support of artificial intelligence and reasonable efforts have been made to ensure accuracy, including review by the authors wherever possible. If you identify any issues, please contact us.
Publisher’s note
All claims expressed in this article are solely those of the authors and do not necessarily represent those of their affiliated organizations, or those of the publisher, the editors and the reviewers. Any product that may be evaluated in this article, or claim that may be made by its manufacturer, is not guaranteed or endorsed by the publisher.
References
1. Yin, J, Lee, KY, Kim, JK, and Kim, IH. Effects of different n-6 to n-3 polyunsaturated fatty acids ratio on reproductive performance, fecal microbiota and nutrient digestibility of gestation-lactating sows and suckling piglets. Anim Sci J. (2017) 88:1744–52. doi: 10.1111/asj.12819
2. Gabbs, M, Leng, S, Devassy, JG, Monirujjaman, M, and Aukema, HM. Advances in our understanding of oxylipins derived from dietary PUFAs. Adv Nutr. (2015) 6:513–40. doi: 10.3945/an.114.007732
3. Liput, KP, Lepczyński, A, Ogłuszka, M, Nawrocka, A, Poławska, E, Grzesiak, A, et al. Effects of dietary n-3 and n-6 polyunsaturated fatty acids in inflammation and cancerogenesis. Int J Mol Sci. (2021) 22:6965. doi: 10.3390/ijms22136965
4. Simopoulos, AP. The importance of the omega-6/omega-3 fatty acid ratio in cardiovascular disease and other chronic diseases. Exp Biol Med (Maywood). (2008) 233:674–88. doi: 10.3181/0711-mr-311
5. Simopoulos, AP. An increase in the omega-6/omega-3 fatty acid ratio increases the risk for obesity. Nutrients. (2016) 8:128. doi: 10.3390/nu8030128
6. Zhang, Y, Sun, Y, Yu, Q, Song, S, Brenna, JT, Shen, Y, et al. Higher ratio of plasma omega-6/omega-3 fatty acids is associated with greater risk of all-cause, cancer, and cardiovascular mortality: a population-based cohort study in UK biobank. eLife. (2024) 12:RP90132. doi: 10.7554/eLife.90132
7. Manaig, YJY, Sandrini, S, Panseri, S, Tedeschi, G, Folch, JM, Sánchez, A, et al. Low n-6/n-3 gestation and lactation diets influence early performance, muscle and adipose polyunsaturated fatty acid content and deposition, and relative abundance of proteins in suckling piglets. Molecules. (2022) 27:2925. doi: 10.3390/molecules27092925
8. Al-Madhagy, S, Ashmawy, NS, Mamdouh, A, Eldahshan, OA, and Farag, MA. A comprehensive review of the health benefits of flaxseed oil in relation to its chemical composition and comparison with other omega-3-rich oils. Eur J Med Res. (2023) 28:240. doi: 10.1186/s40001-023-01203-6
9. Currie, E, Schulze, A, Zechner, R, Walther, TC, and Farese, RV Jr. Cellular fatty acid metabolism and cancer. Cell Metab. (2013) 18:153–61. doi: 10.1016/j.cmet.2013.05.017
10. Xiao, C, Stahel, P, Carreiro, AL, Buhman, KK, and Lewis, GF. Recent advances in triacylglycerol mobilization by the gut. Trends Endocrinol Metab. (2018) 29:151–63. doi: 10.1016/j.tem.2017.12.001
11. Yi, W, Huang, Q, Wang, Y, and Shan, T. Lipo-nutritional quality of pork: the lipid composition, regulation, and molecular mechanisms of fatty acid deposition. Anim Nutr. (2023) 13:373–85. doi: 10.1016/j.aninu.2023.03.001
12. Wang, H, Airola, MV, and Reue, K. How lipid droplets "TAG" along: Glycerolipid synthetic enzymes and lipid storage. Biochim Biophys Acta Mol Cell Biol Lipids. (2017) 1862:1131–45. doi: 10.1016/j.bbalip.2017.06.010
13. Dai, J, Liang, K, Zhao, S, Jia, W, Liu, Y, Wu, H, et al. Chemoproteomics reveals baicalin activates hepatic CPT1 to ameliorate diet-induced obesity and hepatic steatosis. Proc Natl Acad Sci USA. (2018) 115:E5896–905. doi: 10.1073/pnas.1801745115
14. Szostak, A, Ogłuszka, M, Te Pas, MF, Poławska, E, Urbański, P, Juszczuk-Kubiak, E, et al. Effect of a diet enriched with omega-6 and omega-3 fatty acids on the pig liver transcriptome. Genes Nutr. (2016) 11:9. doi: 10.1186/s12263-016-0517-4
15. Mustonen, AM, and Nieminen, P. Dihomo-γ-linolenic acid (20, 3n-6)-metabolism, derivatives, and potential significance in chronic inflammation. Int J Mol Sci. (2023) 24:2116. doi: 10.3390/ijms24032116
16. González-Becerra, K, Ramos-Lopez, O, Barrón-Cabrera, E, Riezu-Boj, JI, Milagro, FI, Martínez-López, E, et al. Fatty acids, epigenetic mechanisms and chronic diseases: a systematic review. Lipids Health Dis. (2019) 18:178. doi: 10.1186/s12944-019-1120-6
17. Duan, Y, Li, F, Li, L, Fan, J, Sun, X, and Yin, Y. N-6: n-3 PUFA ratio is involved in regulating lipid metabolism and inflammation in pigs. Br J Nutr. (2014) 111:445–51. doi: 10.1017/s0007114513002584
18. Li, F, Duan, Y, Li, Y, Tang, Y, Geng, M, Oladele, OA, et al. Effects of dietary n-6: n-3 PUFA ratio on fatty acid composition, free amino acid profile and gene expression of transporters in finishing pigs. Br J Nutr. (2015) 113:739–48. doi: 10.1017/s0007114514004346
19. Nong, Q, Wang, L, Zhou, Y, Sun, Y, Chen, W, Xie, J, et al. Low dietary n-6/n-3 PUFA ratio regulates meat quality, reduces triglyceride content, and improves fatty acid composition of meat in Heigai pigs. Animals (Basel). (2020) 10:1543. doi: 10.3390/ani10091543
20. Wang, L, Nong, Q, Zhou, Y, Sun, Y, Chen, W, Xie, J, et al. Changes in serum fatty acid composition and metabolome-microbiome responses of Heigai pigs induced by dietary N-6/n-3 polyunsaturated fatty acid ratio. Front Microbiol. (2022) 13:917558. doi: 10.3389/fmicb.2022.917558
21. Lepage, G, and Roy, CC. Direct transesterification of all classes of lipids in a one-step reaction. J Lipid Res. (1986) 27:114–20. doi: 10.1016/S0022-2275(20)38861-1
22. Livak, KJ, and Schmittgen, TD. Analysis of relative gene expression data using real-time quantitative PCR and the 2(−delta delta C (T)) method. Methods. (2001) 25:402–8. doi: 10.1006/meth.2001.1262
23. Lin, Y, Cheng, X, Mao, J, Wu, D, Ren, B, Xu, SY, et al. Effects of different dietary n-6/n-3 polyunsaturated fatty acid ratios on boar reproduction. Lipids Health Dis. (2016) 15:31. doi: 10.1186/s12944-016-0193-8
24. Liu, Q, Zhou, YF, Duan, RJ, Wei, HK, Jiang, SW, and Peng, J. Effects of dietary n-6: n-3 fatty acid ratio and vitamin E on semen quality, fatty acid composition and antioxidant status in boars. Anim Reprod Sci. (2015) 162:11–9. doi: 10.1016/j.anireprosci.2015.08.012
25. Ibrahim, D, El-Sayed, R, Khater, SI, Said, EN, and El-Mandrawy, SAM. Changing dietary n-6: n-3 ratio using different oil sources affects performance, behavior, cytokines mRNA expression and meat fatty acid profile of broiler chickens. Anim Nutr. (2018) 4:44–51. doi: 10.1016/j.aninu.2017.08.003
26. Wolf, C, Gredig, N, Ulbrich, SE, Kreuzer, M, Berard, J, and Giller, K. Partitioning of rumen-protected n-3 and n-6 fatty acids is organ-specific in growing angus heifers. Lipids. (2019) 54:503–17. doi: 10.1002/lipd.12183
27. Zhu, H, Wang, H, Wang, S, Tu, Z, Zhang, L, Wang, X, et al. Flaxseed oil attenuates intestinal damage and inflammation by regulating necroptosis and TLR4/NOD signaling pathways following lipopolysaccharide challenge in a piglet model. Mol Nutr Food Res. (2018) 62:e1700814. doi: 10.1002/mnfr.201700814
28. Kang, P, Wang, Y, Li, X, Wan, Z, Wang, X, Zhu, H, et al. Effect of flaxseed oil on muscle protein loss and carbohydrate oxidation impairment in a pig model after lipopolysaccharide challenge. Br J Nutr. (2020) 123:859–69. doi: 10.1017/s0007114519002393
29. Wang, L, Tu, Z, Wang, H, Wang, S, Wang, X, Zhu, H, et al. Flaxseed oil improves liver injury and inhibits necroptotic and inflammatory signaling pathways following lipopolysaccharide challenge in a piglet model. J Funct Foods. (2018) 46:482–9. doi: 10.1016/j.jff.2018.05.015
30. Si, S, Hou, L, Chen, X, Li, W, Liu, X, Liu, C, et al. Exploring the causal roles of circulating remnant lipid profile on cardiovascular and cerebrovascular diseases: Mendelian randomization study. J Epidemiol. (2022) 32:205–14. doi: 10.2188/jea.JE20200305
31. Geyer, PE, Voytik, E, Treit, PV, Doll, S, Kleinhempel, A, Niu, L, et al. Plasma proteome profiling to detect and avoid sample-related biases in biomarker studies. EMBO Mol Med. (2019) 11:e10427. doi: 10.15252/emmm.201910427
32. Shen, Y, Sen, A, Turgeon, DK, Ren, J, Graifman, G, Ruffin, MT t, et al. Changes in serum, red blood cell, and colonic fatty acids in a personalized omega-3 fatty acid supplementation trial. Nutr Cancer. (2022) 74:565–78. doi: 10.1080/01635581.2021.1903950
33. Liu, WC, and Kim, IH. Effects of different dietary n-6: n-3 PUFA ratios on growth performance, blood lipid profiles, fatty acid composition of pork, carcass traits and meat quality in finishing pigs. Ann Anim Sci. (2018) 18:143–54. doi: 10.1515/aoas-2017-0026
34. Li, M, Zhai, S, Xie, Q, Tian, L, Li, X, Zhang, J, et al. Effects of dietary n-6: n-3 PUFA ratios on lipid levels and fatty acid profile of cherry valley ducks at 15-42 days of age. J Agric Food Chem. (2017) 65:9995–10002. doi: 10.1021/acs.jafc.7b02918
35. Gray, B, Steyn, F, Davies, PS, and Vitetta, L. Omega-3 fatty acids: a review of the effects on adiponectin and leptin and potential implications for obesity management. Eur J Clin Nutr. (2013) 67:1234–42. doi: 10.1038/ejcn.2013.197
36. Engin, A. Adiponectin resistance in obesity: adiponectin leptin/insulin interaction. Adv Exp Med Biol. (2024) 1460:431–62. doi: 10.1007/978-3-031-63657-8_15
37. Habegger, KM. Cross talk between insulin and glucagon receptor signaling in the hepatocyte. Diabetes. (2022) 71:1842–51. doi: 10.2337/dbi22-0002
38. Fan, L, Peng, Y, Wu, D, Hu, J, Shi, X, Yang, G, et al. Dietary supplementation of Morus nigra L. leaves decrease fat mass partially through elevating leptin-stimulated lipolysis in pig model. J Ethnopharmacol. (2020) 249:112416. doi: 10.1016/j.jep.2019.112416
39. Karalis, DG. A review of clinical practice guidelines for the management of hypertriglyceridemia: a focus on high dose omega-3 fatty acids. Adv Ther. (2017) 34:300–23. doi: 10.1007/s12325-016-0462-y
40. Shan, T, Wang, Y, Wu, T, Guo, J, Liu, J, Feng, J, et al. Porcine adipose triglyceride lipase complementary deoxyribonucleic acid clone, expression pattern, and regulation by resveratrol. J Anim Sci. (2008) 86:1781–8. doi: 10.2527/jas.2007-0659
41. Shan, T, Wu, T, Reng, Y, and Wang, Y. Breed difference and regulation of the porcine adipose triglyceride lipase and hormone sensitive lipase by TNFalpha. Anim Genet. (2009) 40:863–70. doi: 10.1111/j.1365-2052.2009.01927.x
42. Hall, AM, Smith, AJ, and Bernlohr, DA. Characterization of the acyl-CoA synthetase activity of purified murine fatty acid transport protein 1. J Biol Chem. (2003) 278:43008–13. doi: 10.1074/jbc.M306575200
43. Realini, CE, Duran-Montgé, P, Lizardo, R, Gispert, M, Oliver, MA, and Esteve-Garcia, E. Effect of source of dietary fat on pig performance, carcass characteristics and carcass fat content, distribution and fatty acid composition. Meat Sci. (2010) 85:606–12. doi: 10.1016/j.meatsci.2010.03.011
44. Alagawany, M, Elnesr, SS, Farag, MR, Abd El-Hack, ME, Khafaga, AF, Taha, AE, et al. Omega-3 and omega-6 fatty acids in poultry nutrition: effect on production performance and health. Animals (Basel). (2019) 9:573. doi: 10.3390/ani9080573
45. Qi, KK, Chen, JL, Zhao, GP, Zheng, MQ, and Wen, J. Effect of dietary omega 6/omega 3 on growth performance, carcass traits, meat quality and fatty acid profiles of Beijing-you chicken. J Anim Physiol Anim Nutr (Berl). (2010) 94:474–85. doi: 10.1111/j.1439-0396.2009.00932.x
46. Dierge, E, Debock, E, Guilbaud, C, Corbet, C, Mignolet, E, Mignard, L, et al. Peroxidation of n-3 and n-6 polyunsaturated fatty acids in the acidic tumor environment leads to ferroptosis-mediated anticancer effects. Cell Metab. (2021) 33:1701–15.e5. doi: 10.1016/j.cmet.2021.05.016
47. Yang, XF, Qiu, YQ, Wang, L, Gao, KG, and Jiang, ZY. A high-fat diet increases body fat mass and up-regulates expression of genes related to adipogenesis and inflammation in a genetically lean pig. J Zhejiang Univ Sci B. (2018) 19:884–94. doi: 10.1631/jzus.B1700507
48. Chen, Y, Zhang, J, Cui, W, and Silverstein, RL. CD36, a signaling receptor and fatty acid transporter that regulates immune cell metabolism and fate. J Exp Med. (2022) 219:e20211314. doi: 10.1084/jem.20211314
49. Sebastián, D, Guitart, M, García-Martínez, C, Mauvezin, C, Orellana-Gavaldà, JM, Serra, D, et al. Novel role of FATP1 in mitochondrial fatty acid oxidation in skeletal muscle cells. J Lipid Res. (2009) 50:1789–99. doi: 10.1194/jlr.M800535-JLR200
50. Jeppesen, J, Jordy, AB, Sjøberg, KA, Füllekrug, J, Stahl, A, Nybo, L, et al. Enhanced fatty acid oxidation and FATP4 protein expression after endurance exercise training in human skeletal muscle. PLoS One. (2012) 7:e29391. doi: 10.1371/journal.pone.0029391
Glossary
ACC - Acetyl CoA carboxylase
ACLY - ATP citrate lyase
ACS - Acyl CoA synthetase
ADFI - Average daily feed intake
ADG - Average daily gain
AGPAT - Acylglycerol 3 phosphate acyltransferase
ATGL - Adipose triglyceride lipase
CPT1 - Carnitine palmitoyl transferase 1
DGAT - Diacylglycerol acyltransferases
F/G - Feed to gain ratio
FABP - Fatty acid-binding protein
FAT/CD36 - Fatty acid translocase
FATP - Fatty acid transport protein
G3P - Glycerol 3 phosphate
GPAT - Glycerol 3 phosphate acyltransferase
HDL - High density lipoprotein
HSL - Hormone sensitive lipase
LDL - Low density lipoprotein
MAGL - Monoacylglycerol lipase
MGAT - Monoacylglycerol acyltransferase
PAP - Phosphatidic acid phosphatase
PPAR - Peroxisome proliferator activated receptor
PUFA - Polyunsaturated fatty acid
SREBP1 - Sterol regulatory element binding protein 1
TAG - Triglycerides
TC - Total cholesterol
TG - Triglyceride
Keywords: n-6 PUFA, n-3 PUFA, fatty acid, lipid metabolism, nursery pigs
Citation: Guo J, Chen X, Zhu H, Xiao K, Zhang Y, Zhao S, Chen G and Liu Y (2025) Effects of dietary n-6/n-3 PUFA ratio on growth performance and lipid metabolism in nursery pigs. Front. Vet. Sci. 12:1643724. doi: 10.3389/fvets.2025.1643724
Edited by:
Ricardo Key Yamazaki, Federal University of the Southern Frontier, BrazilReviewed by:
Tongxing Song, Huazhong Agricultural University, ChinaSimara Larissa Fanalli, University of São Paulo, Brazil
Copyright © 2025 Guo, Chen, Zhu, Xiao, Zhang, Zhao, Chen and Liu. This is an open-access article distributed under the terms of the Creative Commons Attribution License (CC BY). The use, distribution or reproduction in other forums is permitted, provided the original author(s) and the copyright owner(s) are credited and that the original publication in this journal is cited, in accordance with accepted academic practice. No use, distribution or reproduction is permitted which does not comply with these terms.
*Correspondence: Yulan Liu, eXVsYW5mbG93ZXJAMTI2LmNvbQ==