 Zhengge Zhao1†
 Zhiming Hou2†
 Jianmin Chai1†Chunfang Li3Tingyu Liu3Jianming Li3
 Shuyi Zhang2
 Lei Zhang2*Yabin Ma3*
- 1Guangdong Provincial Key Laboratory of Animal Molecular Design and Precise Breeding, School of Animal Science and Technology, Foshan University, Foshan, China
- 2College of Animal Science and Veterinary Medicine, Shenyang Agricultural University, Shenyang, China
- 3Hebei Animal Husbandry and Breeding Work Station, Shijiazhuang, China
Introduction: Mastitis is one of the costliest diseases in the dairy industry. Escherichia coli (E. coli) and Staphylococcus aureus (S. aureus) are the two most predominant pathogens. However, the specific molecular mechanisms underlying the interactions between these pathogens and bovine mammary epithelial cells, especially for two pathogenic co-infections, remain poorly understood.
Methods: Here, this study employed high-throughput RNA sequencing to comprehensively analyze the gene expression changes in bovine mammary epithelial cells upon individual and co-infection with E. coli and S. aureus.
Results: Transcriptomic analysis identified 282 differentially expressed genes (DEGs) in the E. coli-infected group (E group), with 246 upregulated and 36 downregulated genes. Notably, pro-inflammatory genes (CXCL8, GRO1, CCL20) were significantly induced, and functional enrichment analysis demonstrated robust activation of inflammatory pathways including TLR/NF-κB and IL-17 signaling cascades. In contrast, the S. aureus-infected group (S group) exhibited 354 DEGs (314 upregulated, 40 downregulated), featuring pathogen-specific upregulated genes (ESM1, IL18RAP). Functional annotation revealed predominant involvement of metabolic processes, particularly ATP metabolism and chaperone complex activities. The co-infection group (ES group) displayed 307 DEGs (277 upregulated, 30 downregulated), demonstrating a unique “inflammatory-metabolic” dual-mode signature that integrated inflammatory features from the E group with metabolic reprogramming characteristics of the S group. Protein-protein interaction network analysis further delineated pathogen-specific hubs: inflammatory mediators (CXCL8, CCL20, IL6) in the E group, molecular chaperones (CCT5, RUVBL1/2) in the S group, and a distinctive IL6-FBL-centered network in co-infection. These findings elucidate pathogen-specific molecular mechanisms at the transcriptomic level, particularly revealing a unique “inflammatory-metabolic” dual-mode regulatory network during co-infection states. These findings provide new insights into the pathogenesis of mastitis and provide a theoretical basis for developing targeted prevention and control strategies.
1 Introduction
Bovine mastitis, a common disease threatening the healthy development of the global dairy industry, causes enormous economic losses annually. It is estimated that the direct economic losses caused by clinical mastitis alone reach hundreds of dollars per cow (1). In the meantime, the impact of subclinical mastitis is even more widespread, such as reducing milk yield and quality (2, 3), and increasing antibiotic usage (4), thereby raising public health concerns about food safety and bacterial resistance (5). The etiology of mastitis involves factors such as feeding management, environmental conditions, and pathogenic microorganisms, with bacterial infections being the primary cause. Among the various pathogens, Escherichia coli (E. coli) and Staphylococcus aureus (S. aureus) are representative. Current research has found that their infection characteristics differ: E. coli primarily causes acute clinical mastitis, whereas S. aureus tends to lead to chronic and persistent infections. The two pathogens exhibit significant differences in pathogenic mechanisms and host responses (6). These differences suggest that during the invasion of bovine mammary epithelial cells, the two pathogens may activate distinct host recognition receptors (such as TLR4 and TLR2), regulate different cellular signaling transduction networks (such as the NF-κB and MAPK pathways), and ultimately induce specific immune response patterns in the host cells (7).
In recent years, with the advancement of molecular and cellular biology technologies, significant progress has been made in research on the interactions between mammary epithelial cells and pathogenic bacteria. Currently, studies on the molecular mechanisms of single infections by E. coli or S. aureus have been relatively well-established. E. coli primarily activates the Toll-like receptor 4 (TLR4) signaling pathway via lipopolysaccharide (LPS), triggering a strong inflammatory response (8). In contrast, S. aureus disrupts epithelial barrier function through virulence factors, such as α-hemolysin and demonstrates stronger intracellular parasitism (9). Multiple studies have also found that nutrient-sensing regulators play an important role in alleviating bacteria-induced inflammatory responses. Studies have shown that selenomethionine (10–12) and cis-9, trans-11 conjugated linoleic acid (13) mitigate E. coli-induced inflammation through distinct mechanisms. Furthermore, PINK1/Parkin-mediated mitophagy (14) and selenium-mediated ROS modulation (15) have been found to attenuate NLRP3 inflammasome activation (16) triggered by S. aureus in bovine mammary epithelial cells. While extensive research has focused on infections caused by either pathogen individually, the synergistic interaction mechanisms of these two bacterial co-infections that are usually observed in industry remain poorly understood.
Although numerous studies have investigated single-pathogen infection mechanisms, the regulatory effects of E. coli and S. aureus on host cells at the transcriptomic level—particularly their synergistic or antagonistic interactions during co-infection—remain poorly understood. Several critical questions are needed to be addressed: (1) How do these two pathogens differentially modulate host gene expressions to evade immune defenses? (2) Whether unique transcriptional regulatory patterns emerge during co-infection? (3) How does the infection dose influence these interactions? To address these gaps, this study employs transcriptomic sequencing to delineate the molecular interaction networks in bovine mammary epithelial cells during mono- or co-infection with E. coli and S. aureus. By elucidating both pathogen-host and pathogen-pathogen interaction mechanisms, our findings will provide theoretical foundations and experimental evidence for understanding mastitis pathogenesis and developing more effective prevention strategies.
2 Materials and methods
2.1 Experimental design
A systematic experiment was designed to investigate the host-pathogen interaction mechanisms. The bovine mammary epithelial cells (Mac-T cell line) were challenged by blank, Escherichia coli, Staphylococcus aureus and both pathogens. At the same time, Mac-T cells were subjected to mono- or co-infection at three different multiplicity of infection ratios (10:1, 1:1, and 1:10) to simulate varying infection intensities (group-named as 1, 2, and 3, respectively). Each infection ration had 4 replicates.
2.2 Cell culture and pathogen stimulation
This study utilized Mac-T cells (a bovine mammary epithelial cell line) obtained from the Shanghai Cell Bank. After thawing from liquid nitrogen storage, the cells were cultured in complete medium consisting of 89% DMEM basal medium, 10% fetal bovine serum (FBS), and 1% penicillin/streptomycin (double antibiotics). The cells were maintained in a constant temperature incubator at 37°C with 5% CO₂. To ensure experimental stability and reproducibility, the MAC-T cells were passaged for 3 consecutive generations (approximately 48 h per passage) prior to formal experiments to establish a homogeneous and well-conditioned cell population. During this period, cell morphology and growth status were regularly observed under an inverted microscope to avoid contamination or abnormal growth. Once cell growth stabilized, the cells were digested with 0.25% Trypsin–EDTA to prepare a uniform cell suspension for subsequent experiments.
For the preparation of Escherichia coli and Staphylococcus aureus, 0.5–0.8 mL of LB liquid medium was pipetted into the lyophilized bacterial ampoules, mixed thoroughly, and inoculated into liquid medium. The cultures were then incubated at 37°C with shaking at 150 rpm for 24 h. A 100 μL aliquot of the bacterial suspension was streaked onto TSA plates and incubated at 37°C for 24 h. Single colonies were picked up and inoculated into LB liquid medium, followed by 12 h of shaking at 37°C for subsequent use. The bacterial suspension was then transferred to 100 mL of LB liquid medium, and samples were collected at 0, 1.5, 3, 4, 6, 8, 10, 14, 16, and 20 h to measure the OD₆₀₀ and perform plate counting, establishing the bacterial growth curve.
MAC-T cells were seeded into 6-well plates, and when cell density reached 80%, they were washed three times with sterile phosphate-buffered saline (PBS) and switched to serum-free, antibiotic-free DMEM basal medium for a 2-h incubation at 37°C. Bacterial suspensions of E. coli, S. aureus, or a mixture of both pathogens were added at multiplicity of infection (MOI) ratios of 10:1, 1:1, and 1:10, respectively, followed by incubation at 37°C with 5% CO₂ for 2 h. After discarding the culture medium, the cells were washed three times with pre-warmed PBS. The cells were then incubated for 1 h in complete medium containing gentamicin (50 μg/mL) to eliminate extracellular bacteria. Following incubation, the cells were washed three additional times with pre-warmed PBS to completely remove residual gentamicin. Finally, the cells were cultured in fresh complete medium supplemented with 5 μL of double antibiotics (penicillin/streptomycin) for further maintenance. The culture medium from the inflammatory and control groups was collected in sterile EP tubes for further analysis. Additionally, a portion of the inflammatory and control cells were lysed to obtain cell lysates. The collected culture medium and cell lysates were spread onto LB plates and incubated at 37°C for 24 h to assess the successful establishment of the inflammation model. If the model was successfully established, no bacterial colonies would grow in the culture medium, while colonies would be observed in the inflammatory cell lysates, with no colonies present in the control group lysates.
2.3 RNA extraction, and transcriptomics sequencing
This study extracted total RNA from MAC-T cells using TRIzol reagent (Takara, Beijing, China) following the manufacturer’s standard protocol. All procedures were performed on ice with strict time control to minimize RNA degradation. The extracted RNA samples were immediately dissolved in RNase-free water, and their concentration, purity, and integrity (RIN > 7.0) were assessed using a Nanodrop spectrophotometer and agarose gel electrophoresis. Qualified samples were sent to Novogene Co., Ltd. (Tianjin China) for RNA-seq library preparation and sequencing analysis. RNA sequencing was performed on the Novaseq-PE150 platform to generate 150 aired end reads.
2.4 Bioinformatics
Raw sequencing data were processed using Trimmomatic (v0.39) (17) with the following parameters: Phred+33 quality encoding format; sliding window trimming (SLIDINGWINDOW:4:20) where reads were trimmed when the average base quality in a 4-bp window fell below 20; minimum length threshold (MINLEN:60) where reads shorter than 60 bp after trimming were discarded. The resulting high-quality reads (clean data) were used for subsequent analysis. The bovine reference genome (Bos_taurus. ARS-UCD1.3) FASTA file (Bos_taurus. ARS-UCD1.3.dna_sm.toplevel.fa) was downloaded from Ensembl database, and genome indexes were built using HISAT2’s hisat-build tool for sequence alignment. The corresponding GFF3 annotation file (Bos_taurus. ARS-UCD1.3.113.gff3) was also downloaded for transcript assembly and gene annotation. Quality-controlled clean data were aligned to the reference genome using HISAT2 (18) (v2.2.1). Paired-end sequencing data from each sample were aligned to generate SAM format files, which were then converted to BAM format using SAMtools (19). The BAM files were subsequently sorted for downstream analysis. Transcript assembly was performed on the sorted BAM files using StringTie (20) (v2.2.1). Initial transcript assembly was conducted using both BAM files and GFF3 annotation files, generating GTF format files containing detailed transcript information and gene expression levels. A sample_list.txt file was created containing sample names and corresponding GTF file paths. Finally, a Python script was used to process the StringTie-generated GTF files and produce a gene count matrix (gene_count_matrix.csv).
2.5 Statistics
Principal component analysis (PCA) was performed using ImageGP (21).1 The alpha level for determining the significance of PCA separation in our study was set at 0.05. To assess the significance of the separation, we employed the PERMANOVA (Permutational Multivariate Analysis of Variance) test. In RStudio (2023.6.0.421), we conducted differential expression analysis by first mapping gene IDs from gene_count_matrix.csv to the ARS-UCD1.3 database using BioMart on Ensembl2 (22). Using DESeq2 (23) (v1.46.0), we compared experimental groups (E1, E2, E3, ES1, ES2, ES3, S1, S2, S3) against control group DZ (as denominator), with differential genes identified by Padj<0.05 & |log2FoldChange| ≥ 1. Volcano plots were generated using ggplot2 (v3.5.2). Differentially expressed genes were analyzed in STRING (24)3 with Bos taurus selected as organism and minimum interaction score set to 0.7. We performed GO and KEGG enrichment analyses and generated protein–protein interaction (PPI) networks. PPI networks were visualized in Cytoscape (25) (v3.10.3) using Analyze Network tool. Nodes were colored and sized by Degree score (darker/larger indicating higher degree), with cluster annotations showing functional descriptions. All figures were finalized and assembled using Adobe Illustrator (v2025).
3 Results
3.1 Transcriptomics characteristics
The transcriptome sequencing of 39 Bovine Mammary Epithelial Cell (BMEC) samples generated a total of 791,931,172 raw reads. After quality control, 756,830,895 high-quality reads were successfully aligned to the Bos taurus reference genome (ARS-UCD1.3, NCBI) with an overall alignment rate exceeding 94% for all samples (Supplementary Table S1). All samples were subjected to principal component analysis (PCA) (Supplementary Figure S1). There were highly significant differences between the control group (Control) and the three concentration groups of Escherichia coli infection (E1, E2, E3) (p < 0.01). The Control group showed significant differences with the high-concentration Staphylococcus aureus infection group (S1) and the medium-concentration Staphylococcus aureus infection group (S2) (p < 0.05). Additionally, the Control group exhibited a significant difference with the low-concentration co-infection group of the two pathogens (ES3) (p < 0.05) (Supplementary Table S2).
3.2 Different pathogens stimulated the changes of expressed genes in Mac-T cells
To characterize the different expressed genes (DEGs) among treatment, DESeq2 was performed. Firstly, we compared pathogenic challenged treatments and the control group (Control). Compared to Control, the Escherichia coli-infected group (E) had identified 282 DEGs including 246 upregulated and 36 downregulated genes (Supplementary Table S3). The Staphylococcus aureus-infected group (S) showed 354 DEGs (314 upregulated and 40 downregulated). For the co-infection group (ES), 307 DEGs were detected (277 upregulated and 30 downregulated). Next, the DEGs from different infection ratios of each treatment were also classified. Using Control as baseline, the high- (E1) and medium-concentration (E2) infection subgroups within Escherichia coli-infected group (E) exhibited the highest number of DEGs (291 and 303, respectively). In S, the medium-concentration subgroup (S2) had the greatest numbers of DEGs, suggesting this concentration caused the biggest alteration of Mac-T cells. Lastly, for the co-infection group (ES), the high-concentration subgroup (ES1) had the highest amount of DEGs (366), followed by medium- (ES2) and low-concentration (ES3) subgroups.
The Volcano plots were generated to visualize DEGs across treatment groups, with the top 5 upregulated and downregulated genes labeled (Figure 1; Supplementary Figure S2; Supplementary Table S4). Our results showed consistent upregulated DEGs in E and ES treatment groups regardless of the concentration of pathogens. For example, CXCL8 (IL-8, neutrophil chemoattractant), GRO1 (growth-regulated oncogene involved in inflammation), CCL20 (immune cell recruiter), TNF (core inflammatory mediator), and IL1B/IL6 (key pro-inflammatory cytokines) were upregulated genes in E, E1-E3, ES, ES1-ES3 compared to Control, suggesting a robust immune response to E. coli infection. However, concentration-dependent effects were observed: in E. coli infection, IL6 was upregulated in E1 while CSF2 (granulocyte-macrophage colony-stimulating factor) was upregulated in E3. Interestingly, top upregulated DEGs in S treatment were significantly different. In addition, similar patterns of downregulated genes were also observed. DDIT4 (DNA damage/stress regulator) consistently appeared across multiple groups (E, E1-E3, ES, S, S1-S3), potentially indicating bacterial infection-induced cellular stress or metabolic suppression. For S. aureus infection, WSB1 (ubiquitination-related) was downregulated in S1, while only DDIT4 was downregulated in S3, suggesting broader impacts on stress pathways at higher infection concentrations.
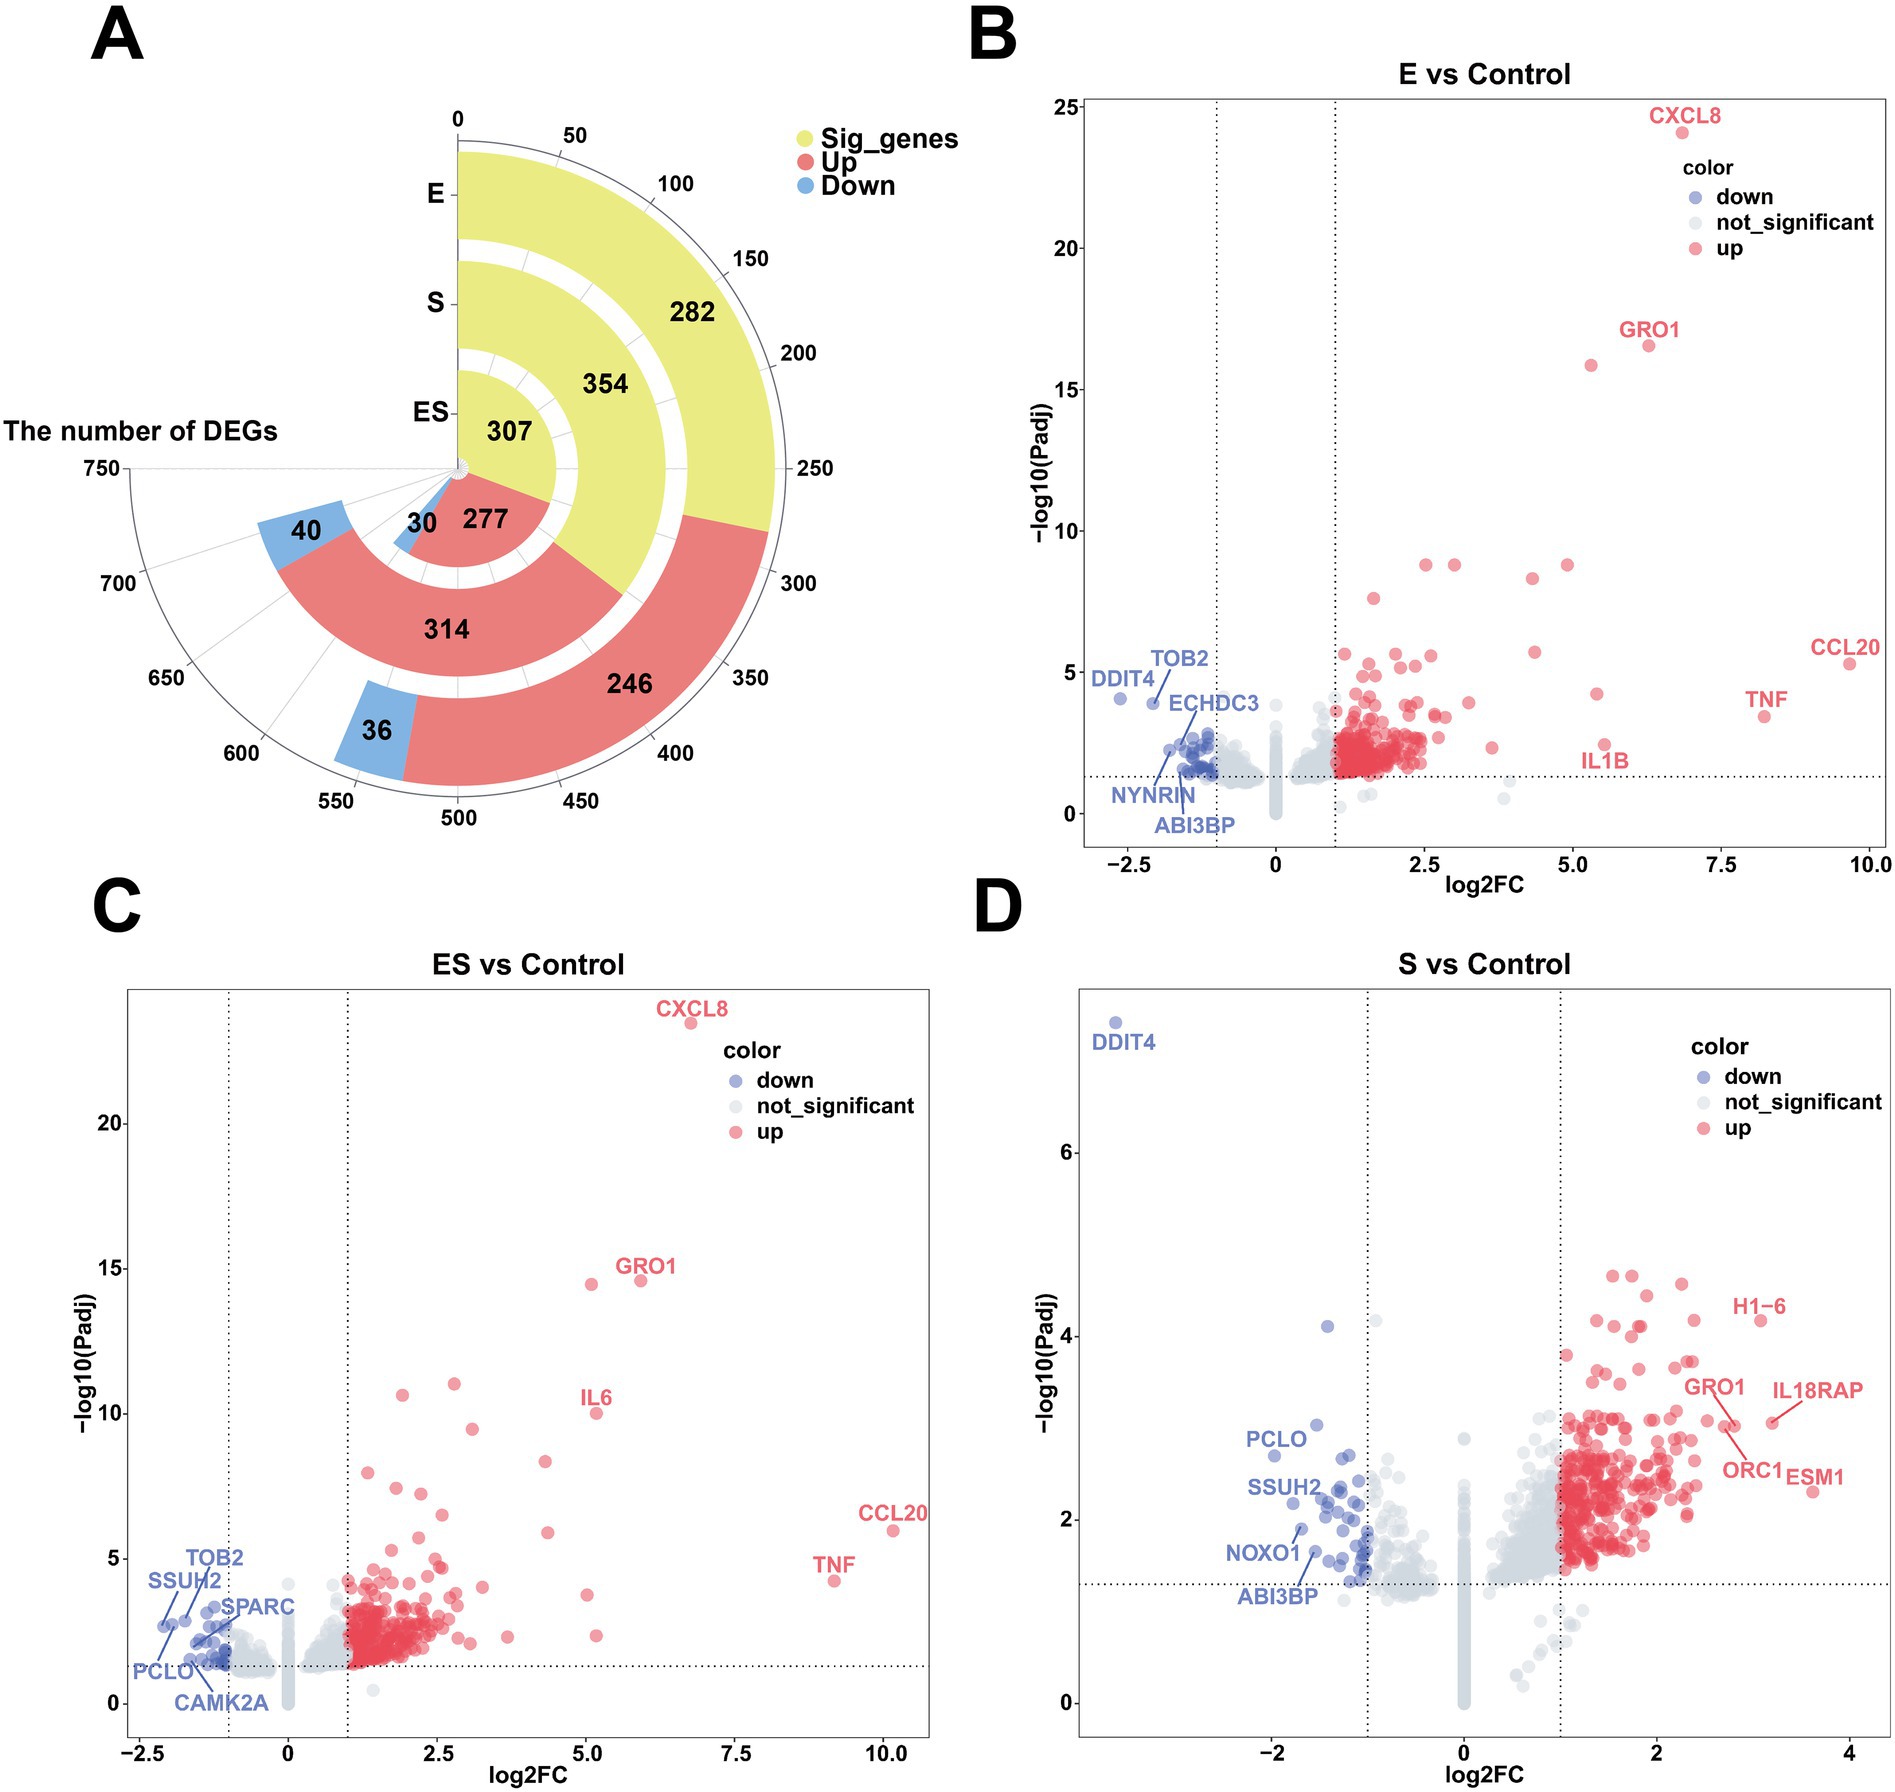
Figure 1. Differentially expressed genes in pathogen-stimulated Mac-T Cells. (A) Shows a circular bar plot of significant genes with segments for pregulated (red) and downregulated (blue) genes in Escherichia coli (E), Staphylococcus aureus (S), and co-infection (ES) groups. (B–D) Depict volcano plots comparing gene expression changes between experimental groups vs. control. Red dots indicate upregulated genes, blue dots indicate downregulated genes, and gray dots are not significant. Key genes like CXCL8 and TNF are highlighted. (B) Compares E vs. Control, (C) Compares ES vs. Control, and (D) Compares S vs. Control.
3.3 Functional enrichment analysis of differentially expressed genes in pathogen-stimulated Mac-T cells
Venn diagram analysis of differentially expressed genes (DEGs) revealed shared DEGs across different rations, such as 22 genes in E. coli infection, 18 genes in S. aureus infection, and 63 genes in co-infection treatment (Figure 2). Functional enrichment analysis of these shared DEGs is presented in Figure 2. For molecular function (MF) enrichment, significant enrichments of CXCR chemokine receptor binding and chemokine activity were found in all subgroups of both the E. coli and the co-infection treatments. Similarly, the co-infection group and subgroups in S. aureus were both enriched for ATP energy metabolism-related functions and nucleic acid (DNA/RNA) metabolic activities, such as ATP hydrolysis activity and DNA helicase activity. In biological process (BP) enrichment analysis, both the E. coli and co-infection groups were enriched for multiple immune defense pathways, including cellular response to lipopolysaccharide, chemokine-mediated signaling pathway, and cellular response to cytokine stimulus. Cellular component (CC) analysis demonstrated that the S. aureus and co-infection groups were enriched for nuclear structures such as nucleoplasm and nuclear chromosome, as well as chaperone complex. KEGG pathway enrichment analysis of the E. coli and co-infection groups identified shared immune-related signaling pathways, including the IL-17 signaling pathway, NF-kappa B signaling pathway, and Toll-like receptor signaling pathway (Supplementary Figures S6, S8, S10).
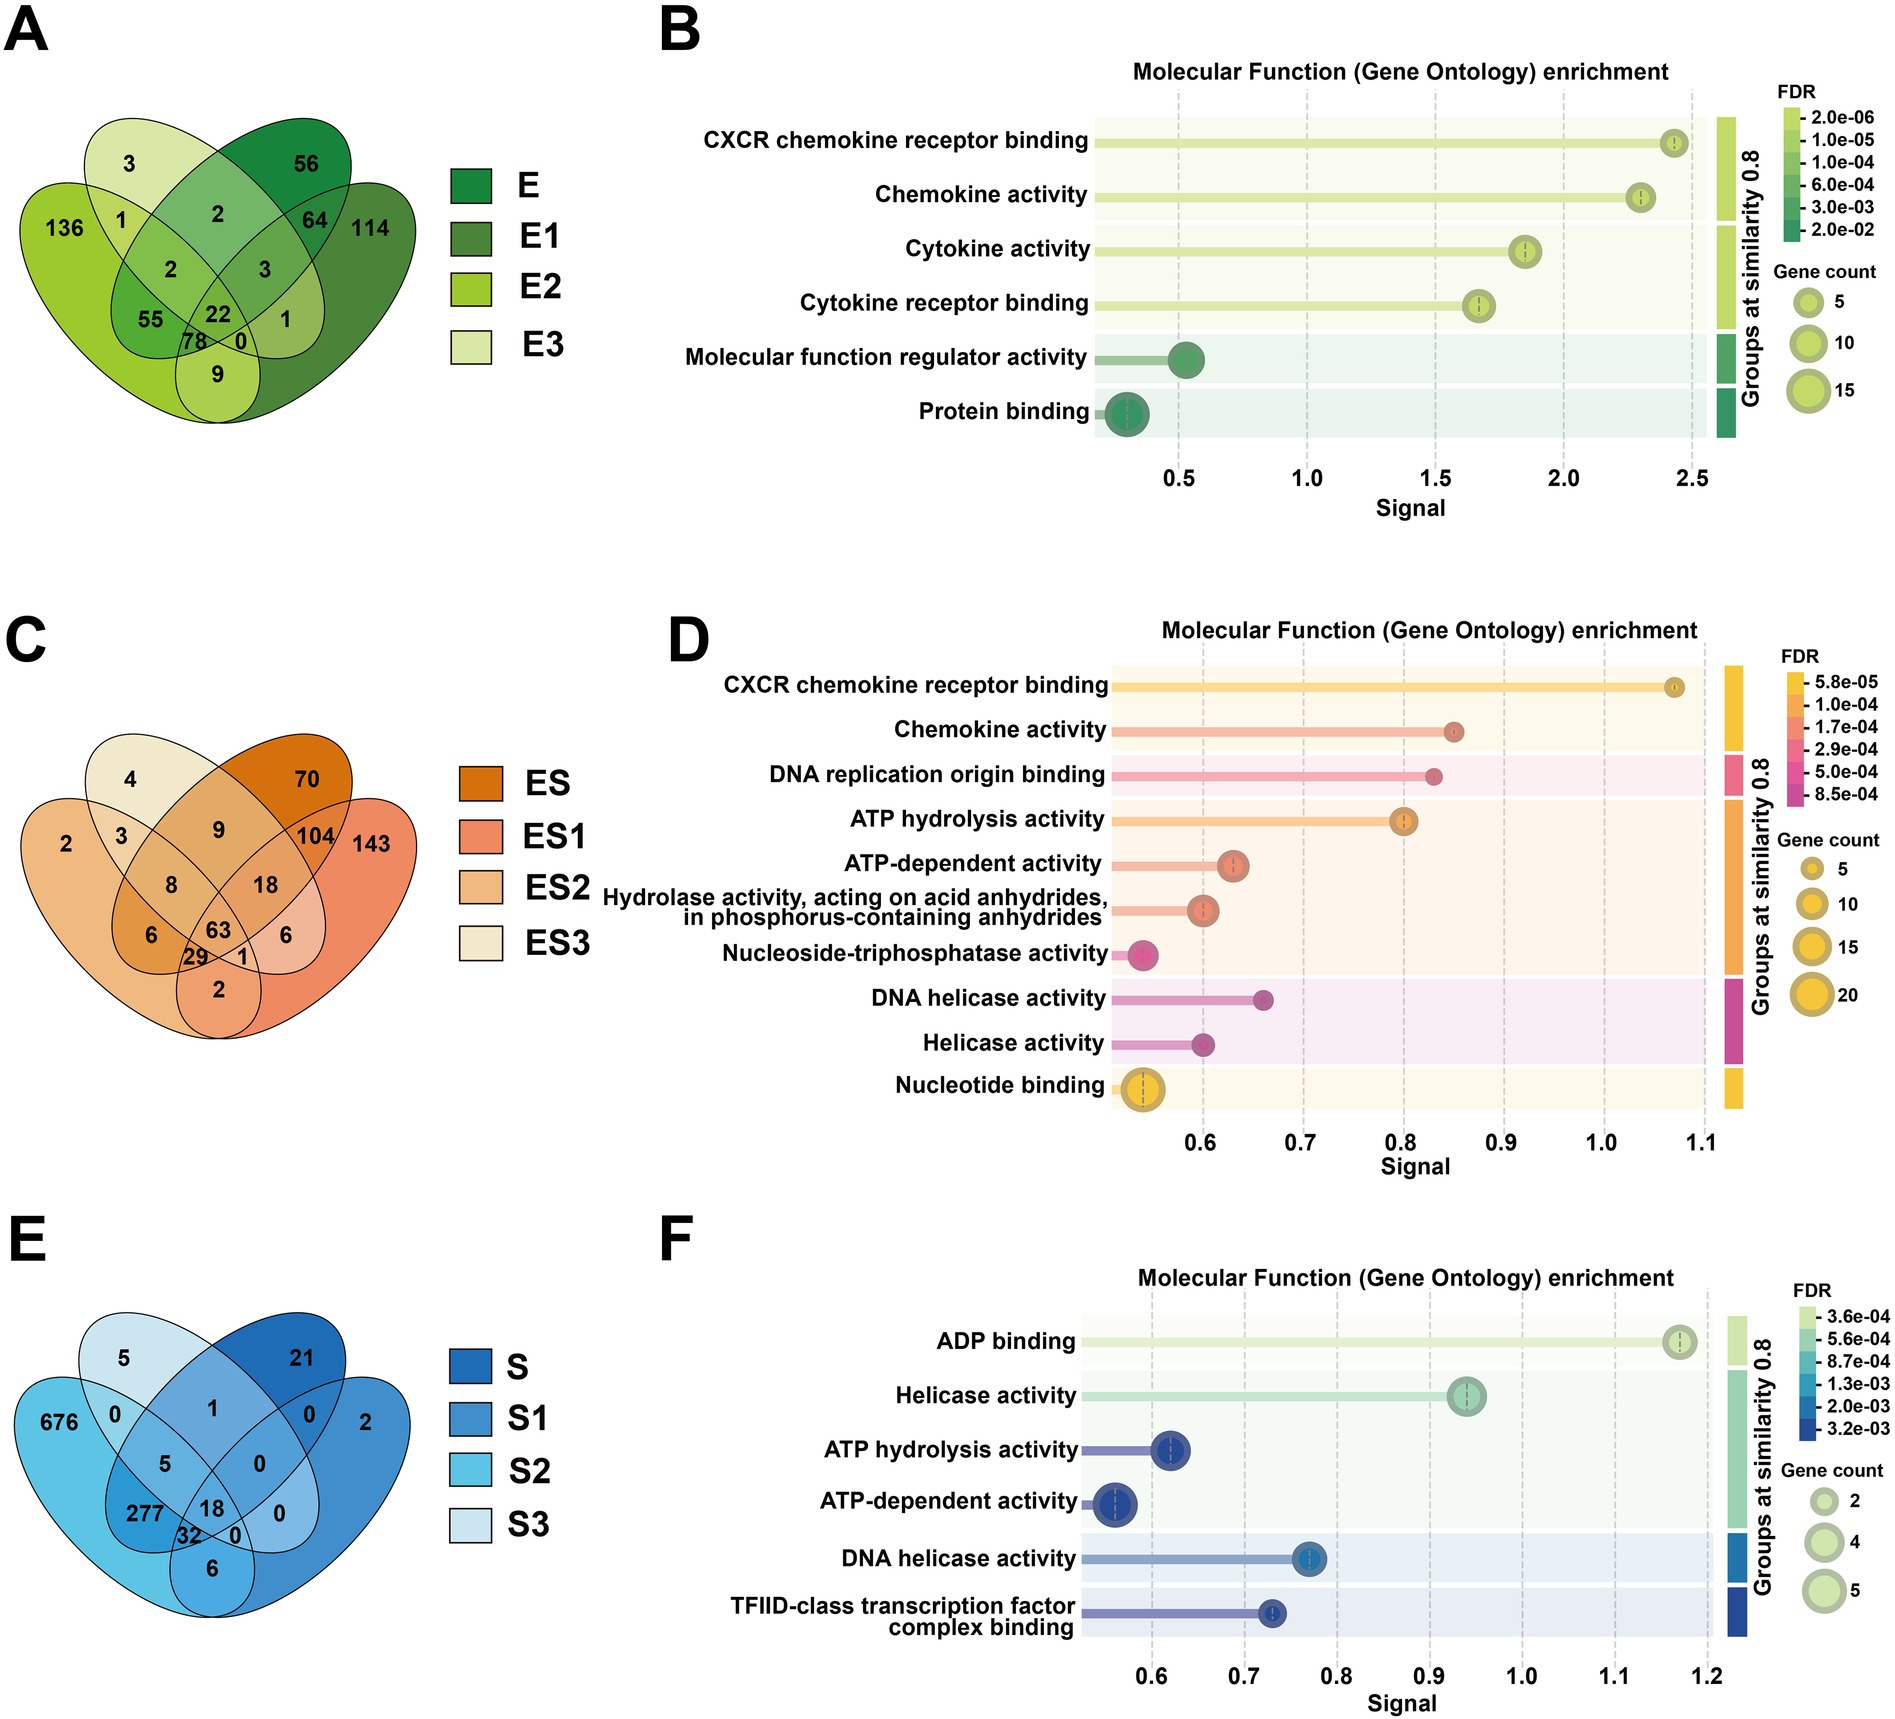
Figure 2. Comparative analysis of shared differentially expressed genes (DEGs) and their molecular functions across infection groups. (A) Shows a green Venn diagram comparing DEG overlap among Escherichia coli subgroups (E, E1, E2, E3), while (C) displays an orange Venn diagram for co-infection subgroups (ES, ES1, ES2, ES3), and (E) presents a blue Venn diagram for Staphylococcus aureus subgroups (S, S1, S2, S3). The corresponding molecular function enrichment results from Gene Ontology analysis are shown in (B, D, F): (B) illustrates enriched functions like chemokine activity in E subgroups, (D) highlights DNA helicase activity in ES subgroups, and (F) identifies ADP binding and ATP hydrolysis activities in S subgroups.
Furthermore, we identified unique genes specific to different concentrations of E. coli infection. The E3 subgroup contained three distinctive genes: HBEGF (heparin-binding epidermal growth factor), PDCD7 (programmed cell death protein 7), and SMTNL2 (smooth muscle tropomyosin light chain phosphatase regulatory subunit 2). The E1 and E2 subgroups exhibited 114 and 136 unique genes, respectively (Supplementary Figure S3). Functional enrichment analysis of E1 and E2 revealed that both subgroups were associated with rRNA metabolic processes, rRNA processing, and ribonucleoprotein complex biogenesis in terms of biological processes (BP). However, E1 was more enriched in nucleic acid metabolic processes, RNA processing, and RNA metabolic processes, while E2 showed stronger associations with telomere maintenance and chromosome organization. For cellular components (CC), both subgroups were localized to the nucleolus and intracellular organelle lumen, consistent with rRNA processing and ribosome synthesis sites. Additionally, E1 was enriched in spliceosome-related complexes (e.g., U4/U6 x U5 tri-snRNP complex), methylation-related complexes (e.g., methyltransferase complex), and proteasome regulatory particles. In contrast, E2 was enriched in preribosomes, mitochondria, fibrillar centers, and chaperonin-containing T-complexes. Regarding molecular functions (MF), E1 was associated with proteasome-activating activity, whereas E2 was primarily linked to translation factor activity (e.g., translation initiation factor activity, RNA binding) and energy metabolism (e.g., ATP hydrolysis activity, electron transfer activity). KEGG pathway analysis indicated that both subgroups participated in neurodegenerative diseases and oxidative phosphorylation. E1 specifically showed enrichment in RNA degradation and spliceosome pathways, while E2 was uniquely associated with RNA transport and thermogenesis (Supplementary Figures S4, S5).
We also observed that different concentrations of S. aureus infection exhibited unique sets of DEGs. Specifically, the S1 subgroup contained two distinctive genes (AIRIM and ZBTB26), while the S3 subgroup had five unique genes (DUSP5, GEMIN4, HBEGF, TAF5, and TRMT1). Notably, the S2 subgroup showed the highest number of unique DEGs (676 genes) (Supplementary Figure S3). Functional enrichment analysis of S2-specific DEGs revealed predominant associations with mitochondrial respiratory chain and energy metabolism pathways. These included mitochondrial respiratory chain complex assembly, mitochondrion organization, mitochondrial respirasome, and oxidative phosphorylation (Supplementary Figure S9).
Regarding the co-infection of cells by E. coli and S. aureus, the unique genes of ES2 are DZIP1 and SMTNL2; the unique genes of ES3 are ALDH4A1, DNASE1L1, FAM227A, and KAT2B; and ES1 has 143 unique genes (Supplementary Figure S3). Functional enrichment analysis of the unique differentially expressed genes in ES1 revealed that in terms of BP, they are primarily enriched in nucleic acid metabolism and protein metabolic regulation. In terms of CC, they are mainly enriched in chaperonin complexes and nuclear structures. In terms of MF, they are primarily enriched in protein folding and nucleic acid binding. In terms of KEGG, all pathways are related to neurodegenerative diseases and involve protein homeostasis imbalance (Supplementary Figure S7).
3.4 PPI network analysis of differentially expressed genes in pathogen-stimulated Mac-T cells
Protein–protein interaction (PPI) network analysis was performed using STRING database with a minimum interaction score threshold of 0.7, revealing distinct network topologies across treatment groups (Figure 3; Supplementary Table S5). In the E group, the PPI network exhibited CXCL8, CCL20, and IL6 as central hub nodes, highlighting their pivotal roles in inflammatory responses. Conversely, the S group displayed CCT5, RUVBL1, and RUVBL2 as primary hub nodes, indicative of their involvement in protein folding and chromatin remodeling processes. Notably, k-means clustering of the ES group PPI network identified three functional modules, with IL6 and FBL emerging as the most prominent hub nodes, suggesting their critical involvement in the host response to polymicrobial infection.
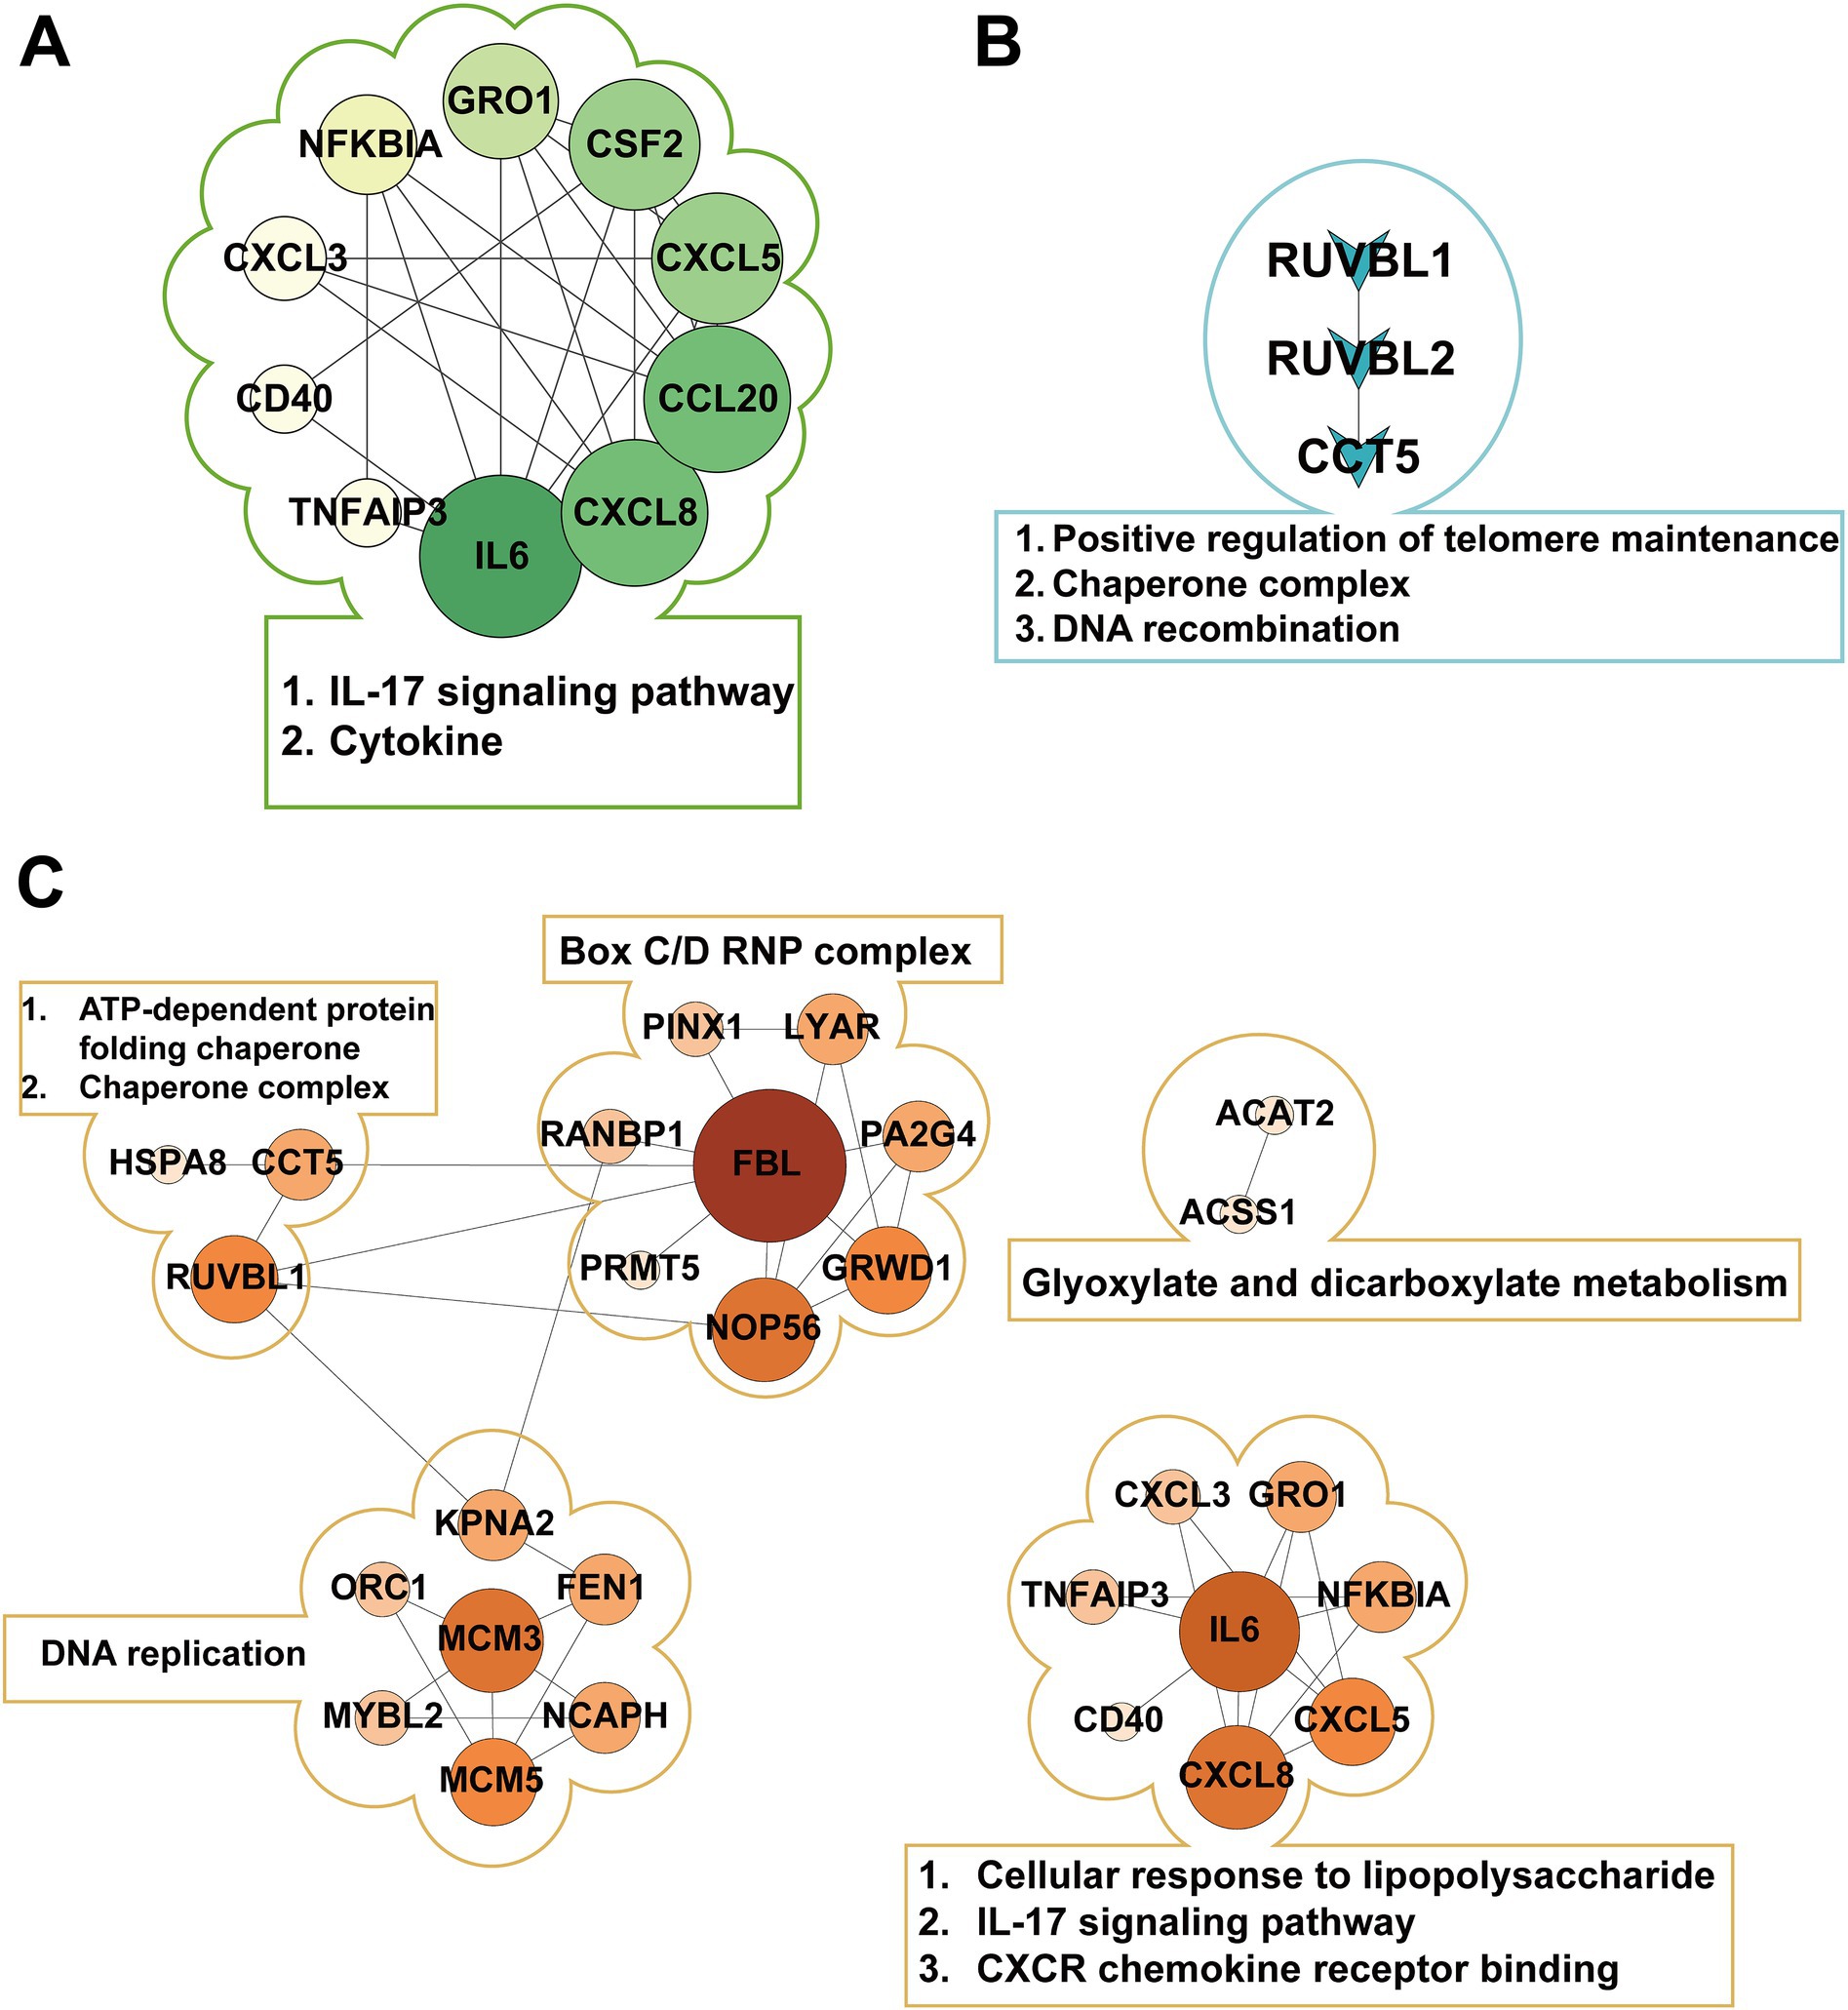
Figure 3. Protein-protein interaction (PPI) networks in different pathogenic bacterial infection groups. (A) Shows the PPI network of E1-, E2-, E3-, and E-shared genes in the Escherichia coli infection group, with IL6 as the central hub. (B) Displays the PPI network of S1-, S2-, S3-, and S-shared genes in the Staphylococcus aureus infection group, highlighting the key proteins RUVBL1, RUVBL2, and CCT5. (C) Presents the PPI network of ES1-, ES2-, ES3-, and ES-shared genes in the co-infection group, forming three distinct clusters with FBL and IL6 as core nodes.
4 Discussion
In this study, we first performed differential gene expression analysis on bovine mammary epithelial cells infected with Escherichia coli (E. coli) and Staphylococcus aureus (S. aureus). According to the DESeq2 results, the number of differentially expressed genes (DEGs) varied across different treatment groups. In the single-infection groups, S. aureus infection (S group) induced more DEGs than E. coli infection (E group) (354 vs. 282), which may reflect S. aureus’s more complex virulence factor repertoire and stronger immune activation capacity. Meanwhile, the co-infection group (ES group) had 307 DEGs, an intermediate number between the two single-infection groups, suggesting that the effect was not simply additive and indicating potential interactions or competition between the two pathogens during co-infection. This aligns with the findings of Li et al. (26), who demonstrated through QTL combinations that E. coli and S. aureus indeed interact during co-infection. Across all groups, the number of upregulated genes exceeded that of downregulated genes, indicating that the host’s primary response to bacterial infection involves gene activation rather than suppression (27, 28). Additionally, based on concentration analysis, we found that the number of DEGs in the high-concentration (E1) and medium-concentration (E2) E. coli infection groups was nearly 10 times higher than in the low-concentration (E3) group, suggesting a stronger response of bovine mammary epithelial cells to E1 and E2. Similarly, the medium-concentration S. aureus infection group (S2) exhibited over 1,000 DEGs (1,014), which were 17 times higher than the high-concentration group (S1) and 35 times higher than the low-concentration group (S3), indicating an extremely strong response of bovine mammary epithelial cells to S2. Furthermore, the response to the high-concentration co-infection group (ES1) was stronger than that of the medium- (ES2) and low-concentration (ES3) groups.
Furthermore, we analyzed the TOP5 upregulated DEGs in bovine mammary epithelial cells infected with pathogenic bacteria. CXCL8 (IL-8), a potent neutrophil chemoattractant, strongly activates neutrophil migration to infection sites through its receptors CXCR1 and CXCR2 (29), while GRO1 (CXCL1) has been established as a key mediator in bovine mastitis pathogenesis (30, 31). The classic proinflammatory cytokines TNF and IL-1B amplify inflammatory signals via the NF-κB pathway (32), and CCL20 enhances mucosal immunity by recruiting Th17 cells (33). Our study found these factors significantly upregulated in E. coli-infected bovine mammary epithelial cells, likely due to robust LPS-TLR4-NF-κB pathway activation, where bacterial lipopolysaccharide (LPS) engages TLR4 to drive expression of downstream inflammatory mediators (TNF, IL-1B) and chemokines (CXCL8, GRO1, CCL20) (34, 35). In contrast, S. aureus infection preferentially upregulated distinct molecular signatures: ESM1 [an endothelial marker regulating vascular permeability via VEGF (36)], IL18RAP [indicating NLRP3 inflammasome activation (37, 38)], the histone variant H1-6 [involved in chromatin remodeling (39)], and DNA replication initiator ORC1, demonstrating reliance on the IL18RAP-NLRP3-IL18 axis for cell-mediated immunity alongside effects on epigenomic regulation, cell cycle progression, and vascular dynamics. Notably, during co-infection, IL6 replaced IL-1B among the top five upregulated genes, suggesting a shift toward IL6-STAT3 mediated inflammation (40). CCL20 recruits Th17 cells and dendritic cells through the CCR6 receptor, activating mucosal immune defense (41). IL6 drives the differentiation of Th17 cells, forming a positive feedback loop with CCL20 to enhance antimicrobial peptide secretion (42). This establishes a “mucosal-systemic immune bridge” to cope with the special microenvironment of mixed infections. The persistent high expression of GRO1 indicates that the neutrophil response is doubly enhanced (43), which may exacerbate cell damage.
Additionally, we analyzed the TOP5 downregulated DEGs in bovine mammary epithelial cells in response to pathogenic bacterial infection. DDIT4 regulates cellular autophagy and metabolism by inhibiting mTORC1 (44), while TOB2 modulates mRNA degradation (45). In our study, predominant downregulation of ECHDC3, DDIT4, and TOB2 in the E. coil group suggests Gram-negative bacteria reprogram host metabolism by suppressing fatty acid oxidation (46) and activating mTOR pathways, while simultaneously prolonging inflammatory cytokine mRNA half-life to amplify immune responses. The observed downregulation of NOXO1 [a NADPH oxidase component regulating ROS production (47)] and PCLO (a synaptic activity regulator involved in neural signaling) in the S group indicates potential bacterial strategies to minimize tissue damage by reducing ROS generation and modulating neuro-immune crosstalk to control local inflammation. Notably, the conserved downregulation of ABI3BP [an extracellular matrix regulator inhibiting cell migration (48–50)] and DDIT4 across both E and S groups reveals pathogen-independent adaptive strategies involving Extracellular Matrix degradation and metabolic reprogramming. The ES group exhibited distinctive downregulation of SPARC [potentially accelerating tissue repair while increasing bacterial dissemination risk through impaired matrix remodeling (51)] and CAMK2A [disrupting epithelial barrier function via calcium signaling interference (52)], collectively establishing a unique “high-inflammation/low-repair” microenvironment. The persistent downregulation of TOB2 and PCLO in ES group further reinforces synergistic effects between sustained inflammatory signaling and suppressed neural regulation, presenting a non-additive gene regulatory pattern that identifies precise molecular targets for intervention in polymicrobial infections. These findings reveal conserved and pathogen-specific mechanisms of host cell reprogramming during mastitis progression.
Through comparative GO and KEGG enrichment analyses of the E. coli infection group, S. aureus infection group, and E. coli and S. aureus group, significant differences in molecular features among the three infection modes were observed. For the E. coli infection group, at the biological process (BP) level, the most prominent feature was the robust activation of the “cellular response to lipopolysaccharide,” directly reflecting the core mechanism by which E. coli triggers host immune responses via its characteristic LPS component. This process further initiated cascading reactions, including “neutrophil chemotaxis” and “chemokine-mediated signaling pathway,” aligning with the well-documented pathological hallmark of E. coli infection—massive neutrophil infiltration (53–55). Notably, the activation of the “antimicrobial humoral immune response mediated by antimicrobial peptides” suggested the simultaneous engagement of nonspecific defense mechanisms, forming a multi-layered immune protection network. In terms of molecular function (MF), the enrichment of “CXCR chemokine receptor binding” and “cytokine activity” stood out, providing a molecular interaction-based explanation for the execution of these biological processes. Importantly, these molecular functions perfectly corresponded to the neutrophil chemotaxis and inflammatory responses in BP, constituting a complete signaling cascade from recognition to effector response. KEGG pathway analysis further enriched our understanding. The enrichment of the “NF-κB signaling pathway” and “Toll-like receptor signaling pathway” confirmed the central role of the TLR4-NF-κB axis in E. coli recognition (56), while the activation of the “IL-17 signaling pathway” revealed the critical involvement of Th17 cell-mediated mucosal immune defense in this process (57). Interestingly, the enrichment of disease-related pathways such as “rheumatoid arthritis” and “transcriptional dysregulation in cancer” may imply pathological consequences resulting from prolonged or recurrent infections. These analytical results mutually corroborate, collectively delineating a comprehensive molecular map of E. coli infection: LPS activates the NF-κB pathway via TLR4, which leads to the massive secretion of pro-inflammatory cytokines and chemokines. This in turn results in neutrophil recruitment and activation, followed by antimicrobial peptide release and Th17 cell-mediated mucosal immune defense. While this process effectively combats infection, it may also lead to tissue damage and chronic inflammation risks.
For the S. aureus infection group, at the molecular function (MF) level, the significant enrichment of energy metabolism-related functions such as “ATP hydrolysis activity” and “DNA helicase activity” indicated that various toxins secreted by S. aureus disrupted host cell energy metabolism, while host cells initiated DNA damage repair mechanisms in response to infection pressure (58). Additionally, the enrichment of “TFIID-class transcription factor complex binding” suggested that S. aureus may regulate host gene expression by interfering with basal transcriptional machinery, a strategy contrasting with E. coli’s direct activation of inflammatory pathways via TLR4. In the cellular component (CC) category, the marked enrichment of protein folding-related structures such as “chaperone complex” and “R2TP complex” implied that host cells were coping with protein misfolding stress induced by bacterial toxins, while S. aureus might exploit host chaperone systems to facilitate proper folding of its own proteins. Concurrently, the enrichment of multiple chromatin-modifying complexes, including the “NuA4 histone acetyltransferase complex” and “MLL1 complex,” indicated that S. aureus infection might induce broad epigenetic modifications. These findings collectively outline the molecular signature of S. aureus infection: bacterial toxins disrupt host energy metabolism and protein homeostasis, which in turn activates chaperone systems and DNA repair mechanisms. This also interferes with transcriptional machinery and epigenetic regulation, ultimately leading to host cell dysfunction. Unlike the intense inflammatory response triggered by E. coli, S. aureus tends to achieve infection through “metabolic interference” and “epigenetic modulation.”
In the case of co-infection by E. coli and S. aureus, host cells exhibit complex molecular response mechanisms. These mechanisms involve the recognition and response to pathogens, including the activation of cells’ responses to lipopolysaccharides and chemokines through pattern recognition receptors such as TLR4, as well as the subsequent inflammatory responses and immune regulation triggered. Host cells facilitate the chemotaxis and recruitment of neutrophils by activating CXCR chemokine receptor binding and chemokine activity, while also modulating inflammatory responses through NF-κB, TNF, and IL-17 signaling pathways. Additionally, host cells undergo metabolic reprogramming, reflected in the regulation of nucleic acid and macromolecule metabolic processes, as well as the activation of energy metabolism-related pathways such as glyoxylate and dicarboxylate metabolism and pyruvate metabolism. DNA damage and repair mechanisms are also activated, involving DNA helicase activity and nucleotide binding, while cell cycle and DNA replication initiation may be utilized by the host for cellular repair or exploited by the pathogens to promote their replication. These integrated responses constitute the host’s defense strategy against co-infection, aimed at clearing pathogens and repairing damage, but they may also pose risks of tissue damage and chronic inflammation.
Although qRT-PCR is frequently employed as a validation strategy for RNA-seq findings, a recent study indicates that RNA-seq methodologies and analytical pipelines were sufficiently robust and the routine qPCR validation was not obligation—though additional confirmation may still be beneficial in specific contexts (59). Accordingly, this study relied exclusively on high-quality RNA-seq data obtained through rigorous experimental design, adequate sequencing depth, and stringent quality control measures, which can independently serve as a reliable scientific basis for drawing conclusions.
5 Conclusion
E. coli and S. aureus trigger distinct host immune responses—E. coli predominantly activates TLR4-NF-κB-driven inflammation, while S. aureus disrupts metabolic and epigenetic regulation. When E. coli and S. aureus co-infect, the host cell response becomes more complex, involving multiple aspects such as inflammatory responses, metabolic reprogramming, DNA damage and repair, and cell cycle regulation. These findings reveal pathogen-specific defense mechanisms and potential therapeutic targets for bacterial mastitis.
Data availability statement
The raw RNA-sequencing data generated in this study have been deposited in the NCBI Sequence Read Archive (SRA) under BioProject accession PRJNA1264488 (https://www.ncbi.nlm.nih.gov/bioproject/PRJNA1264488). All other data supporting the conclusions of the article are included within the article and its supplementary materials.
Ethics statement
The animal study was approved by Shenyang Agricultural University Institutional Animal Care and Use Committee. The study was conducted in accordance with the local legislation and institutional requirements.
Author contributions
ZZ: Data curation, Investigation, Writing – original draft, Formal analysis. ZH: Writing – original draft, Data curation, Investigation, Methodology, Formal analysis. JC: Formal analysis, Investigation, Writing – original draft, Data curation. CL: Writing – original draft, Data curation, Investigation. TL: Investigation, Data curation, Writing – original draft. JL: Writing – original draft, Data curation. SZ: Data curation, Writing – original draft, Investigation. LZ: Funding acquisition, Conceptualization, Supervision, Writing – review & editing, Visualization. YM: Writing – review & editing, Supervision, Funding acquisition, Visualization, Conceptualization.
Funding
The author(s) declare that financial support was received for the research and/or publication of this article. This study was funded by Hebei Agriculture Research System (HBCT2024230204), National Natural Science Foundation of China (32472853), and partly by China Postdoctoral Science Foundation (2022MD723805) as well as Educational Department of Liaoning Province project (JYTQN2023312).
Acknowledgments
We would like to thank everyone who made this article possible.
Conflict of interest
The authors declare that the research was conducted in the absence of any commercial or financial relationships that could be construed as a potential conflict of interest.
Generative AI statement
The authors declare that no Gen AI was used in the creation of this manuscript.
Publisher’s note
All claims expressed in this article are solely those of the authors and do not necessarily represent those of their affiliated organizations, or those of the publisher, the editors and the reviewers. Any product that may be evaluated in this article, or claim that may be made by its manufacturer, is not guaranteed or endorsed by the publisher.
Supplementary material
The Supplementary material for this article can be found online at: https://www.frontiersin.org/articles/10.3389/fvets.2025.1644768/full#supplementary-material
Footnotes
References
1. Rollin, E, Dhuyvetter, KC, and Overton, MW. The cost of clinical mastitis in the first 30 days of lactation: an economic modeling tool. Prev Vet Med. (2015) 122:257–64. doi: 10.1016/j.prevetmed.2015.11.006
2. Costa, A, Bovenhuis, H, Egger-Danner, C, Fuerst-Waltl, B, Boutinaud, M, Guinard-Flament, J, et al. Mastitis has a cumulative and lasting effect on milk yield and lactose content in dairy cows. J Dairy Sci. (2025) 108:635–50. doi: 10.3168/jds.2024-25467
3. Gonçalves, J, Freu, G, Garcia, B, Barcelos, M, Alves, B, Leite, R, et al. Effect of bovine subclinical mastitis on milk production and economic performance of Brazilian dairy farms. Braz J Vet Res Anim Sci. (2023) 60:e208514. doi: 10.11606/issn.1678-4456.bjvras.2023.208514
4. Pascu, C, Herman, V, Iancu, I, and Costinar, L. Etiology of mastitis and antimicrobial resistance in dairy cattle farms in the western part of Romania. Antibiotics (Basel). (2022) 11:11. doi: 10.3390/antibiotics11010057
5. Iancu, I, Igna, V, Popa, SA, Imre, K, Pascu, C, Costinar, L, et al. Etiology and antimicrobial resistance of subclinical mastitis pathogens Staphylococcus aureus, Streptococcus spp. and Enterococcus spp. in sheep milk. Vet Res Commun. (2024) 49:30. doi: 10.1007/s11259-024-10579-7
6. Günther, J, Petzl, W, Bauer, I, Ponsuksili, S, Zerbe, H, Schuberth, H-J, et al. Differentiating Staphylococcus aureus from Escherichia coli mastitis: S. aureus triggers unbalanced immune-dampening and host cell invasion immediately after udder infection. Sci Rep. (2017) 7:4811. doi: 10.1038/s41598-017-05107-4
7. Ying, Y-T, Yang, J, Tan, X, Liu, R, Zhuang, Y, Xu, J-X, et al. Escherichia coli and Staphylococcus aureus differentially regulate Nrf2 pathway in bovine mammary epithelial cells: relation to distinct innate immune response. Cells. (2021) 10:3426. doi: 10.3390/cells10123426
8. Islam, MA, Takagi, M, Fukuyama, K, Komatsu, R, Albarracin, L, Nochi, T, et al. Transcriptome analysis of the inflammatory responses of bovine mammary epithelial cells: exploring immunomodulatory target genes for bovine mastitis. Pathogens. (2020) 9:9. doi: 10.3390/pathogens9030200
9. Gilbert, FB, Cunha, P, Jensen, K, Glass, EJ, Foucras, G, Robert-Granié, C, et al. Differential response of bovine mammary epithelial cells to Staphylococcus aureus or Escherichia coli agonists of the innate immune system. Vet Res. (2013) 44:40. doi: 10.1186/1297-9716-44-40
10. Zhuang, C, Gao, J, Liu, G, Zhou, M, Yang, J, Wang, D, et al. Selenomethionine activates selenoprotein S, suppresses Fas/FasL and the mitochondrial pathway, and reduces Escherichia coli-induced apoptosis of bovine mammary epithelial cells. J Dairy Sci. (2021) 104:10171–82. doi: 10.3168/jds.2020-20034
11. Zhuang, C, Liu, G, Barkema, HW, Zhou, M, Xu, S, Ur Rahman, S, et al. Selenomethionine suppressed TLR4/ NF-κB pathway by activating selenoprotein S to alleviate ESBL Escherichia coli-induced inflammation in bovine mammary epithelial cells and macrophages. Front Microbiol. (2020) 11:1461. doi: 10.3389/fmicb.2020.01461
12. Tao, L, Liu, K, Li, J, Zhang, Y, Cui, L, Dong, J, et al. Selenomethionine alleviates NF-κB -mediated inflammation in bovine mammary epithelial cells induced by Escherichia coli by enhancing autophagy. Int Immunopharmacol. (2022) 110:108989. doi: 10.1016/j.intimp.2022.108989
13. Ma, N, Chang, G, Huang, J, Wang, Y, Gao, Q, Cheng, X, et al. Cis-9, trans-11-conjugated linoleic acid exerts an anti-inflammatory effect in bovine mammary epithelial cells after Escherichia coli stimulation through NF-κB signaling pathway. J Agric Food Chem. (2019) 67:193–200. doi: 10.1021/acs.jafc.8b05500
14. Liu, K, Zhou, X, Fang, L, Dong, J, Cui, L, Li, J, et al. PINK1/parkin-mediated mitophagy alleviates Staphylococcus aureus-induced NLRP3 inflammasome and NF-κB pathway activation in bovine mammary epithelial cells. Int Immunopharmacol. (2022) 112:109200. doi: 10.1016/j.intimp.2022.109200
15. Yang, Y, Lv, S, Wang, Z, and Liu, J. Selenium ameliorates S. aureus-induced inflammation in bovine mammary epithelial cells by regulating ROS-induced NLRP3 inflammasome. Biol Trace Elem Res. (2022) 200:3171–5. doi: 10.1007/s12011-021-02924-7
16. Wang, X, Liu, M, Geng, N, Du, Y, Li, Z, Gao, X, et al. Staphylococcus aureus mediates pyroptosis in bovine mammary epithelial cell via activation of NLRP3 inflammasome. Vet Res. (2022) 53:10. doi: 10.1186/s13567-022-01027-y
17. Bolger, AM, Lohse, M, and Usadel, B. Trimmomatic: a flexible trimmer for Illumina sequence data. Bioinformatics. (2014) 30:2114–20. doi: 10.1093/bioinformatics/btu170
18. Kim, D, Paggi, JM, Park, C, Bennett, C, and Salzberg, SL. Graph-based genome alignment and genotyping with HISAT2 and HISAT-genotype. Nat Biotechnol. (2019) 37:907–15. doi: 10.1038/s41587-019-0201-4
19. Li, H, Handsaker, B, Wysoker, A, Fennell, T, Ruan, J, Homer, N, et al. The sequence alignment/map format and Samtools. Bioinformatics. (2009) 25:2078–9. doi: 10.1093/bioinformatics/btp352
20. Pertea, M, Pertea, GM, Antonescu, CM, Chang, TC, Mendell, JT, and Salzberg, SL. StringTie enables improved reconstruction of a transcriptome from RNA-seq reads. Nat Biotechnol. (2015) 33:290–5. doi: 10.1038/nbt.3122
21. Chen, T, Liu, Y-X, Chen, T, Yang, M, Fan, S, Shi, M, et al. Imagegp 2 for enhanced data visualization and reproducible analysis in biomedical research. iMeta. (2024) 3:e239. doi: 10.1002/imt2.239
22. Harrison, PW, Amode, MR, Austine-Orimoloye, O, Azov, AG, Barba, M, Barnes, I, et al. Ensembl 2024. Nucleic Acids Res. (2024) 52:D891–9. doi: 10.1093/nar/gkad1049
23. Love, MI, Huber, W, and Anders, S. Moderated estimation of fold change and dispersion for RNA-seq data with DESeq2. Genome Biol. (2014) 15:550. doi: 10.1186/s13059-014-0550-8
24. Szklarczyk, D, Nastou, K, Koutrouli, M, Kirsch, R, Mehryary, F, Hachilif, R, et al. The STRING database in 2025: protein networks with directionality of regulation. Nucleic Acids Res. (2025) 53:D730–7. doi: 10.1093/nar/gkae1113
25. Shannon, P, Markiel, A, Ozier, O, Baliga, NS, Wang, JT, Ramage, D, et al. Cytoscape: a software environment for integrated models of biomolecular interaction networks. Genome Res. (2003) 13:2498–504. doi: 10.1101/gr.1239303
26. Li, C, Yin, L, He, X, Jin, Y, Zhu, X, and Wu, R. Competition-cooperation mechanism between Escherichia coli and Staphylococcus aureus based on systems mapping. Front Microbiol. (2023) 14:1192574. doi: 10.3389/fmicb.2023.1192574
27. Di Marco, F, Nicola, F, Giannese, F, Saliu, F, Tonon, G, de Pretis, S, et al. Dual spatial host-bacterial gene expression in Mycobacterium abscessus respiratory infections. Commun Biol. (2024) 7:1287. doi: 10.1038/s42003-024-06929-5
28. Doxey, AC, Abu Mazen, N, Homm, M, Chu, V, Hunjan, M, Lobb, B, et al. Metatranscriptomic profiling reveals pathogen and host response signatures of pediatric acute sinusitis and upper respiratory infection. Genome Med. (2025) 17:22. doi: 10.1186/s13073-025-01447-3
29. Yang, Q, Guo, H, Li, H, Li, Z, Ni, F, Wen, Z, et al. The CXCL8/MAPK/hnRNP-K axis enables susceptibility to infection by EV-D68, rhinovirus, and influenza virus in vitro. Nat Commun. (2025) 16:1715. doi: 10.1038/s41467-025-57094-0
30. Sharifi, S, Pakdel, A, Ebrahimi, M, Reecy, JM, Fazeli Farsani, S, and Ebrahimie, E. Integration of machine learning and meta-analysis identifies the transcriptomic bio-signature of mastitis disease in cattle. PLoS One. (2018) 13:e0191227. doi: 10.1371/journal.pone.0191227
31. Han, H. Identification of several key genes by microarray data analysis of bovine mammary gland epithelial cells challenged with Escherichia coli and Staphylococcus aureus. Gene. (2019) 683:123–32. doi: 10.1016/j.gene.2018.10.004
32. Guo, Q, Jin, Y, Chen, X, Ye, X, Shen, X, Lin, M, et al. NF-κB in biology and targeted therapy: new insights and translational implications. Signal Transduct Target Ther. (2024) 9:53. doi: 10.1038/s41392-024-01757-9
33. Li, Q, Laumonnier, Y, Syrovets, T, and Simmet, T. Recruitment of CCR6-expressing Th17 cells by CCL20 secreted from plasmin-stimulated macrophages. Acta Biochim Biophys Sin Shanghai. (2013) 45:593–600. doi: 10.1093/abbs/gmt049
34. Wang, J, Yang, J, Xia, W, Zhang, M, Tang, H, Wang, K, et al. Escherichia coli enhances Th17/Treg imbalance via TLR4/NF-κB signaling pathway in oral lichen planus. Int Immunopharmacol. (2023) 119:110175. doi: 10.1016/j.intimp.2023.110175
35. Luo, R, Yao, Y, Chen, Z, and Sun, X. An examination of the LPS-TLR4 immune response through the analysis of molecular structures and protein-protein interactions. Cell Commun Signal. (2025) 23:142. doi: 10.1186/s12964-025-02149-4
36. Rocha, SF, Schiller, M, Jing, D, Li, H, Butz, S, Vestweber, D, et al. Esm1 modulates endothelial tip cell behavior and vascular permeability by enhancing VEGF bioavailability. Circ Res. (2014) 115:581–90. doi: 10.1161/circresaha.115.304718
37. Kelley, N, Jeltema, D, Duan, Y, and He, Y. The NLRP3 inflammasome: an overview of mechanisms of activation and regulation. Int J Mol Sci. (2019) 20:20. doi: 10.3390/ijms20133328
38. Schmidt, RL, and Lenz, LL. Distinct licensing of IL-18 and IL-1β secretion in response to NLRP3 inflammasome activation. PLoS One. (2012) 7:e45186. doi: 10.1371/journal.pone.0045186
39. Kowalski, A, and Pałyga, J. Modulation of chromatin function through linker histone H1 variants. Biol Cell. (2016) 108:339–56. doi: 10.1111/boc.201600007
40. Schultheiß, C, Willscher, E, Paschold, L, Gottschick, C, Klee, B, Henkes, SS, et al. The IL-1β, IL-6, and TNF cytokine triad is associated with post-acute sequelae of COVID-19. Cell Rep Med. (2022) 3:100663. doi: 10.1016/j.xcrm.2022.100663
41. Ranasinghe, R, and Eri, R. Modulation of the CCR6-CCL20 axis: a potential therapeutic target in inflammation and cancer. Medicina (Kaunas). (2018) 54:88. doi: 10.3390/medicina54050088
42. Lee, AY, Eri, R, Lyons, AB, Grimm, MC, and Korner, H. CC chemokine ligand 20 and its cognate receptor CCR6 in mucosal T cell immunology and inflammatory bowel disease: odd couple or axis of evil? Front Immunol. (2013) 4:194. doi: 10.3389/fimmu.2013.00194
43. Zonis, S, Breunig, JJ, Mamelak, A, Wawrowsky, K, Bresee, C, Ginzburg, N, et al. Inflammation-induced Gro1 triggers senescence in neuronal progenitors: effects of estradiol. J Neuroinflammation. (2018) 15:260. doi: 10.1186/s12974-018-1298-y
44. Michalski, C, Cheung, C, Oh, JH, Ackermann, E, Popescu, CR, Archambault, AS, et al. DDIT4L regulates mitochondrial and innate immune activities in early life. JCI Insight. (2024) 9:e172312. doi: 10.1172/jci.insight.172312
45. Chen, CA, Strouz, K, Huang, KL, and Shyu, AB. Tob2 phosphorylation regulates global mRNA turnover to reshape transcriptome and impact cell proliferation. RNA. (2020) 26:1143–59. doi: 10.1261/rna.073528.119
46. Jozefczuk, S, Klie, S, Catchpole, G, Szymanski, J, Cuadros-Inostroza, A, Steinhauser, D, et al. Metabolomic and transcriptomic stress response of Escherichia coli. Mol Syst Biol. (2010) 6:364. doi: 10.1038/msb.2010.18
47. Leto, TL, Morand, S, Hurt, D, and Ueyama, T. Targeting and regulation of reactive oxygen species generation by Nox family NADPH oxidases. Antioxid Redox Signal. (2009) 11:2607–19. doi: 10.1089/ars.2009.2637
48. Latini, FR, Hemerly, JP, Oler, G, Riggins, GJ, and Cerutti, JM. Re-expression of ABI3-binding protein suppresses thyroid tumor growth by promoting senescence and inhibiting invasion. Endocr Relat Cancer. (2008) 15:787–99. doi: 10.1677/erc-08-0079
49. Feng, Y, Tao, F, Qiao, H, and Tang, H. A pan-cancer analysis of ABI3BP: a potential biomarker for prognosis and immunoinfiltration. Front Oncol. (2023) 13:1159725. doi: 10.3389/fonc.2023.1159725
50. Feng, Y, Han, X, Zhang, Z, Qiao, H, and Tang, H. ABI3BP is a prognosis biomarker related with clinicopathological features and immunity infiltration of lung tumor. Front Genet. (2022) 13:1085785. doi: 10.3389/fgene.2022.1085785
51. E, HS, Bradshaw, AD, and Brekken, R. SPARC, a matricellular protein that regulates cell-matrix interaction: implications for vascular and connective tissue biology In: I Oakazaki, Y Ninomiya, SL Friedman, and K Tanikawa, editors. Extracellular matrix and the liver. San Diego: Academic Press (2003). 75–85.
52. Brzozowski, JS, and Skelding, KA. The multi-functional calcium/calmodulin stimulated protein kinase (CaMk) family: emerging targets fo anti-cancer therapeutic intervention. Pharmaceuticals (Basel). (2019) 12:8. doi: 10.3390/ph12010008
53. Kondo, Y, Ledderose, C, Slubowski, CJ, Fakhari, M, Sumi, Y, Sueyoshi, K, et al. Frontline science: Escherichia coli use LPS as decoy to impair neutrophil chemotaxis and defeat antimicrobial host defense. J Leukoc Biol. (2019) 106:1211–9. doi: 10.1002/jlb.4hi0319-109r
54. Long, N, Deng, J, Qiu, M, Zhang, Y, Wang, Y, Guo, W, et al. Inflammatory and pathological changes in Escherichia coli infected mice. Heliyon. (2022) 8:e12533. doi: 10.1016/j.heliyon.2022.e12533
55. Pakbin, B, Brück, WM, and Rossen, JWA. Virulence factors of enteric pathogenic Escherichia coli: a review. Int J Mol Sci. (2021) 22:22. doi: 10.3390/ijms22189922
56. Zhao, J, Yang, W, Gao, B, Wang, H, Chen, L, Shan, C, et al. Escherichia coli HPI-induced duodenitis through ubiquitin regulation of the TLR4/NF-κB pathway. BMC Vet Res. (2025) 21:66. doi: 10.1186/s12917-025-04515-3
57. Thakore, PI, Schnell, A, Huang, L, Zhao, M, Hou, Y, Christian, E, et al. BACH2 regulates diversification of regulatory and proinflammatory chromatin states in TH17 cells. Nat Immunol. (2024) 25:1395–410. doi: 10.1038/s41590-024-01901-1
58. Ha, KP, and Edwards, AM. DNA repair in Staphylococcus aureus. Microbiol Mol Biol Rev. (2021) 85:e0009121. doi: 10.1128/mmbr.00091-21
Keywords: RNA-seq, bovine, Mac-T cells, Escherichia coli , Staphylococcus aureus , transcriptomics, PPI, mammary epithelial cells
Citation: Zhao Z, Hou Z, Chai J, Li C, Liu T, Li J, Zhang S, Zhang L and Ma Y (2025) Mechanisms of host-bacterial interactions during Escherichia coli or Staphylococcus aureus infection of mammary epithelial cells. Front. Vet. Sci. 12:1644768. doi: 10.3389/fvets.2025.1644768
Edited by:
He Zhang, Chinese Academy of Agricultural Sciences, ChinaReviewed by:
Ravikanthreddy Poonooru, University of Missouri, United StatesHao Lizhuang, Qinghai University, China
Copyright © 2025 Zhao, Hou, Chai, Li, Liu, Li, Zhang, Zhang and Ma. This is an open-access article distributed under the terms of the Creative Commons Attribution License (CC BY). The use, distribution or reproduction in other forums is permitted, provided the original author(s) and the copyright owner(s) are credited and that the original publication in this journal is cited, in accordance with accepted academic practice. No use, distribution or reproduction is permitted which does not comply with these terms.
*Correspondence: Lei Zhang, emhhbmdsZWlAc3lhdS5lZHUuY24=; Yabin Ma ZGhpbXliQDE2My5jb20=
†These authors have contributed equally to this work