 Jiaxin Cheng1
 Ying Gao1Hongming Lv1Jing Li2Tianhui An1Honglin Liu1Junqi Wang1Haifeng Zhang1Haiyan Wang1Siqi Zou1Zhao Fan1*Yuanyuan Chen1*
- 1College of Animal Science and Veterinary Medicine, Heilongjiang Bayi Agricultural University, Daqing High-Tech Industrial Development Zone, Daqing, China
- 2College of Animal Science and Technology, Jilin Agricultural Science and Technology College, Jilin City, Jilin Province, China
AFB1 induces hepatotoxicity and enterotoxicity. Lactobacillus acidophilus (LAC) and Lactobacillus rhamnosus (LGG), both belonging to LAB, have strong binding affinity for AFB1. Montmorillonite (MMT) not only adsorbs AFB1 but also serves as a carrier for LAB, thereby enhancing their colonization ability and prolonging their survival. Despite the unclear effects of LGG/LAC-MMT combination on AFB1-induced tissue injury and intestinal microbiota disruption, this study aimed to determine whether it could effectively alleviate tissue damage from AFB1 exposure and enhance LAB colonization capacity in mouse intestines. Separately, LGG (2 × 10⁹ cfu/mL) and LAC (2 × 10⁹ cfu/mL) were combined with MMT (0.5 mg/kg), and the AFB1-intoxicated mice were gavaged with the mixtures for 4 weeks. Findings suggested that LGG, LAC, and MMT supplementation restored oxidative stress and inflammatory caused by AFB1 to some degree. Furthermore, they altered the intestinal microbiota structure, enhancing the colonization ability of LABs, thereby alleviating liver and intestinal injury. The combination of LGG/LAC-MMT was more effective, especially LAC-MMT. Overall, LGG/LAC-MMT exhibits a synergistic effect and can effectively ameliorate AFB1-induced tissue injury and intestinal microbiota disorder.
1 Introduction
As a well-recognized Class I carcinogen, aflatoxin B1 (AFB1) represents the most prevalent and toxic aflatoxin subtype (1, 2). Both ruminants and monogastric animals are vulnerable to AFB1-induced damage, which can lead to severe health issues and even lethal outcomes (3–5). Animals consuming AFB1 may exhibit diverse toxicities leading to organ and tissue injury, including but not limited to hepatotoxicity, enterotoxicity, nephrotoxicity, splenotoxicity, pulmonary toxicity, and neurotoxicity (6–9). Consequently, it is imperative to conduct extensive studies on mitigating AFB1 toxicity.
Hepatotoxicity and enterotoxicity frequently occur upon AFB1 exposure. AFB1 affects the liver as its primary target organ (10). Upon animal ingestion, AFB1-contaminated feed is absorbed through the gastric and intestinal mucosa, ultimately leading to liver injury (11). Studies have shown that oral administration of AFB1 to rats for just 2 consecutive weeks can cause significant damage to liver tissue (6, 12). The potential mechanisms by which AFB1 induces hepatotoxicity lie in oxidative stress and inflammatory responses (13). In rodent studies of AFB1 exposure, AFB1 was shown to induce a hepatic oxidative stress-inflammatory cascade, resulting in elevated oxidative stress biomarkers and pro-inflammatory mediators, while depleting enzymatic antioxidant reserves (14–16). This cascade ultimately results in liver injury, leading to diminished liver function indicators (15). Intestinal injury is also accompanied by oxidative stress and inflammatory responses (2), with concomitant effects on the intestinal microbiota. Research evidence suggests that AFB1 compromises intestinal barrier integrity, resulting in a decline of commensal microbiota and proliferation of pathogenic bacteria (17, 18). A dysregulated intestinal microbiome can impair host health and provide a foundation for disease development.
In recent years, investigations into the detoxifying efficacy of biocontrol agents against AFB1 have proliferated. Lactic acid bacteria (LAB), such as Lactobacillus acidophilus (LAC) and Lactobacillus rhamnosus GG (LGG), have an in vitro binding ability to AFB1 ranging from 64.56% to 96.58% (19). Moreover, LAC and LGG have been shown to mitigate AFB1-induced hepatic and intestinal damage across multiple animal models (such as fish, rats and chicken), while also reversing AFB1-mediated growth suppression (20–22). However, environmental factors significantly influence the AFB1 detoxifying capacity of LAB. The principal influencing factor is that the adhesion capacity of LAB to the intestine and their binding ability for AFB1 are surface-associated, resulting in a diminished colonization capability of LAB (23). Additionally, research has validated that intestinal mucus influences the adsorption of AFB1 by LAB in vivo (24). Furthermore, the gastrointestinal environment is relatively harsh, and the introduction of exogenous LAB in vivo may reduce their survival rates, thereby impacting the detoxifying efficacy of LAB against AFB1 (25). Consequently, using a carrier to deliver LAB in vivo has been proposed to address this issue. Montmorillonite (MMT) is a commonly employed silicate that can serve as a carrier for LAB. Studies have demonstrated that the LAB-MMT combination can effectively maintain LAB viability within the intestinal tract of mice (26). Simultaneously, MMT, either in its native form or modified, can serve as an effective adsorbent for AFB1 both in vivo and in vitro, and inhibit intestinal pathogenic bacteria (27–30). Therefore, the in vivo combination of LAB-MMT has significant potential for minimizing AFB1 toxicity in animals. However, research on the LAB-MMT combination remains limited.
In summary, this study will administer LAC/LGG-MMT to AFB1-exposed mice. It will in vivo investigate the detoxification effects of different LAB-MMT combinations in AFB1-exposed mice in vivo.
2 Materials and methods
This study gained ethical approval from Heilongjiang Bayi Agricultural University's Science and Technology Ethics Committee (Approval number: DWKJXY2024034).
2.1 Preparation of AFB1 and strains culture
AFB1 was purchased from FERMENTEK Ltd. (Qingdao, China). An AFB1 stock solution (1 mg/mL) was prepared using 10% dimethyl sulfoxide (DMSO, Fisher) as the solvent. It was diluted with sterile water before gavage and administered orally at a dose of 400 μg/kg based on mouse body weight. The LAC and LGG strains were purchased from BeNa Culture Collection Biotechnology Co., Ltd. (Hebei, China). The strains were activated according to the instructions, subsequently streaked three times onto MRS agar plates, and incubated at 37 °C for 16 h. Purified LAC and LGG bacterial fluids were centrifuged in a high-speed cryo-centrifuge (4 °C, 2,000 rpm, 10 min). The bacteria were washed twice with PBS (pH = 7.4) and resuspended in the same buffer. A UV spectrophotometer was employed to adjust the bacterial suspension to the target concentration. The final viable bacteria concentration was adjusted to 2 × 10⁹ cfu/mL. MMT is supplied by American Anmuran International Co., Ltd (Shenzhen, China). Its main components are 70% calcium-based MMT (calcium content of 0.5% to 1.5%), 15% amorphous hydrated silica, and 15% other minerals. An MMT solution was prepared by dissolving 0.5 mg/kg MMT in 1 mL of sterile distilled water. Additionally, the LAC/LGG-MMT complex was prepared by mixing 0.5 mg/mL MMT directly with 2 × 10⁹ cfu/mL LGG and LAC suspensions.
2.2 Animals, experimental design and sample acquisition
Four-week-old male Balb/c mice [18–22 g; Harbin Medical University Laboratory Animal Division, SCXK (BK) 2024-002] were maintained under standardized conditions: 20 ± 2 °C, 50% ± 5% relative humidity, 16 h light/dark cycle, with unrestricted access to food and water.
After a one-week adaptation period, 80 mice (n = 80) were randomly divided into eight groups with 10 mice per group: Group C received 400 μL sterile distilled water; Group D received 400 μL DMSO; Group A were orally administered 400 μg/kg AFB1; Group A+M received 400 μL AFB1 and 0.5 mg/kg MMT solution; Group A+L1 received 400 μg/kg AFB1 and 2 × 10⁹ cfu/mL LGG; Group A+L2 received 400 μg/kg AFB1 and 2 × 10⁹ cfu/mL LAC; Group A+M+L1 received 400 μg/kg AFB1, 0.5 mg/kg MMT solution, and 2 × 10⁹ cfu/mL LGG; Group A+M+L2 received 400 μg/kg AFB1, 0.5 mg/kg MMT solution, and 2 × 10⁹ cfu/mL LAC. After the four-week experimental period, mice were sacrificed by eyeball blood sampling and neck removal, and then liver, colon, and cecal contents were collected.
2.3 Histopathological observation
Tissues of the liver and jejunum of mice were fixed in 4% paraformaldehyde for 24 h, processed into paraffin-embedded blocks, cut into 5-μm sections, stained with H&E, and examined under a light microscope to capture and store histopathological images for analysis.
2.4 Measurement of serum inflammatory factors and blood biochemical indices
Serum was separated to measure inflammatory cytokines (IL-1β, TNF-α, IL-6, IFN-γ, IL-2, and IL-8) using ELISA kit (Nanjing Jiancheng Biotechnology Co., Ltd., Nanjing, China) according to established protocols, with liver function indices including alanine aminotransferase (ALT), aspartate aminotransferase (AST), alkaline phosphatase (ALP), total protein (TP) and albumin (ALB) assayed via a fully automated biochemical analyzer (Shenzhen Rayto Life and Analytical Sciences Co., Ltd., Shenzhen, China).
2.5 Determination of antioxidant enzyme content in liver and intestine
Liver and intestinal tissues were minced and loaded into centrifuge tubes. Pre-cooled PBS was added to tubes, samples were homogenized and centrifuged at 4 °C (1,700 rpm, 10 min), supernatant was discarded, malondialdehyde (MDA) content was assayed using Shanghai Langton Bioscience ELISA kit per protocol, and remaining supernatant was diluted with PBS to measure total protein via the company's BCA kit. The levels of superoxide dismutase (SOD), catalase (CAT), glutathione (GSH), and glutathione reductase (GR) were assayed using ELISA kits from Shanghai Langton Bioscience Co., Ltd. (Shanghai, China) as per the provided protocols.
2.6 Real-time RT-PCR analysis for mRNA levels of liver inflammatory factors
Using TRIzol reagent (Invitrogen Corporation, CA, USA), total RNA was extracted from murine liver tissues as per the manufacturer's standard procedure. Then, the high-speed centrifuge was then pre-cooled to 4 °C for centrifugation (12,000 rpm, 10 min). Sample RNA concentrations and OD260/280 values were determined using a UV spectrophotometer. Following cDNA synthesis, single-stranded products were subjected to qRT-PCR for quantification of target gene mRNA levels. Table 1 provides the detailed primer sequences. By applying the 2−ΔΔCt method, relative target gene expression was calculated and normalized to β-actin (housekeeping gene).
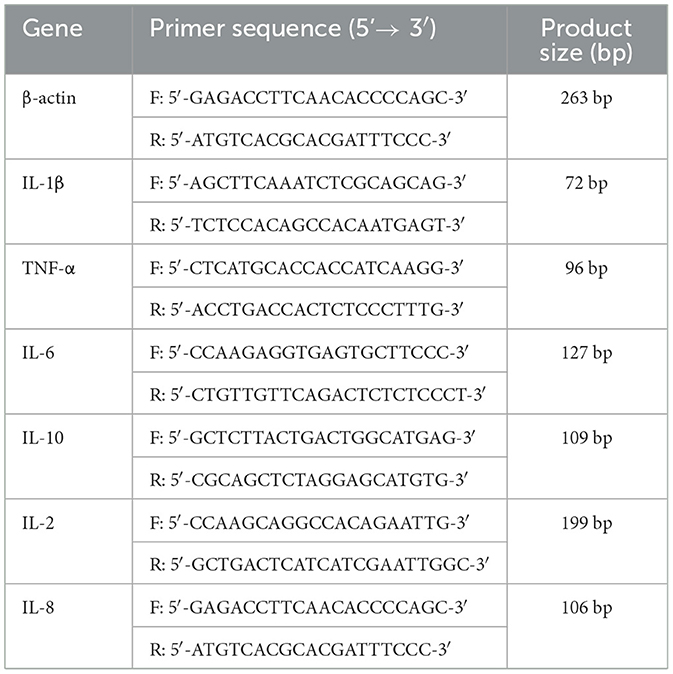
Table 1. Primer sequences used in this study.
2.7 16S rRNA sequencing
The TIANGEN Fecal Genomic DNA Extraction Kit (TIANGEN Biochemical Technology Co., Ltd., Beijing, China) was used to isolate fecal microbial DNA following the 16S rRNA-specific protocol. The integrity was verified by agarose gel electrophoresis, while the quality was determined by NanoDrop 2000. Using bacterial primers 338F 5′-ACTCCTACGGGAGGCAGCAG3′) and 806R 5′-GGACTACHVGGGTWTCTAAT3′), we amplified the 16S rRNA V3-V4 region via PCR. After visualization of the amplification products by 2% agarose gel electrophoresis, the products were extracted using a DNA gel recovery kit (Shanghai Bioengineering Co., Ltd., Shanghai, China). Beijing Nuohe Co., Ltd. was entrusted with the sequencing of the PCR products.
2.8 High performance liquid chromatography (HPLC) for AFB1 in the feces
Feces were collected aseptically from the colon and cecum of each group of mice. The feces from 10 mice of the same group were mixed, so that the total wet weight of feces in each group amounted to 4-5 g to form a pooled material (31), which can reduce individual differences and to meet the DNA extraction requirements. Then the pooled material of feces was mixed with 10 mL 0.1% acidified acetonitrile, vortexed and sonicated (10 min each, 4 °C), then centrifuged at 13,000 rpm for 10 min at 4 °C. Supernatant (2 mL) was loaded onto a PRiMEHLB column, eluted with acetonitrile (2 mL), dried under nitrogen, reconstituted in acetonitrile (1 mL), filtered (0.22 μm), and analyzed by UPLC-MS/MS on a TSK GEL-ODS100V column (150 × 2.1 mm, 5 μm).Gradient elution: 0.3 mL/min flow rate, 40 °C column temperature, mobile phases A (0.1% formic acid in water) and B (acetonitrile), 10-μL injection. LOD (S/N ≥3) and LOQ (S/N ≥10) were set as per standard protocols.
2.9 Statistical analysis
Microsoft Excel was used for preliminary statistical analysis of the experimental data, and SPSS 17.0 software was used for data processing and One-way ANOVA was used to analyze the significance of each group, and the post-event comparison method is the Duncan. P < 0.05 was considered statistically significant. The results were expressed as mean ± SD. GraphPad Prism 7.0 software and OriginPro 2024b were used to draw line, bar charts and box plots. The ACE, shannon, simpson, chao1 and coverage indices were calculated using QIIME2 software. Cumulative species curve, Ternary phase diagram and dilution curves were plotted using R package.
3 Results
3.1 Growth performance
Weekly fluctuations in body weight among mice were analyzed (Figure 1). Groups showed no significant differences in initial body weights. Body weights of Group C and Group D were similar over 4 weeks. Conversely, Group A exhibited persistent progressive body weight reduction, significantly lower at weeks 3 (P < 0.05) and 4 (P < 0.01) relative to Group C. Groups A+L1, A+L2, and A+M showed progressive decreases, with P < 0.05 at week 3 and P < 0.01 at week 4 vs. Group C. After combining LGG or LAC with MMT, respectively, body weights in Groups A+M+L1 (P < 0.05) and A+M+L2 (P < 0.01) were significantly increased, exhibiting substantial growth in the third and fourth weeks compared with Group A. Throughout the study, Group A+M+L2 demonstrated a steady increase in body weight, which trended toward the values of Group C.
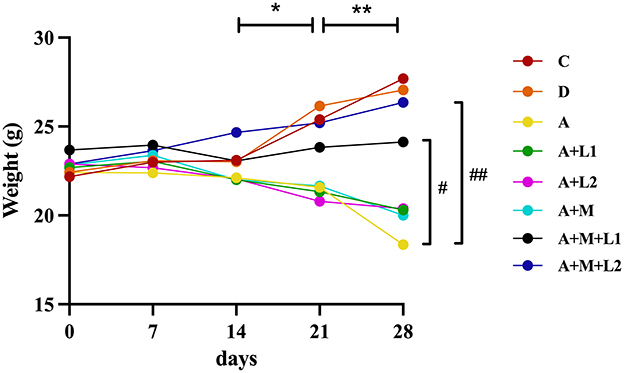
Figure 1. Weekly mice body weight measurements. *P < 0.05, **P < 0.01: AFB1/monotherapy vs. control group. #P < 0.05, ##P < 0.01: AFB1+LGG-MMT vs. AFB1 group.
3.2 Liver histopathological observations
Liver histopathology was assessed to determine AFB1-induced damage in murine hepatic tissue and the therapeutic efficacy of LGG/LAC-MMT (Figure 2). The liver histological structure of the mice in Groups C and D was predominantly normal, with intact hepatocyte architecture and clearly discernible hepatic sinusoidal macrophages (Figures 2A, B). Conversely, AFB1 exposure resulted in significant hepatic damage, characterized by disrupted hepatocyte architecture, pronounced inflammatory cell infiltration, extensive edema, vacuolar degeneration of hepatocytes, and nuclear condensation and lysis (Figure 2C). Unlike Group A, Groups A+L1, A+L2, and A+M failed to significantly reduce AFB1-induced liver lesions (Figures 2D–F). In contrast, Groups A+M+L2 and A+M+L1 partially mitigated hepatic damage, such as edema and necrosis, while preserving hepatocyte architecture and showing no inflammatory cell infiltration (Figures 2G, H).
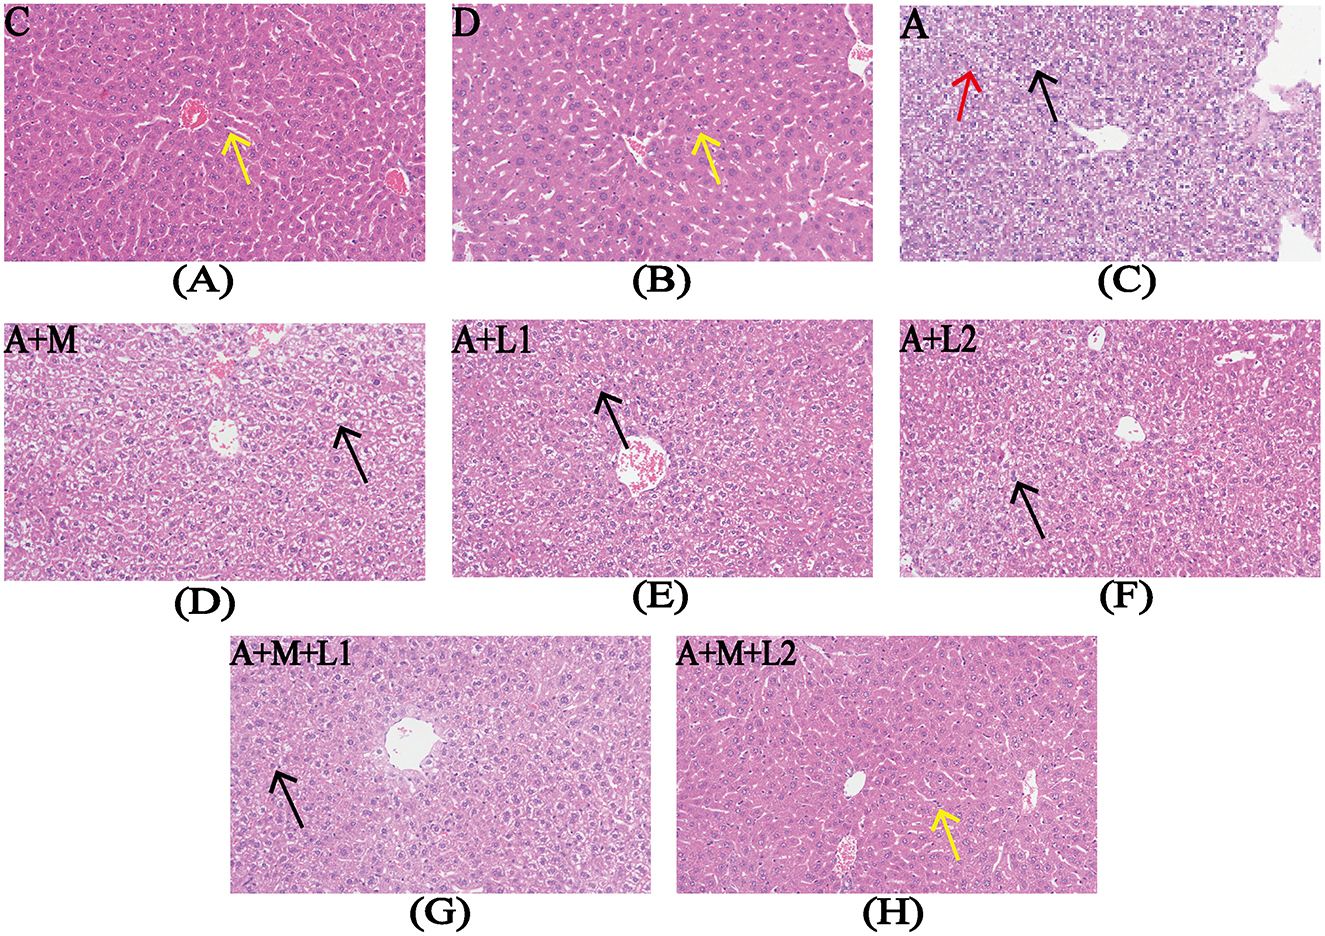
Figure 2. Liver histopathology after treatments. Representative images from each group (200×magnification). Yellow arrows: hepatic sinusoidal macrophages; red arrows: nuclear condensation/lysis; black arrows: hepatocyte vacuolar degeneration. Figure legend descriptions: (A) Group C, (B) Group D, (C) Group A, (D) Group A+M, (E) Group A+L1, (F) Group A+M, (G) Group A+M+L1, (H) Group A+M+L2.
3.3 Intestinal tract histopathological observations
Figure 3 illustrates the alterations in the jejunal tissue of mice subjected to various combinations of AFB1, MMT, LGG, and LAC. In Groups C and D, intestinal villi had regular histological structures, with no loose or edematous, necrotic epithelial cell degeneration and no inflammatory cell infiltration (Figures 3A, B). The intestinal barrier of mice in group A was impaired, as exhibited by shortened intestinal villi, mucosal epithelial cell detachment, submucosal edema, and minimal inflammatory cell infiltration (Figure 3C). Compared with Group A, Groups A+L1 and A+L2 showed no significant improvement (Figures 3D, E). In contrast, the impairment of intestinal barrier function was ameliorated in the Groups A+M, A+M+L1, and A+M+L2. The intestinal tissue structure normalized, exhibiting regularly distributed villi and an absence of pathological alterations (Figures 3F–H).
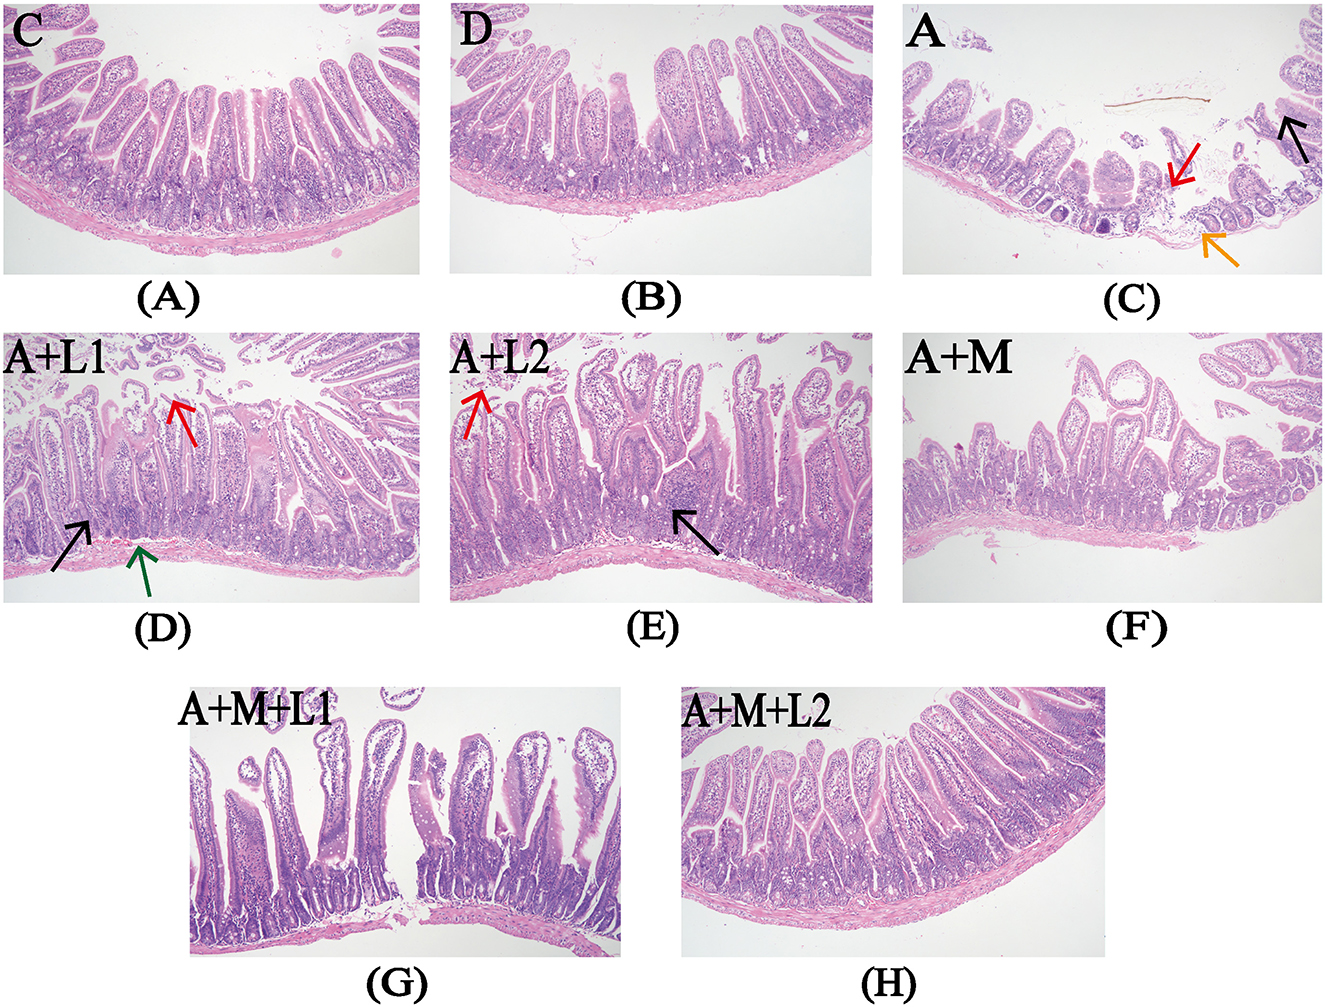
Figure 3. Intestinal histopathology after treatments. Representative images from each group (200×). Red arrows: exfoliated intestinal epithelial cells; orange arrows: submucosal edema; black arrows: inflammatory cell infiltration; green arrows: submucosal bleeding. Figure legend descriptions: (A) Group C, (B) Group D, (C) Group A, (D) Group A+M, (E) Group A+L1, (F) Group A+M, (G) Group A+M+L1, (H) Group A+M+L2.
3.4 Serum liver function indicators detection
Table 2 illustrates the liver function indicators in the serum of each group. AFB1 induced significant elevation of ALT and AST levels and significant reduction of TP and ALB levels (P < 0.001). The levels of liver function indicators in Groups A+M, A+L1, A+L2 and A+M+L1 were improved to different degrees. Group A+M+L2 had the best effect, where the levels of AST, ALP, TP and ALB did not differ from Group C (P < 0.001).
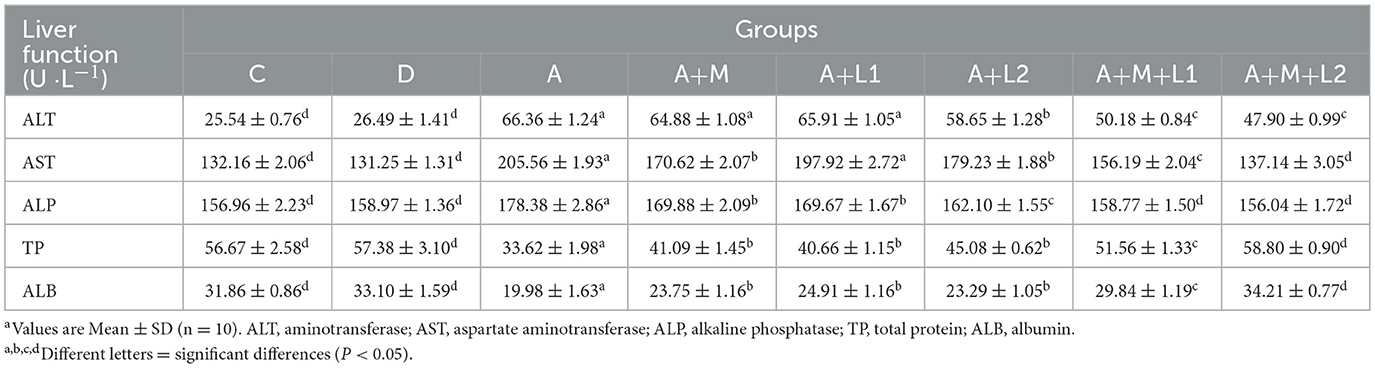
Table 2. Effect of AFB1 on serum liver function indices and LAB-MMT-mediated improvement.
3.5 Serum inflammatory factor detection
Figure 4 shows serum inflammatory factor profiles. Compared with Group C, IL-1β, TNF-α, IL-6 and IL-10 were significantly upregulated in Groups A, A+M, A+L1, and A+L2 (P < 0.001, Figures 4A–D). Group A+M+L1 had lower IL-1β (P < 0.05) and TNF-α (P < 0.01) than Group A (Figures 4A, B). Group A+M+L2 demonstrated significant reductions in IL-1β (P < 0.01), TNF-α, IL-6, and IL-10 (P < 0.001, Figures 4A–D). IL-2 and IL-8 levels were not significantly different across groups.
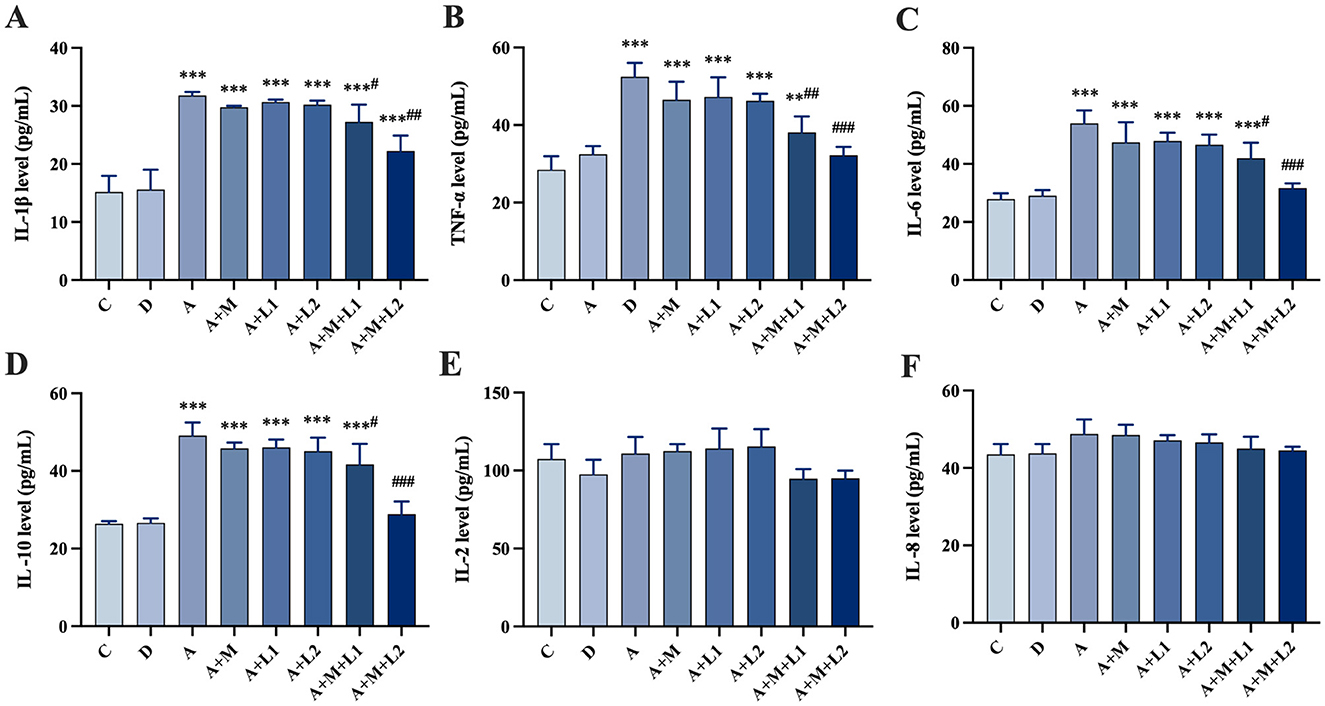
Figure 4. Mice serum cytokines: (A) IL-1β, (B) TNF-α, (C) IL-6, (D) IL-10, (E) IL-2, (F) IL-8. Values are mean ± SD. *, **, ***P < 0.05, 0.01, 0.001 vs. control group. #, ##, ###P < 0.05, 0.01, 0.001 vs. AFB1 group.
3.6 Liver antioxidant enzyme detection
Figure 5 shows the changes in antioxidant enzyme levels within liver tissues across groups. Group A had lower SOD, CAT, GSH (P < 0.001; Figures 5A–C), reduced GR (P < 0.05; Figure 5D), higher MDA (P < 0.001; Figure 5E). Compared to Group A, Groups A+L1 and A+M had comparable antioxidant enzyme levels (P > 0.05, Figures 5A–D), yet exhibited lower MDA levels (P < 0.01, Figure 5E). Group A+L2 displayed increased CAT content and reduced MDA content (P < 0.05, Figures 5B, E). Meanwhile, Group A+M+L1 enhanced SOD and GSH contents (P < 0.05, Figures 5A, C), and Group A+M+L2 significantly elevated SOD, CAT, and GSH (P < 0.001, P < 0.01, P < 0.05, Figures 5A–C). GR content remained unchanged in treatment groups (P > 0.05, Figure 5D), while both A+M+L1 and A+M+L2 decreased MDA levels relative to Group A (P < 0.001, Figure 5E). Notably, these combined treatments, though superior to single components, still showed higher MDA content than Group C (P < 0.01, Figure 5E).
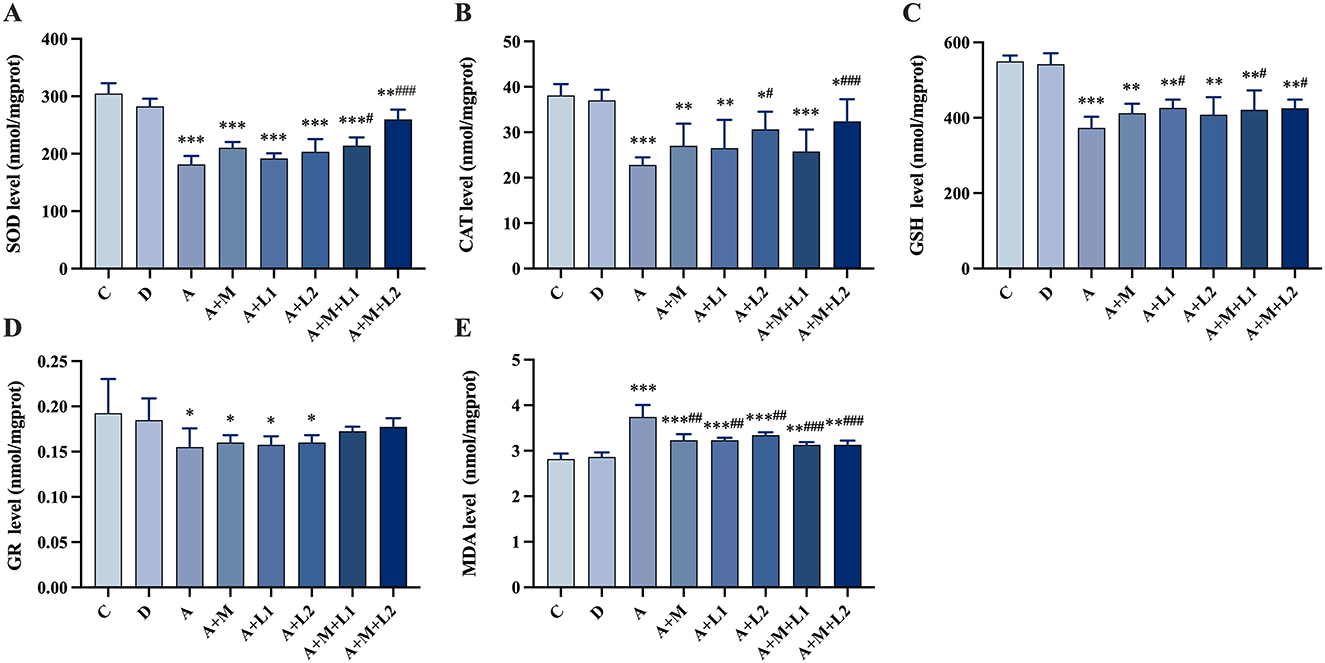
Figure 5. Antioxidant enzymes and MDA in mice liver. (A) SOD, (B) CAT, (C) GSH, (D) GR and (E) MDA. Values are mean ± SD. *, **, ***P < 0.05, 0.01, 0.001 vs. control group. #, ##, ###P < 0.05, 0.01, 0.001 vs. AFB1 group.
3.7 Liver inflammatory factor mRNA detection
Figure 6 presents the hepatic inflammatory factor mRNA expression profiles in mice. Group A showed a significant up-regulation of six inflammatory factor mRNAs compared to Group C (P < 0.001, Figures 6A–F). Compared with Group A, Group A+L1 showed significantly lower mRNA levels of TNF-α (P < 0.01, Figure 6B) and IL-6, IL-10, and IL-2 (P < 0.05, Figures 6C–E). TNF-α, IL-6, IL-8, IL-10, and IL-2 mRNA levels were significantly down-regulated in Group A+L2 (P < 0.01, Figures 6B, D, E; P < 0.05, Figures 6C, F). Additionally, these factors were significantly decreased in Group A+M+L1 (P < 0.05, Figures 6C, F; P < 0.01, Figures 6B, D, E), with more pronounced effects in Group A+M+L2 (P < 0.01, Figures 6B–F).
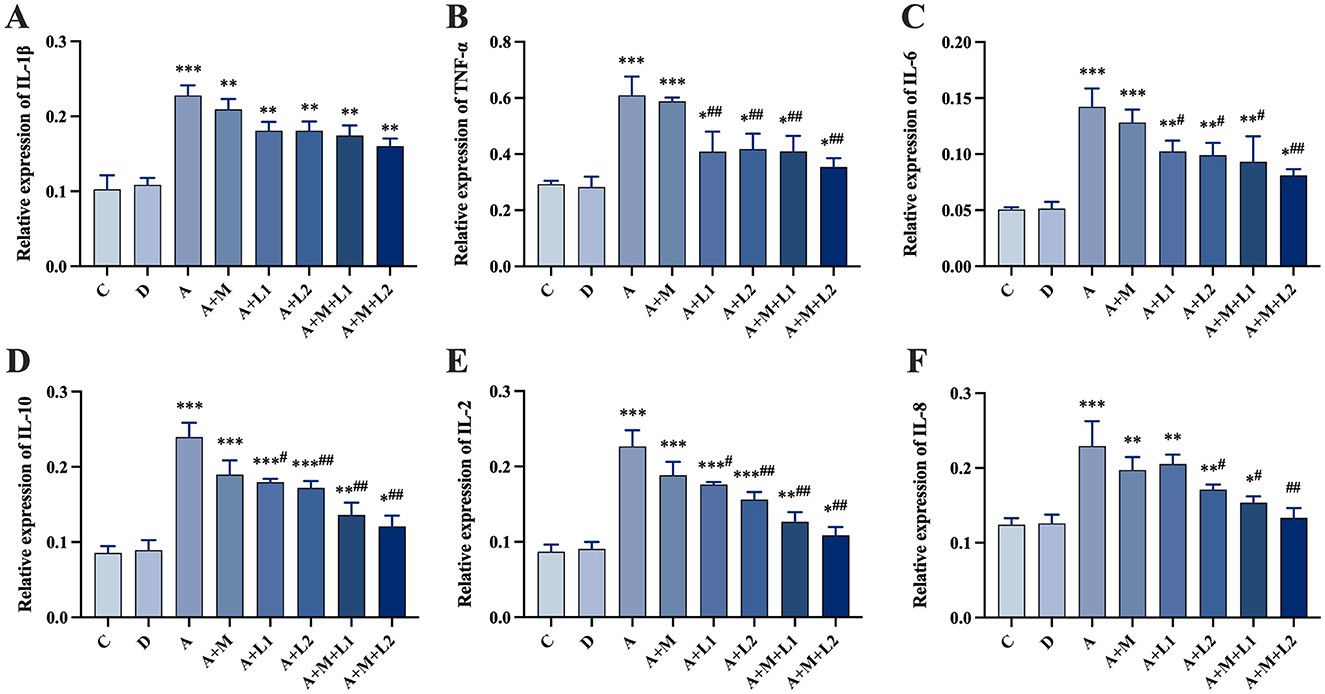
Figure 6. Liver inflammatory cytokine mRNA levels. (A) IL-1β, (B) TNF-α, (C) IL-6, (D) IL-10, (E) IL-2, (F) IL-8. Values are mean ± SD. *, **, ***P < 0.05, 0.01, 0.001 vs. control group. #, ##, ###P < 0.05, 0.01, 0.001 vs. AFB1 group.
3.8 Intestinal antioxidant enzyme
Figure 7 illustrates the results of alterations in oxidative stress indices within the intestinal tissues. CAT activity showed no significant changes (P > 0.05, Figure 7C). MDA and SOD/GSH contents in Group A were significantly increased (P < 0.001, Figures 7A, B, D) compared with Group C. Group A+L1 had statistically significant decreases in SOD (P < 0.05, Figure 7B) and GSH (P < 0.01, Figure 7D) contents compared with Group A. Group A+L2 demonstrated a significant decrease in MDA (P < 0.05, Figure 7A) and a highly significant reduction in both SOD and GSH contents (P < 0.01, Figures 7B, D). Groups A+M+L1 and A+M+L2 exhibited a highly significant reduction in MDA (P < 0.01, Figure 7A) and SOD/GSH contents (P < 0.001, Figures 7B, D).
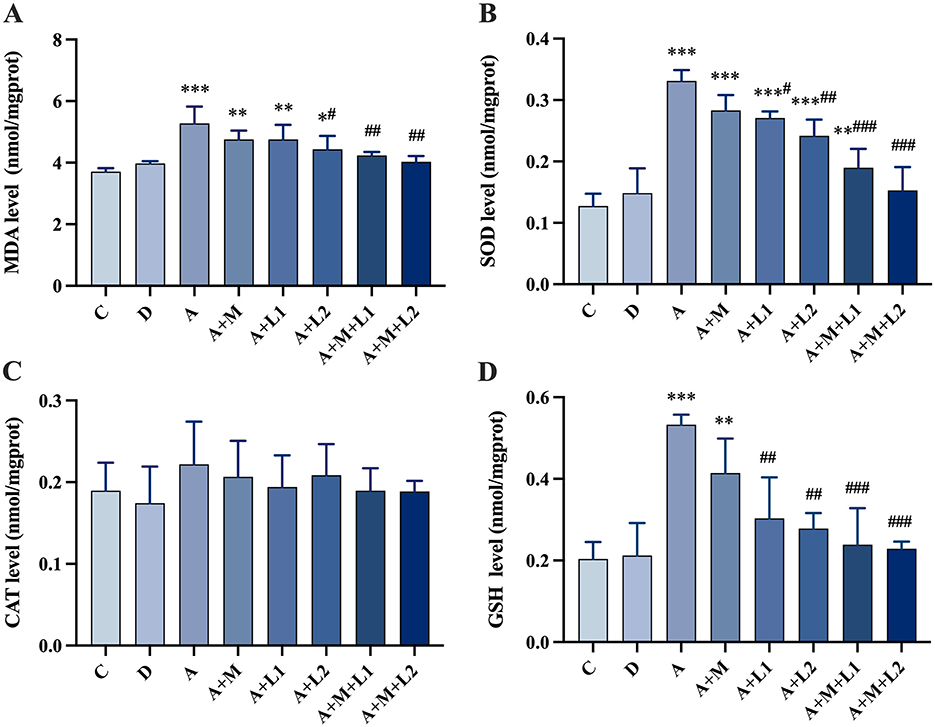
Figure 7. Antioxidant enzyme changes in mice intestinal injury. (A) MDA; (B) SOD; (C) CAT; (D) GSH. Values are mean ± SD. *, **, ***P < 0.05, 0.01, 0.001 vs. control group. #, ##, ###P < 0.05, 0.01, 0.001 vs. AFB1 group.
3.9 Alterations in the microbiota of cecal contents in mice
The experiment began with an analysis of the cumulative and alpha diversity in cecal content samples from mice (Figure 8). The species accumulation curve (Figure 8A) illustrates that the curve increases with larger sample sizes and ultimately levels off. This signifies that the sample size was adequate for subsequent assessments of species richness and diversity. Dilution curves were generated by correlating the volume of sequencing data obtained with the respective number of species (Figure 8B). The curve exhibits a tendency to flatten with increased sequencing depth, indicating that the sequencing data accumulation was stable and sufficient. Furthermore, even with larger data volumes, only a limited number of new OTUs were observed, which would not affect the experiment.
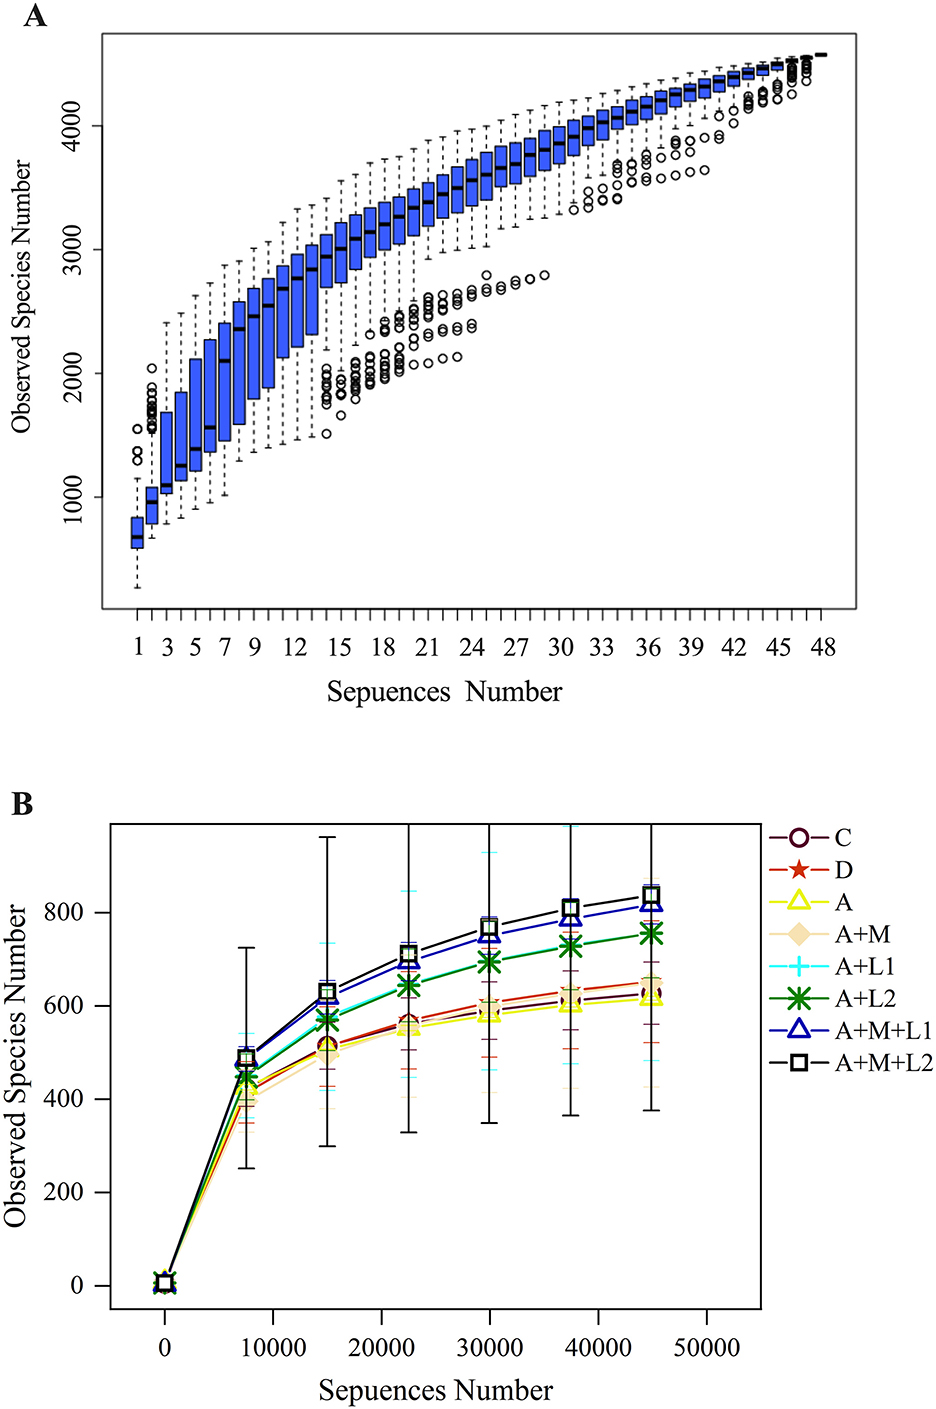
Figure 8. Cumulative species curve (A) in cecal content samples of mice and species alpha diversity dilution curve (B).
3.9.1 Alterations in intergroup disparities in the alpha diversity index of cecal microbiota
Alpha diversity indices were employed to quantify within-sample community richness and diversity. Sequencing coverage exceeded 99.70% for all groups (Table 3), showing that the depth captured all sample species. Notable discrepancies in ACE/Chao1 metrics were observed between Group A and C, coinciding with shifts in murine intestinal microbial richness and diversity. When LAB or MMT was applied independently, ACE and Simpson indices showed no significant differences from Group A (P > 0.05), while Shannon and Chao1 indices were substantially elevated (P < 0.05). Significantly, following the incorporation of the LGG/LAC-MMT combination, all three indices (ACE, Simpson, and Chao1) exhibited substantial increases (P < 0.05), with LAC-MMT demonstrating stronger effects on intestinal microbiota richness and diversity in mice.
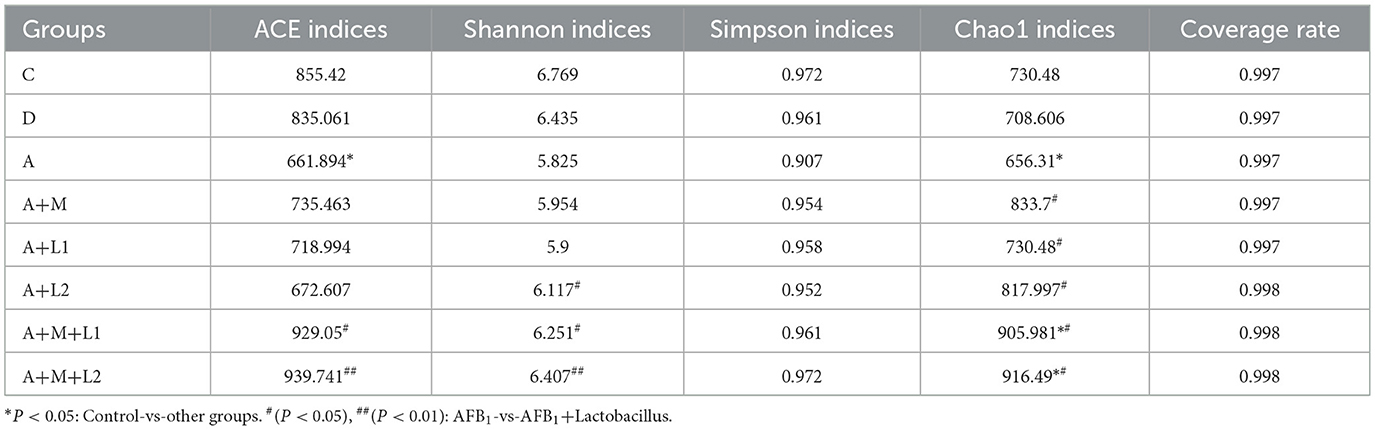
Table 3. Analysis of α diversity of cecal flora in each group.
3.9.2 Variations in the microbiota composition within the cecal contents
The effects of LAB and MMT on cecal microbiota abundance at phylum and order levels were analyzed in mice (Figure 9). At the Phylum level (Figure 9A), more than 80% of the intestinal microbiota in mice comprises predominant bacterial phyla, including Firmicutes, Bacteroidota, Proteobacteria, Actinobacteria, and Cyanobacteria. A notable reduction in Firmicutes relative abundance was observed from Group C (64.13%) to Group A (47.29%). In contrast, the relative abundance of Bacteroidota increased from 19.71% (Group C) to 22.36% (Group A). Moderate increases in beneficial microbial communities were observed in A+M, A+L1, A+L2, and A+M+L1 vs. Group A, with a marked rise in Firmicutes abundance specific to A+M+L2.
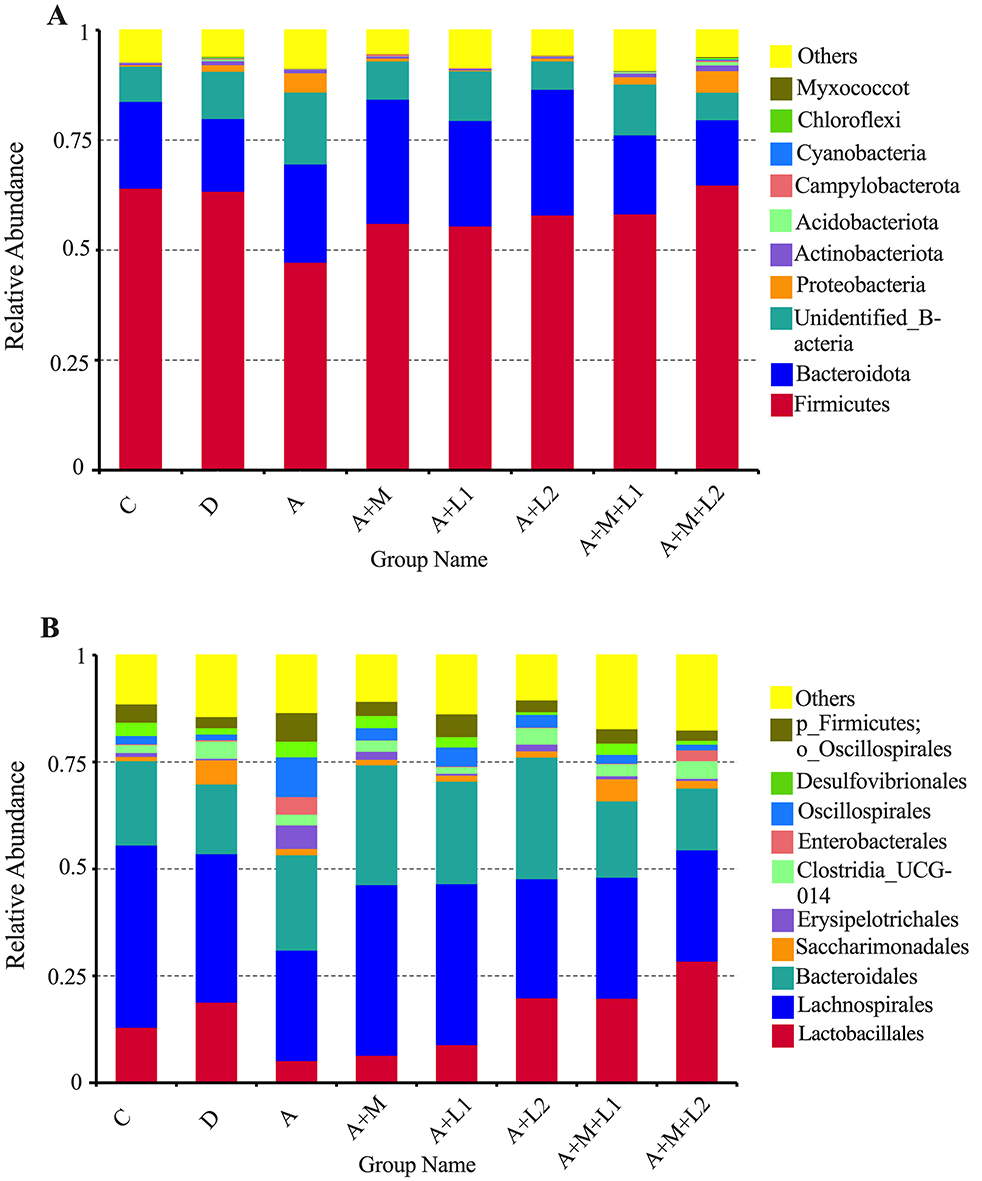
Figure 9. Bacterial phylum (A) and order (B) abundances in mice cecum.
In Group A+M+L2, Lactobacillales had the greatest relative abundance (23.27%) at the Order level (Figure 9B), followed by Groups A+L2 (14.69%) and A+M+L1 (14.58%), while Group A had the lowest (7.82%). Moreover, the predominant bacterial groups, including Lachnospirales and Bacteroidales, showed a tendency to be consistent with the changes in the relative abundance of Lactobacillales.
3.9.3 Intestinal antioxidant capacity and function enzymes
To examine the variations in dominant species among the three sample groups at the species level, we identified the top 10 species sorted by average abundance for each of the three groups and created a ternary plot (Figure 10). The predominant bacterial populations in Groups C and D are dominated by LAC and Lactobacillus johnsonii, whereas Group A is predominantly comprised of Escherichia coli. Following the treatment of the mice, Lactobacillus johnsonii emerged as the predominant bacterial community in Groups A+M+L1 and A+M+L2, and the quantity of Escherichia coli diminished. Notably, Group A+M+L2 demonstrated a more significant effect.
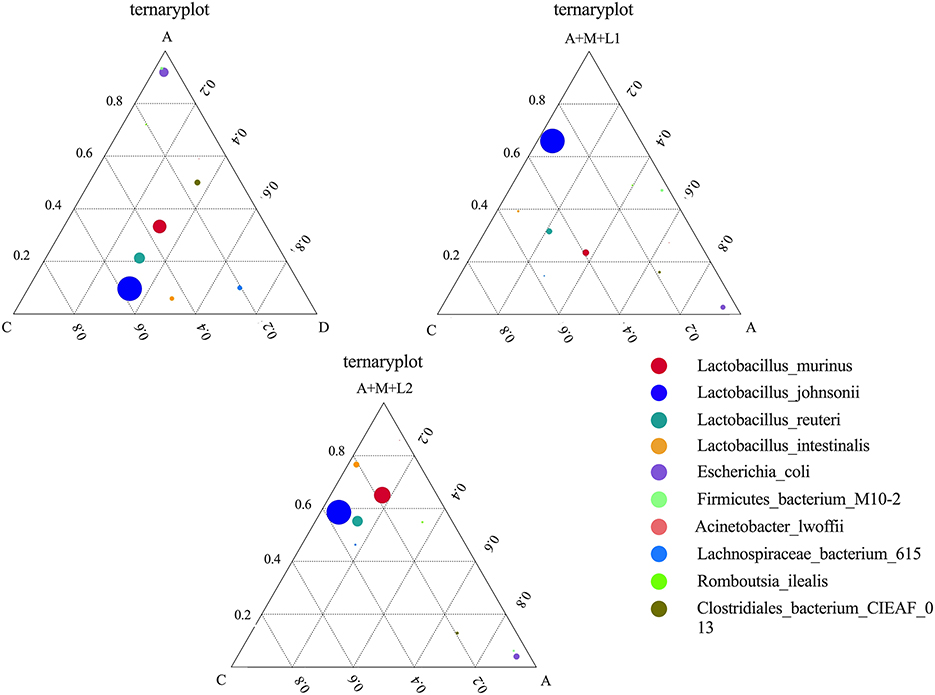
Figure 10. Differences in dominant species at the species level in each group's cecal flora.
3.10 Concentration of AFB1 in the feces
We also analyzed the AFB1 content in mouse feces across treatment groups (Figure 11). Fecal AFB1 was unchanged in A+M and A+L1 (P > 0.05), increased in A+L2 (P < 0.05), and highly elevated in A+M+L1 and A+M+L2 (P < 0.01; P < 0.001 vs. A).
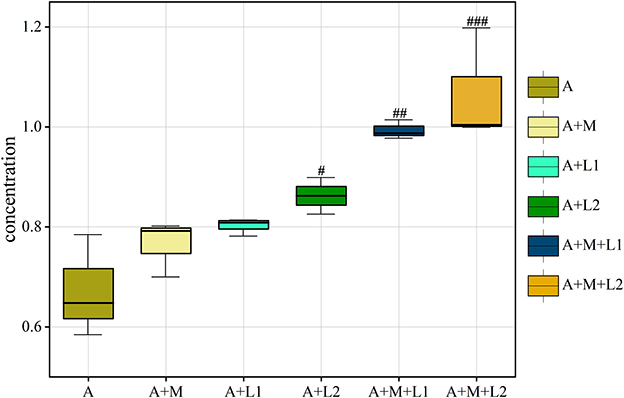
Figure 11. AFB1 in mice feces is shown as box plots with IQR (25th−75th percentiles), 1.5 × IQR whiskers, and median line. Symbols #, ##, ###P < 0.05, 0.01, 0.001.
4 Discussion
AFB1, as a highly toxic compound, is the most toxic of the known AFs. Oral intake of AFB1-contaminated food or feed, along with direct contact via skin or mucous membranes, represents the primary exposure pathways to AFB1 (32). As documented in the literature, both exposure routes exhibit harmful effects on the gastrointestinal and hepatic systems, as supported by epidemiologic and animal experimental evidence (33, 34). Certain bacteria, such as LAB, including Bifidobacterium and L.plantarum, can degrade AFB1 toxicity (35, 36). However, most studies focus on direct toxicity reduction by LAB while neglecting their complex host-colonization ability and unstable intestinal survival (37), which may limit their efficacy. Using MMT as a carrier, LAB-MMT complexes alleviate AFB1-induced immunotoxicity and oxidative stress while enhancing LAB's gastrointestinal survival (38, 39). However, there have been no reports on the combination of LGG/LAC-MMT to degrade AFB1. LGG/LAC-MMT protective effects against AFB1 toxicity in mice inform poisoning management.
AFB1 can be activated in the liver and bind to DNA and proteins, thus disrupting liver morphology (40, 41). ALT and AST are validated liver injury markers (42). MDA is a recognized oxidative damage biomarker, while T-AOC, SOD, CAT, and GSH-Px indicate oxidative stress status (43, 44). AFB1 induced hepatic histological lesions in mice, increasing ALT, AST, IL-1β, TNF-α, and MDA, while decreasing TP, ALB, PA, and antioxidant enzyme activities (SOD, CAT, GSH-Px). These findings confirm AFB1-mediated liver injury, inflammation, and oxidative stress. Single LGG, LAC, or MMT treatments only reduced MDA. Notably, the LGG/LAC-MMT combination mitigated liver injury, lowering MDA, transaminases (ALT, AST), and proinflammatory cytokines, while enhancing SOD, GSH, and CAT levels. This indicates that the combination of LGG/LAC-MMT can reduce the hepatotoxicity of AFB1 by significantly reversing liver injury, alleviating hepatic dysfunction and oxidative stress injury, as well as regulating the production of cytokines. Among them, the effect of LAC-MMT was more significant.
AFs cause intestinal lesions in animals, disrupt intestinal barrier function and modulate immune responses (45, 46). A related study in rats showed that AFB1 exposure induced duodenal mucosal/submucosal hemorrhage and oxidative stress (47). The present study agreed with other studies that AFB1 exposure caused structural abnormalities in mouse jejunal tissues, with significantly elevated levels of MDA, SOD, and GSH, suggesting that mice's jejunal tissues were damaged and accompanied by oxidative stress. LGG, LAC and MMT alone reduced the degree of tissue damage in AFB1-intoxicated mice, suggesting that all three have a protective effect on intestinal tissue damage in AFB1-intoxicated mice. In the past few decades, the oxidative stress coping mechanisms of LABs, their antioxidant potential, and their health-benefiting effects have been intensively examined. For example, Lactobacillus fermentum strain JX306 was found to significantly reduce MDA levels and increase GSH-Px, Glutathione S-transferase (GST) and SOD levels in the small intestine (48). In this study, LGG, LAC and MMT could up-regulate the levels of SOD, CAT, GSH and reduce the MDA content in the intestinal tissues of AFB1-intoxicated mice either by individual intervention or by combined application, in which the effect of combination of LGG/LAC-MMT was more significant. Thus, the LGG/LAC-MMT combination provided stronger protection against AFB1-induced oxidative damage, with LAC-MMT exhibiting the most pronounced effect.
Gut microbes are essential for livestock health and efficiency. AFB1 exposure damages host organs and depletes intestinal microbiota (49). 16S sequencing shows that AFB1 alters mouse gut microbiome composition. Flora diversity analysis showed significant decreases in ACE and Chao1 indices in the AFB1 group, indicating altered intestinal flora abundance and diversity. The two largest phyla levels that make up the intestinal microbiome are the Firmicutes and Bacteroidota. The proportion of thick-walled to anabolic bacilli has been linked to various pathological states, including intestinal metabolic balance and inflammatory marker levels (50). At both phylum and order levels, AFB1 exposure significantly reduced Lactobacillales abundance. It was hypothesized that AFB1 can trigger related diseases, such as oxidative stress and inflammatory responses, by decreasing the dominant flora in the intestines of mice. Studies have shown that AFs increase penetration and translocation of pathogenic bacteria (51–53). AFB1 decreased dominant gut bacteria and increased pathogens (e.g., Escherichia coli) in mice, consistent with prior findings. It suggests that AFB1 can lead to intestinal flora disruption, which can result in intestinal damage. The study confirmed that LABs have the function of regulating the balance of intestinal microbiota. LABs have been shown to alleviate intestinal microbiota dysbiosis, alter dominant intestinal species, and improve intestinal barrier function (54, 55). Additionally, the LAC-MMT combination exhibited superior effects on intestinal flora and barrier function compared to single components (56). In this study, ACE, Shannon, Simpson, and Chao1 indices were significantly higher in the LAC/LGG-MMT combination group than in other groups. This suggests that the LAC/LGG-MMT combination exhibits more pronounced effects on the richness and diversity of mouse intestinal flora. The LGG/LAC-MMT combination increased dominant flora and reduced pathogenic bacteria in mouse intestines. Among them, LAC-MMT co-application increased the colonization ability of LAC. To investigate AFB1 degradation, fecal AFB1 content was measured, showing that LGG, LAC, and MMT bound AFB1 and reduced intestinal absorption, with LAC and LAC/LGG-MMT being most effective. This indicates their ability to prevent intestinal AFB1 absorption. Although we did not observe any toxic effects of MMT combination therapy on mice during the 4-week trial period, different types and doses of MMT may produce different effects. Therefore, the long-term safety of MMT combination therapy requires further investigation.
5 Conclusions
This study revealed that the LGG/LAC-MMT combination potently alleviated AFB1-induced hepatic and intestinal tissue damage. Additionally, this combination alleviated both the inflammatory response and oxidative stress damage in these organs. Moreover, LGG/LAC-MMT played a crucial role in rebalancing the intestinal flora of AFB1-intoxicated mice. By enhancing the prevalence of dominant bacteria and reducing the population of pathogenic bacteria, it exerted a clinically significant protective function. Among these, the LAC-MMT combination emerged as the most effective treatment, which provides essential scientific evidence for the subsequent formulation development targeting AFB1 control.
Data availability statement
The original contributions presented in the study are included in the article/supplementary material, further inquiries can be directed to the corresponding authors.
Ethics statement
This study gained ethical approval from Heilongjiang Bayi Agricultural University's Science and Technology Ethics Committee (Approval number: DWKJXY2024034). The study was conducted in accordance with the local legislation and institutional requirements.
Author contributions
JC: Formal analysis, Software, Writing – review & editing, Conceptualization, Methodology, Writing – original draft, Project administration. YG: Conceptualization, Validation, Methodology, Writing – review & editing, Formal analysis, Supervision. HLv: Data curation, Formal analysis, Conceptualization, Methodology, Writing – review & editing. JL: Data curation, Writing – review & editing, Project administration. TA: Writing – review & editing, Supervision, Validation. HLi: Writing – review & editing, Supervision, Validation. JW: Writing – review & editing, Validation, Supervision. HZ: Supervision, Validation, Writing – review & editing. HW: Validation, Writing – review & editing, Supervision. SZ: Writing – review & editing, Supervision, Validation. ZF: Formal analysis, Writing – review & editing, Methodology, Conceptualization. YC: Project administration, Writing – review & editing, Writing – original draft.
Funding
The author(s) declare that financial support was received for the research and/or publication of this article. This research was funded by the National key R&D Program of China (Beijing, China; grant no. 2023YFD1802100), the Research Support Program of the Excellent Young Teacher Fundamental of Heilongjiang Province in 2023 (funding numbers: YQJH2023018), and the Agricul-tural Research System of China (funding numbers: CARS-36).
Conflict of interest
The authors declare that the research was conducted in the absence of any commercial or financial relationships that could be construed as a potential conflict of interest.
Generative AI statement
The author(s) declare that no Gen AI was used in the creation of this manuscript.
Any alternative text (alt text) provided alongside figures in this article has been generated by Frontiers with the support of artificial intelligence and reasonable efforts have been made to ensure accuracy, including review by the authors wherever possible. If you identify any issues, please contact us.
Publisher's note
All claims expressed in this article are solely those of the authors and do not necessarily represent those of their affiliated organizations, or those of the publisher, the editors and the reviewers. Any product that may be evaluated in this article, or claim that may be made by its manufacturer, is not guaranteed or endorsed by the publisher.
References
1. Omotayo OP, Omotayo AO, Mwanza M, Babalola OO. Prevalence of mycotoxins and their consequences on human health. Toxicol Res. (2019) 35:1–7. doi: 10.5487/TR.2019.35.1.001
2. Choi H, Garavito-Duarte Y, Gormley AR, Kim SW. Aflatoxin B1: challenges and strategies for the intestinal microbiota and intestinal health of monogastric animals. Toxins. (2025) 17:43. doi: 10.3390/toxins17010043
3. Chu Y, Yu A, Wang H, Rajput SA Yu Q, Qi D. Biological mechanisms of aflatoxin b1-induced bile metabolism abnormalities in ducklings. Animals. (2024) 14:2996. doi: 10.3390/ani14202996
4. Zhang M. Aflatoxin B1 Disrupts the intestinal barrier integrity by reducing junction protein and promoting apoptosis in pigs and mice. Ecotoxicol Environ Saf. (2022) 247:114250. doi: 10.1016/j.ecoenv.2022.114250
5. Pauletto M, Tolosi R, Giantin M, Guerra G, Barbarossa A, Zaghini A, et al. Insights into Aflatoxin B1 toxicity in cattle: an in vitro whole-transcriptomic approach. Toxins. (2020) 12:429. doi: 10.3390/toxins12070429
6. Vipin AV, Raksha Rao K, Kurrey N, Appaiah KA, Venkateswaran G. Protective effects of phenolics-rich extract of ginger against aflatoxin b1-induced oxidative stress and hepatotoxicity. Biomed Pharmacother. (2017) 91:415–24. doi: 10.1016/j.biopha.2017.04.107
7. Ji Y, Zhang Y, Si W, Guo J, Liu G, Wang C, et al. Aflatoxin B1-Induced apoptosis in donkey kidney via endog-mediated endoplasmic reticulum stress. Vet Sci. (2025) 12:130. doi: 10.3390/vetsci12020130
8. Rajaura S. Aflatoxin B1 Administration causes inflammation and apoptosis in the lungs and spleen. Toxicon. (2024) 238:107581. doi: 10.1016/j.toxicon.2023.107581
9. Gugliandolo E, Peritore AF, D'Amico R, Licata P, Crupi R. Evaluation of neuroprotective effects of quercetin against aflatoxin B1-intoxicated mice. Animals. (2020) 10:898. doi: 10.3390/ani10050898
10. Yarru LP, Settivari RS, Antoniou E, Ledoux DR, Rottinghaus GE. Toxicological and gene expression analysis of the impact of aflatoxin b1 on hepatic function of male broiler chicks. Poult Sci. (2009) 88:360–71. doi: 10.3382/ps.2008-00258
11. Akinrinde AS. Acute Aflatoxin B1-induced gastro-duodenal and hepatic oxidative damage is preceded by time-dependent hyperlactatemia in rats. Mycotoxin Res. (2020) 36:443–52. doi: 10.1007/s12550-020-00408-6
12. Ge B. Integrated network toxicology, molecular docking, and in vivo experiments to elucidate molecular mechanism of aflatoxin B1 hepatotoxicity. Ecotoxicol Environ Saf. (2024) 275:116278. doi: 10.1016/j.ecoenv.2024.116278
13. Moloi TP. Aflatoxin B1-induced hepatotoxicity through mitochondrial dysfunction, oxidative stress, and inflammation as central pathological mechanisms: a review of experimental evidence. Toxicology. (2024) 509:153983. doi: 10.1016/j.tox.2024.153983
14. Cheng K, Niu J, Zhang J, Qiao Y, Dong G, Guo R, et al. Hepatoprotective effects of chlorogenic acid on mice exposed to aflatoxin B1: modulation of oxidative stress and inflammation. Toxicon. (2023) 231:107177. doi: 10.1016/j.toxicon.2023.107177
15. Albadrani GM, Altyar AE, Kensara OA, Haridy MAM, Sayed ZM, Ahmed EA, et al. Effects of alfa lipoic acid and coenzyme Q10 treatment on AFB1-induced oxidative, inflammatory, and DNA damages in rats. Toxicon. (2024) 249:108083. doi: 10.1016/j.toxicon.2024.108083
16. Altyar AE, Kensara OA, Noreldin AE, Albadrani GM, El-Demerdash FM, Sayed AA, et al. Spirulina platensis ameliorates hepatic oxidative stress and DNA damage induced by aflatoxin B1 in rats. Toxicon. (2024) 237:107553. doi: 10.1016/j.toxicon.2023.107553
17. Ye L, Chen H, Tsim KWK, Shen X, Li X, Li X, et al. Aflatoxin B1 induces inflammatory liver injury via gut microbiota in mice. J Agric Food Chem. (2023) 71:10787–97. doi: 10.1021/acs.jafc.3c02617
18. Zhou J. Assessment of the Adverse Impacts of Aflatoxin B1 on gut-microbiota dependent metabolism in F344 rats. Chemosphere. (2019) 217:618–28. doi: 10.1016/j.chemosphere.2018.11.044
19. Chang J. Compound probiotics alleviating aflatoxin B1 and zearalenone toxic effects on broiler production performance and gut microbiota. Ecotoxicol Environ Saf. (2020) 194:110420. doi: 10.1016/j.ecoenv.2020.110420
20. Khalafalla MM, Zayed NFA, Amer AA, Soliman AA, Zaineldin AI, Gewaily MS, et al. Dietary Lactobacillus acidophilus ATCC 4356 relieves the impacts of aflatoxin B1 toxicity on the growth performance, hepatorenal functions, and antioxidative capacity of thinlip grey mullet (Liza ramada) (Risso 1826). Probiotics Antimicro Prot. (2022) 14:189–203. doi: 10.1007/s12602-021-09888-z
21. Kumar M, Verma V, Nagpal R, Kumar A, Behare PV, Singh B, et al. Anticarcinogenic effect of probiotic fermented milk and chlorophyllin on aflatoxin-b1-induced liver carcinogenesis in rats. Br J Nutr. (2012) 107:1006–16. doi: 10.1017/S0007114511003953
22. El-Nezami H, Mykkänen H, Kankaanpää P, Salminen S, Ahokas J. Ability of Lactobacillus and propionibacterium strains to remove aflatoxin b1 from the chicken duodenum. J Food Prot. (2000) 63:549–52. doi: 10.4315/0362-028X-63.4.549
23. Ouwehand AC, Isolauri E, Kirjavainen PV, Olkko ST, Salminen SJ. The Mucus Binding of Bifidobacterium lactis Bb12 Is enhanced in the presence of Lactobacillus GG and Lactobacillus delbrueckii Subsp. bulgaricus Lett Appl Microbiol. (2000) 30:10–3. doi: 10.1046/j.1472-765x.2000.00590.x
24. Gratz S, Mykkänen H, El-Nezami H. Aflatoxin B1 Binding by a mixture of Lactobacillus and propionibacterium: in vitro versus ex vivo. J Food Prot. (2005) 68:2470–4. doi: 10.4315/0362-028X-68.11.2470
25. Ding WK, Shah NP. Acid, bile, and heat tolerance of free and microencapsulated probiotic bacteria. J Food Sci. (2007) 72:M446–50. doi: 10.1111/j.1750-3841.2007.00565.x
26. Li S, Jiang C, Chen X, Wang H, Lin J. Lactobacillus casei immobilized onto montmorillonite: survivability in simulated gastrointestinal conditions, refrigeration and yogurt. Food Res Int. (2014) 64:822–30. doi: 10.1016/j.foodres.2014.08.030
27. Oladele JO, Xenophontos X, Elizondo GM, Daasari Y, Wang M, Tamamis P, et al. Green-engineered montmorillonite clays for the adsorption, detoxification, and mitigation of aflatoxin B1 toxicity. Toxins. (2025) 17:131. doi: 10.3390/toxins17030131
28. Jackson SJT, Andrews K, Droleskey RE, Banz WJ, Apgar GA, Rivenbark KJ, et al. NutriClayZn binds Aflatoxin B1 and suppresses enterotoxigenic Salmonella and Escherichia coli. J Food Prot. (2025) 88:100486. doi: 10.1016/j.jfp.2025.100486
29. Awuor AO, Yard E, Daniel JH, Martin C, Bii C, Romoser A, et al. Evaluation of the efficacy, acceptability and palatability of calcium montmorillonite clay used to reduce Aflatoxin B1 dietary exposure in a crossover study in Kenya. Food Addit Contam Part A. (2017) 34:93–102. doi: 10.1080/19440049.2016.1224933
30. Kihal A, Rodríguez-Prado M, Calsamiglia S. A network meta-analysis on the efficacy of different mycotoxin binders to reduce Aflatoxin M1 in milk after Aflatoxin B1 challenge in dairy cows. J Dairy Sci. (2023) 106:5379–87. doi: 10.3168/jds.2022-23028
31. Liu R, Kang JD, Sartor RB, Sikaroodi M, Fagan A, Gavis EA, et al. Neuroinflammation in murine cirrhosis is dependent on the gut microbiome and is attenuated by fecal transplant. Hepatology. (2020) 71:611–26. doi: 10.1002/hep.30827
32. Jager AV, Tonin FG, Baptista GZ, Souto PCMC, Privatti RT, Oliveira CAF. Assessment of Aflatoxin B1 exposure using serum and urinary biomarkers in São Paulo, Brazil: a pilot study. Int J Hyg Environ Health. (2016) 219:294–300. doi: 10.1016/j.ijheh.2015.12.003
33. Zhang X. Dual role of dietary curcumin through attenuating AFB1-induced oxidative stress and liver injury via modulating liver phase-I and phase-II enzymes involved in AFB1 bioactivation and detoxification. Front Pharmacol. (2018) 9:544. doi: 10.3389/fphar.2018.00554
34. Fouad AM, Ruan D, El-Senousey HK, Chen W, Jiang S, Zheng C. Harmful effects and control strategies of Aflatoxin B1 produced by Aspergillus flavus and Aspergillus parasiticus strains on poultry: review. Toxins. (2019) 11:176. doi: 10.3390/toxins11030176
35. Tytgat HLP, Nobrega FL, van der Oost J, de Vos WM. Bowel biofilms: tipping points between a healthy and compromised gut? Trends Microbiol. (2019) 27:17–25. doi: 10.1016/j.tim.2018.08.009
36. Wang Y, Jiang L, Zhang Y, Ran R, Meng X, Liu S. Research advances in the degradation of aflatoxin by lactic acid bacteria. J Venom Anim Toxins Incl Trop Dis. (2023) 29:e20230029. doi: 10.1590/1678-9199-jvatitd-2023-0029
37. Grenier B, Applegate TJ. Modulation of intestinal functions following mycotoxin ingestion: meta-analysis of published experiments in animals. Toxins. (2013) 5:396–430. doi: 10.3390/toxins5020396
38. Gratz S, Wu QK, El-Nezami H, Juvonen RO, Mykkänen H, Turner PC. Lactobacillus rhamnosus strain GG reduces Aflatoxin B1 transport, metabolism, and toxicity in Caco-2 cells. Appl Environ Microbiol. (2007) 73:3958–64. doi: 10.1128/AEM.02944-06
39. Yang X, Liu L, Chen J, Xiao A. Response of intestinal bacterial flora to the long-term feeding of Aflatoxin B1 in mice. Toxins. (2017) 9:317. doi: 10.3390/toxins9100317
40. Kucukcakan B, Hayrulai-Musliu Z. Challenging role of dietary Aflatoxin B1 exposure and Hepatitis B infection on risk of hepatocellular carcinoma. Open Access Maced J Med Sci. (2015) 3:363–9. doi: 10.3889/oamjms.2015.032
41. Ishikawa AT, Hirooka EY, Alvares E, Silva PL, Bracarense APFL, Flaiban K, et al. Impact of a single oral acute dose of Aflatoxin B1 on liver function/cytokines and the lymphoproliferative response in C57BL/6 mice. Toxins. (2017) 9:374. doi: 10.3390/toxins9110374
42. Hinson JA, Roberts DW, James LP. Mechanisms of acetaminophen-induced liver necrosis. Handb Exp Pharmacol. (2010) 196:369–405. doi: 10.1007/978-3-642-00663-0_12
43. Zhang J, Wang P, Xu F, Huang W, Ji Q, Han Y, et al. Protective effects of lycopene against Aflatoxin B1-induced erythrocyte dysfunction and oxidative stress in mice. Res Vet Sci. (2020) 129:103–8. doi: 10.1016/j.rvsc.2020.01.015
44. Tsukagoshi M, Sirisopapong M, Namai F, Ishida M, Okrathok S, Shigemori S, et al. Lactobacillus ingluviei C37 from chicken inhibits inflammation in LPS-stimulated mouse macrophages. Anim Sci J. (2020) 91:e13436. doi: 10.1111/asj.13436
45. Pinton P, Oswald IP. Effect of deoxynivalenol and other type B trichothecenes on the intestine: a review. Toxins. (2014) 6:1615–43. doi: 10.3390/toxins6051615
46. Payros D, Alassane-Kpembi I, Pierron A, Loiseau N, Pinton P, Oswald IP. Toxicology of deoxynivalenol and its acetylated and modified forms. Arch Toxicol. (2016) 90:2931–57. doi: 10.1007/s00204-016-1826-4
47. Akinrinde AS, Adebiyi OE, Asekun A. Amelioration of Aflatoxin B1-induced gastrointestinal injuries by eucalyptus oil in rats. J Complement Integr Med. (2019) 17:20190002. doi: 10.1515/jcim-2019-0002
48. Ben Salah-Abbès J, Jebali R, Sharafi H, Akbari Noghabi K, Oueslati R, Abbès S. Immuno-physiological alterations from AFB1 in rats counteracted by treatments with Lactobacillus paracasei BEJ01 and montmorillonite clay mixture. J Immunotoxicol. (2016) 13:628–37. doi: 10.3109/1547691X.2016.1145157
49. Pan D, Yu Z. Intestinal microbiome of poultry and its interaction with host and diet. Gut Microbes. (2014) 5:108–19. doi: 10.4161/gmic.26945
50. Magne F, Gotteland M, Gauthier L, Zazueta A, Pesoa S, Navarrete P, et al. The Firmicutes/Bacteroidetes ratio: a relevant marker of gut dysbiosis in obese patients? Nutrients. (2020) 12:1474. doi: 10.3390/nu12051474
51. Ghareeb K, Awad WA, Böhm J, Zebeli Q. Impacts of the feed contaminant deoxynivalenol on the intestine of monogastric animals: poultry and swine. J Appl Toxicol. (2015) 35:327–37. doi: 10.1002/jat.3083
52. Akbari P, Braber S, Varasteh S, Alizadeh A, Garssen J, Fink-Gremmels J. The intestinal barrier as an emerging target in the toxicological assessment of mycotoxins. Arch Toxicol. (2017) 91:1007–29. doi: 10.1007/s00204-016-1794-8
53. Robert H, Payros D, Pinton P, Théodorou V, Mercier-Bonin M, Oswald IP. Impact of mycotoxins on the intestine: are mucus and microbiota new targets? J Toxicol Environ Health B Crit Rev. (2017) 20:249–75. doi: 10.1080/10937404.2017.1326071
54. Wang G, Jiao T, Xu Y, Li D, Si Q, Hao J, et al. Bifidobacterium adolescentis and Lactobacillus rhamnosus alleviate non-alcoholic fatty liver disease induced by a high-fat, high-cholesterol diet through modulation of different gut microbiota-dependent pathways. Food Funct. (2020) 11:6115–27. doi: 10.1039/C9FO02905B
55. Liew W-PP, Mohd-Redzwan S, Than LTL. Gut microbiota profiling of Aflatoxin B1-induced rats treated with Lactobacillus casei Shirota. Toxins. (2019) 11:49. doi: 10.3390/toxins11010049
Keywords: aflatoxin B1, Lactobacillus rhamnosus, Lactobacillus acidophilus, Montmorillonite, inflammatory responses, oxidative stress, intestinal microbiome
Citation: Cheng J, Gao Y, Lv H, Li J, An T, Liu H, Wang J, Zhang H, Wang H, Zou S, Fan Z and Chen Y (2025) LGG/LAC-MMT combination mitigates AFB1-induced liver and intestinal injury in mice based on intestinal microbiota modulation. Front. Vet. Sci. 12:1654294. doi: 10.3389/fvets.2025.1654294
Received: 26 June 2025; Accepted: 12 September 2025;
Published: 21 October 2025.
Edited by:
Fan Yang, Henan University of Science and Technology, ChinaReviewed by:
Yongfang Xie, Chongqing University of Post and Telecommunications, ChinaKang Cheng, Henan University of Technology, China
Copyright © 2025 Cheng, Gao, Lv, Li, An, Liu, Wang, Zhang, Wang, Zou, Fan and Chen. This is an open-access article distributed under the terms of the Creative Commons Attribution License (CC BY). The use, distribution or reproduction in other forums is permitted, provided the original author(s) and the copyright owner(s) are credited and that the original publication in this journal is cited, in accordance with accepted academic practice. No use, distribution or reproduction is permitted which does not comply with these terms.
*Correspondence: Zhao Fan, cXdlcl8xMjMzMDUwQDE2My5jb20=; Yuanyuan Chen, MTgyNDk2MzY3ODVAMTYzLmNvbQ==