 Sophy Nukeri
 Mokgadi P. Malatji
 Clearance M. Mnisi
 Mamohale Chaisi
 Samson Mukaratirwa
- 1School of Life Science, College of Agriculture, Engineering and Science, University of KwaZulu-Natal, Durban, South Africa
- 2Research and Scientific Services Directorate, National Zoological Garden, South African National Biodiversity Institute, Pretoria, South Africa
- 3Department of Environmental, Water and Earth Sciences, Faculty of Science, Tshwane University of Technology, Pretoria, South Africa
- 4Department of Veterinary Tropical Diseases, University of Pretoria, Pretoria, South Africa
- 5Center for Zoonoses and Tropical Veterinary Medicine, Ross University School of Veterinary Medicine, Basseterre, Saint Kitts and Nevis
Introduction: Fasciolosis is a neglected tropical disease caused by Fasciola hepatica and Fasciola gigantica, affecting livestock, wildlife, and humans globally. Understanding the genetic diversity and population structure of Fasciola spp. is essential for tracking transmission patterns, detecting drug resistance, and guiding targeted control efforts. In South Africa, where such data are lacking, this study provides critical insights to support evidence-based interventions. This study aimed to assess genetic structure of Fasciola populations collected from cattle across seven provinces in South Africa.
Methods: Liver flukes were collected from 57 cattle from 13 provincial abattoirs across South Africa, and DNA was extracted from 189 F. hepatica specimens. Although sampling efforts varied slightly due to abattoir throughput, efforts were made to maximize geographic and ecological representation. Six polymorphic microsatellite loci were selected to assess genetic diversity based on their broad allelic range and prior validation for F. hepatica population genetic studies. The allele frequencies, Fis and Fst values, heterozygosity, and genetic distances were calculated on GenAlEx 6.51b2. Structure 2.3.4 was used to detect population structure.
Results: A total of 277 alleles were identified across loci, with allelic richness varying by province. All loci were polymorphic, and the mean number of alleles varied from 3.667 to 9.667. Moreover, out of the total number of alleles identified, 3% were private alleles. Observed heterozygosity (Ho) ranged from 0.182 to 1.000, while the expected heterozygosity (He) ranged from 0.165 to 0.899. These ranges suggest differences in genetic diversity and potential inbreeding or population structure across the samples studied. The fixation index (F) value ranged from −0.017 to 0.426. Fst values varied from 0.064 to 0.107, suggesting moderate genetic differentiation between the populations, and the number of migrants per generation (Nm) varied between 2.080 and 3.898, with an average of 3.173, which indicated a high gene flow between provinces.
Conclusion: The Ho and He indicated moderate genetic diversity within populations, while the F-value showed moderate differentiation among populations. Geographic structuring of populations was observed, with the STRUCTURE and principal coordinate analysis (PCoA) revealing four distinct genetic clusters across seven provinces. Mpumalanga and Gauteng provinces displayed high genetic diversity and a high number of private alleles, suggesting potential reservoirs of genetic variation. Genetic distances varied by region, with neighboring provinces showing lower genetic distances, indicating gene flow and genetic connectivity across regions, which might be supported by the movement of livestock for trade. These findings highlight the genetic complexity and potential epidemiological challenges for fasciolosis in South Africa. Furthermore, considerable genetic diversity and gene flow across regions may complicate fasciolosis control and surveillance efforts in South Africa.
1 Introduction
Fasciolosis is a neglected tropical disease affecting humans, domestic, and wild animals, caused by food- and water-borne trematodes, Fasciola hepatica (Linnaeus, 1758) and Fasciola gigantica (Cobbold, 1856) (1). Various climatic regions, ecological conditions, and availability of snail intermediate hosts (IHs) determine the geographical distribution of both trematodes. Fasciola hepatica has the widest distribution, occurring on five continents (2), where it utilizes Galba truncatula (Müller, 1774) as the main intermediate host (IH) (3). Fasciola gigantica occurs in the tropical regions of Asia and Africa (4), where it has adapted to the Radix species of the “auricularia super-species” (Hubendick, 1951), Radix rubiginosa (Minchelin, 1831) in Asia, and Radix natalensis (Krauss, 1848) in Africa (5, 6) as IHs. Regions where conditions support the establishment of IHs of both flukes have reported the presence of hybrid or intermediate forms of Fasciola, particularly in Africa (7–14) and Asia (15–19).
Various processes, including gene flow and genetic drift, that interact with each other and influence the selection of adaptive traits shape genetic diversity (20). Thus, the extent of such processes can be studied through patterns of population genetic structure, which can be used to develop hypotheses on the evolution of traits such as drug resistance (21–23). Gene flow and genetic drift are the two main processes that generally have opposing effects on population genetic structure and further determine the efficacy of selecting favorable mutations over many generations (20). For example, in large populations with high gene flow, the effective population size (Ne) increases thus leading to smaller random fluctuations in allele frequency. Moreover, increased gene flow between populations enhances the spread of mutations. However, gene flow may slow down local adaptations when selection pressures vary among populations (20). Understanding the balance between these processes is crucial to interpret observed genetic patterns and predicting the evolutionary pathway of traits under selection.
Despite the importance of population genetic structure studies for efficient management of parasitic diseases and in offering insights into evolutionary processes and transmission dynamics (24), information regarding levels of genetic variability and genetic differentiation between F. hepatica populations is scanty in South Africa. The scarcity of knowledge hinders the development of targeted control strategies, which is notable considering that incidences of bovine fascioliasis have been documented in several provinces of the country including Mpumalanga and KwaZulu-Natal provinces, where both F. hepatica and F. gigantica occur and novel haplotypes have been described (25, 26). Infections have also been reported in wildlife and other non-ruminant mammals (27), underscoring the broad host range of the parasite. Although human cases are rare in the country, clinical reports dating back to the 1950s and 1960s confirmed F. hepatica infection associated with hepatobiliary disease (28, 29) and a more recent case described by Black et al. (30). Moreover, studies from several European countries reported the emergence of anthelmintic resistance by the liver flukes (31–33). South Africa has a unique scenario, with the presence of both F. hepatica and F. gigantica, as well as the invasive snail IH, Pseudosuccinea columella (34), which transmits both species (35, 36) and may facilitate hybridization (25, 26). Most molecular studies of Fasciola spp. in South Africa have been based on the genetic markers of mitochondrial (mt) Cytochrome c oxidase subunit I (COI) and/or ribosomal ITS (25, 26). However, the use of these mtDNA markers has limitations in population genetic structure studies (20, 37) as mtDNA generally lacks recombination. This makes the inference of dispersal patterns difficult from the analysis of variation among intrapopulations if the identification of clones is required (20). In contrast, microsatellites offer higher polymorphism and are more appropriate for detecting fine-scale genetic differentiation. Hence, this study employed microsatellite DNA markers to determine the population genetic structure of F. hepatica from seven provinces, covering eight different agro-climatic regions of South Africa. This is important for efficient management of parasitic diseases and offers insights into evolutionary processes and transmission dynamics (24).
The specific objectives were to evaluate genetic diversity within and among F. hepatica populations based on allelic richness, heterozygosity, and fixation indices and furthermore assess genetic differentiation and population structure of F. hepatica using F-statistics and Bayesian clustering approaches.
2 Methods
2.1 Ethical consideration
The protocols for this study were approved by the University of KwaZulu-Natal Ethics Committee (AREC/020/020PD), the South African National Biodiversity Institute National Zoological Gardens Animal Research Ethics and Scientific Committee (SANBI/RES/P2021/10), and the Department of Agriculture, Land Reform and Rural Development Section 20 permit (12/11/1/1/18 (1866)). Consent letters, for post-mortem examination of livers where flukes or signs of liver damage are visible, were obtained from abattoir managers.
2.2 Study sites and sample collection
One hundred and eighty-nine (n = 189) adult Fasciola parasites were opportunistically collected from livers of 57 infected cattle from seven provinces in South Africa, namely, Gauteng (84), Mpumalanga (35), Free State (13), North West (11), Northern Cape (13), Eastern Cape (17), and KwaZulu-Natal (16). The cattle were slaughtered at 13 abattoirs from seven provinces in South Africa (Gauteng = 21, Mpumalanga = 13, Free State = 4, North West = 4, Northern Cape = 3, Eastern Cape = 4, KwaZulu-Natal = 8). Specimens were preserved in 70% ethanol prior to transportation to the laboratory at the Pretoria Zoological Gardens, South Africa National Biodiversity Institution (SANBI), Pretoria, South Africa.
2.3 DNA extraction
Specimens were individually washed several times with distilled water to remove residual ethanol and patted dry with tissue to remove excess water. A 20 mg section of adult liver fluke tissue (F. hepatica) anterior to the ventral sucker but posterior to the pharyngeal area, thereby avoiding both the reproductive organs and the intestinal caeca, was used for DNA extraction. The DNA was extracted from the flukes using the ZR Genomic DNA™ Tissue MiniPrep (Zymo Research Corporation, California, United States) according to the manufacturer’s instructions. The DNA was quantified with a NanoDrop spectrophotometer and stored at −20 °C until needed.
2.4 Polymerase chain reaction and fragment analysis
The species of flukes were confirmed as F. hepatica based on a single-step multiplex PCR using Pepck primers Fh-Pepck-F: 5′-GATTGCACCGTTAGGTTAGC-3′; Fg-Pepck-F: 5′-AAAGTTTC TATCCCGAACGAAG-3′; and Fcmn-Pepck-R: 5′-CGAAAAT TATGGCATCAATGGG-3′ for F. hepatica and F. gigantica, respectively (38). Following the thermal cycling protocol as described by Shoriki et al. (38), F. hepatica and F. gigantica were identified by a band at 241 bp and 510 bp, respectively. The COI and ITS genes were amplified and sequenced using the primers FHCOI (forward: 5′-TTGGTTTTTTGGGCATCCT-3′) and RHCOI (reverse: 5′-AGG CCACCACCAAATAAAAGA-3′), and S30FE (forward: 5′-GTCGTAA CAAGGTTTCCGTA-3′) and S49E6 (reverse: 5′-TATGCTTAAA TTCAGCGGGT-3′) and protocol described by Haridwal et al. (25), respectively. Microsatellite markers (Fh_2, Fh_5, Fh_6, Fh_7, Fh_10, and Fh_12), developed for F. hepatica (39), were used to genotype individual flukes. These markers were selected based on their allelic size ranges to ensure coverage from the lowest to the highest observed allele sizes. Samples from the Limpopo province (n = 59) were excluded as they were predominantly F. gigantica and had suspected introgressed Fasciola forms. In addition, a sample containing DNA-free water in place of template DNA was included in all reactions as a negative control. Polymerase chain reactions (PCRs) were conducted using six sets of fluorescently labeled primers (Life Technologies, Carlsbad, United States), and the different alleles were discriminated based on allelic size range and fluorescence of individual primer pairs. Polymerase chain reaction amplification was conducted in a 10 μL reaction volume consisting of DreamTaq Green PCR Master Mix (Thermo Scientific, Massachusetts, United States), 1 μM of the fluorescent dye-M13 tagged forward primer and 0.5 μM of the reverse primer (Table 1), and 50 ng genomic DNA template. The cycling conditions described by Cwiklinski et al. (39) were followed with some modifications on annealing temperature (55 °C for Fh_2, Fh_5, Fh_7, Fh_10, and Fh_12). PCR products were analyzed by 2% agarose gel electrophoresis using SYBR® Safe DNA stain (Life Technologies, Carlsbad, United States). Bands were visualized under UV light. Amplicons were diluted 50-fold and 1 μL of this dilution multiplexed in 8.8 μL Hi-Di Formamide (Life Technologies, Carlsbad, United States) with 0.2 μL GeneScan LIZ500 size standards (Life Technologies, Carlsbad, United States) and run on an 3500xL Dx Genetic Analyzer (Applied Biosystems, Massachusetts, United States) and genotyped using GeneMapper® v. 4.0 (Applied Biosystems, Massachusetts, United States).
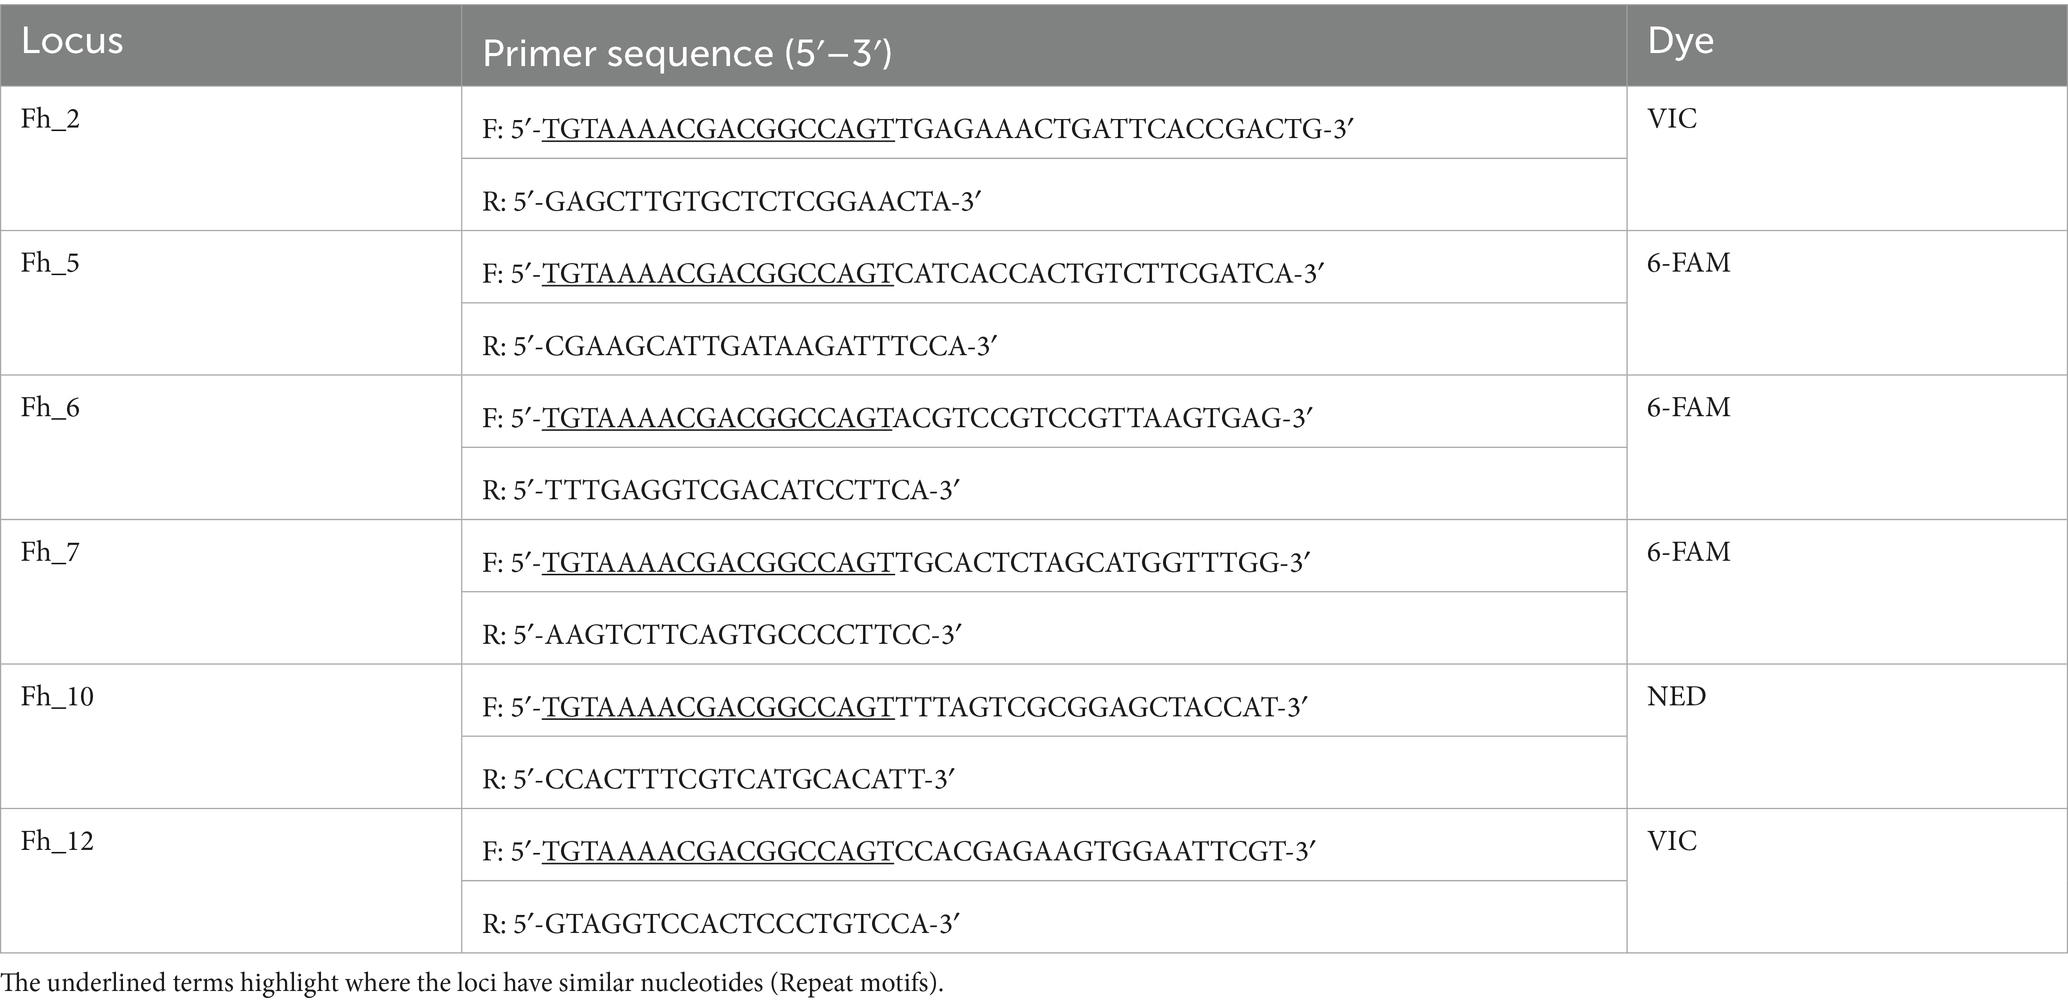
Table 1. Primer sequences and properties of Fasciola hepatica (Fh) microsatellite alleles.
2.5 Data analysis
Statistical analyses for allele frequencies, Fis and Fst values, heterozygosity, and genetic distances were calculated on GenAlEx 6.51b2 (40) using the full dataset. Structure 2.3.4 (41) was used to detect population structure with default settings. Burn-in length was set at 100,000 and followed by 100,000 Markov Chain Monte Carlo repeats. The value of K was set at 1–10 and repeated 20 times. To determine the most appropriate value for K, Delta K was determined using the method proposed by Evanno et al. (42) and calculated using StructureSelector (43). To avoid bias due to sample size, the Gauteng population structure was analyzed separately as it had a higher sample size (84) compared to the other six provinces, which were combined (105) for analyses.
Genetic differentiation of F. hepatica populations across all six loci was assessed using the following parameters: total number of alleles (Na); (Ne); Information Index (I); He; Ho; unbiased expected heterozygosity (uHe), and F.
3 Results
3.1 Identification of fluke species
PCR amplification of the Pepck confirmed that all 189 adult Fasciola specimens were F. hepatica, as they produced diagnostic bands at 241 bp, consistent with F. hepatica. Sequence comparisons of the COI and ITS regions with GenBank references provided further confirmation of species identity.
3.2 Genotyping
All six microsatellite loci (Fh_2, Fh_5, Fh_6, Fh_7, Fh_10, and Fh_12) were successfully amplified across most of the 189\u00B0F. hepatica samples. A total of 146 samples (77.249%) yielded complete genotypes at all six loci. Amplification success per locus was as follows: Fh_2 (163/189), Fh_5 (160/189), Fh_6 (164/189), Fh_7 (164/189), Fh_10 (167/189), and Fh_12 (155/189) (Supplementary Table S1).
3.3 Genetic differentiation
A total of 277 alleles (Na) were detected from the seven F. hepatica populations, and the number of alleles per locus ranged from 2 (FH_7/FH_12) to 18 (FH_6), with an average of 7 alleles per locus. The number of effective alleles (Ne) ranged from 1.198 (FH_12) to 9 (FH_6), and the average was 3.568. Shannon’s Information index (I) for each locus ranged from 0.305 (FH_12) to 2.254 (FH_6), with an average of 1.390. This suggests that some loci have higher diversities than others. Observed heterozygosity (Ho) ranged from 0.182 to 1.000, with an overall mean of 0.653, while the values of expected heterozygosity (He) ranged from 0.165 to 0.899, with a grand mean of 0.665, indicating that there is variety in genetic diversity and population structure across the samples studied. The F-value ranged from −0.017 (FH_7) to 0.426 (FH_2) (Supplementary Table S2).
The within-population deficiency of heterozygosity as determined by Fis ranged between −0.025 (FH_7) and 0.088 (FH_2) with an average of 0.015 for all loci. Fst values varied from 0.064 (FH_5) to 0.107 (FH_2), with a mean of 0.076. The Nm value varied between 2.080 (FH_2) and 3.898 (FH_7) with an average of 3.173 in the whole population and across all loci (Table 2).
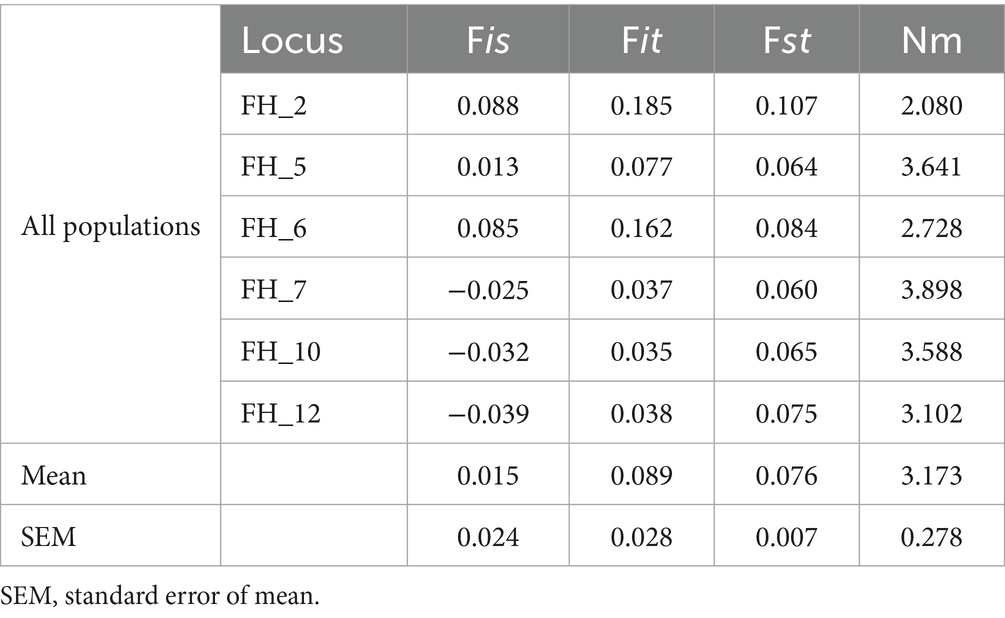
Table 2. F-statistics and estimates of migrants per generation (Nm) for each locus of populations of Fasciola hepatica from seven provinces of South Africa.
The mean number of alleles varied from 3.667 to 9.667 (Figure 1). The highest number of alleles (n = 10) was found in the Gauteng population, which is not surprising as this province constituted of the highest number of samples. This was followed by Mpumalanga (n = 9), Northern Cape (n = 7), Free State (n = 6), Eastern Cape (n = 6), KwaZulu-Natal (n = 5), and North West (n = 4) (Table 3). Of the total number of alleles, 3% were private alleles (7.500), and the Gauteng, Mpumalanga, and Northern Cape populations had the highest number of private alleles (n = 2), followed by Eastern Cape (n = 1), Free State (n = 1), KwaZulu-Natal (n = 0.333), and North West (n = 0.167). The I value, which is an expression of population diversity in a particular habitat, was high in the Mpumalanga population (1.697) and low in the North West (0.951) population. The He in the populations ranged from 0.514 (North West) to 0.743 (Mpumalanga) (Tables 3, 4). The high values for I and He in Mpumalanga suggest greater genetic diversity, which may complicate control strategies due to enhanced adaptability or the potential emergence of drug-resistant genotypes.
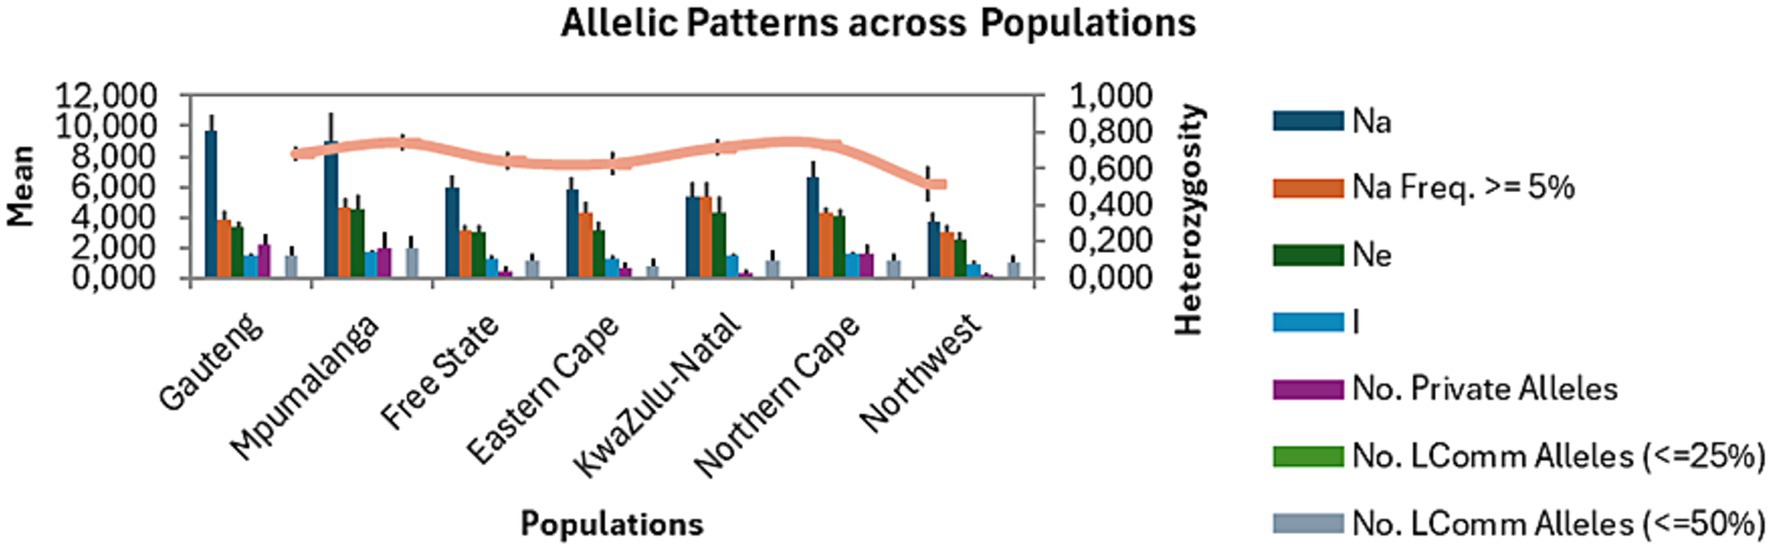
Figure 1. Allelic patterns of Fasciola hepatica populations from seven provinces of South Africa. Na, allele number; Na Freq. ≥ 5%, number of different alleles with a frequency ≥ 5%; Ne, effective number of alleles, I, Shannon’s Information index; LComm, Less Common.
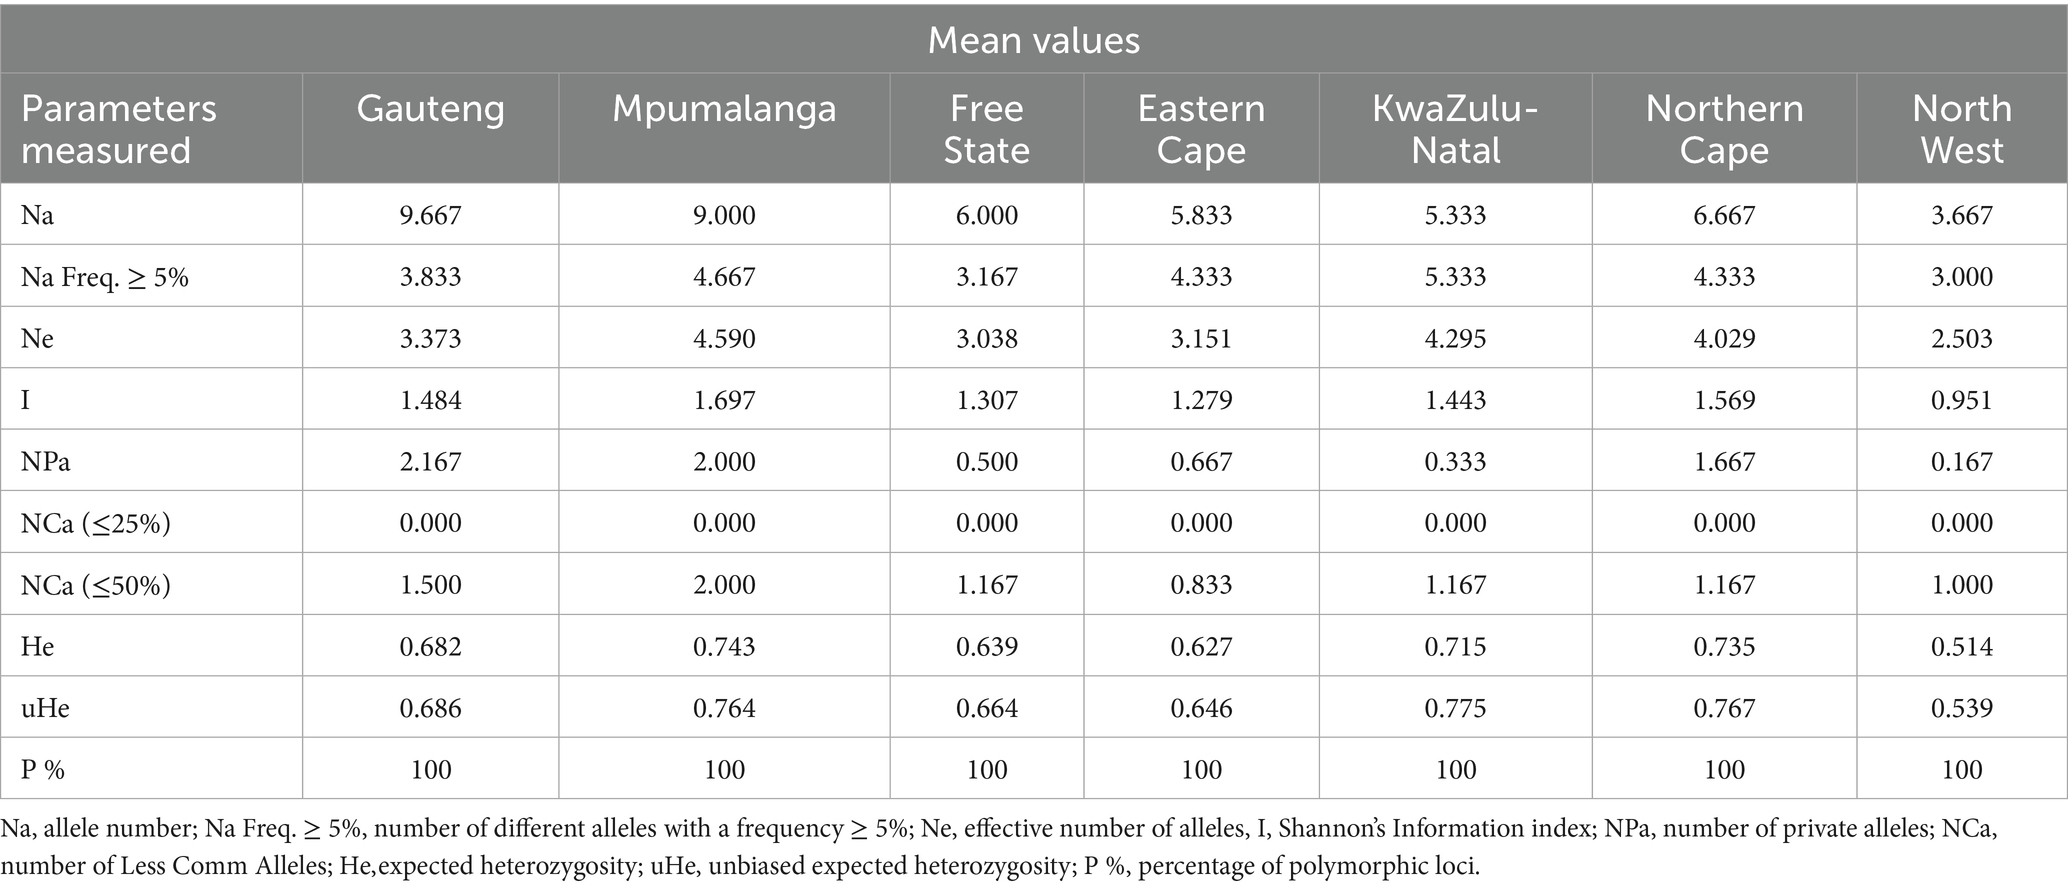
Table 3. Genetic diversity indices of Fasciola hepatica among populations from seven provinces of South Africa.
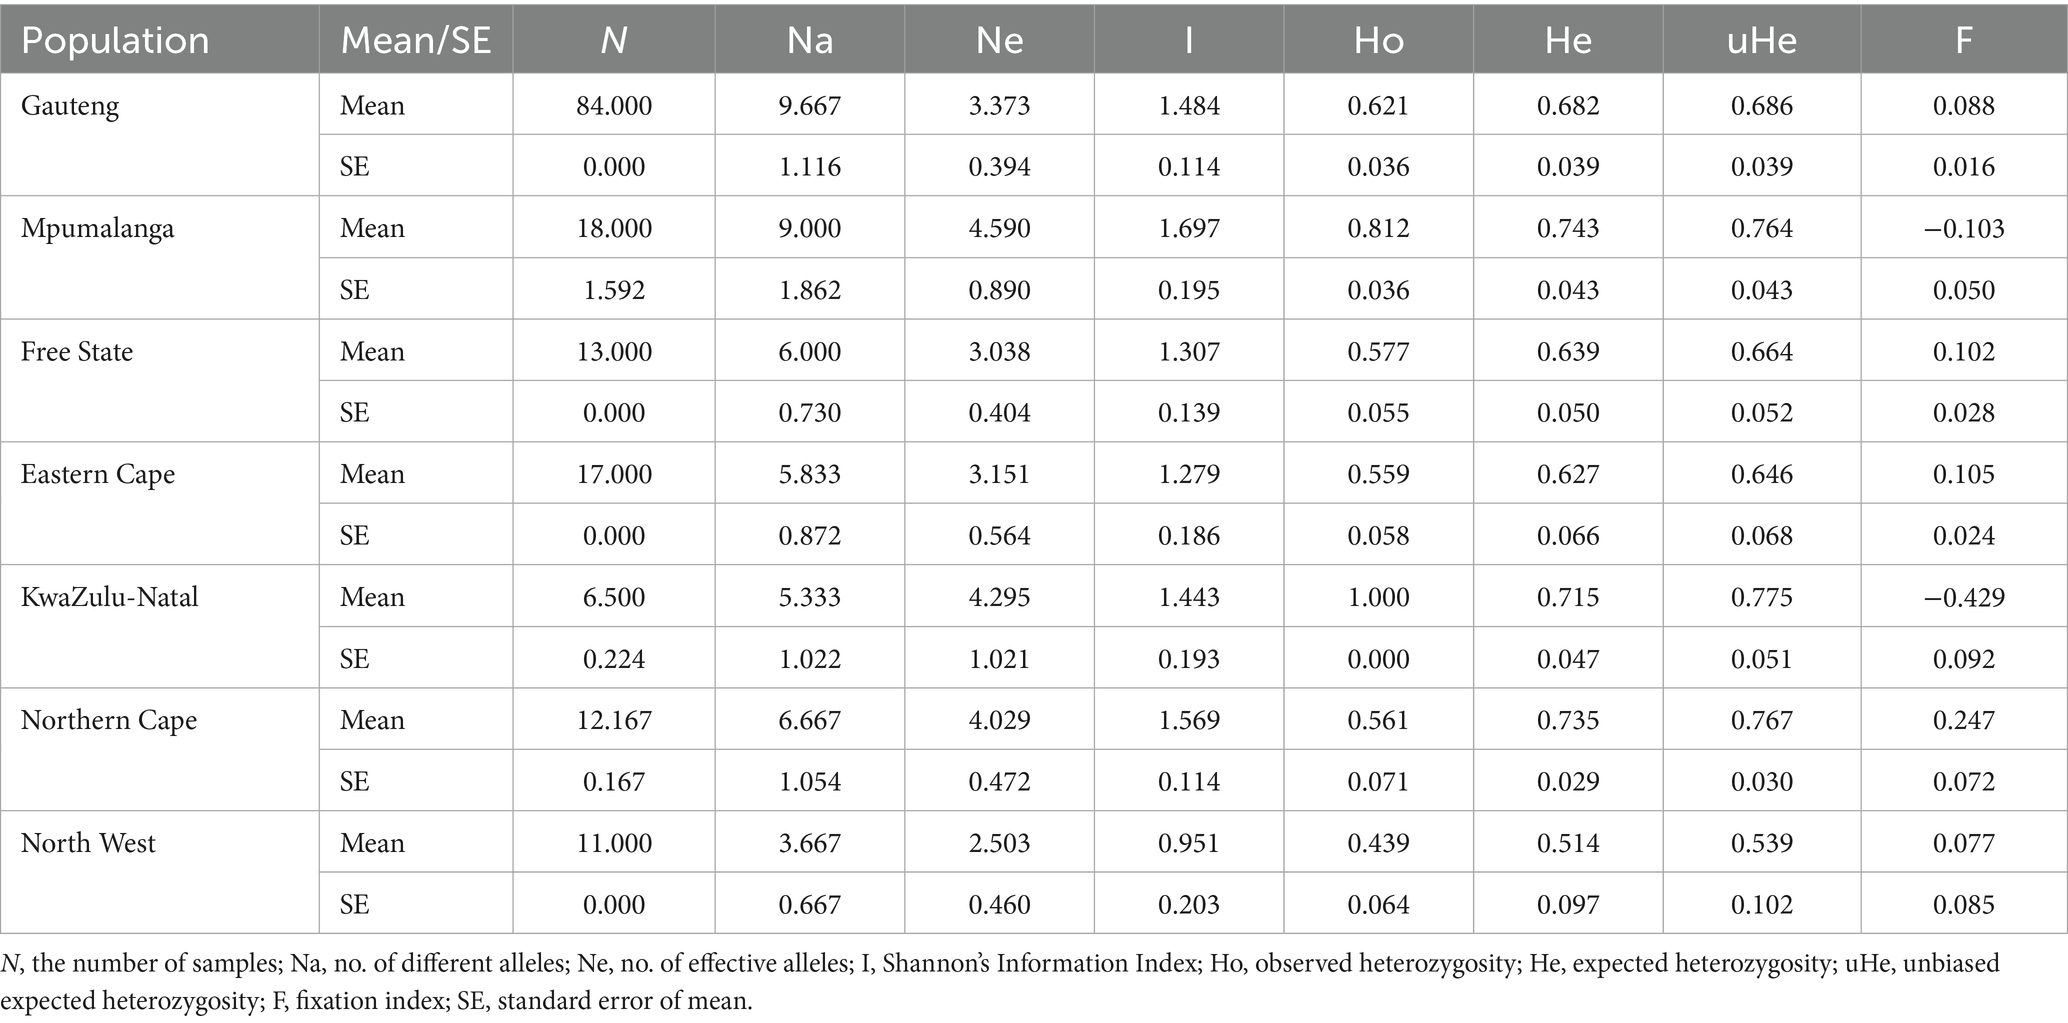
Table 4. Mean (±SE) of different genetic parameters in Fasciola hepatica populations from the seven sampled provinces of South Africa.
The Nei’s genetic distance as a pairwise population matrix was calculated based on allele frequencies. Genetic distances were generally lower between geographically proximate provinces (e.g., Free State and Eastern Cape: 0.061), while greater divergence was noted between more distant or isolated populations (e.g., Free State and North West: 0.360), reflecting potential barriers to gene flow (Table 5).
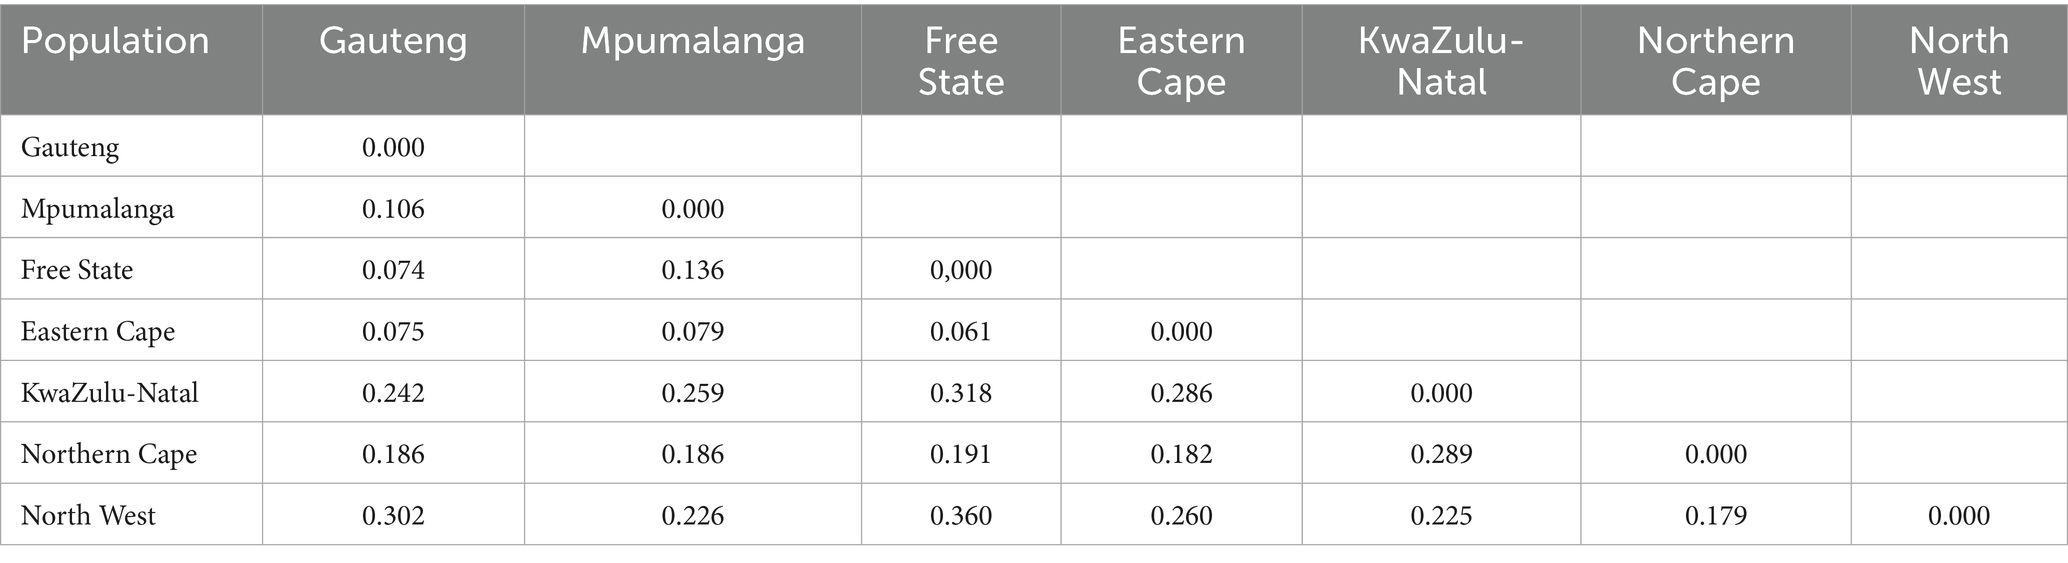
Table 5. Pairwise population matrix of Nei’s genetic distance among Fasciola hepatica from seven provinces of South Africa.
3.4 Population structure
In Gauteng province, the results suggested that the most probable number of population clusters is K = 4. This is the value of K at which the estimated Ln probability peaks (−1857.245; SD = 127.063) and elevates (Figure 2A). For the other six provinces, the results also indicated K = 4 as the most likely number of population clusters (n = 4). At this value, the mean estimated Ln probability peaked (−1669.125; SD = 2.660) and elevated (Figure 3A). The iterations with the highest estimated Ln probability were chosen, and bar plots of the population clusters were produced (Figures 2B, 3B). Principal coordinate analysis also showed evidence of population clustering where F. hepatica populations in Mpumalanga, KwaZulu-Natal, and Northern Cape provinces spread across the plot, indicating high within-population diversity, while populations in Gauteng, Free State, Eastern Cape, and North West provinces showed a dense cluster on the right, suggesting stronger genetic relatedness among individuals in these provinces (Figure 4). Population structuring of F. hepatica in the Gauteng province and across the other six provinces of South Africa was supported by STRUCTURE analysis.
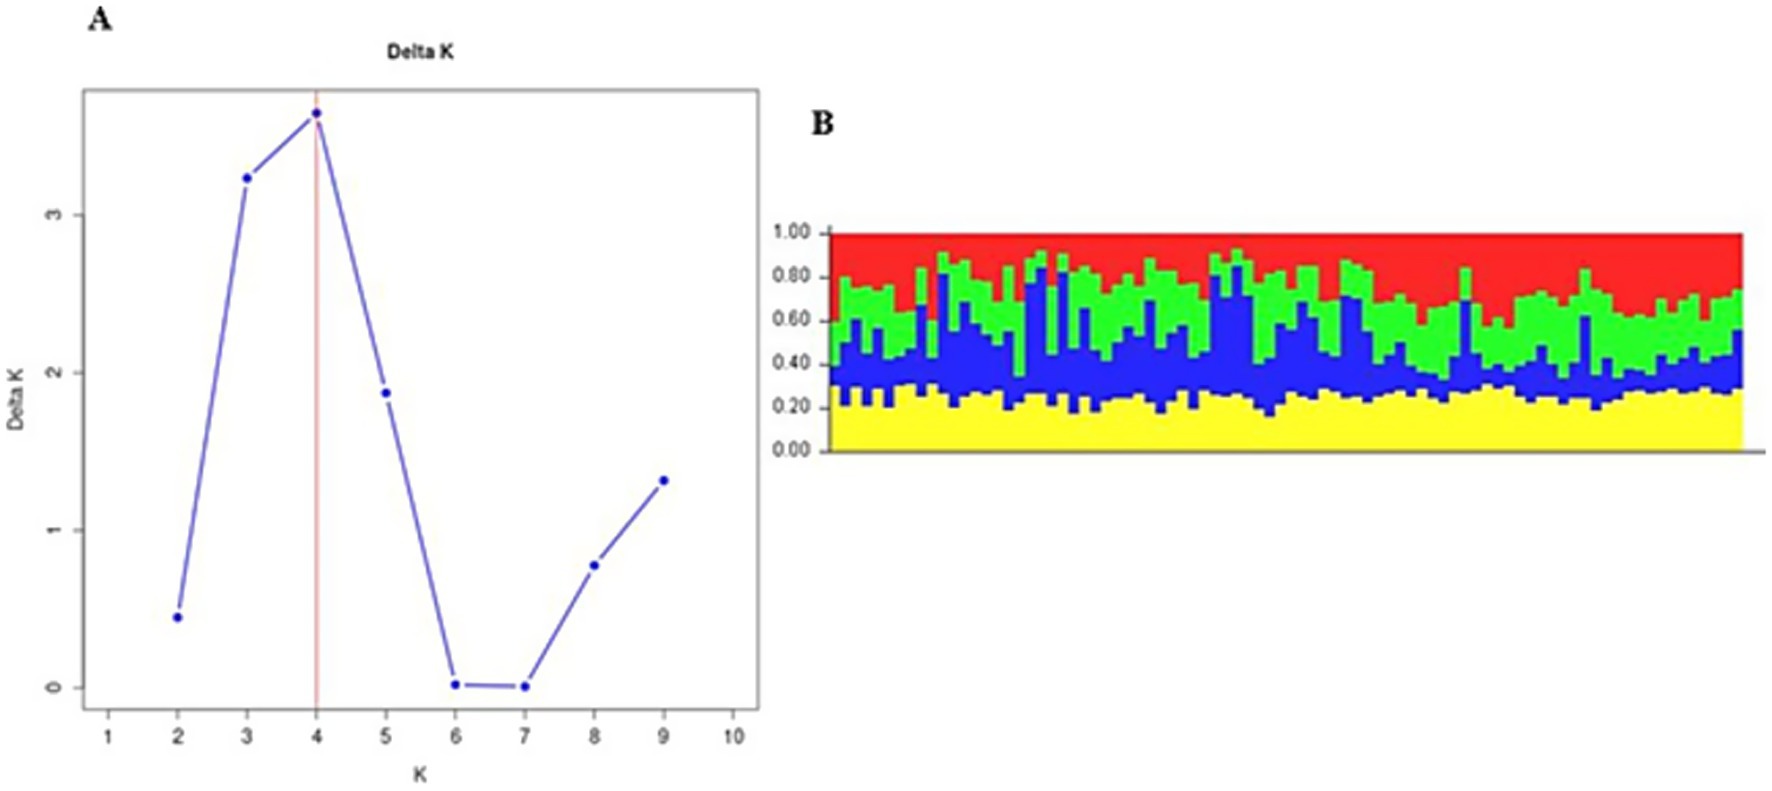
Figure 2. (A) Population structure analysis of Fasciola hepatica from the Gauteng province. (B) Bar plot from structure analysis.
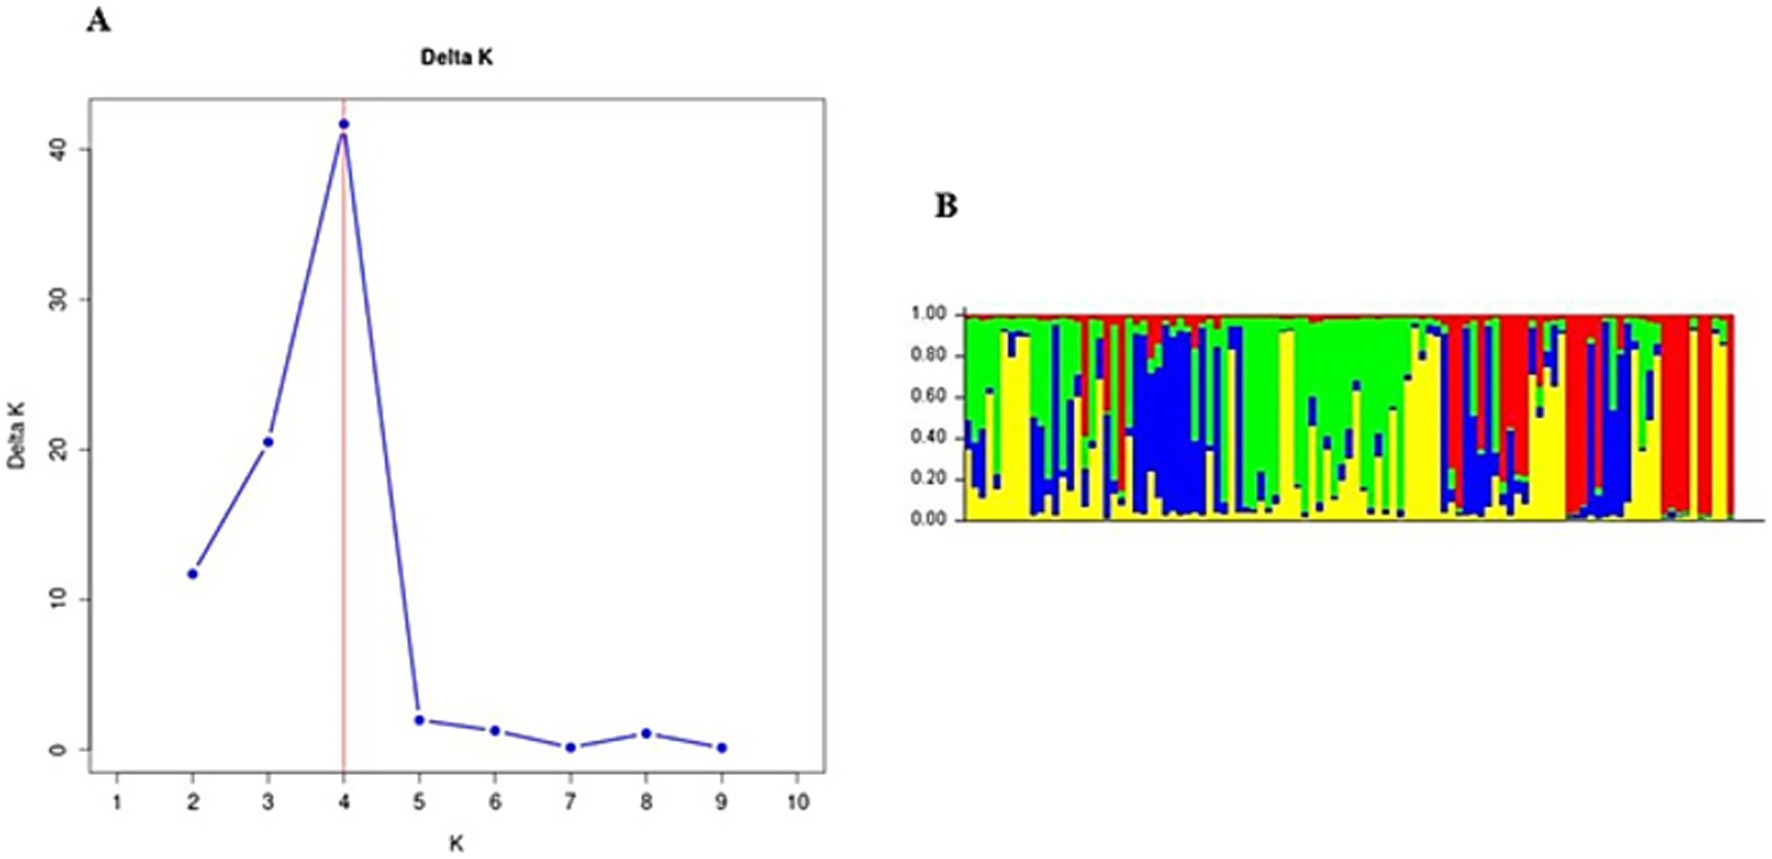
Figure 3. (A) Population structure analysis of Fasciola hepatica from the Mpumalanga, Free State, KwaZulu-Natal, Eastern Cape, Northern Cape, and North West provinces. (B) Bar plot from structure analysis.
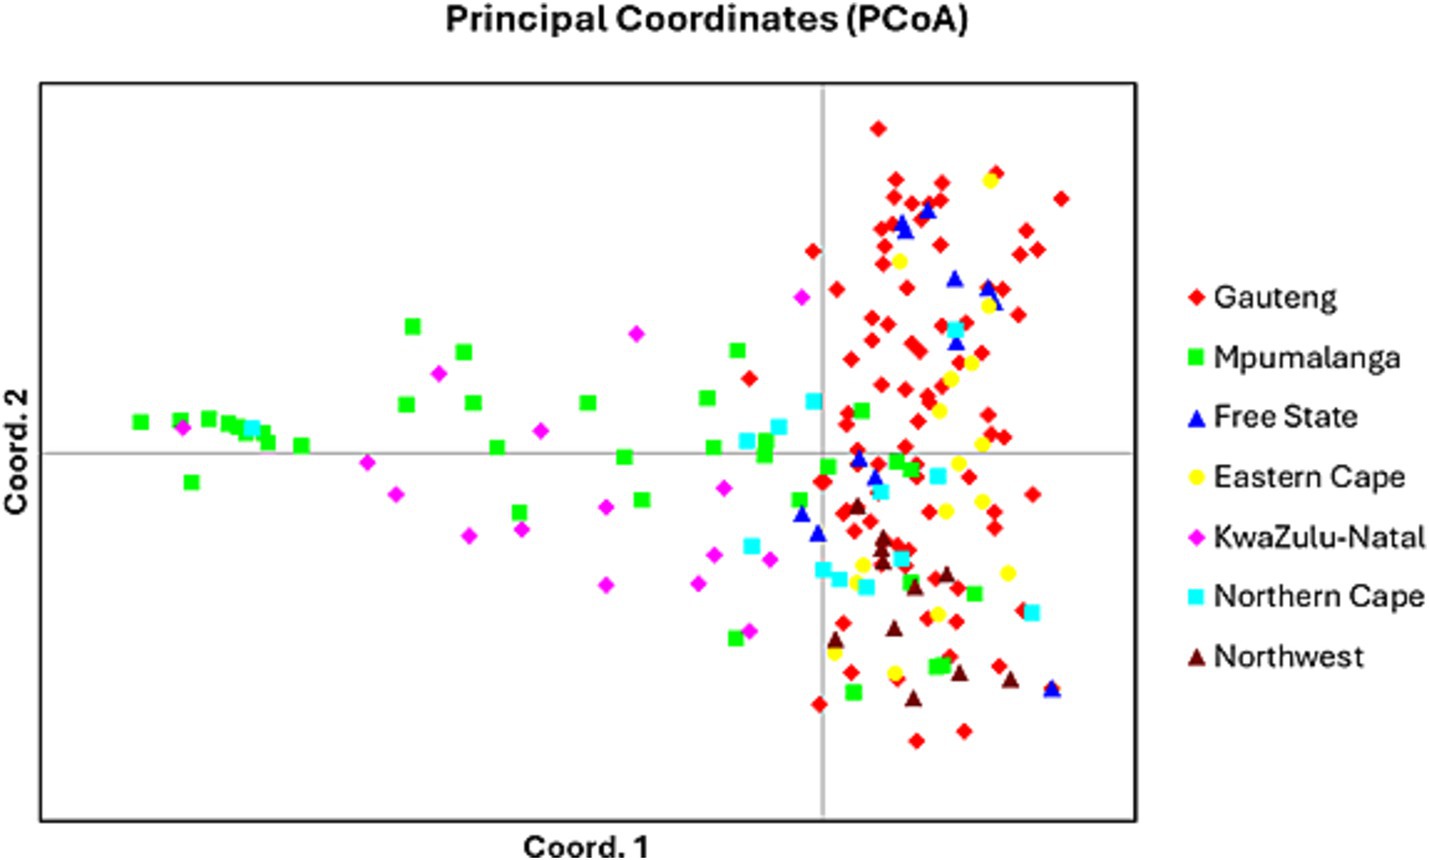
Figure 4. Principal coordinate analysis (PCoA) generated in GENALEX using Nei’s genetic distance matrix for all seven populations.
4 Discussion
Genetic diversity of a population can be reflected by various parameters, such as the effective number of alleles, Nei’s genetic distance, and I (44). High values of these parameters indicate the gene richness of the population (44). In this study, the average number of alleles from six pairs of polymorphic primers in seven F. hepatica populations was seven, which was higher than 1.330 and 4.900 that were reported by Robles-Pérez et al. (45) and Ohari et al. (46); however, it was lower than 15.330 as reported by Beesley et al. (47). The results further indicated variances between the Na at the microsatellite loci and the Ne. All populations showed values of Ne lower than Na, which implied uneven distribution of alleles within F. hepatica populations and that the populations have not reached the maximum variability, and this may be due to one of the alleles being more frequent than the other in the polymorphic loci (45).
At the population level, Mpumalanga, Gauteng, and Northern Cape populations showed the highest Na, Ne, and I, whereas these parameters were low in the Free State, Eastern Cape, KwaZulu-Natal, and North West provinces, which is typical of population bottlenecks occurring. Private alleles were recorded in the study populations, with Gauteng, Mpumalanga, and Northern Cape provinces recording the highest number of private alleles. The Free State, Eastern Cape, KwaZulu-Natal, and North West showed the lowest number of private alleles. The variation in the occurrence of private alleles may be as a result of differences in the agroecological climate of the provinces and the adaptation response of F. hepatica populations as alleles may be positively selected in one environment but remain neutral in others (48). This could be the case with the private alleles observed in Mpumalanga, which were higher than in the Northern Cape since the latter is mostly a desert. Previous studies conducted in desert climates have highlighted the low prevalence of fasciolosis (49) due to a lack of the preferred warm and wet conditions that are conducive for the survival and reproduction of the snail IHs (50).
While some private alleles may be functionally neutral, others could become relevant if linked to traits such as drug resistance or reproductive adaptation. This is essential in understanding the genetic diversity of Fasciola species since such alleles are recessive and might be associated with drug resistance genes, and the ability of F. hepatica to self-fertilize, which may contribute to an increased frequency of its occurrence (47). Therefore, the high numbers of private alleles observed in Mpumalanga and Gauteng suggest that these regions may serve as reservoirs of genetic diversity, potentially supporting long-term transmission of fasciolosis or harboring variants with altered susceptibility and hence affecting the effectiveness of control interventions. The North West province exhibited consistently low diversity data across all parameters. This province had one of the smallest sample sizes and is also underrepresented in studies on the occurrence of Fasciola (51). However, the presence of both snail IHs of Fasciola in this province (52) may also highlight the possible misrepresentation and underestimation of fasciolosis. Currently, there are no published reports from this province on the occurrence fasciolosis in cattle, specifically owned by smallholder farmers (51). The small sample sizes from some provinces, particularly the North West, may restrict the relevance of the diversity estimates. In addition, F. gigantica populations were not included due to unsuccessful microsatellite amplification, limiting comparative analysis and interpretation of the results.
Among the seven populations of F. hepatica included in our study, populations from Mpumalanga and KwaZulu-Natal provinces showed a negative F-value. This finding points to excess heterozygosity and low levels of inbreeding, as further evidenced by the Ho and uHe, both of which were higher than the He. In these two provinces, both F. hepatica and F. gigantica and the two snail IHs, P. columella and Galba truncatula, co-exist, and this scenario may play a role in the transmission and epidemiological dynamics of the Fasciola spp., resulting in selection pressure to favor genetic diversity over inbreeding (52).
A degree of inbreeding and population differentiation for F. hepatica in different provinces of South Africa was highlighted by the overall observed mean Fst value of 0.076, indicating moderate genetic differentiation. This suggests a moderate level of genetic structure, which was also observed in populations from Europe, and this was attributed to the isolation of populations by distance and the effect of different ecological factors across regions (47). Furthermore, such a genetic structure can be influenced by varying climates, snail IH extinction and recolonization, and livestock management practices (53). Other studies have also observed moderate differentiation in parasite populations with relatively high host mobility, such as trematodes and cestodes, where host movement supported gene flow; however, there was some regional differentiation, which may be due to environmental or host-specific factors (54, 55). Similarly, the provinces studied are characterized by various climatic conditions and agroecological zones (56), which might explain the observed genetic structures. Nonetheless, the low mean Fis value of 0.015 and slightly higher Fst value of 0.076 indicated minimal inbreeding within and among populations.
Nm values >1 suggest adequate migration to prevent genetic drift (57), and the mean Nm value of 3.173 from this study suggests high gene flow across populations. This could possibly have reduced genetic differentiation, thus supporting the moderate Fst observed. With F. hepatica, such gene flow may be facilitated by the movement of livestock or wildlife hosts between provinces (47), particularly in the commercial beef and dairy industry, where animals are sold and transported frequently. High gene flow can have substantial epidemiological implications, as it may aid the spread of advantageous alleles across populations, including those related to drug resistance or adaptation to local hosts (58). This has been reported in F. hepatica parasites, where gene flow among different regions supported the spread of drug resistance alleles (47).
Studies on F. hepatica in other parts of the world have reported variable levels of genetic structure, often influenced by ecological or anthropogenic factors such as host movement and environmental barriers. Studies in Europe and South America have reported that regions with intensive movement of livestock had lower Fst values and high Nm (59), as observed in this study. The abattoirs where the samples were collected also confirmed a high movement of livestock from various provinces for slaughter (60), which may also occur between farms for breeding or fattening cattle. This strongly suggests that host-controlled gene flow is one of the factors that influence genetic structure in F. hepatica, regardless of geographic location, although local conditions may change this effect. The lowest genetic distances were observed between geographically closer provinces, such as Mpumalanga and Gauteng (0.106), and Eastern Cape and KwaZulu-Natal (0.286), suggesting that gene flow between these neighboring provinces may assist in maintaining genetic similarity (61), facilitated by swift trade or movement of livestock between them. Conversely, higher genetic distances were observed between North West and other provinces, such as Free State (0.360) and Gauteng (0.302), indicating a significant genetic differentiation. This indicates that geographic or ecological barriers might limit gene flow between these provinces (62), leading to more distinct genetic profiles for F. hepatica populations in these areas. These findings align with the expected influence of geographic distance and potential barriers on genetic structure in parasite populations, where proximity often facilitates gene flow. However, some moderately high genetic distances between geographically closer regions, such as KwaZulu-Natal and Northern Cape (0.289), could also suggest regional adaptations or limited livestock movement between these provinces. The observed moderate-to-high genetic differentiation has implications for control strategies as it indicates that genetic traits, including those related to resistance, may spread unevenly across the country.
The population structuring of F. hepatica across the Gauteng province and other provinces in South Africa, as revealed by STRUCTURE analysis, indicates distinct genetic clusters. STRUCTURE identified K = 4 as the optimal number of clusters both in Gauteng and across six other provinces, indicated by the peak in the log probability of data (LnP) values and an associated increase in standard deviation (42). For Gauteng specifically, a peak at K = 4 (LnP = −1857.245, SD = 127.063) suggests a complex genetic structure, whereas similar clustering patterns emerged for the combined provinces at K = 4 with LnP = −1669.125, SD = 2.660. Principal coordinate analysis further validates this structure, with Mpumalanga and KwaZulu-Natal showing broader distribution across the coordinate plot, indicating higher genetic diversity within populations. In contrast, the population from Gauteng province appears as a dense cluster, implying closer genetic relatedness among individuals (63, 64). This clustering may reflect ecological or historical factors affecting gene flow in the Gauteng province.
5 Conclusion
The population genetic analyses of F. hepatica from South Africa have demonstrated variability in allele frequency, heterozygosity, and genetic differentiation across provinces. The detection of different alleles per locus indicated a high level of polymorphism. This variability was further supported by the number of Ne that varied from the total number of alleles, and the mean I value that was greater than 1.000, highlighting significant allelic diversity across loci. The overall similarity between Ho and He values, along with low Fis values, suggests a balanced genetic variation within populations with limited inbreeding. There was moderate genetic differentiation among populations, with a sufficient level of genetic exchange across populations. The variation in the Na and private alleles by province, particularly the high numbers in Gauteng and Mpumalanga, suggests that these areas may act as reservoirs of genetic diversity of F. hepatica infections in cattle in South Africa. Nei’s genetic distances showed that provinces such as Free State and Eastern Cape have closely related populations, whereas North West and Northern Cape populations exhibit higher levels of genetic divergence. The high genetic distances between F. hepatica populations of KwaZulu-Natal, Northern Cape, and North West and those of other provinces indicate distinct genetic structuring within these provinces. While this study provides important insights into the genetic structure of Fasciola hepatica populations in South Africa, several limitations should be acknowledged. The uneven sample distribution across provinces, with overrepresentation from Gauteng, may have influenced estimates of genetic diversity and differentiation. Samples from Limpopo were excluded due to the predominance of F. gigantica and suspected hybrid forms, thereby limiting the geographic and species-level scope of the analysis. The use of only six microsatellite markers, although informative, may have limited the resolution of population structure. Future studies should aim for more balanced and longitudinal sampling across provinces and expand the panel of genetic markers to better understand the evolutionary and epidemiological dynamics of Fasciola spp. in South Africa.
Data availability statement
The original contributions presented in the study are included in the article/Supplementary material, further inquiries can be directed to the corresponding author.
Ethics statement
The animal study was approved by the University of KwaZulu-Natal Ethics Committee, South African National Biodiversity Institute National Zoological Gardens Animal Research Ethics and Scientific Committee and the Department of Agriculture, Land Reform and Rural Development. The study was conducted in accordance with the local legislation and institutional requirements.
Author contributions
SN: Conceptualization, Data curation, Formal analysis, Investigation, Methodology, Software, Writing – original draft. MM: Conceptualization, Investigation, Methodology, Project administration, Supervision, Writing – review & editing. CM: Data curation, Formal analysis, Investigation, Software, Writing – review & editing. MC: Data curation, Formal analysis, Investigation, Methodology, Resources, Supervision, Writing – review & editing. SM: Conceptualization, Funding acquisition, Project administration, Resources, Supervision, Validation, Writing – review & editing.
Funding
The author(s) declare that financial support was received for the research and/or publication of this article. This research was conceptualized and supported by UKZN research productivity funds provided by SM. SN received the National Research Foundation (NRF) of South Africa bursary, grant no. MND200710542559. The authors acknowledge the NRF Professional Development Programme (PDP) for Postdoctoral fellowship research funds allocated to MM at SANBI.
Acknowledgments
The authors would like to thank the following individuals: the provincial state veterinarians, the veterinary public health department, and the animal health technicians for collaborating with the abattoir managers on our behalf, the abattoir managers and meat inspectors for allowing us to sample in their abattoirs, and Khomotso Modiba (South African National Biodiversity Institute) and Nozipho Khumalo (South African National Biodiversity Institute) for helping with sample collection. The authors express their utmost gratitude to the South African National Biodiversity Institute (SANBI) for providing technical/resources to process the samples.
Conflict of interest
The authors declare that the research was conducted in the absence of any commercial or financial relationships that could be construed as a potential conflict of interest.
Generative AI statement
The authors declare that no Gen AI was used in the creation of this manuscript.
Any alternative text (alt text) provided alongside figures in this article has been generated by Frontiers with the support of artificial intelligence and reasonable efforts have been made to ensure accuracy, including review by the authors wherever possible. If you identify any issues, please contact us.
Publisher’s note
All claims expressed in this article are solely those of the authors and do not necessarily represent those of their affiliated organizations, or those of the publisher, the editors and the reviewers. Any product that may be evaluated in this article, or claim that may be made by its manufacturer, is not guaranteed or endorsed by the publisher.
Supplementary material
The Supplementary material for this article can be found online at: https://www.frontiersin.org/articles/10.3389/fvets.2025.1659523/full#supplementary-material
References
1. Tolan, RW. Fascioliasis due to Fasciola hepatica and Fasciola gigantica infection: an update on this “neglected” neglected tropical disease. Lab Med. (2011) 42:107–16. doi: 10.1309/LMLFBB8PW4SA0YJI
2. Admassu, B, Shite, A, and Kinfe, G. A review on bovine fasciolosis. Eur J Biol Sci. (2015) 7:139–46.
3. Alemu, B. Bovine fasciolosis in Ethiopia-a review. J Adv Vet Anim Res. (2019) 2:202. doi: 10.24966/DRT-9315/100010
4. Robinson, MW, and Dalton, JP. Zoonotic helminth infections with particular emphasis on fasciolosis and other trematodiases. Philos Trans R Soc Lond Ser B Biol Sci. (2009) 364:2763–76. doi: 10.1098/rstb.2009.0089
5. Mas-Coma, S, Bargues, MD, and Valero, MA. Fascioliasis and other plant-borne trematode zoonoses. Int J Parasitol. (2005) 35:1255–78. doi: 10.1016/j.ijpara.2005.07.010
6. Brown, DS. Freshwater snails of Africa and their medical importance. 2nd ed. United Kingdom: Taylor & Francis Ltd. (1994).
7. Amer, S, Dar, Y, Ichikawa, M, Fukuda, Y, Tada, C, Itagaki, T, et al. Identification of Fasciola species isolated from Egypt based on sequence analysis of genomic (ITS1 and ITS2) and mitochondrial (NDI and COI) gene markers. Parasitol Int. (2011) 60:5–12. doi: 10.1016/j.parint.2010.09.003
8. Amer, S, ElKhatam, A, Zidan, S, Feng, Y, and Xiao, L. Identity of Fasciola spp. in sheep in Egypt. Parasit Vectors. (2016) 9:1–8. doi: 10.1186/s13071-016-1898-2
9. Giovanoli Evack, J, Schmidt, RS, Boltryk, SD, Voss, TS, Batil, AA, Ngandolo, BN, et al. Molecular confirmation of a Fasciola gigantica × Fasciola hepatica hybrid in a Chadian bovine. J Parasitol Res. (2020) 106:316–22. doi: 10.1645/19-66
10. Khalifa, R, El-Hady, HA, Omran, EK, and Ahmed, NS. Genetically confirmed Fasciola hepatogigantica n. sp. J Egypt Soc Parasitol. (2013) 43:23–32. doi: 10.12816/0006364
11. Omar, MA, Elmajdoub, LO, Ali, AO, Ibrahim, DA, Sorour, SS, Al-Wabel, MA, et al. Genetic characterization and phylogenetic analysis of Fasciola species based on ITS2 gene sequence, with first molecular evidence of intermediate Fasciola from water buffaloes in Aswan. Egypt Ann Parasitol. (2021) 67:55–65. doi: 10.17420/ap6701.312
12. Periago, MV, Valero, MA, El Sayed, M, Ashrafi, K, El Wakeel, A, Mohamed, MY, et al. First phenotypic description of Fasciola hepatica/Fasciola gigantica intermediate forms from the human endemic area of the Nile Delta, Egypt. Infect Genet Evol. (2008) 8:51–8. doi: 10.1016/j.meegid.2007.10.001
13. Sotohy, AS, Abdallah, AH, Wafaa, GM, and Abeer, AK. Prevalence and histopathological changes of bovine fascioliasis, with unusual migration to lung in New-Valley governorate. Assiut Vet Med J. (2019) 65:43–9. doi: 10.21608/avmj.2019.168743
14. Taha, HA. Molecular characterization of Fasciola spp. in Egypt on the basis of certain rDNA fragments and highly repetitive DNA sequences. Egypt Acad J Biol Sci Med Entomol Parasitol. (2014) 6:19–28. doi: 10.21608/eajbse.2014.14500
15. Ichikawa-Seki, M, Tokashiki, M, Opara, MN, Iroh, G, Hayashi, K, Kumar, UM, et al. Molecular characterization and phylogenetic analysis of Fasciola gigantica from Nigeria. Parasitol Int. (2017) 66:893–7. doi: 10.1016/j.parint.2016.10.010
16. Mohanta, UK, Ichikawa-Seki, M, Shoriki, T, Katakura, K, and Itagaki, T. Characteristics and molecular phylogeny of Fasciola flukes from Bangladesh, determined based on spermatogenesis and nuclear and mitochondrial DNA analyses. Parasitol Res. (2014) 113:2493–501. doi: 10.1007/s00436-014-3898-5
17. Nguyen, S, Amer, S, Ichikawa, M, Itagaki, T, Fukuda, Y, and Nakai, Y. Molecular identification of Fasciola spp. (Digenea: Platyhelminthes) in cattle from Vietnam. Parasite. (2012) 19:85–9. doi: 10.1051/parasite/2012191085
18. Ohari, Y, Sato, H, Nonaka, N, Mohanta, U, Hayashi, K, and Itagaki, T. Genetic characterization of Fasciola flukes detected from wild sika deer in Hokkaido, Yamaguchi and Miyazaki prefectures, Japan. Jpn J Vet Parasitol. (2016) 15:80–3.
19. Shoriki, T, Ichikawa-Seki, M, Devkota, B, Rana, HB, Devkota, SP, Humagain, SK, et al. Molecular phylogenetic identification of Fasciola flukes in Nepal. Parasitol Int. (2014) 63:758–62. doi: 10.1016/j.parint.2014.07.001
20. Vilas, R, Vázquez-Prieto, S, and Paniagua, E. Contrasting patterns of population genetic structure of Fasciola hepatica from cattle and sheep: implications for the evolution of anthelmintic resistance. Infect Genet Evol. (2012) 12:45–52. doi: 10.1016/j.meegid.2011.10.010
21. Churcher, TS, Schwab, AE, Prichard, RK, and Basáñez, MG. An analysis of genetic diversity and inbreeding in Wuchereria bancfrofti: implications for the spread and detection of drug resistance. PLoS Negl Trop Dis. (2008) 2:e211. doi: 10.1371/journal.pntd.0000211
22. Criscione, CD, Anderson, JD, Sudimack, D, Subedi, J, Upadhayay, RP, Jha, B, et al. Landscape genetics reveals focal transmission of a human macroparasite. PLoS Negl Trop Dis. (2010) 4:e665. doi: 10.1371/journal.pntd.0000665
23. Silvestre, A, Sauve, C, Cortet, J, and Cabaret, J. Contrasting genetic structures of two parasitic nematodes, determined on the basis of neutral microsatellite markers and selected anthelmintic resistance markers. Mol Ecol. (2009) 18:5086–100. doi: 10.1111/j.1365-294x.2009.04421.x
24. Kyrgiafini, MA, and Mamuris, Z. Feature papers in population and evolutionary genetics and genomics 2023: unraveling population dynamics, diversity, and evolutionary paths. Genes. (2024) 15:446. doi: 10.3390/genes15040446
25. Haridwal, S, Malatji, MP, and Mukaratirwa, S. Morphological and molecular characterization of Fasciola hepatica and Fasciola gigantica phenotypes from co-endemic localities in Mpumalanga and KwaZulu-Natal provinces of South Africa. Food Waterborne Parasitol. (2021) 22:e00114. doi: 10.1016/j.fawpar.2021.e00114
26. Mucheka, VT, Lamb, JM, Pfukenyi, DM, and Mukaratirwa, S. DNA sequence analyses reveal co-occurrence of novel haplotypes of Fasciola gigantica with F. hepatica in South Africa and Zimbabwe. Vet Parasitol. (2015) 214:144–51. doi: 10.1016/j.vetpar.2015.09.024
30. Black, J, Ntusi, N, Stead, P, Mayosi, B, and Mendelson, M. Human fascioliasis in South Africa. S Afr Med J. (2013) 103:658–9. doi: 10.7196/samj.7184
31. Fairweather, I. Triclabendazole progress report, 2005–2009: an advancement of learning. J Helminthol. (2009) 83:139–50. doi: 10.1017/s0022149x09321173
32. Moll, L, Gaasenbeek, CPH, Vellema, P, and Borgsteede, FHM. Resistance of Fasciola hepatica against triclabendazole in cattle and sheep in the the Netherlands. Vet Parasitol. (2000) 91:153–8. doi: 10.1016/S0304-4017(00)00267-3
33. Mooney, L, Good, B, Hanrahan, JP, Mulcahy, G, and de Waal, T. The comparative efficacy of four anthelmintics against a natural acquired Fasciola hepatica infection in hill sheep flock in the west of Ireland. Vet Parasitol. (2009) 164:201–5. doi: 10.1016/j.vetpar.2009.05.017
34. Malatji, MP, Lamb, J, and Mukaratirwa, S. Molecular characterization of liver fluke intermediate host lymnaeids (Gastropoda: Pulmonata) snails from selected regions of Okavango Delta of Botswana, KwaZulu-Natal and Mpumalanga provinces of South Africa. Vet Parasitol Reg Stud Reports. (2019) 17:100318. doi: 10.1016/j.vprsr.2019.100318
35. Malatji, M, and Mukaratirwa, S. Molecular detection of natural infection of Lymnaea (Pseudosuccinea) columella (gastropoda: Lymnaeidae) with Fasciola gigantica (digenea: Fasciolidae) from two provinces of South Africa. J Helminthol. (2020) 94:e38. doi: 10.1017/S0022149X19000129
36. Molaba, GG, Molefe-Nyembe, NI, Taioe, OM, Mofokeng, LS, Thekisoe, OMM, and Mtshali, K. Molecular detection of Fasciola, Schistosoma and Paramphistomum species from freshwater snails occurring in Gauteng and Free State provinces, South Africa. Vet Parasitol. (2023) 32:1–11. doi: 10.1016/j.vetpar.2023.109978
37. Galtier, N, Nabholz, B, Glémin, S, and Hurst, GDD. Mitochondrial DNA as a marker of molecular diversity: a reappraisal. Mol Ecol. (2009) 18:4541–50. doi: 10.1111/j.1365-294x.2009.04380.x
38. Shoriki, T, Ichikawa-Seki, M, Suganuma, K, Naito, I, Hayashi, K, Nakao, M, et al. Novel methods for the molecular discrimination of Fasciola spp. on the basis of nuclear protein-coding genes. Parasitol Int. (2016) 65:180–3. doi: 10.1016/j.parint.2015.12.002
39. Cwiklinski, K, Allen, K, LaCourse, J, Williams, DJ, Paterson, S, and Hodgkinson, JE. Characterisation of a novel panel of polymorphic microsatellite loci for the liver fluke, Fasciola hepatica, using a next generation sequencing approach. Infect Genet Evol. (2015) 32:298–304. doi: 10.1016/j.meegid.2015.03.014
40. Peakall, R, and Smouse, PE. GenAlEx 6: genetic analysis in excel. population genetic software for teaching and research. Mol Ecol Notes. (2006) 6:288–95. doi: 10.1111/j.1471-8286.2005.01155.x
41. Pritchard, JK, Stephens, M, and Donnelly, P. Inference of population structure using multilocus genotype data. Genetics. (2000) 155:945–59. doi: 10.1093/genetics/155.2.945
42. Evanno, G, Regnaut, S, and Goudet, J. Detecting the number of clusters of individuals using the software STRUCTURE: a simulation study. Mol Ecol. (2005) 14:2611–20. doi: 10.1111/j.1365-294x.2005.02553.x
43. Li, YL, and Liu, JX. StructureSelector: a web-based software to select and visualize the optimal number of clusters using multiple methods. Mol Ecol Resour. (2018) 18:176–7. doi: 10.1111/1755-0998.12719
44. Lu, X, Luan, S, Kong, J, Hu, L, Mao, Y, and Zhong, S. Genome-wide mining, characterization, and development of microsatellite markers in Marsupenaeus japonicus by genome survey sequencing. Chin J Oceanol Limnol. (2017) 35:203–14. doi: 10.1007/s00343-016-5250-7
45. Robles-Pérez, D, García-García, P, Martínez-Pérez, JM, Rojo-Vázquez, FA, and Martínez-Valladares, M. Analysis of genetic variability of Fasciola hepatica populations from different geographical locations by ISSR-PCR. Parasitology. (2015) 142:527–33. doi: 10.1017/s003118201400153x
46. Ohari, Y, Matsuo, K, Yoshida, A, Nonaka, N, Sato, H, and Itagaki, T. Genetic diversity and population structure analyses based on microsatellite DNA of parthenogenetic Fasciola flukes obtained from cattle and sika deer in Japan. Parasitol Res. (2021) 120:1341–50. doi: 10.1007/s00436-021-07061-7
47. Beesley, NJ, Williams, DJL, Paterson, S, and Hodgkinson, J. Fasciola hepatica demonstrates high levels of genetic diversity, a lack of population structure and high gene flow: possible implications for drug resistance. Int J Parasitol. (2017) 47:11–20. doi: 10.1016/j.ijpara.2016.09.007
48. Anderson, JT, Lee, C-R, Rushworth, CA, Colautti, RI, and Mitchell-Olds, T. Genetic tradeoff and conditional neutrality contribute to local adaptation. Mol Ecol. (2013) 22:699–708. doi: 10.1111/j.1365-294x.2012.05522.x
49. Munguía-Xóchihua, JA, Ibarra-Velarde, F, Ducoing-Watty, A, Montenegro-Cristino, N, and Quiroz-Romero, H. Prevalence of Fasciola hepatica (ELISA and fecal analysis) in ruminants from a semi-desert area in the north west of Mexico. Parasitol Res. (2007) 101:127–30. doi: 10.1007/s00436-006-0438-y
50. Ndlovu, T, Chimonyo, M, and Muchenje, V. Monthly changes in body condition scores and internal parasite prevalence in Nguni, Bonsmara and Angus steers raised on sweetveld. Trop Anim Health Prod. (2009) 41:1169–77. doi: 10.1007/s11250-008-9297-0
51. Olaogun, SC, Byaruhanga, C, Ochai, SO, Fosgate, GT, and Marufu, MC. Comparison of three diagnostic methods to detect the occurrence of Fasciola species in communally grazed cattle in the north West Province, South Africa. Pathogens. (2022) 11:1398. doi: 10.3390/pathogens11121398
52. Nyagura, I, Malatji, MP, and Mukaratirwa, S. Occurrence of Fasciola (Digenea: Fasciolidae) species in livestock, wildlife and humans, and the geographical distribution of their intermediate hosts in South Africa-a scoping review. Front Vet Sci. (2022) 9:935428. doi: 10.3389/fvets.2022.935428
53. Beesley, NJ, Caminade, C, Charlier, J, Flynn, RJ, Hodgkinson, JE, Martinez-Moreno, A, et al. Fasciola and fasciolosis in ruminants in Europe: identifying research needs. Transbound Emerg Dis. (2017) 64:644–58. doi: 10.1111/tbed.12682
54. Criscione, CD, and Blouin, MS. Effective sizes of macroparasite populations: a conceptual model. Trends Parasitol. (2005) 21:212–7. doi: 10.1016/j.pt.2005.03.002
55. Hawkins, TR, Crellen, T, Mera, R, Allan, F, Dunn, JC, Li, Y, et al. Genomic population structure and diversity of Schistosoma japonicum. PLoS Negl Trop Dis. (2018) 12:e0006557
56. Mokgehle, S, Araya, N, Mofokeng, M, Makgato, M, Amoo, S, Maboka, K, et al. Regrowth response and nutritional composition of Moringa oleifera to cutting back in three agro-ecological zones in South Africa. Horticulturae. (2022) 8:963. doi: 10.3390/horticulturae8100963
57. Wang, J. Application of the one-migrant-per-generation rule to conservation and management. Conserv Biol. (2004) 18:332–43. doi: 10.1111/j.1523-1739.2004.00440.x
58. Morjan, CL, and Rieseberg, LH. How species evolve collectively: implications of gene flow and selection for the spread of advantageous alleles. Mol Ecol. (2004) 13:1341–56. doi: 10.1111/j.1365-294x.2004.02164.x
59. Walker, S, Johnston, C, Hoey, E, Fairweather, I, Borgsteede, FHM, Gaasenbeek, CPH, et al. Population dynamics of the liver fluke, Fasciola hepatica: the effect of time and spatial separation on the genetic diversity of fluke populations in the Netherlands. Parasitol. (2011) 138:15–23. doi: 10.1017/S0031182010001149
60. Nukeri, S, Malatji, MP, Sithole, MI, Ngcamphalala, PI, Nyagura, I, Tembe, D, et al. Infection rates of Fasciola spp. in cattle slaughtered at 13 abattoirs in six of nine provinces of South Africa. Food Waterborne Parasitol. (2025) 39:1–8. doi: 10.1016/j.fawpar.2025.e00260
61. Supratim, C. Fundamentals of molecular evolution In: C Supratim, editor. Bioinformatics for beginners. London: Academic Press (2014). 27–53.
62. Hartl, DL, and Clark, AG. Principles of population genetics. 3rd ed. Sunderland: Sinauer Associates (1997).
63. Jombart, T, Devillard, S, and Balloux, F. Discriminant analysis of principal components: a new method for the analysis of genetically structured populations. BMC Genet. (2010) 11:94. doi: 10.1186/1471-2156-11-94
Keywords: genetic diversity, population structuring, cattle, Fasciola hepatica , microsatellites, South Africa
Citation: Nukeri S, Malatji MP, Mnisi CM, Chaisi M and Mukaratirwa S (2025) Pilot study on the population genetics structure of Fasciola hepatica from seven provinces of South Africa. Front. Vet. Sci. 12:1659523. doi: 10.3389/fvets.2025.1659523
Edited by:
Edgar Simulundu, University of Zambia, ZambiaReviewed by:
Mourad Ben Said, University of Manouba, TunisiaElisha Chatanga, Lilongwe University of Agriculture and Natural Resources, Malawi
Copyright © 2025 Nukeri, Malatji, Mnisi, Chaisi and Mukaratirwa. This is an open-access article distributed under the terms of the Creative Commons Attribution License (CC BY). The use, distribution or reproduction in other forums is permitted, provided the original author(s) and the copyright owner(s) are credited and that the original publication in this journal is cited, in accordance with accepted academic practice. No use, distribution or reproduction is permitted which does not comply with these terms.
*Correspondence: Sophy Nukeri, c29waHludWtlcmlAZ21haWwuY29t