 Jun-Nan Chen1
 Yi-Fan Chen1
 Han Guo1
 Er-Ying Hao1Lei Shi1Hui Chen1Xiang-Yu Chen2Ya-Peng Ma3De-He Wang1*Li-Jun Xu2*
- 1College of Animal Science and Technology, Hebei Agricultural University, Baoding, China
- 2Baoding City Animal Husbandry Work Station, Baoding, China
- 3Hongwei Agricultural Technology Co., Ltd., Baoding, China
Introduction: Bitter almond, as a natural plant-derived additive, possesses the potential to enhance antioxidant and immune functions. Furthermore, its rapid metabolism in vivo leads to low residual levels. However, its effects on laying hens’ production performance and health remain unclear.
Methods: A total of 180 healthy 43-week-old Rongde black-feathered small-sized layer strain (RBSL) with similar production performance were selected and randomly divided into four groups (with five replicates per group). These groups were fed diets containing 0 (control group, CON), 0.25 (low-dose group, LBA), 0.5 (medium-dose group, MBA), and 0.75 (high-dose group, HBA) g/kg of bitter almond, respectively, for an 8-week experiment period.
Results: The results showed that in terms of production performance. The MBA group exhibited a significantly higher laying rate, daily feed intake, and Haugh unit than the CON group (p < 0.05). The HBA group also showed greater Haugh unit and yolk color versus controls (p < 0.05). In terms of antioxidant and immune functions, the T-AOC, GSH-Px, and IgA levels in the MBA and HBA groups were significantly higher than those in the CON group (p < 0.05), while the IgM level was significantly increased only in the HBA group (p < 0.05). In terms of intestinal morphology, LBA, MBA, and HBA groups all significantly improved the intestinal morphology of RBSL, with the MBA group showing the most pronounced improvement (p < 0.05). Additionally, metabolomics analysis revealed that bitter almond powder altered plasma metabolite profiles. KEGG enrichment analysis indicated that these alterations affected pathways including ABC transporters and tumor choline metabolism (p < 0.05). Meanwhile, microbiome analysis showed that bitter almond powder modified the cecal microbial community structure, notably resulting in a significant decrease in the abundance of the genus Negativibacillus in the HBA group. Furthermore, the abundance of Negativibacillus was significantly positively correlated with levels of IgA, IgM, and GSH-Px (p < 0.05).
Discussion: In conclusion, bitter almond supplementation improves egg production, along with antioxidant and immune status, as well as intestinal microbiota. Considering comprehensive benefits and safety, 0.5 g/kg is the optimal addition dosage, which can improve production performance without showing potential toxicity risks.
1 Introduction
Since the 1940s, antibiotics have been added to livestock and poultry feed in Europe and the United States, with up to 80% of antibiotics in the US being used in animal production (1). However, macrolide antibiotics such as tilmicosin exhibit concentrations exceeding 2000 ng/kg in poultry pectoral muscles, livers, and kidneys on the first day, requiring approximately 30 days for complete metabolic clearance (2). This situation has necessitated the search for potential alternatives to antibiotics in feed (China banned their use in feed starting in 2020) (3).
Plant-based feed additives (including alkaloids, terpenoids, and phenolic compounds) have significantly lower residue levels than antibiotics (such as, curcumin can be excreted within 48 h), and they are gaining attention due to their antioxidant and immune-boosting properties (4–6). Bitter almonds, as a plant-based feed additive, primarily contain amygdalin (1.14–5.07%), protein (15.7–24.1%), fatty acids (32.2–43.2%), minerals (2.51–3.83%), and flavonoids (1.2%) as active components (7–9). Bitter almonds and their extract, amygdalin, have been widely applied in the livestock industry. Sahil and colleagues found that amygdalin can enhance the total antioxidant capacity, free radical scavenging ability, and globulin levels of broiler hens, thereby improving their antioxidant and immune capabilities (10); Kim et al., demonstrated that incorporating varying levels of almonds significantly improved production performance in broiler chickens, including feed conversion ratio and nutrient digestibility (11); Mahboub et al., demonstrated that different concentrations of bitter almond can enhance antioxidant and immune markers such as immunoglobulin M, total antioxidant capacity, and glutathione peroxidase in carp (12); Chen et al., found that amygdalin can alleviate oxidative stress and inflammation by inhibiting the transforming growth factor-β1/Smad signaling pathway in rats (13); Ma et al., also found that amygdalin alleviates airway damage by inhibiting abnormal changes in airway epithelial structure and apoptosis (14). Additionally, studies have shown that 10,000 μg/mL bitter almond glycoside can regulate ovarian hormone production in pigs by stimulating the release of estradiol-17 beta (15). In summary, bitter almonds, as a plant-derived additive, hold potential for enhancing antioxidant and immune functions. Due to their rapid metabolism and low residue levels (16), they align with the green development trend of antibiotic alternatives in animal husbandry, making them a natural additive with significant development potential.
However, amygdalin also has adverse effects. For example, it can hydrolyze into cyanide in the small intestine, which may cause tissue hypoxia at high doses and subsequently lead to metabolic acidosis (17). Additionally, it remains unclear whether supplementing diets with bitter almond can improve laying hen performance, antioxidant capacity, and immune function. Therefore, this study is the first to evaluate the effects of incorporating varying doses of bitter almonds into laying hen diets on growth performance, egg quality, antioxidant capacity, and immune function. The study will help determine the optimal dosage for use as a feed additive and provide a theoretical foundation for developing natural plant-based feed additives. At the same time, we predict that adding bitter almond powder to feed can significantly enhance the antioxidant and immune functions of laying hens, thereby improving their production performance.
2 Materials and methods
2.1 Experimental materials
The bitter almond (amygdalin content: 3.59%) was provided by Yongshengtang Pharmaceutical Co., Ltd. (Bozhou, Anhui, China). The amygdalin content was determined by Hebei Agricultural University using high-performance liquid chromatography (Agilent 6495C, Agilent Technologies, Inc., Santa Clara, CA, United States). Rongde black-feathered small-sized layer strain (RBSL) (a breed approved in 2023) has a daily feed intake of 90–100 g/day at 40 weeks of age, with a feed-to-egg ratio of 2.05–2.10:1.
2.2 Experimental design
The animal use protocols in this experiment were approved by the Ethics Committee on Experimental Animals of Hebei Agricultural University (approval no.: 20241115; Baoding, Hebei, China), in compliance with the principles of animal protection, welfare, and ethics.
The feeding experiment was conducted in environmentally controlled chambers at the Animal Husbandry Teaching Base of Hebei Agricultural University. A total of 180 healthy 43-week-old Rongde black-feathered small-sized layer strain (RBSL) with similar production performance and body weight were selected and randomly divided into 4 groups (each group with 5 replicates, each containing 9 hens). All experimental diets in this study were isonitrogenous and isocaloric. They were, respectively, fed basal diets supplemented with 0 (control group, CON), 0.25 (low-dose group, LBA), 0.5 (medium-dose group, MBA), and 0.75 (high-dose group, HBA) g/kg of bitter almond. Bitter almond was added in powder form to the basal diet and ensured to be homogeneously mixed. The experiment included a 3-day observation period, a 1-week adaptation period, and an 8-week formal experimental period. The hens were housed in H-type stepped cages with ad libitum access to feed and water. They received complete formulated diets twice daily (08:00 and 16:00) under a 16-h light: 8-h dark (16 L:8D) lighting regimen. Daily at 15:30, the number of eggs laid, flock condition, mortality, and culling rate were recorded. The composition and nutritional levels of the basal diet are shown in Table 1.
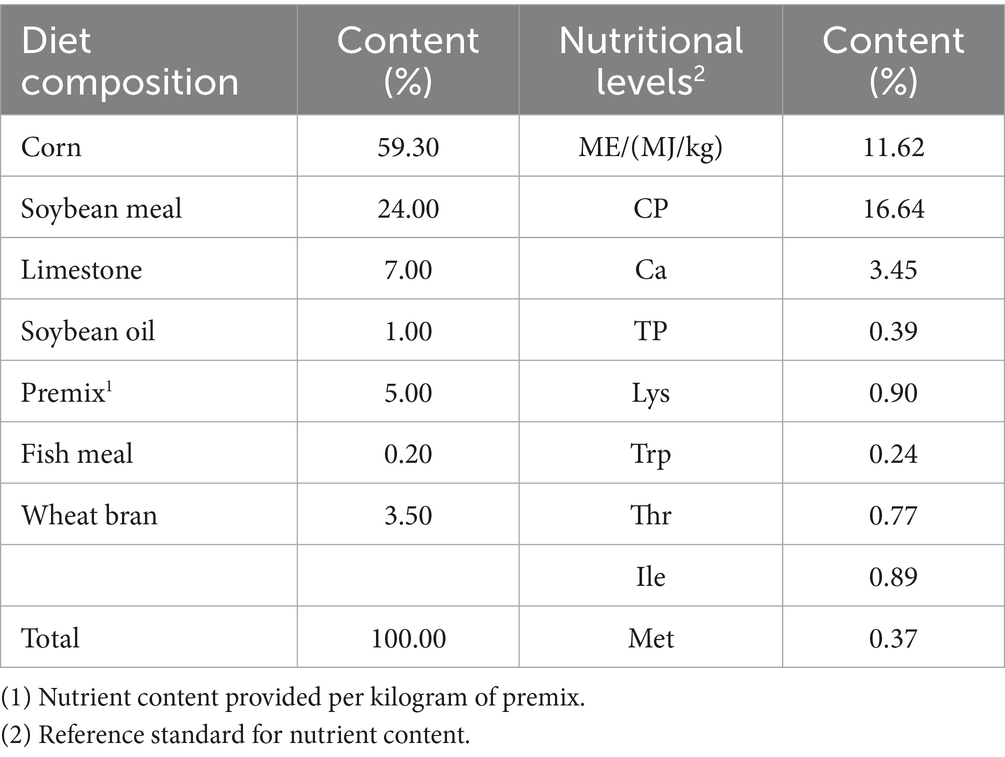
Table 1. Composition and nutritional levels of the basal diet (%, air-dried base).
2.3 Sample collection
2.3.1 Production performance
Daily records were kept of the egg production number and egg weight for each replicate. Weekly measurements were taken of the feed intake for each group. Using the above data, the egg production rate, average egg weight, feed-to-egg ratio, and average daily feed intake were calculated. The calculation formulas are as follows: laying rate (%) = (total number of eggs produced/total number of hens) × 100; average egg weight (g) = total weight of eggs/number of eggs; average daily feed intake (g) = total feed consumption/number of experimental days; and feed-to-egg ratio (F/G) = total feed consumption/total egg weight.
2.3.2 Egg quality
At 2, 4, 6, and 8 weeks of age, 6 eggs were randomly selected from each group (a total of 30 eggs per group) for testing. First, egg weight and short axis/long axis were recorded. Eggshell strength was measured using an eggshell strength tester (ESTG-01; Israel Aoke Company Limited, Israel), and Haugh units and yolk color were determined using an automatic egg quality analyzer (EA-01; Israel Aoke Company Limited, Israel). Eggshell thickness was measured using a digital spiral micrometer (217–111, Guilin Guanglu Digital Measurement and Control Co., Ltd. Guilin, Guangxi, China) at the blunt end, sharp end, and midpoint, and the average value was calculated. Egg yolk weight and eggshell weight were obtained by weighing with an electronic balance.
2.3.3 Serum antioxidant and immune indices
On day 7 of week 8 of the experiment at 8:00 a.m., hens were weighed after an 8-h fast. Ten hens were randomly selected from each group. Blood was collected from the wing vein, placed in a coagulation tube, and left at room temperature for 4 h. The serum was then separated by centrifugation at 3000 revolutions per minute for 15 min. An enzyme-linked immunosorbent assay kit (Nanjing Jiancheng Biotechnology Research Institute, Nanjing, Jiangsu Province, China) was used to detect serum levels of the following parameters: antioxidant markers, including glutathione peroxidase (GSH-Px), superoxide dismutase (SOD), malondialdehyde (MDA), total antioxidant capacity (T-AOC), and catalase (CAT); and immunoglobulins, including immunoglobulin A (IgA), immunoglobulin M (IgM), and immunoglobulin G (IgG). This method is based on the immunological principle of antigen–antibody specific binding, utilizing enzyme-labeled technology to amplify detection signals. During the experiment, capture antibodies coated onto a solid-phase carrier first bind to the target antigen. Subsequently, enzyme-labeled detection antibodies are added to form a complex. Finally, through enzyme-catalyzed substrate colorimetric reactions, quantitative analysis is achieved by leveraging the property that absorbance values are directly proportional to target concentration.
2.3.4 Intestinal morphology analysis
At 16:00 on day 7 of week 8, 2 hens were randomly selected from each replicate (totaling 40 hens) for slaughter. The duodenum, jejunum, and ileum were isolated, and the intestinal contents were removed. The tissues were then rinsed with physiological saline. Approximately 2 cm mid-segment samples were collected from each intestinal region and fixed in 4% paraformaldehyde for 48 h. Subsequently, the samples were embedded in paraffin and sectioned for histological analysis. All subsequent steps, from sectioning onward, including staining and morphological analysis, were performed under blinded conditions. Hematoxylin–eosin (H&E) staining was performed, and the sections were examined under a digital trinocular camera microscope (BA210Digital, Motic China Group Co., Ltd., Xiamen, Fujian, China). villus height and crypt depth were measured for each intestinal segment, and the villus height-to-crypt depth ratio (villus height/crypt depth ratio) was calculated. The measurement method for intestinal histology was performed according to Kiernan (18).
2.3.5 Plasma untargeted metabolomics
On day 7 of week 8, randomly select 4 plasma samples from each group, take 1 milliliter, lyophilize it, and then add 100 microliters of an 80% methanol aqueous solution. The mixture was vortexed and incubated on ice for 5 min. Centrifugation was performed at 15,000 rpm and 4° C for 15 min. The supernatant was diluted with mass spectrometry-grade water to a methanol concentration of 53%, and the mixture was centrifuged again under the same conditions for 15 min. The supernatant was collected and analyzed by liquid chromatography-mass spectrometry (LC–MS). Chromatography was performed using a Hypersil Gold column (C18) at 40° C with a flow rate of 0.2 mL/min. The mobile phase in positive ion mode consisted of 0.1% formic acid (phase A) and methanol (phase B), while in negative ion mode, it consisted of 5 mM ammonium acetate (pH 9.0, phase A) and methanol (phase B). The raw data were converted to mzXML format using ProteoWizard, followed by peak matching, retention time correction, and peak area extraction using XCMS software (Scripps Research, La Jolla, CA, United States). Subsequently, metabolite structural identification, data preprocessing, experimental data quality evaluation, and data analysis were performed sequentially, with false discovery rate (FDR) correction applied for multiple comparisons during statistical testing.
2.3.6 Microbial community structure of cecal contents
On day 7 of week 8, four cecal content samples were randomly selected from each group. Approximately 150–200 mg of each sample was transferred to a 2 mL centrifuge tube, and 1.2 mL of Buffer SSL was added. Vortex the mixture for 1 min and then incubate at 70° C for 10 min. After vortexing again for 15 s, centrifuge the samples at 14,000 rpm for 10 min. From the resulting supernatant, 250 μL was aliquoted, then add 20 μL of Proteinase K and 250 μL of Buffer AL. Invert the mixture to mix and incubate at 70° C for 10 min. Then, add 250 μL of anhydrous ethanol and mix thoroughly. Transfer the mixture to the Hi Pure DNA Mini Column I, wash with Buffer GW1 and Buffer GW2, and centrifuge. Subsequently, add 50–200 μL of preheated Buffer AE, incubate at room temperature for 2 min, and centrifuge to collect the DNA. The purity of the DNA was assessed using Nano Drop, with acceptable values defined as an A260/A280 ratio between 1.8–2.0 and an A260/A230 ratio ≥ 2.2, while integrity was verified by 2% agarose gel electrophoresis. The V3–V4 region of the 16S rDNA was amplified with V341F/V806R primers in a 50 μL reaction system under the following conditions: 95° C for 5 min; 30 cycles of 95° C for 1 min, 60° C for 1 min, and 72° C for 1 min; followed by a final extension at 72° C for 7 min. After detection, purification, and quantification, the amplified products were used for library preparation with an Illumina kit, and library quality was evaluated using ABI StepOnePlus real-time PCR. The raw reads obtained from sequencing were initially processed using the FASTP software for quality control to remove low-quality reads. Subsequently, paired-end sequencing reads were assembled into tags using the FLASH software. The assembled tags then underwent further filtering to generate high-quality data, designated as clean tags. Using these clean tags, OTU clustering was performed at a 97% similarity threshold with the UPARSE algorithm implemented in the USEARCH software. During the clustering and alignment process, chimeric sequences were detected and removed using the UCHIME algorithm within USEARCH, resulting in effective tags for subsequent analysis. Following OTU generation, the effective tags were utilized for OTU abundance statistics, followed by taxonomic annotation, α-diversity analysis, β-diversity analysis, and other downstream.
2.4 Statistical analysis
Laying rate, egg quality, antioxidant indicators, immune indicators, and intestinal morphology data were first organized using Microsoft Excel 2020, then subjected to one-way analysis of variance using Statistical Package for the Social Sciences software. For indicators where the ANOVA revealed a significant overall effect, differences between individual groups were compared using Duncan’s new multiple range test. Results are presented as “mean ± standard deviation” (p value less than 0.05 indicates significant difference); graphs were created using GraphPad Prism 8.0 (GraphPad Software Incorporated, San Diego, CA, United States), with p value less than 0.05 indicating significant difference. Additionally, plasma metabolomics and gut microbiota data were analyzed using nonparametric tests (Kruskal-Wallis test) in combination with multivariate statistical methods. Spearman correlation analysis was used to examine the interrelationships among plasma metabolomics, intestinal microbiota, immunoglobulins, and antioxidant parameters.
3 Results
3.1 Production performance
As shown in Figure 1A, the egg production rates in the MBA group were significantly higher than those in the CON group from weeks 3 to 8 (p < 0.05). In contrast, the average egg weight in the HBA group was significantly lower than that in the CON group during weeks 7 to 8 (p < 0.05; Figure 1C). Additionally, the MBA group exhibited a significantly higher average feed intake than the CON group throughout the entire experiment (p < 0.05; Figure 1D). Meanwhile, no significant differences were observed in the feed-to-egg ratio among the four groups (p > 0.05; Figure 1B).
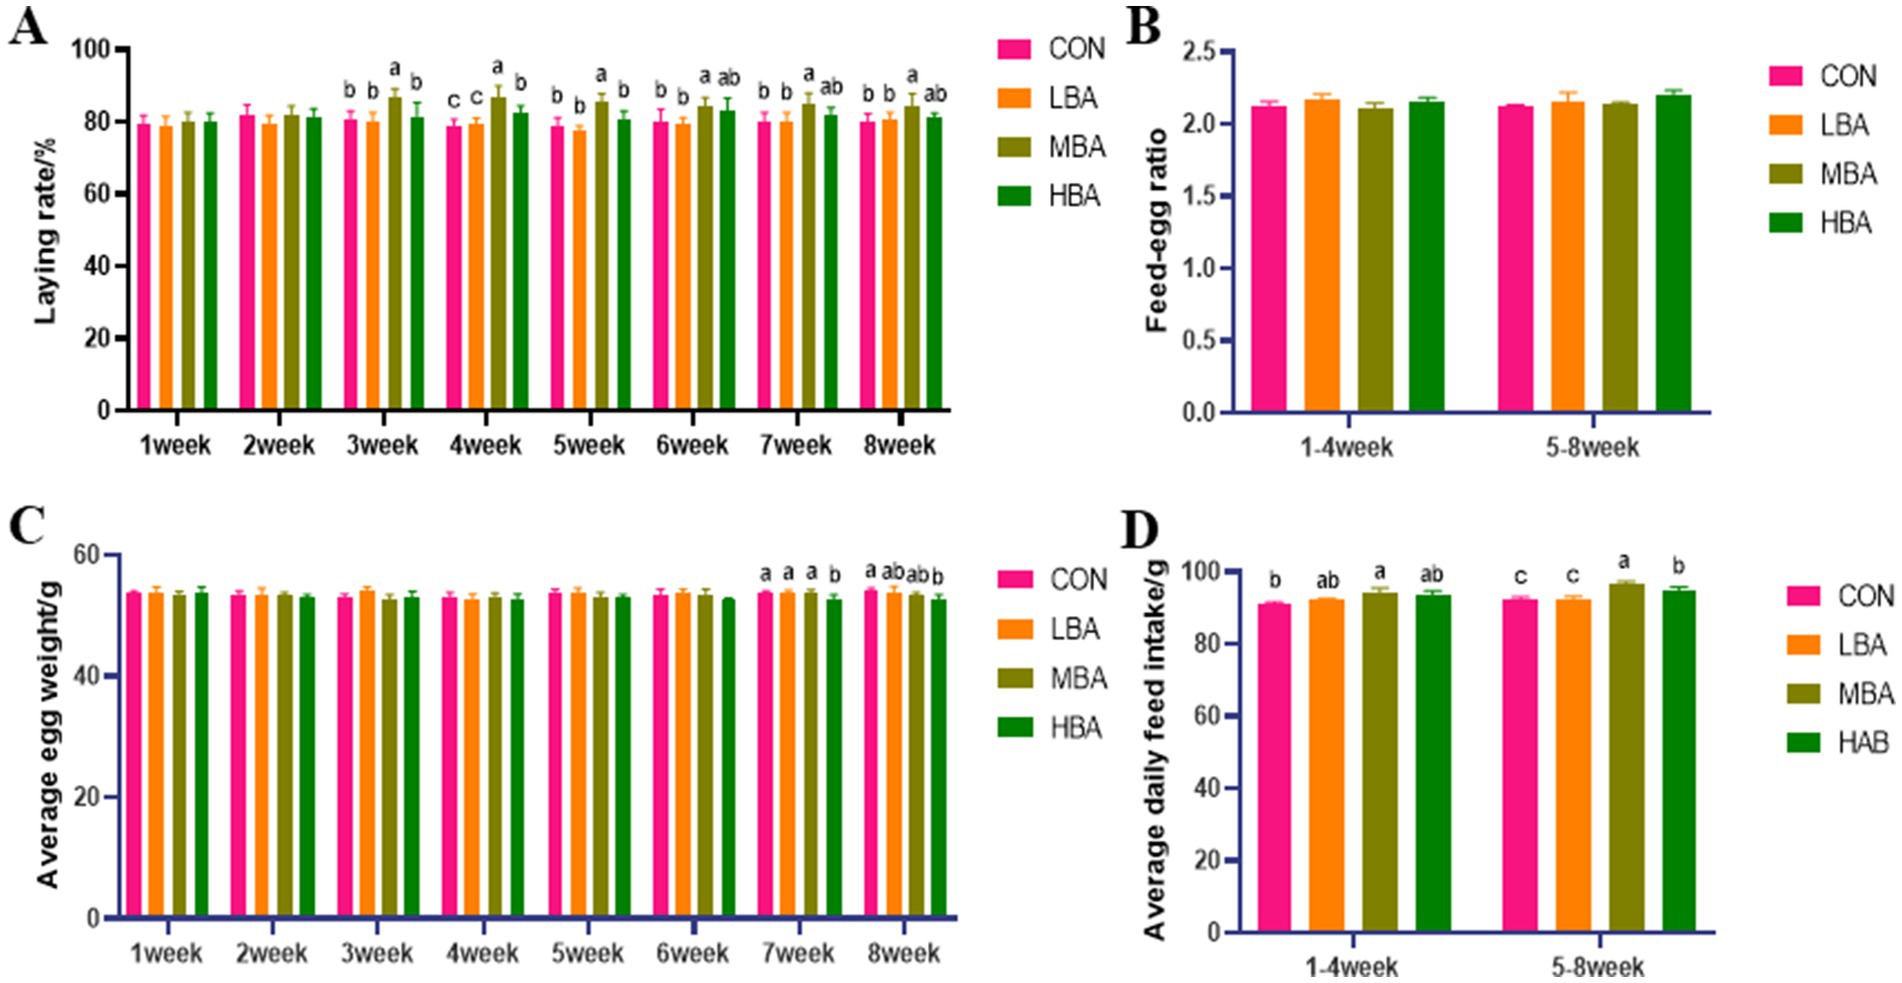
Figure 1. Effects of bitter almond on the production performance of RBSL. (A) Laying rate in control group (CON), low-dose bitter almond group (LBA), medium-dose bitter almond group (MBA), and high-dose bitter almond group (HBA); (B) feed-egg ratio; (C) average egg weight; (D) average daily feed intake. Results are presented such that no superscript letters or identical superscript letters indicate no significant difference (p > 0.05), while different lowercase superscript letters indicate significant differences (p < 0.05).
3.2 Egg quality
As shown in Figures 2E,F, during weeks 6 to 8, the yolk color of the HBA group was significantly higher than that of the CON group (p < 0.05). The Haugh units of both the MBA and HBA group were significantly higher than those of the CON group (p < 0.05). No other egg quality indicators differed significantly among the four groups (p > 0.05; Figures 2A–D,G–I).
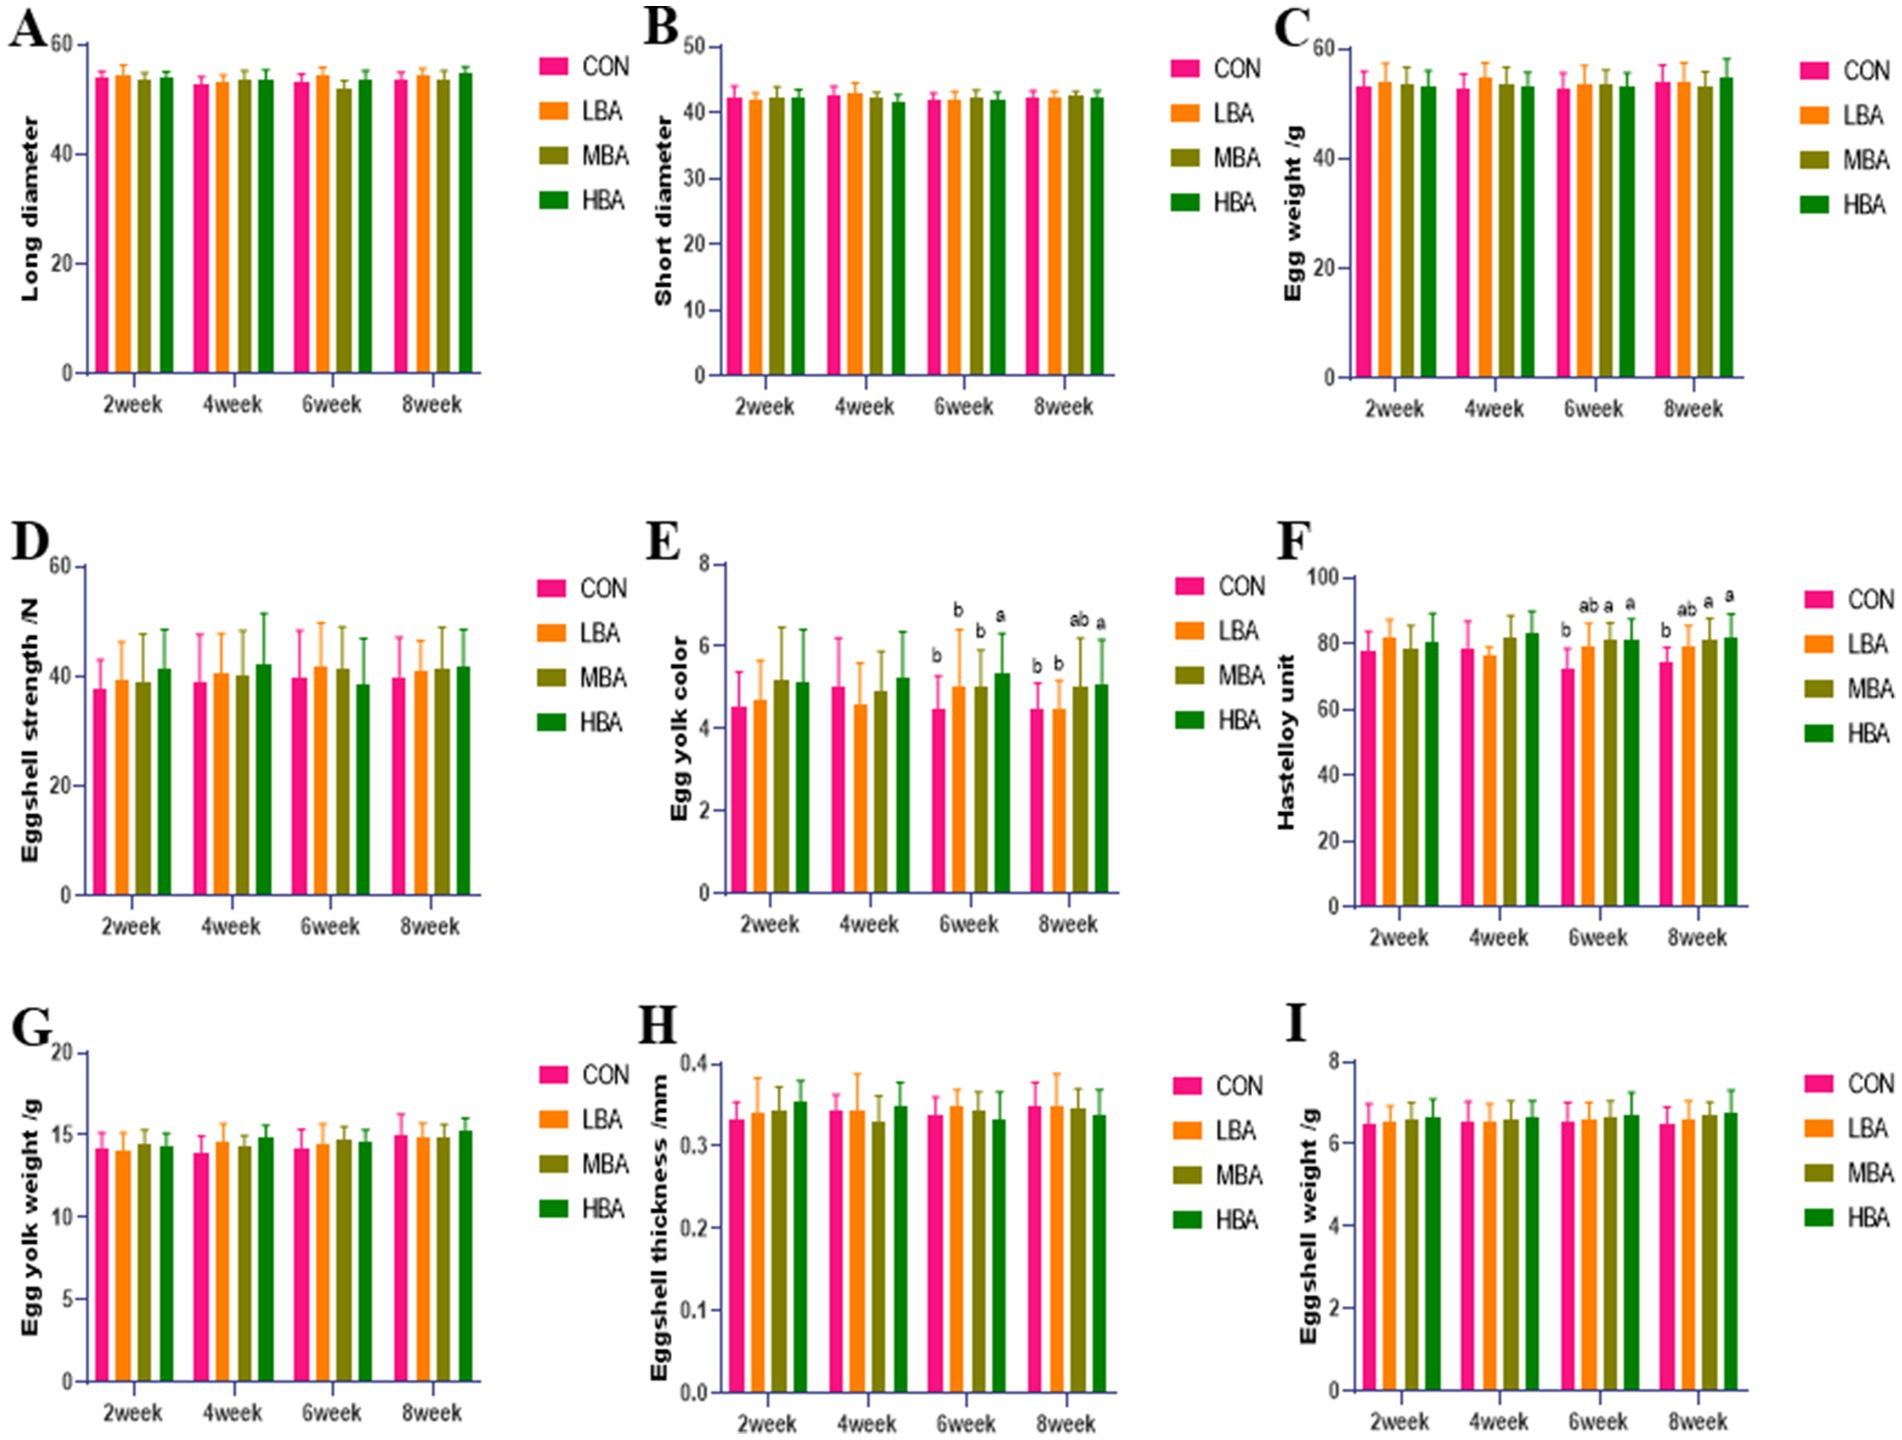
Figure 2. Effects of bitter almond on the egg quality of RBSL. (A) Long axis (B) short axis (C) egg weight (D) eggshell strength (E) yolk color (F) Haugh unit (G) yolk weight (H) eggshell thickness (I) eggshell weight. Among these, CON represents the control group, LBA represents the low-dose bitter almond group, MBA represents the medium-dose bitter almond group, and HBA represents the high-dose bitter almond group. The results indicated that the absence of letters or identical letters signifies no significant difference (p > 0.05), while different lowercase letters indicate significant differences (p < 0.05).
3.3 Analysis of serum antioxidant capacity and immunoglobulin levels
Figure 3 illustrates the effects of bitter almond powder on antioxidant and immune parameters in RBSL. The levels of T-AOC, GSH-Px, and IgA in the MBA and HBA groups were significantly higher than those in the CON group (p < 0.05; Figures 3C,E,F). IgM levels were significantly elevated only in the HBA group (p < 0.05), showing a dose-dependent increase (Figure 3H). However, no significant differences were observed in SOD, CAT, MDA, or IgG levels among the four groups (p > 0.05; Figures 3A,B,D,G).
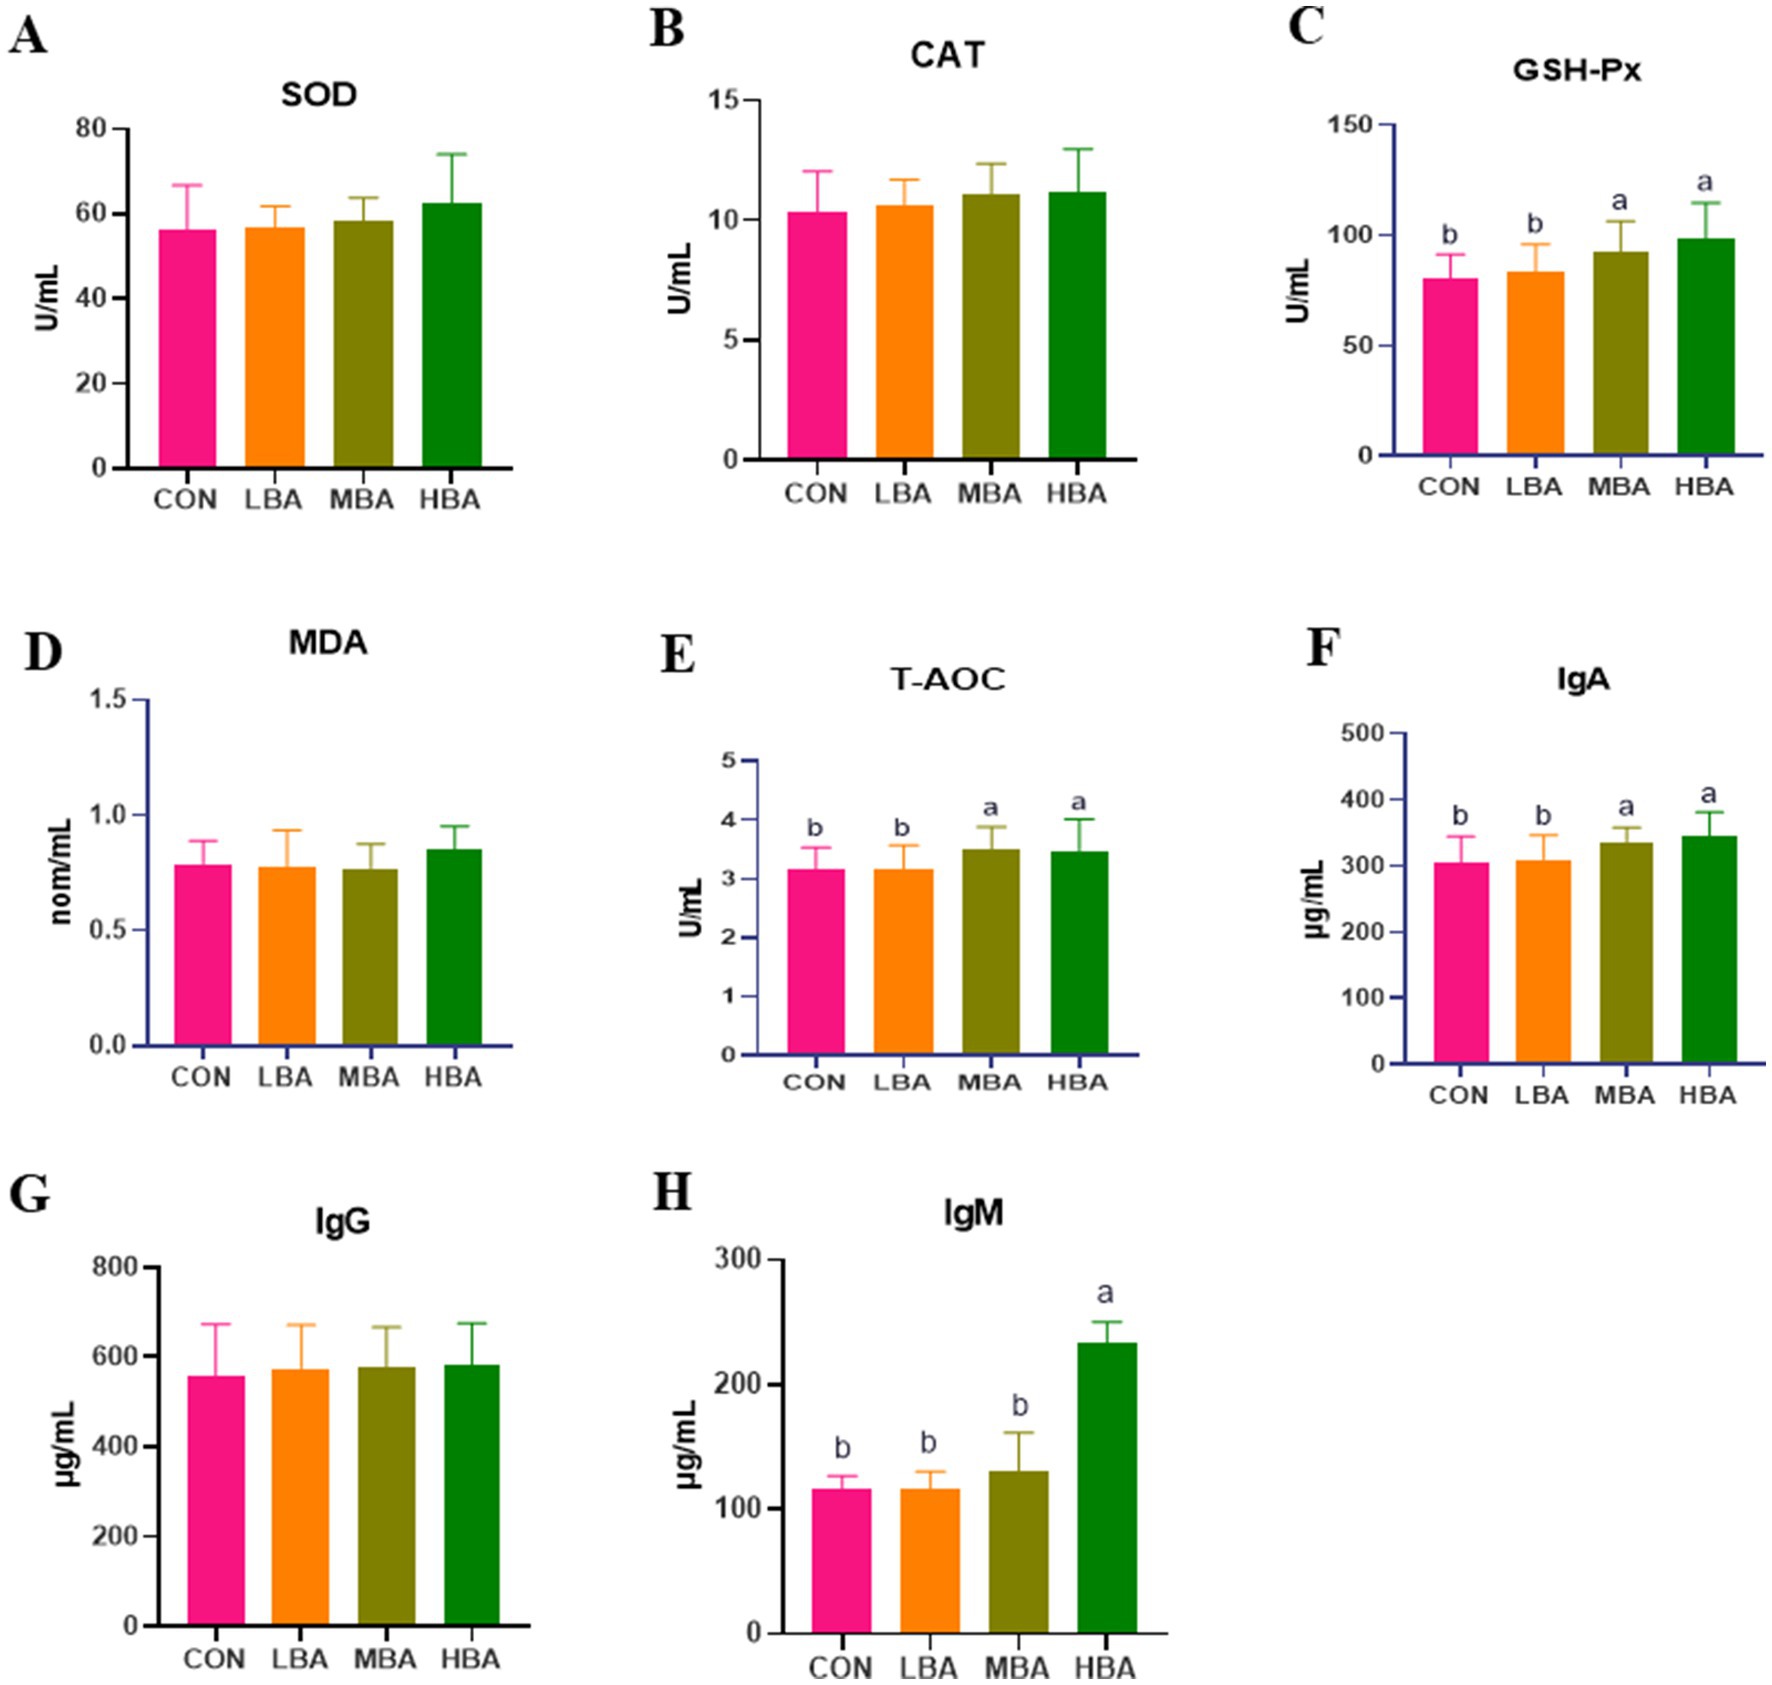
Figure 3. Effects of bitter almond on serum antioxidant capacity and immune function in RBSL. (A) Superoxide dismutase (SOD) activity; (B) catalase (CAT) activity; (C) glutathione peroxidase (GSH-Px) activity; (D) malondialdehyde (MDA) content; (E) total antioxidant capacity (T-AOC); (F) immunoglobulin A (IgA) content; (G) immunoglobulin G (IgG) content; (H) immunoglobulin M (IgM) content. Among these, CON represents the control group, LBA represents the low-dose bitter almond group, MBA represents the medium-dose bitter almond group, and HBA represents the high-dose bitter almond group. The results indicated that the absence of letters or identical letters signifies no significant difference (p > 0.05), while different lowercase letters indicate significant differences (p < 0.05).
3.4 Intestinal morphology
As shown in Figures 4A,D, the villus height in the duodenum and jejunum was significantly greater in the LBA and MBA groups than in the CON group (p < 0.05). Meanwhile, the crypt depth in the duodenum of the LBA, MBA, and HBA groups was significantly lower than that of the CON group (p < 0.05; Figure 4B). Moreover, the villus-to-crypt ratio in the duodenum and jejunum of these three groups was significantly higher than that of the CON group (p < 0.05; Figures 4C,F). In the ileum, crypt depth was significantly greater in the HBA group than in the CON group, while the villus-to-crypt ratio was significantly higher in the MBA group than in the control group (p < 0.05; Figures 4H,I). There were no significant differences in the crypt depth of the jejunum or the villus height of the ileum among the four groups (p > 0.05; Figures 4E,G). Figures 4J–M shows representative duodenal images for CON, LBA, MBA, and HBA, respectively; Figures 4N–Q shows representative jejunal images for CON, LBA, MBA, and HBA, respectively; Figures 4R–U shows representative ileal images for CON, LBA, MBA, and HBA, respectively.
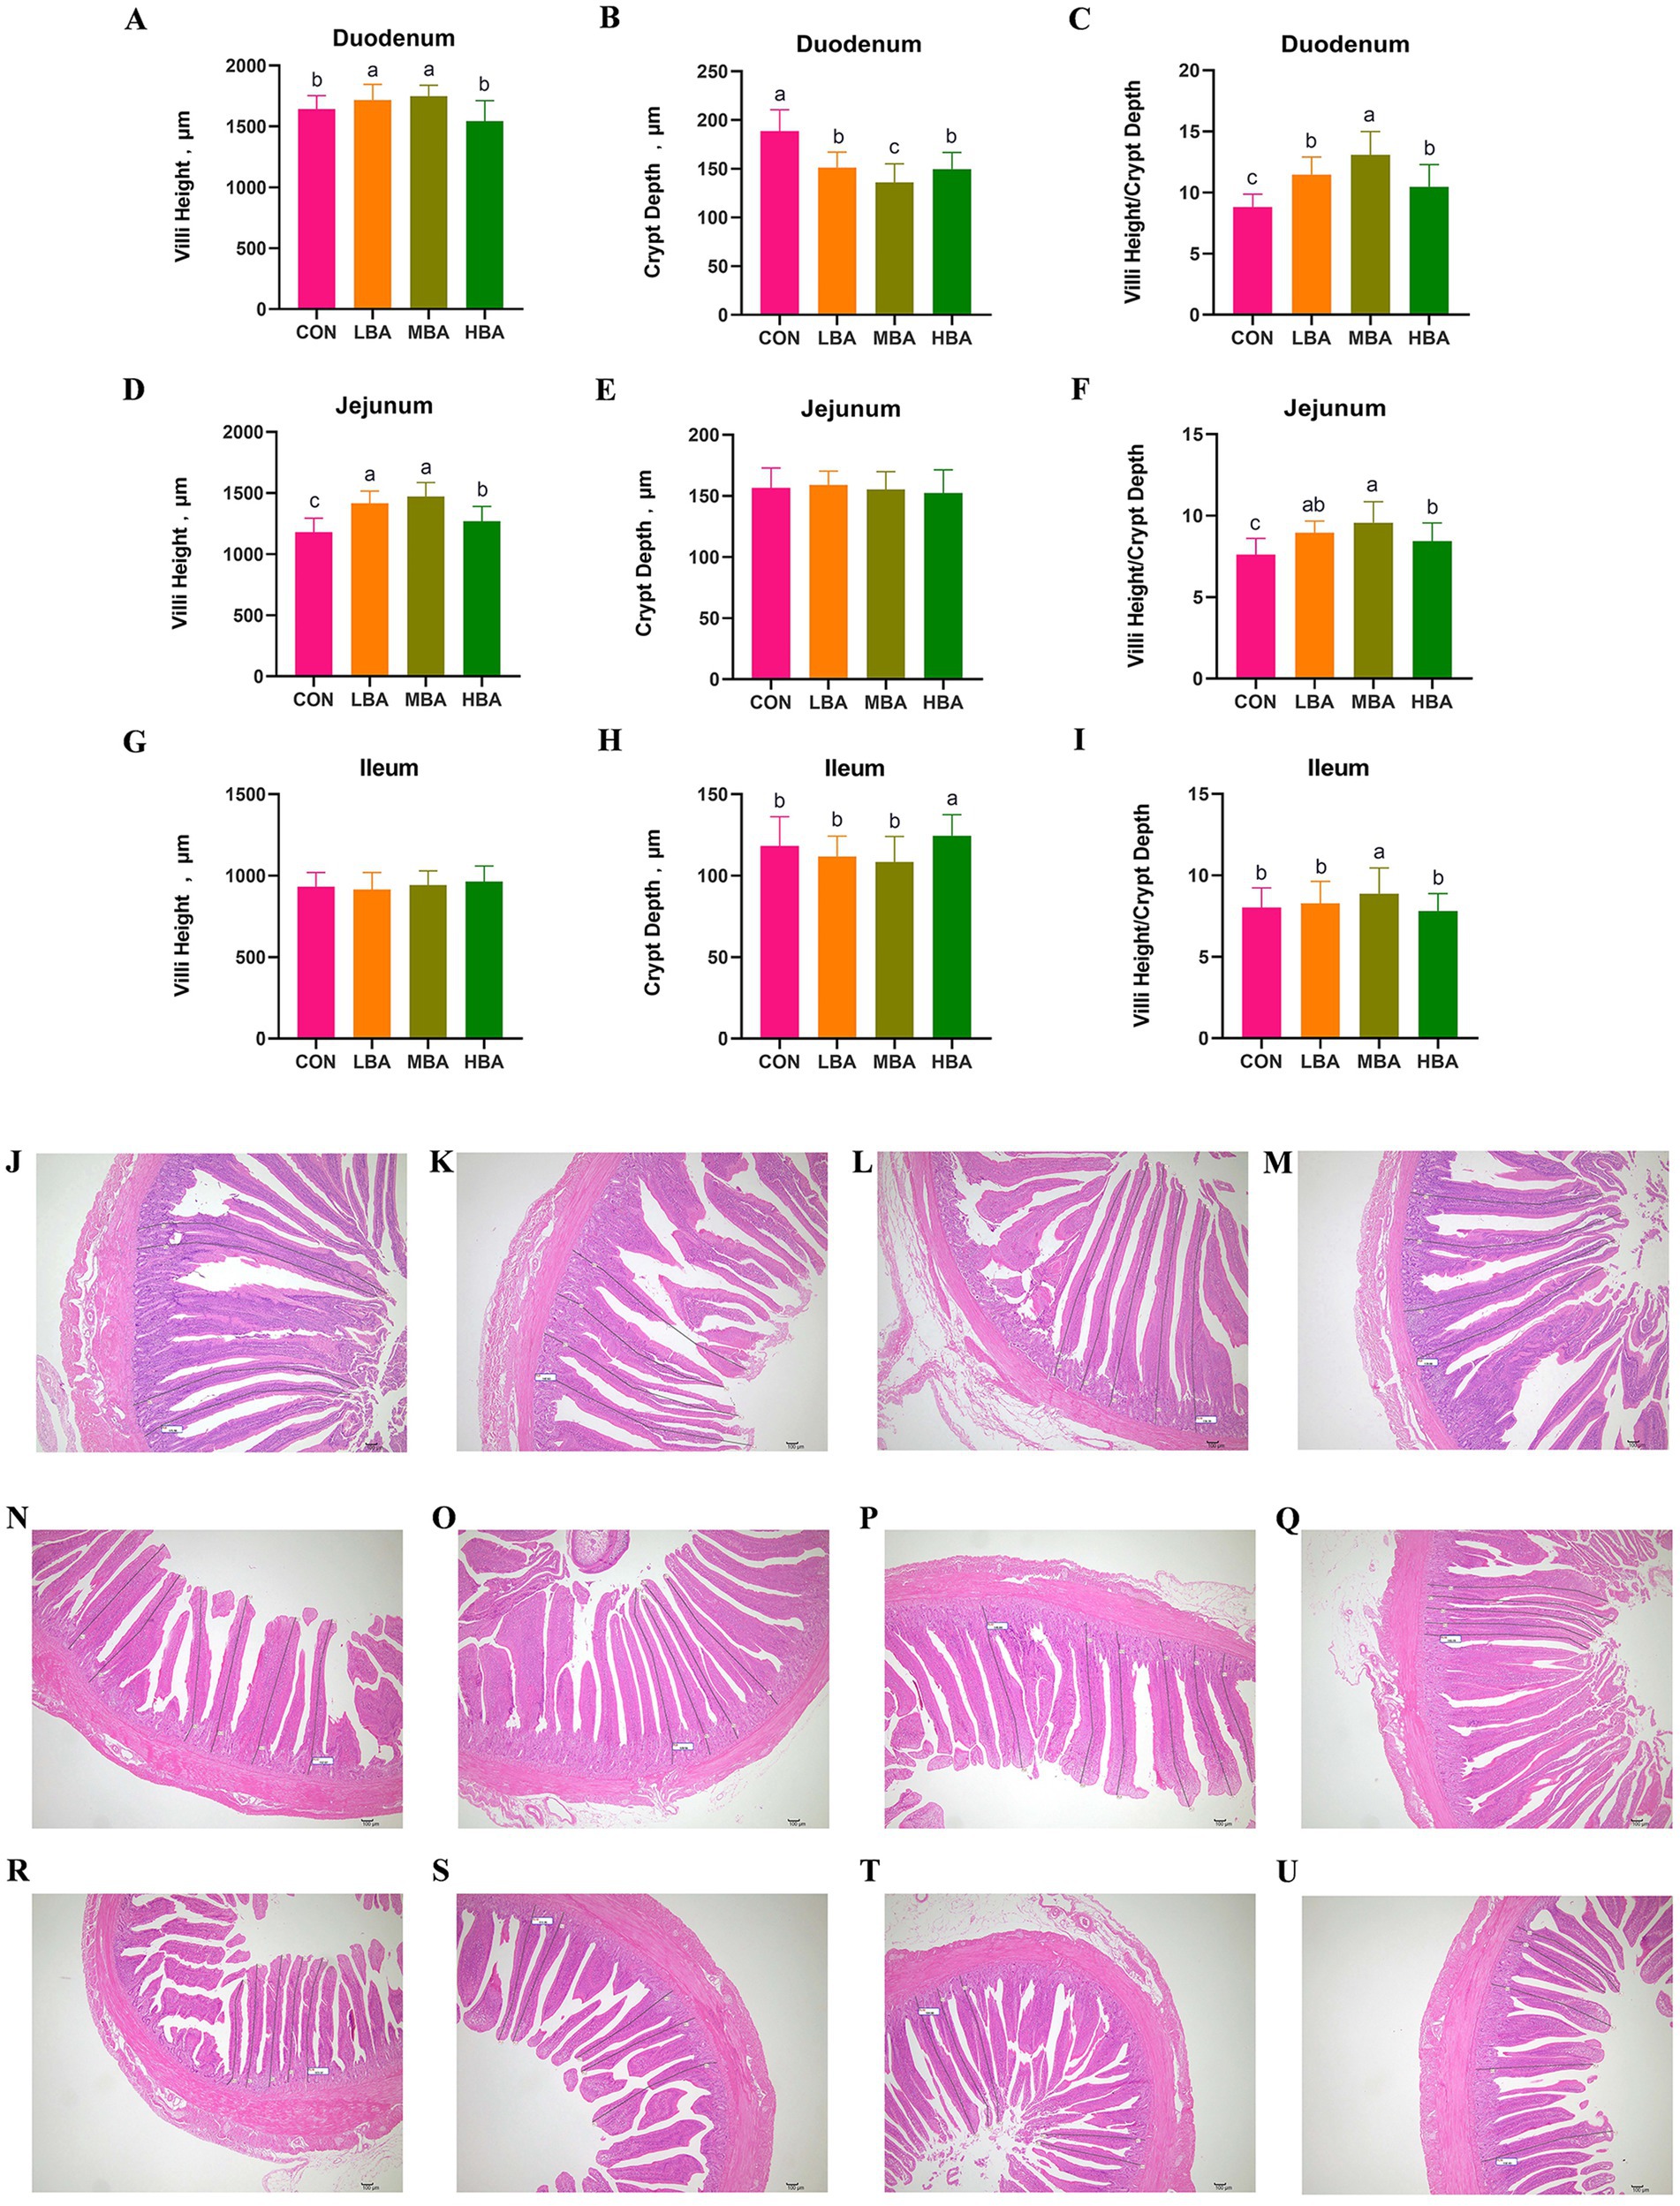
Figure 4. Effects of bitter almond on the intestinal morphology of RBSL. (A) Duodenal villus height (VH), (B) duodenal crypt depth (CD), (C) ratio of duodenal villus height to crypt depth (V/C), (D) jejunum villus height (VH), (E) jejunum crypt depth (CD), (F) ratio of jejunum villus height to crypt depth (V/C), (G) ileum villus height (VH), (H) ileum crypt depth (CD), and (I) ratio of ileum villus height to crypt depth (V/C). Among these, CON represents the control group, LBA represents the low-dose bitter almond group, MBA represents the medium-dose bitter almond group, and HBA represents the high-dose bitter almond group. The results indicated that the absence of letters or identical letters signifies no significant difference (p > 0.05), while different lowercase letters indicate significant differences (p < 0.05). (J) Representative duodenal images from the CON group; (K) representative duodenal images from the LBA group; (L) representative duodenal images from the MBA group; (M) representative duodenal images from the MBA group. (N) Representative images of the jejunum in the CON group; (O) representative images of the jejunum in the LBA group; (P) representative images of the jejunum in the MBA group; (Q) representative images of the jejunum in the HBA group. (R) Representative images of ileum from the CON group; (S) representative images of ileum from the LBA group; (T) representative images of ileum from the MBA group; (U) representative images of ileum from the HBA group.
3.5 Plasma untargeted metabolomics analysis
Figure 5 illustrates the differences in plasma metabolites among the four groups through non-targeted metabolomics analysis. Figures 5A–C show the results of Pairwise comparison OPLS-DA analysis, indicating that samples from the CON group are significantly separated from those in the LBA, MBA, and HBA groups along the first principal component (PC1) axis, with all samples falling within the 95% confidence ellipse. The PC1 contribution rates for Figures 5A–C are 45.7, 22, and 35.2%, respectively. Additionally, the results of pairwise comparison permutation tests for each group in Figures 5D–F show that the R2Y intercept values for Figures 5D–F are all 0.99, while the Q2Y values are 0.2, 0.4, and 0.17, respectively. Since the R2 values for all groups are greater than the Q2 values, the models are suitable for subsequent analysis. Subsequently, differential metabolite screening was performed based on three parameters: VIP, FC, and p-value. The thresholds were set as VIP > 1.0, p-value < 0.05, and Fold Change (FC) ≥ 1. As shown in Figures 5G–I, volcano plot analysis of differentially expressed metabolites identified 81, 49, and 78 differentially expressed metabolites in the CON vs. LBA, CON vs. MBA, and CON vs. HBA comparisons, respectively. Among these, the numbers of upregulated metabolites were 51, 21, and 26, while the numbers of downregulated metabolites were 30, 28, and 52, respectively. As shown in Figures 5J–L, further metabolic pathway enrichment analysis revealed that the LBA group significantly affected ABC transporters, nitrogen metabolism, and aminoacyl-tRNA biosynthesis (p < 0.05). The MBA group exhibited alterations in pathways such as choline metabolism in cancer, glycerophospholipid metabolism, and Efferocytosis (p < 0.05). The HBA group showed changes in pathways including catecholamine transferase inhibitors, choline metabolism in cancer, and glycerophospholipid metabolism (p < 0.05).
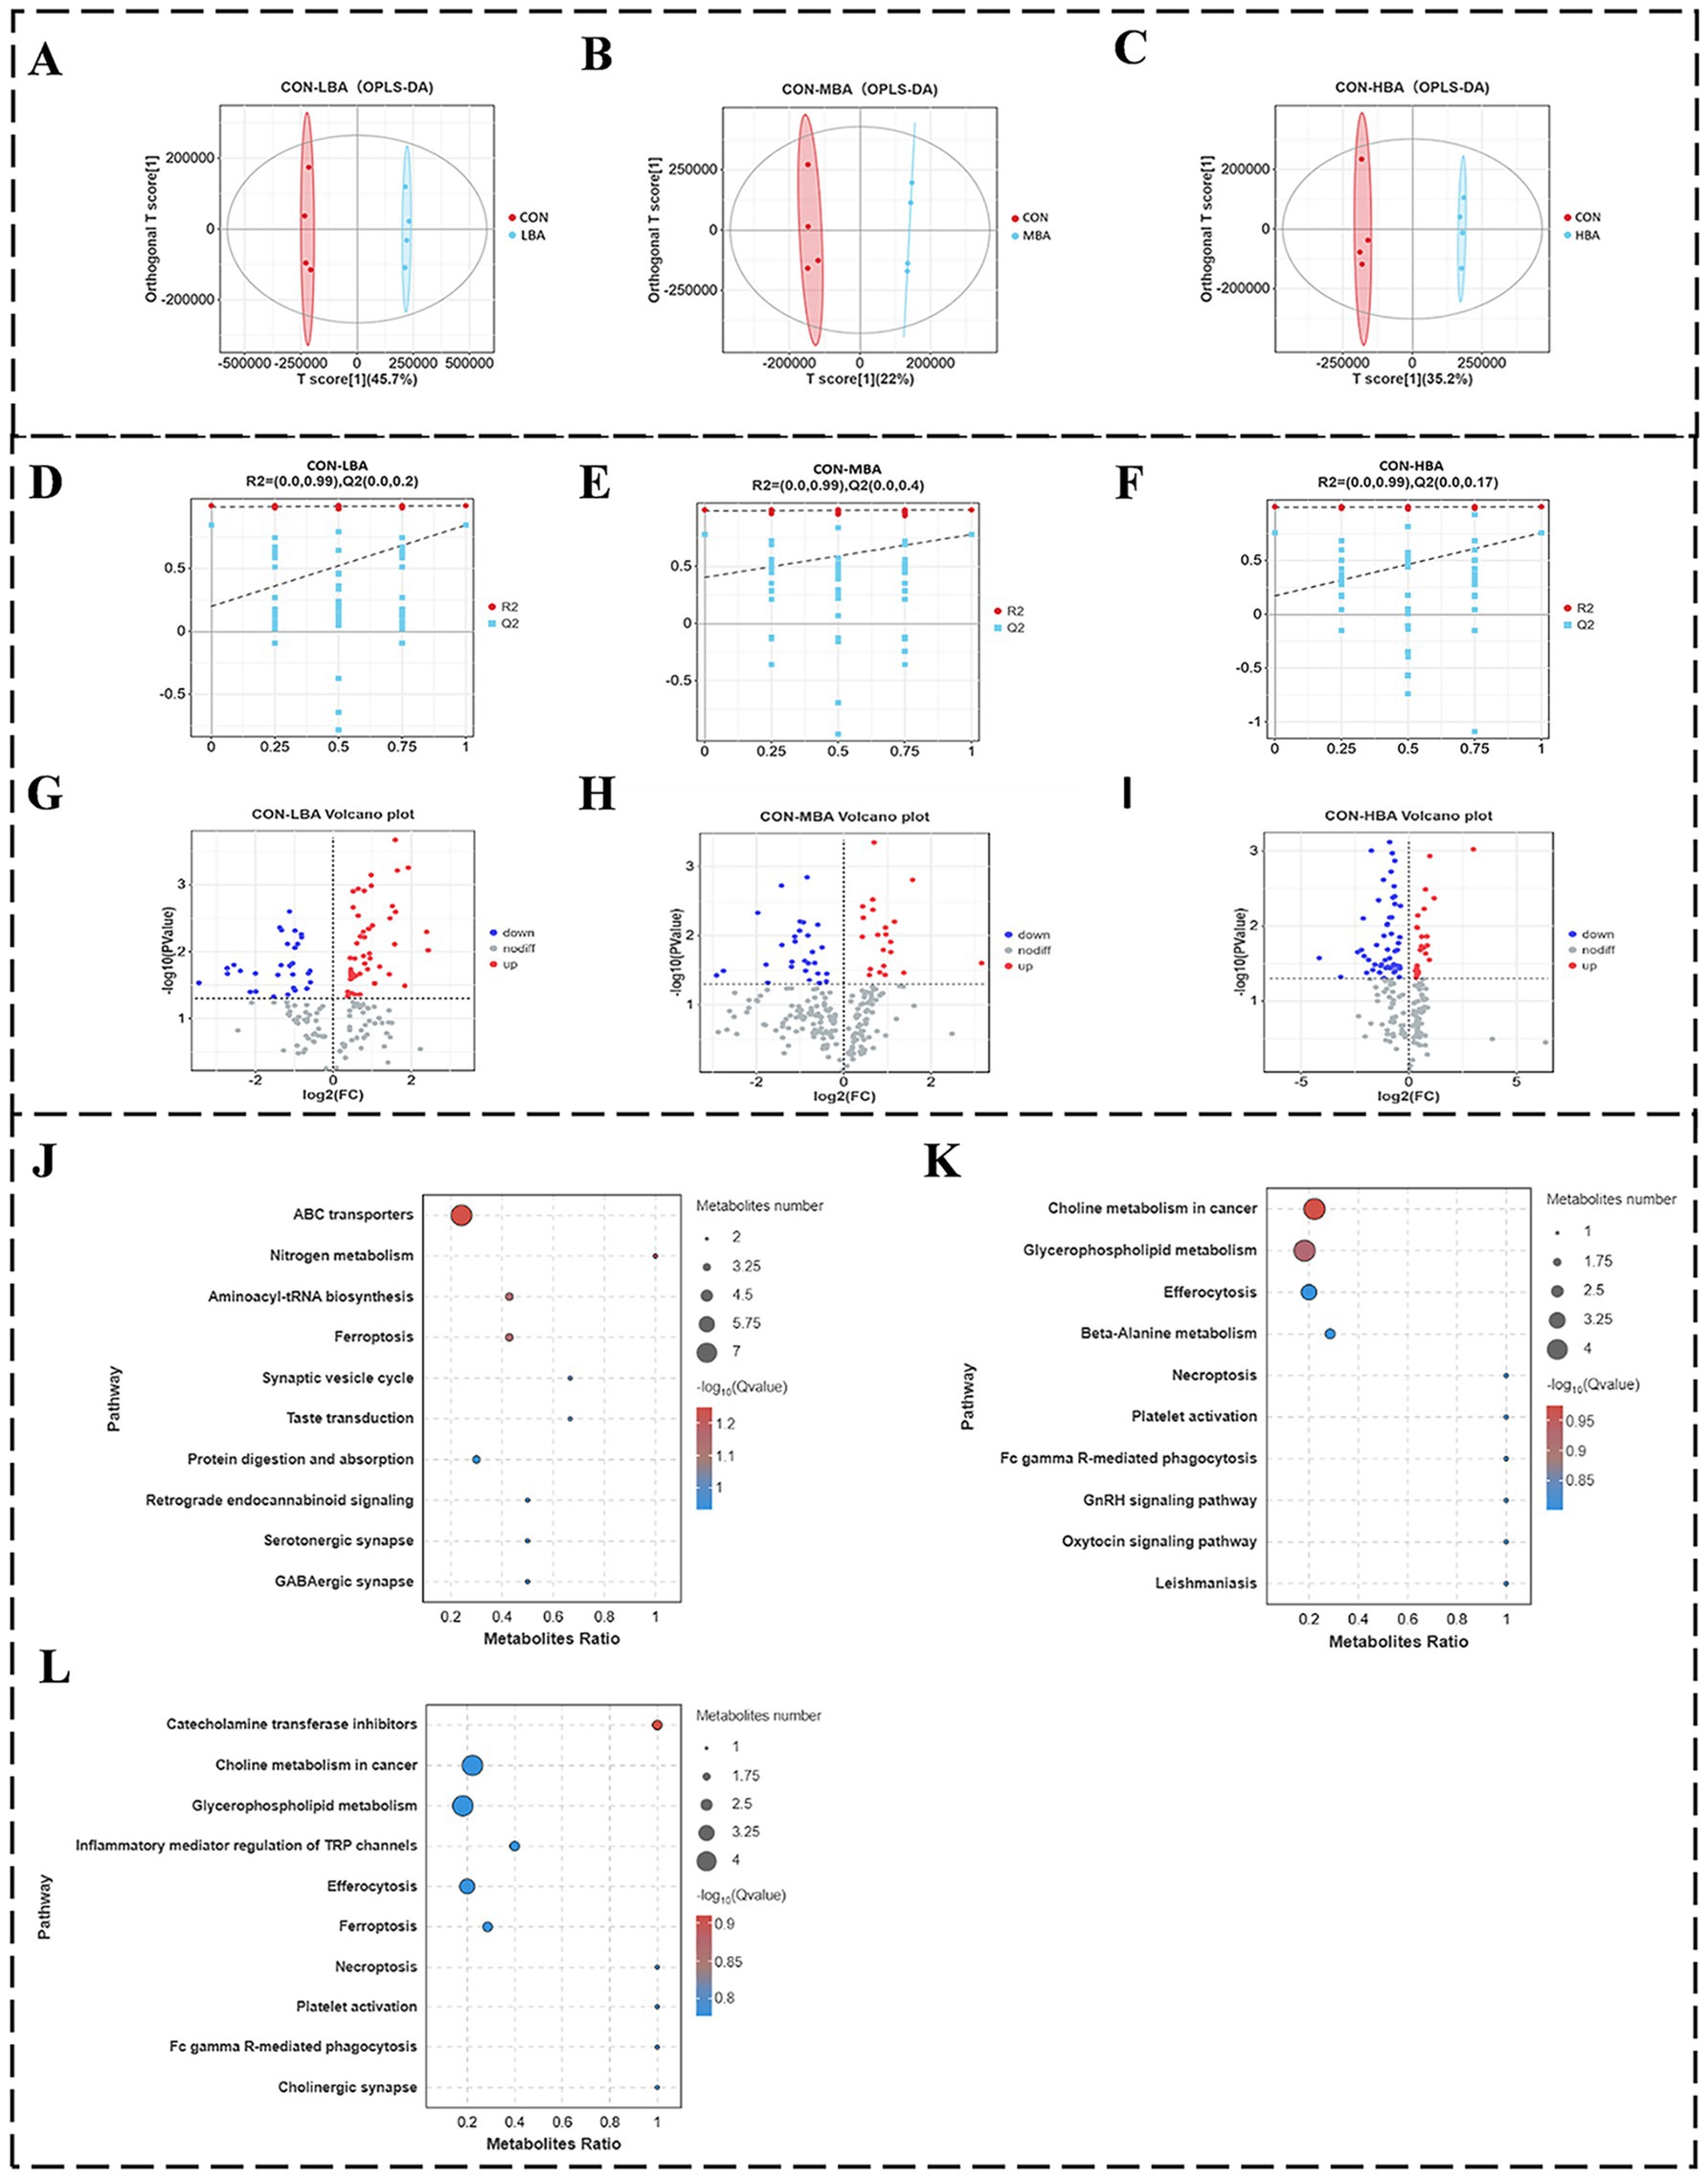
Figure 5. Effects of bitter almond on the cecal bacterial community structure of RBSL. (A–C) shows OPLS-DA score plots; (D–F) displays permutation test plots for pairwise comparisons; (G–I) presents volcano plots of differential metabolites; (J–L) illustrates KEGG significance bubble plots. Among these, CON represents the control group, LBA represents the low-dose bitter almond group, MBA represents the medium-dose bitter almond group, and HBA represents the high-dose bitter almond group.
3.6 Bacterial community structure of cecal contents
To investigate the effects of bitter almond on the microbial community of the cecum in RBSL, microbial changes were measured in the CON, LBA, MBA, and HBA groups. The numbers of OTUs specific to the CON, LBA, MBA, and HBA groups were 2,491, 2,205, 1,552, and 1,805, respectively (Figure 6A). α-Diversity was measured using the Chao1, Simpson, Shannon, Sob, and ACE indices. As shown in Figures 6B–F, there were no significant differences in the α-diversity of the cecal microbiota among the CON, LBA, MBA, and HBA groups (p > 0.05). Figure 6G shows that there was a certain degree of dispersion among the four groups in the principal component analysis. Figures 6H,I illustrate the effect of bitter almond on the relative abundance of cecal microbiota. At the phylum level, the main phyla were Bacteroidota, Bacillota, Fusobacteriota, Thermodesulfobacteriota, and Pseudomonadota. At the genus level, the main genera were Bacteroides, Faecalibacterium, Rikenellaceae_RC9_gut_group, Megamonas and Fusobacterium. Among these, the relative abundance of the genus Negativibacillus was significantly lower in the HBA group compared to the CON group (p < 0.05), and the LBA and MBA groups also showed a decreasing trend (Figure 6J).
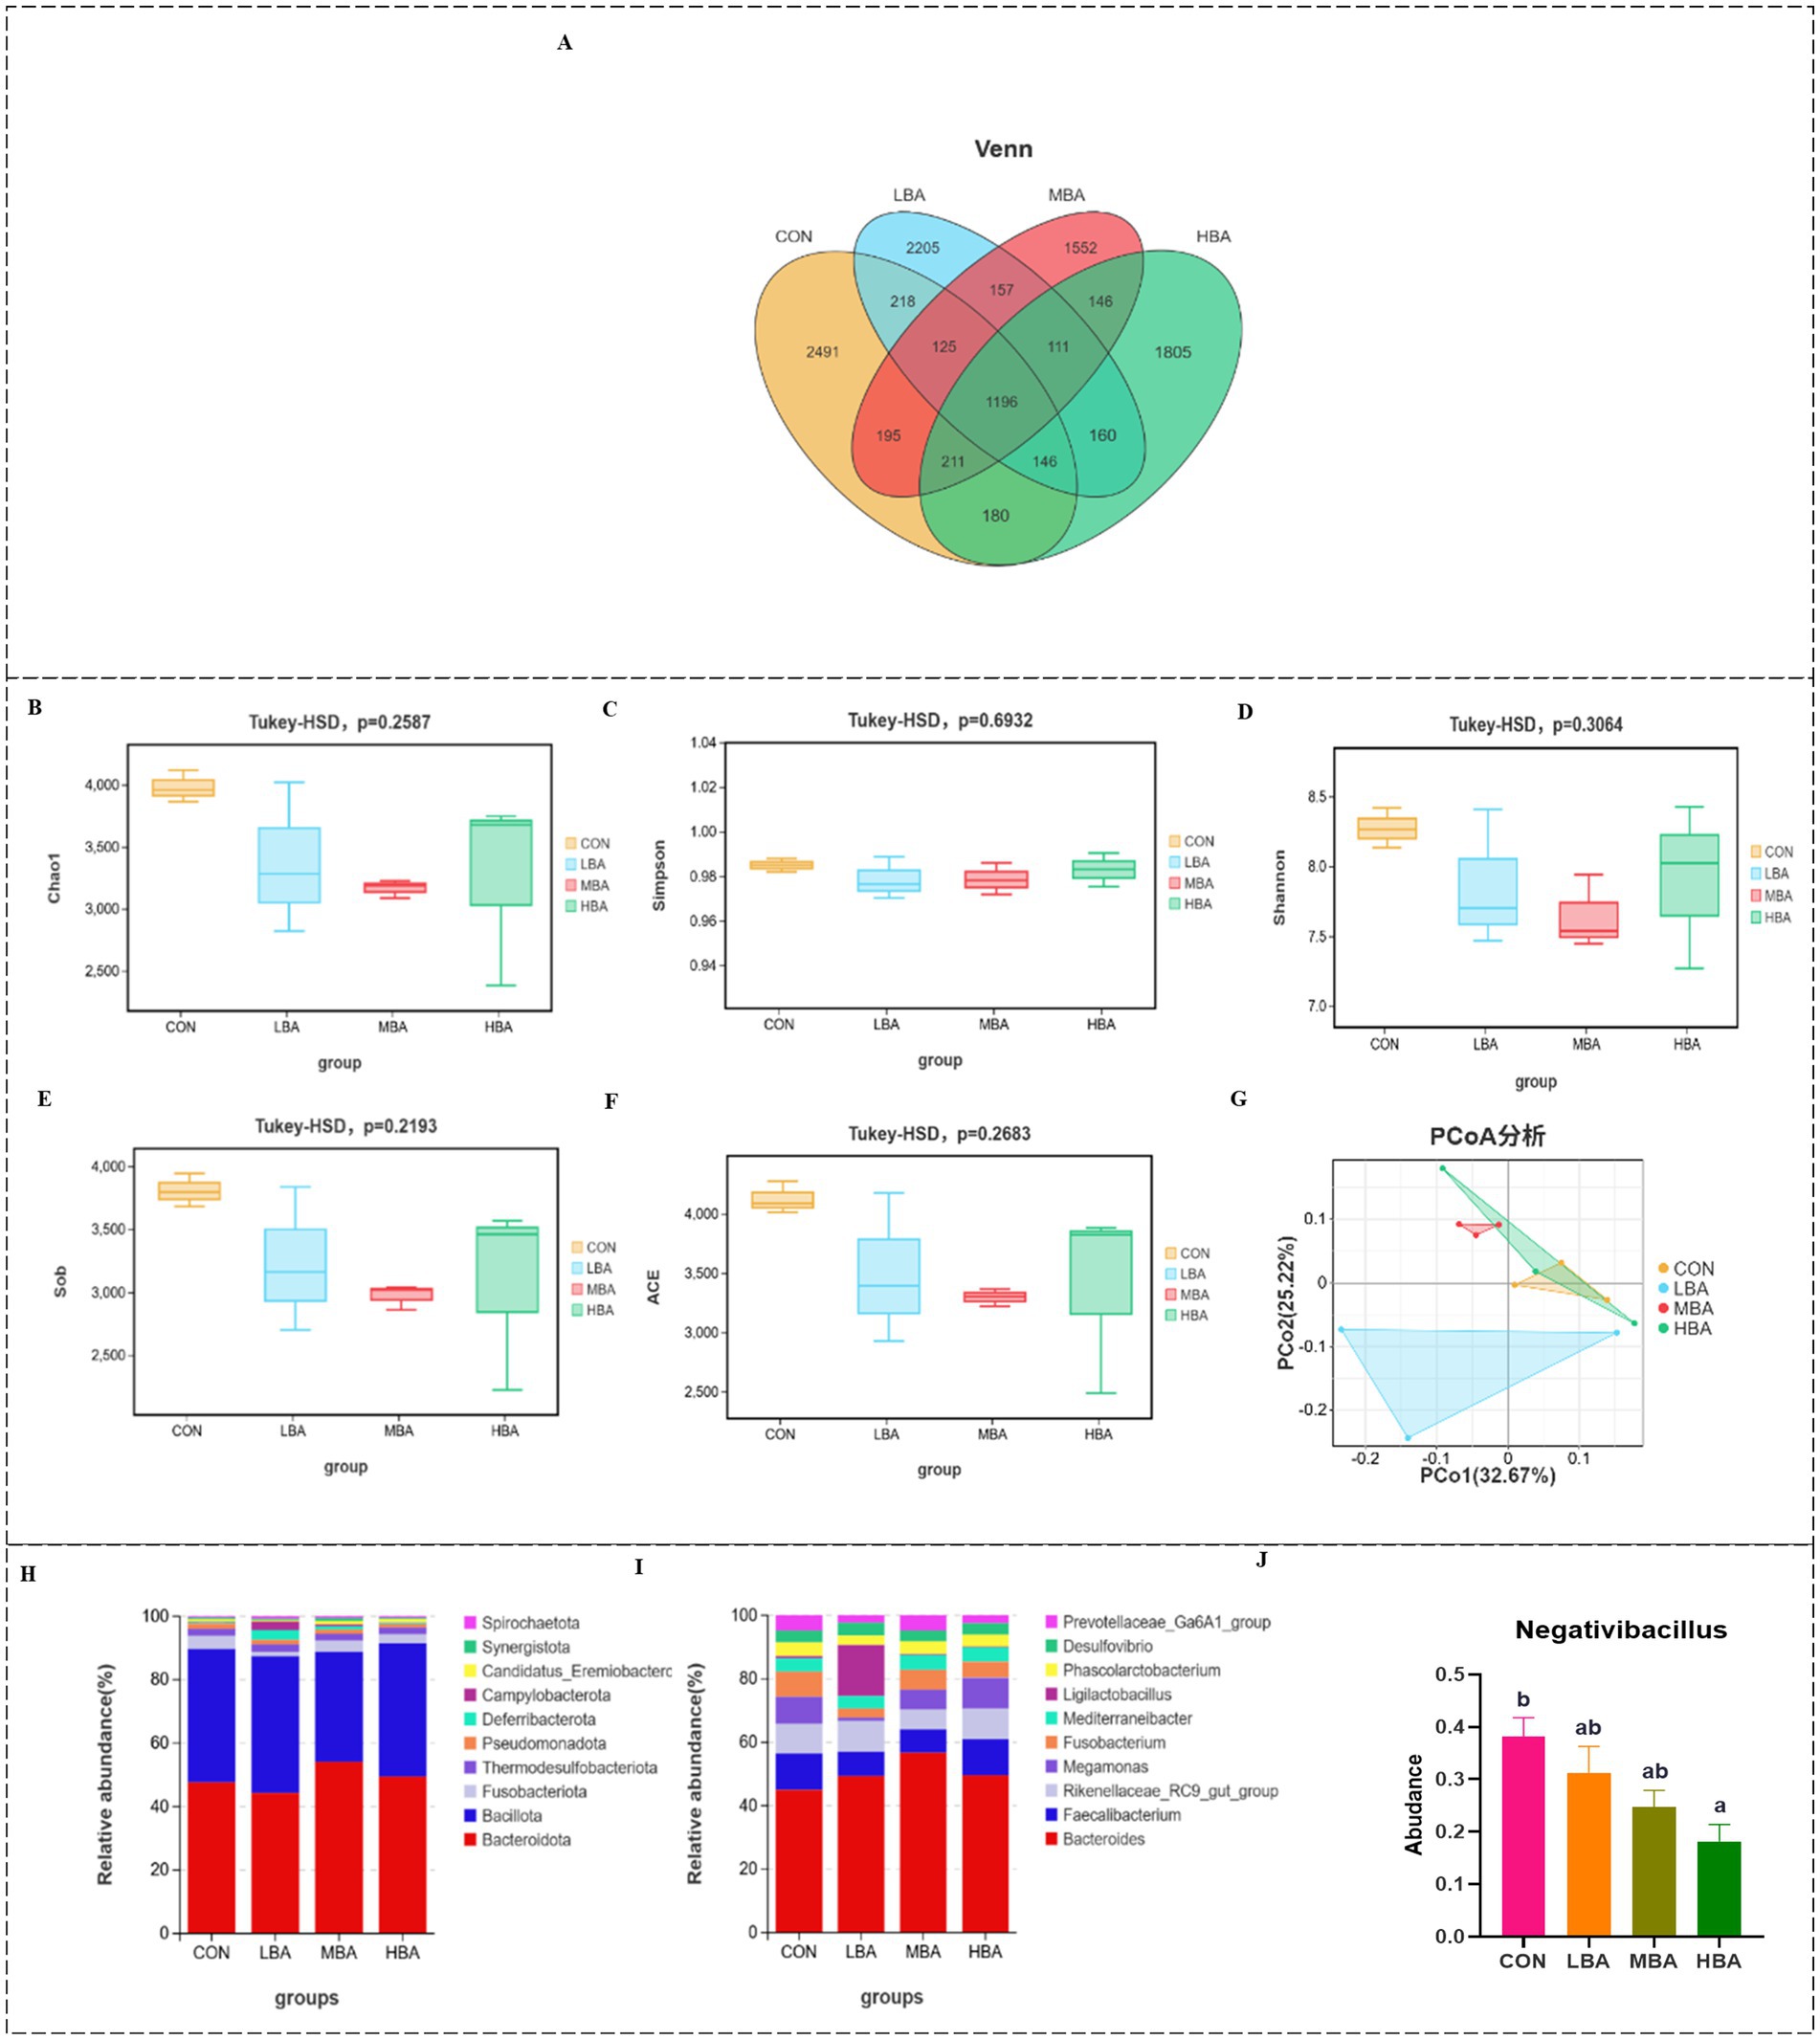
Figure 6. Effects of bitter almond on the bacterial community structure in the cecal contents of RBSL. (A) Venn diagram of OTUs in the cecal microbiota; (B–F) α-diversity of the cecal microbiota (Chao1, Simpson, Shannon, Sob, ACE); (G) β-diversity of the cecal microbiota; (H) species stacking plot of the cecal microbiota at the phylum level; (I) species stacking plot of the cecal microbiota at the genus level; (J) influence of the cecal microbiota (genus level). Among these, CON represents the control group, LBA represents the low-dose bitter almond group, MBA represents the medium-dose bitter almond group, and HBA represents the high-dose bitter almond group.
Based on antioxidant and immune results, we selected differential genera from the Bacillota phylum (Negativibacillus), differential metabolites in the tumor choline metabolism pathway (a metabolic pathway significantly enriched in both the MBA and HBA groups), antioxidant indicators, and immune indicators, and used Spearman test to analyze overall correlations. As shown in Figure 7, the genus Negativibacillus was significantly positively correlated with IgA, IgM, and GSH-Px. This is related to the fact that residual antigens still maintain immune stimulation after their abundance decreases.
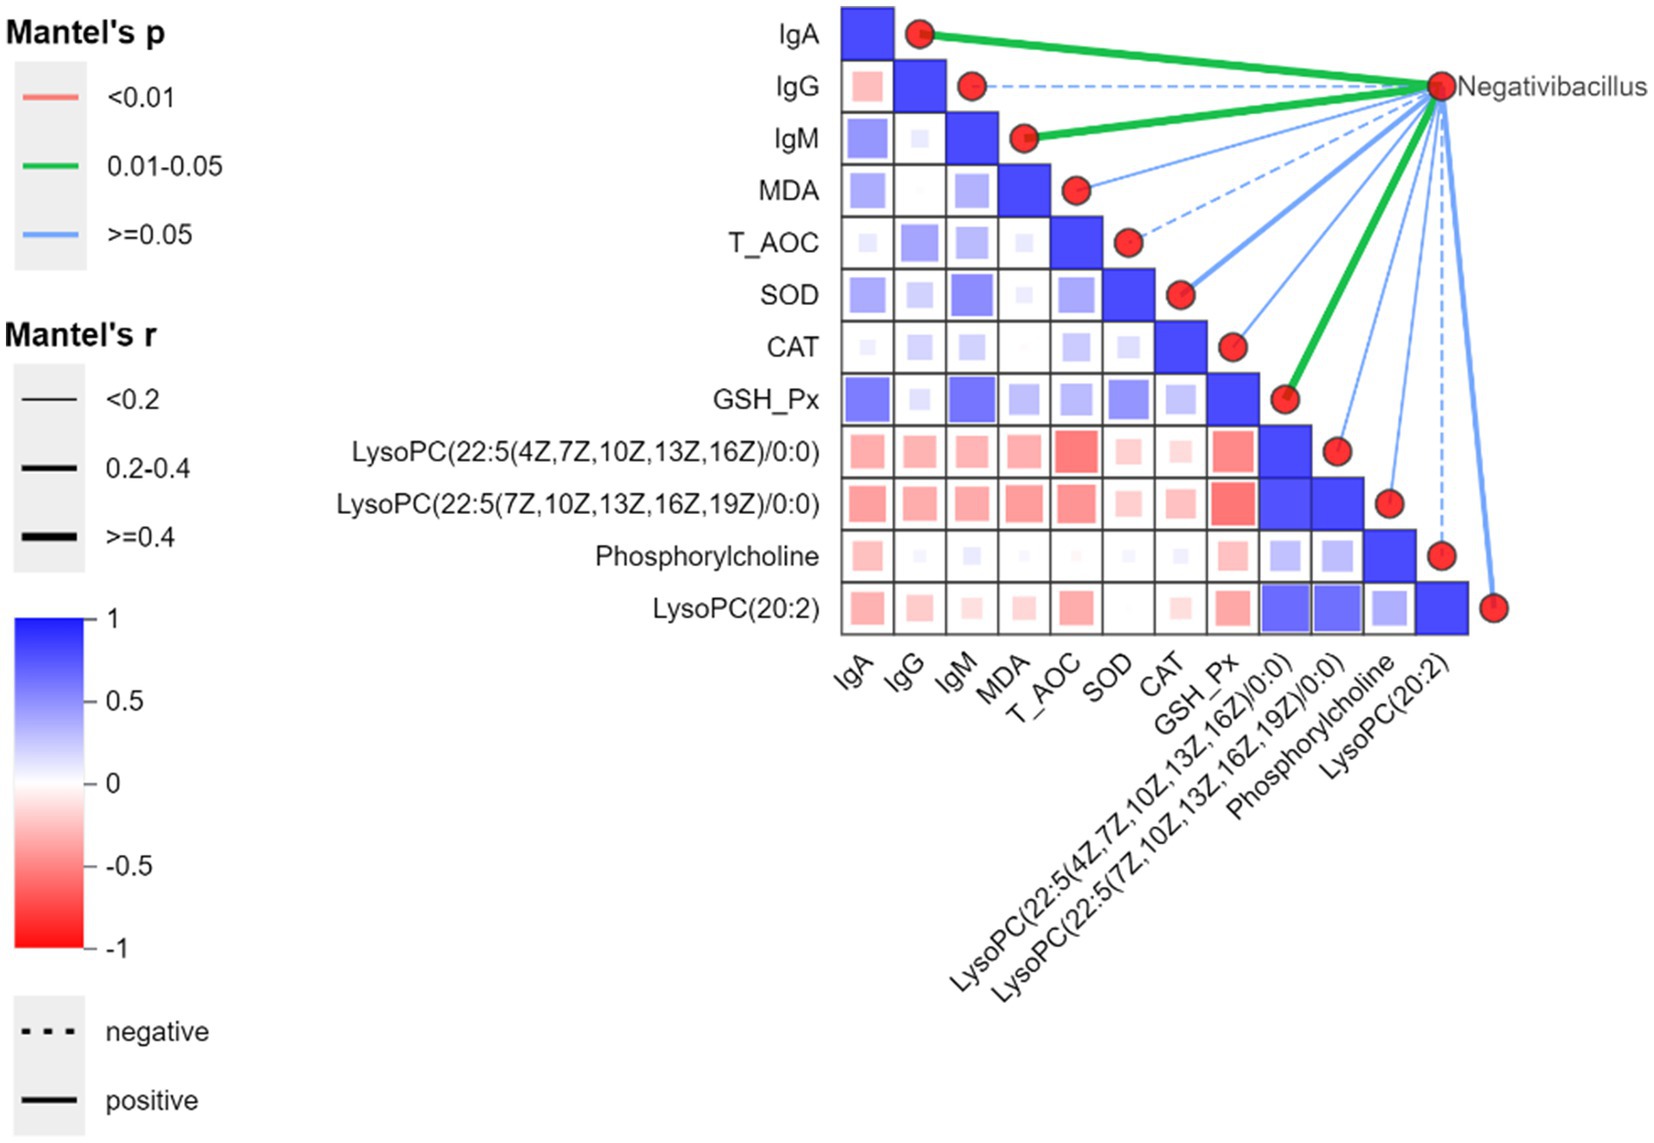
Figure 7. Spearman correlation heatmap at the genus level between bitter almond and RBSL. The color gradient represents Spearman correlation coefficients (red for positive correlations, blue for negative correlations). On the right, the network diagram displays correlations between environmental factors and species based on the Mantel test, where line width indicates the absolute value of the correlation coefficient (Mantel’s r), color represents the signifpicance p-value range of (Mantel’s p), and line style (solid/dashed) distinguishes between positive and negative correlations.