 Shaobo Tang1†
 Lei Chen2†Jun Wu3†Bin Chen1Shuang Liu1
 Mingna Duan1Dandan Jiang4Wei Gu5*Quanfu Zhang6*
 Xing Yang1*
- 1Integrated Laboratory of Pathogenic Biology, College of Preclinical Medicine, Dali University, Dali, China
- 2The Base for Control and Prevention of Plague and Brucellosis, Chinese Center for Disease Control and Prevention, Baicheng, Jilin, China
- 3Dali Bai Autonomous Prefecture People's Hospital Ophthalmology, Dali, Yunnan, China
- 4School of Public Health, Dali University, Dali, China
- 5Yunnan Provincial Department of Education Key Laboratory of Infectious Diseases, Department of Infection, The First Affiliated Hospital of Dali University, Dali, China
- 6Department of Gastroenterology, Clinical Medical College and the First Affiliated Hospital of Chengdu Medical College, Key Laboratory of Gastrointestinal Tumors and Microenvironment, Sichuan Provincial Universities, Chengdu, Sichuan, China
Fleas are among the most common hematophagous ectoparasites of mammals. In addition to causing allergic dermatitis and anemia, they can transmit various pathogens. Currently, molecular data on fleas remain relatively scarce. This study sequenced the complete mitochondrial genomes of Ctenophthalmus yunnanus (first mitogenome reported) and Frontopsylla diqingensis from Yunnan, China, using Illumina sequencing. Comparative analyses with existing flea mitogenomes available in NCBI included nucleotide diversity and selective pressure assessments. Phylogenetic trees were reconstructed based on the PCG123 and PCG12 datasets using the Maximum Likelihood (ML) and Bayesian Inference (BI) methods, respectively. The mitogenomes of C. yunnanus (15,801 bp) and F. diqingensis (15,878 bp) were circular double-stranded molecules. Both genomes comprised 37 genes. Analysis of the comparative genomic data revealed that most fleas examined possessed mitochondrial genomes approximately 16,000 bp in length, with an average AT content nearing 78%. Additionally, most species exhibited negative AT and GC skews. Among the 13 PCGs, the codons UUA, UUU, and AUU were used most frequently. Analysis of nucleotide diversity and selection pressure indicated that the cox1 gene exhibited the lowest values for both Pi and Ka/Ks. Phylogenetic analysis demonstrated that the families Ctenophthalmidae and Leptopsyllidae were paraphyletic. Divergence time estimation indicated that the most recent common ancestor of crown-group fleas diverged during the Cretaceous period, while the majority of extant lineages within Siphonaptera underwent diversification following the K-Pg boundary. This study provides valuable mitochondrial genomic data for fleas, which lays a foundation for future genetic and phylogenetic studies and advances our understanding of siphonapteran evolution.
1 Introduction
Fleas are obligate hematophagous parasites with a global distribution, whose host range includes wild animals such as rodents and Carnivora, as well as domestic livestock and poultry like dogs, cats, cattle, and sheep. Different flea species exhibit host specificity, while some are capable of cross-host parasitism, acting as critical links for disease transmission (1). As vectors of dual concern in veterinary medicine and public health, they not only directly impair the productivity of livestock and the health of companion animals but also form “animal-to-human” transmission chains through pathogen dissemination. This poses significant risks to regional veterinary prevention and control systems and public health security, causing prominent infestations in farming areas, companion animal communities, and other regions (2). The global annual expenditure on flea control for livestock, poultry, and companion animals exceeds $15 billion (3). In veterinary clinical practice, the harms caused by flea bites are well-documented: susceptible groups such as puppies and lambs may suffer from iron deficiency anemia due to acute blood loss, and even death in severe cases; adult livestock and poultry often develop skin lesions and secondary infections due to pruritus-induced scratching, which reduces milk yield, egg production, and the commercial value of fur-bearing animals; furthermore, salivary allergens from fleas can induce atopic dermatitis in dogs and cats, with its incidence showing an annual upward trend. Fleas are even more pivotal vectors for zoonotic diseases, and the pathogens they carry pose both veterinary prevention priorities and public health risks: Yersinia pestis (61) can bridge rodents and humans via domestic dogs and cats, serving as a key vehicle for plague spread; Bartonella (62) can circulate in cat populations and is associated with cat-scratch disease cases in humans worldwide; Rickettsia can cause spotted fever in dogs and typhus in humans; in addition, the larvae of Dipylidium caninum (Linnaeus, 1758) can utilize fleas to form a “flea-animal-human” parasitic chain, which mainly infects puppies and children (4–7). Flea infestations have constrained the efficiency of livestock farming and compromised the welfare of companion animals. The diseases they transmit often trigger regional epidemics, posing challenges to veterinary epidemic surveillance. The continuous emergence of new and recurrent flea-borne diseases underscores the urgent need to enhance monitoring and research on flea vectors. Consequently, establishing an efficient and precise flea species database will not only provide essential foundational data for the prevention and control of flea-transmitted diseases but will also significantly advance the development of flea biodiversity research and phylogenetic analysis (8).
Currently, the classification and identification of fleas predominantly rely on morphological characteristics (9). However, this approach faces significant challenges in accurately distinguishing closely related and cryptic species. Due to the widespread occurrence of morphological specialization among flea species, coupled with their highly mixed distribution patterns—where multiple flea species can simultaneously parasitize different hosts—significant genetic variation may arise among populations. This phenomenon is particularly pronounced in flea populations that parasitize distinct hosts or are geographically dispersed. Such populations often exhibit subtle morphological differences, which can complicate traditional morphological identification methods and potentially lead to erroneous conclusions regarding species identification (10). The mitochondrial genome serves as an ideal molecular marker because it has significant characteristics, including a compact genome size, highly conserved sequences, and strict maternal inheritance. These features enable it to effectively address the limitations of traditional morphological identification methods, thereby demonstrating unique advantages in flea taxonomy research. In particular, the mitochondrial genome plays a crucial role in overcoming challenges such as differentiating closely related species and reconstructing higher-order phylogenetic relationships. As a result, it has emerged as an indispensable molecular marker, providing essential molecular biological evidence for refining the flea classification system and advancing phylogenetic studies (11–14). However, current research on the mitochondrial genomes of fleas continues to face significant data gaps. Notably, the analysis of the mitochondrial genomes has made considerably less progress. Within the classification system of fleas, representative species from most family and genus-level taxonomic units lack mitochondrial genomic data. This deficiency not only hinders the phylogenetic reconstruction of fleas based on molecular markers but also imposes substantial limitations on accurate species identification. Furthermore, this lack of data complicates in-depth investigations into flea molecular systematics, particularly in critical areas such as higher-order meta-taxonomic relationship analysis and species-level identification, where significant challenges remain.
In this research, (I) we sequenced the mitochondrial genomes of Ctenophthalmus yunnanus (60) and Frontopsylla diqingensis (15). Subsequent analyses focused on their structural features, base composition, and codon usage preferences. (II) Furthermore, leveraging available mitochondrial genome data of fleas, we assessed nucleotide diversity and evolutionary rates across flea taxa with characterized mitochondrial genomes. (III) Concurrently, we conducted comparative analyses of flea mitochondrial genomes retrieved from the NCBI database, constructed phylogenetic trees using the concatenated nucleotide sequences of all codon positions of 13 protein-coding genes (PCG123) and the concatenated nucleotide sequences of the first and second codon positions of 13 protein-coding genes (PCG12) via maximum likelihood (ML) and Bayesian inference (BI) methods. And ultimately performed divergence time estimation. This not only enriched the flea mitochondrial genome database but also laid a foundation for flea species identification, population genetics, and phylogenetic studies.
2 Methods
2.1 Sample collection, morphological identification and DNA extraction
A total of 28 specimens of C. yunnanus were collected from Gongshan Dulong and Nu Autonomous County in the Nujiang Lisu Autonomous Prefecture of Yunnan Province in China (27°44′21.2″N, 98°40′2.2″E). Additionally, F. diqingensis was collected from Fugong County within the same prefecture (26°54′20.8″N, 98°52′4.3″E), comprising 27 individuals. In addition, the samples of these fleas were gathered from the nests of the animals (Statement: This study was approved by the Animal Ethics Committee of Dali University. Application number: 2023-SL-280, Approval number: 2023-P2-280). The collected fleas were immersed in 75% ethanol and then kept in a - 20 °C freezer for subsequent experiments. Flea specimens were identified by professional taxonomists based on morphological characteristics described in “Fauna Sinica Insecta Siphonaptera” (15) (C. yunnanus possesses a frontal tubercle situated below the midpoint of the frontal margin, with no small notch present between the frontal tubercle and the oral angle. The frontal bristles consist of one row of five bristles. The occipital bristles are arranged in three rows, comprising 2, 2–3, and 5 bristles, respectively. The labial palps are relatively long, extending nearly to the end of the fore coxae. The pronotal comb typically bears 17 spines. The pronotum of the mesothorax has 5–6 pseudosetae on the cervical sclerite. The metepimeron of the metathorax bears five bristles. The fore coxa has 25–30 bristles on the outer surface. The second tarsomere of the hind leg is approximately equal in length to the combined length of the third and fourth tarsomeres. Tergites I-VII each bear two rows of bristles. Tergites II-VII each have one bristle below the spiracle. The apical spinules on tergites I-IV are arranged as follows: 2, 2, 1–2, and 0–1, respectively. F. diqingensis possesses a frontal tubercle situated below the midpoint of the frontal margin. The frontal bristles number 6–7. The marginal occipital bristles number 5–7. The labial palps reach or nearly reach the apex of the fore coxa. The pronotal comb consists of 19–22 spines, with the dorsal spines longer than or subequal to the dorsal margin of the pronotum. The metanotum bears 2–3 apical spinules. The metepisternum bears 6–9 bristles arranged in two rows. The outer surface of the hind tibia bears 12–20 bristles arranged in two or three rows. The apical long bristle of the second tarsomere of the hind leg reaches approximately the midpoint of the fourth tarsomere. Tergites I-VII bear 2–3 rows of bristles). Microscopic photography of the diagnostic features of C. yunnanus and F. diqingensis was performed using an SZ2-ILST dissecting microscope (Olympus, Tokyo, Japan). All type specimens are preserved at the Institute of Pathogen and Vector Biology, Dali University (Collection numbers: DLU230820 and DLU230821). Total genomic DNA was extracted using the TIANamp Genomic DNA Kit (TIANGEN, Beijing, China), adhering to the manufacturer’s protocol.
2.2 Sequence, assembly, and annotation analysis
The Illumina NovaSeq 6,000 platform, serviced by Shanghai Biotechnology Co., LTD, was utilized to conduct paired-end (PE) sequencing, with one library generated for each sample, featuring a read length of 150 bp. The raw data acquired through sequencing were counted, and the analysis was conducted employing FastQC software for quality control. To guarantee the quality of the ensuing information analysis, the raw data underwent filtering to produce high-quality sequences (clean data). The A5-miseq v20150522 program was utilized to assemble the complete mitochondrial genome. After sequencing on an Illumina platform, we annotated the genomes with MITOS (16, 17), and then the sequences were blasted against the NCBI database to further confirm the locations of the 37 genes. The secondary structures of 22 tRNA genes in C. yunnanus and F. diqingensis were predicted using tRNAscan-SE v.2.0 and ARWEN v.1.2.3 (18, 19). The mitochondrial genome sequences of C. yunnanus and F. diqingensis have been submitted to GenBank under accession numbers OR780664 and OR780662, respectively.
The base composition was calculated using DNAstar v6 software, and the AT and GC skew were then computed using these formulas: AT-skew = (A − T)/ (A + T) and GC-skew = (G − C)/ (G + C). The relative synonymous codon usage (RSCU) of the 13 PCGs was analyzed using CodonW 1.4.2. Furthermore, the DNAsp v6 software was utilized to conduct a sliding-window analysis for assessing nucleotide diversity (20), using a sliding window length of 200 and a step size of 20. This software was further utilized to compute the ratios of non-synonymous (Ka) to synonymous (Ks) substitutions for the 13 PCGs, enabling the analysis of the evolutionary rate through the Ka/Ks ratio.
2.3 Phylogenetic analysis
Using Boreus elegans (HQ696579) as the outgroup, a phylogenetic analysis was conducted between C. yunnanus and F. diqingensis investigated in this study and the flea sequences from seven families available in the NCBI database (Supplementary Table S4). Two data matrices were used: (I) the concatenated nucleotide sequences of all codon positions of 13 protein-coding genes (PCG123); and (II) the concatenated nucleotide sequences of the first and second codon positions of 13 protein-coding genes (PCG12). For each matrix, phylogenetic trees were reconstructed using both ML and BI methods. The sequences of the PCG123 and PCG12 datasets were aligned separately using MAFFT. In the ML analysis, the best-fit models were determined using ModelFinder (21): GTR + F + R4 (PCG123 dataset) and GTR + F + I + G4 (PCG12 dataset). ML phylogenetic trees were built in IQ-TREE v.1.6.12, with branch support estimated by 1,000 bootstrap replicates. BI analysis was performed using MrBayes v.3.2.7, running four independent Markov chain Monte Carlo (MCMC) chains for 1,000,000 generations and sampling every 1,000 generations. The first 25% of samples were discarded as burn-in. Finally, the phylogenetic trees were visualized and graphically optimized using the online tool iTOL (https://itol.embl.de/itol.cgi) (22).
2.4 Divergence time estimations
Divergence time estimation was performed using BEAST v10.5.0 software, based on the dataset of 13 PCGs from the mitochondrial genomes of flea species in this study. First, ModelFinder was employed to screen for the optimal model for the sequences (21). Subsequently, in the BEAUti module, the optimal substitution model was set as the GTR model, and the Uncorrelated Relaxed Clock model was adopted as the clock model. For the tree prior, the Yule Process was selected, with the Prior Distribution specified as an exponential distribution to facilitate divergence time estimation. Due to the limited fossil record and molecular sequence data of fleas, this study selected the following amber fossil specimens as calibration points to establish the evolutionary timeframe of the order Siphonaptera: (1) The flea genus Pulex Linnaeus, 1758: A female flea fossil, Pulex larimerius, found in Dominican amber, exhibits highly consistent morphological characteristics with extant members of Pulex. Mammalian hairs preserved alongside the fossil provide ecological evidence for host association. Although the fossil is attributed to the Miocene, the geological age of Dominican amber remains highly controversial, with estimated ranges varying between 20 and 15 Mya (Iturralde–Vinent and MacPhee, 1996) and 45–30 Mya (Schlee, 1990). To fully account for this dating uncertainty, the calibration range for this node was set to 35–15 Mya (23, 24). (2) Ctenophthalmidae: Fossil specimens of several species of the genus Palaeopsylla (family Ctenophthalmidae) have been discovered in Baltic amber. Furthermore, the geological age of Baltic amber is consistently determined by the academic community to be 40–35 Mya (25, 26). Thus, the calibration point is set at 40–35 Mya. The MCMC simulation was set to run for 40,000,000 generations, with sampling conducted every 1,000 generations. The Tracer v1.7.2 software was then used to check the ESS values of each parameter, thereby evaluating the reliability of the simulation results. Next, the TreeAnnotator program was executed, where the first 10% of burn-in samples were discarded before generating the divergence time tree. Finally, the constructed divergence time tree was visualized and edited using tvBOT (27).
3 Results
3.1 The mitochondrial genome characterization of Ctenophthalmus yunnanus and Frontopsylla diqingensis
In this research, we acquired the mitochondrial genomic sequences for C. yunnanus and F. diqingensis. The characteristics observed are consistent with those of previously reported flea mitochondria, exhibiting a typical closed ring double-stranded structure (28, 29). The lengths of the two genomes are 15,801 bp and 15,878 bp, respectively (Figure 1). Each genome includes a total of 37 genes: 13 PCGs, 22 transfer RNA (tRNA) genes, and 2 ribosomal RNA (rRNA) genes, along with non-coding regions. Out of these 37 genes, nine PCGs (nad2, cox1, cox2, atp8, atp6, cox3, nad3, nad6, and cytb) and 14 tRNAs (trnI, trnM, trnW, trnL2, trnK, trnD, trnG, trnA, trnR, trnN, trnS1, trnE, trnT, and trnS2) are situated on the H chain. The four remaining PCGs (nad5, nad4, nad4L, and nad1), together with eight tRNAs (trnQ, trnC, trnY, trnF, trnH, trnP, trnL1, and trnV) and two rRNAs (rrnL and rrnS) are located on the L chain. The mitochondrial genome of C. yunnanus contains 13 gene overlapping regions, with a total length of 38 bp (length range: 1–8 bp). The longest overlapping region occurs between trnW and trnC, measuring 8 bp. Additionally, there are 7 intergenic spacer regions totaling 159 bp (length range: 1–81 bp), with the longest spacer located between trnE and trnF, measuring 81 bp. In comparison, the mitochondrial genome of F. diqingensis features 12 gene overlapping regions, totaling 30 bp (length range: 1–7 bp), with the longest overlapping regions occurring between atp8 and atp6, as well as nad4 and nad4L. There are 13 intergenic spacer regions, totaling 128 bp (length range: 1–31 bp), with the longest spacer situated between trnQ and trnM, measuring 31 bp (Supplementary Table S1). The nucleotide composition of the mitochondrial genome of C. yunnanus is as follows: A = 39.05%, T = 40.31%, G = 7.97%, and C = 12.67%, resulting in A + T = 79.36%, AT-skew = −0.016, G + C = 20.64%, and GC-skew = −0.228. And the mitochondrial genome of F. diqingensis has the following nucleotide composition: A = 38.28%, T = 41.05%, G = 8.12%, and C = 12.55%. This results in a combined A + T content of 79.33%, an AT-skew value of −0.035, a G + C content of 20.67%, and a GC-skew of −0.215. Notably, the AT content is considerably greater than the GC content in both flea species, suggesting a strong AT bias (Supplementary Table S2).
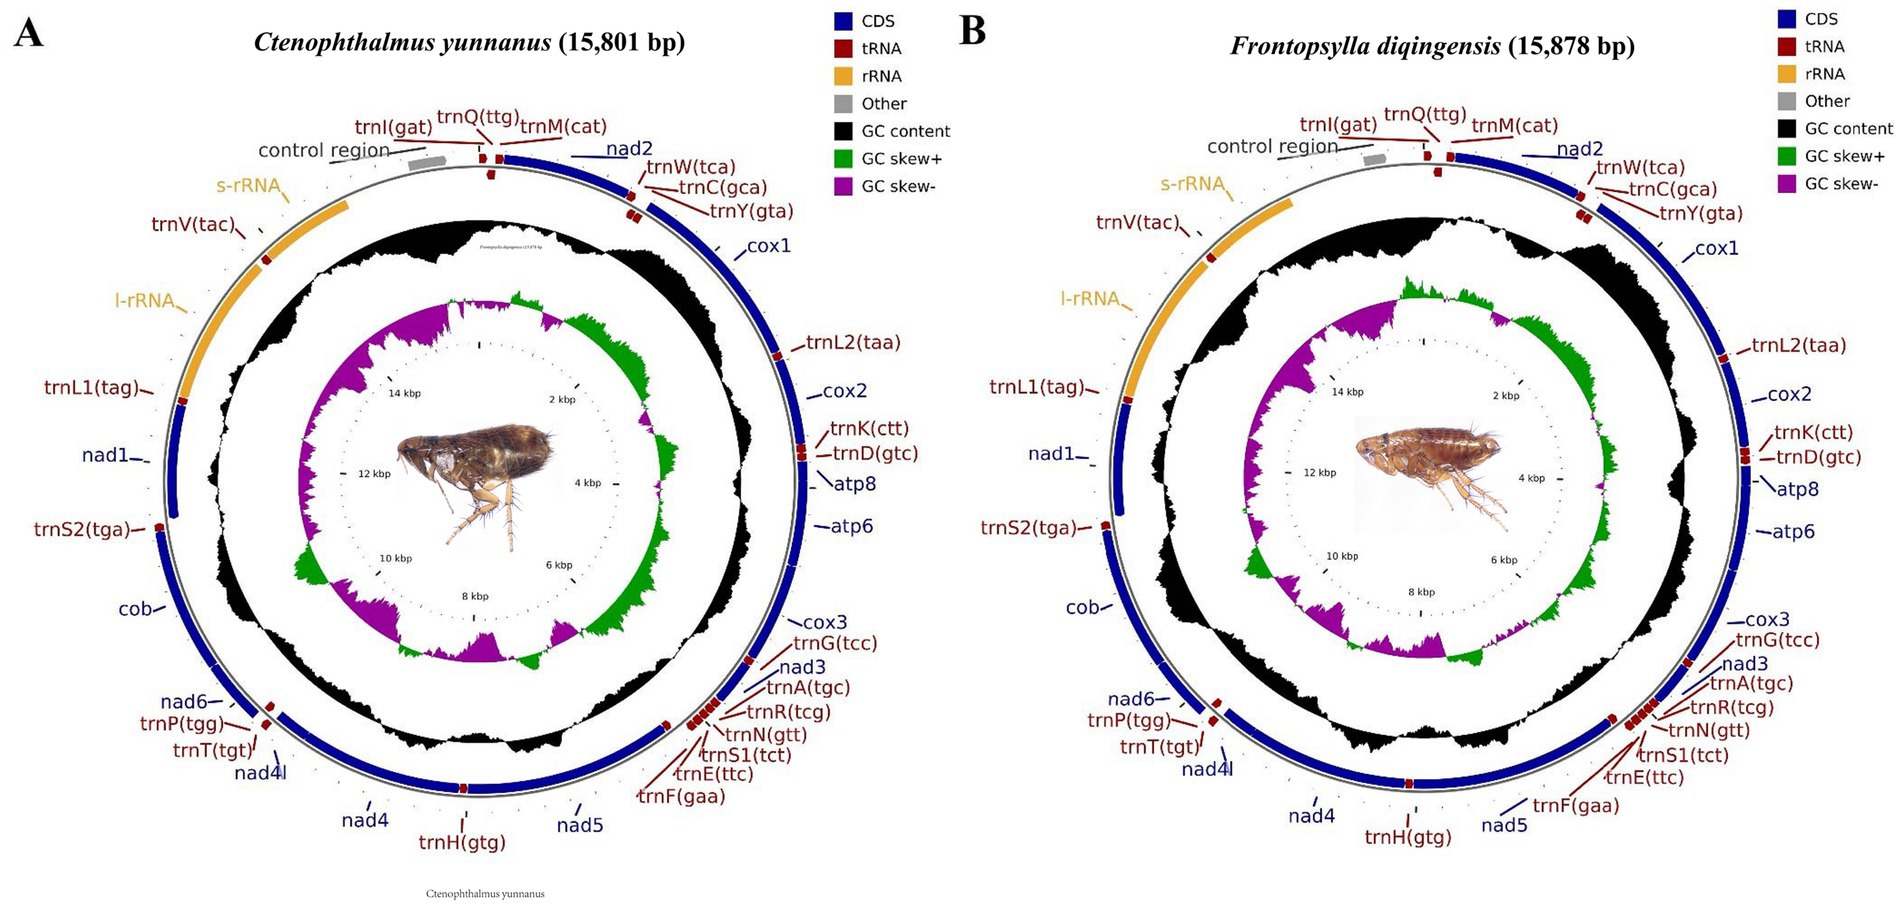
Figure 1. Circular map and organization of the mitochondrial genome of Ctenophthalmus yunnanus (A) and Frontopsylla diqingensis (B).
3.2 Protein-coding genes (PCGs): lengths, start/stop codons, codon usage (RSCU), and base composition/skews
The total lengths of the 13 PCGs in C. yunnanus and F. diqingensis are 11,118 bp and 11,143 bp, respectively, which account for 70.36 and 70.18% of the total length of their mitochondrial genomes. Among these genes, nad5 is the longest, measuring 1,714 bp and 1,734 bp for C. yunnanus and F. diqingensis, respectively, while atp8 is the shortest, at 159 bp and 162 bp, respectively. Both species use the ATN (N = A, T, G, C) start codon. Whereas TAA is the predominant termination codon, exceptions include: the use of an incomplete T codon in C. yunnanus (cox2, nad5, nad4) and F. diqingensis (nad4); and the use of TAG in C. yunnanus (cytb) and F. diqingensis (nad3). In addition, the nucleotide skews of the 13 PCGs of C. yunnanus were all negative for AT-skew, with a skew range of −0.187 (cox3) to −0.049 (cox2), and negative for GC-skew, except for nad5, nad4, nad4L, and nad1, with a skew range of - 0.325 (nad6) to 0.680 (nad4L). Similarly, the nucleotide skews of the 13 PCGs of F. diqingensis were all negative for AT-skew as well, with a skew range of −0.252 (nad3) to −0.068 (atp8), and GC-skew was also negative except for nad5, nad4, nad4L and nad1, with a skew range of −0.315 (nad3) to 0.591 (nad4L) (Supplementary Tables S1, S2).
In the comparative analysis of 13 PCGs between C. yunnanus and F. diqingensis, significant differences and similarities in codon usage bias were observed. The mitochondrial genome of C. yunnanus encodes a total of 3,544 codons (excluding stop codons), among which 26 codons have an RSCU value greater than 1. The codon UUA exhibits the highest RSCU value of 3.81. The most frequently used codons are AUU, UUU, UUA, AAU, and UAU, with AUU appearing most often (363 times), while GCG is not used at all. In contrast, F. diqingensis encodes 3,653 codons (excluding stop codons), also with 26 codons showing an RSCU value above 1. Here, UUA demonstrates an even stronger bias with an RSCU value of 4.54. The most common codons are UUA, AUU, UUU, AUA, and AAU, with UUA being used most frequently (384 times). Similarly, GCG is not utilized. In both species, leucine (Leu), isoleucine (Ile), phenylalanine (Phe), and serine (Ser) are the most abundantly used amino acids. However, differences are noted in the least used amino acids: in C. yunnanus, arginine (Arg), glutamine (Gln), and histidine (His) are the least frequent, whereas in F. diqingensis, aspartic acid (Asp), cysteine (Cys), glutamine (Gln), and arginine (Arg) are the least utilized (Figure 2; Supplementary Table S3).
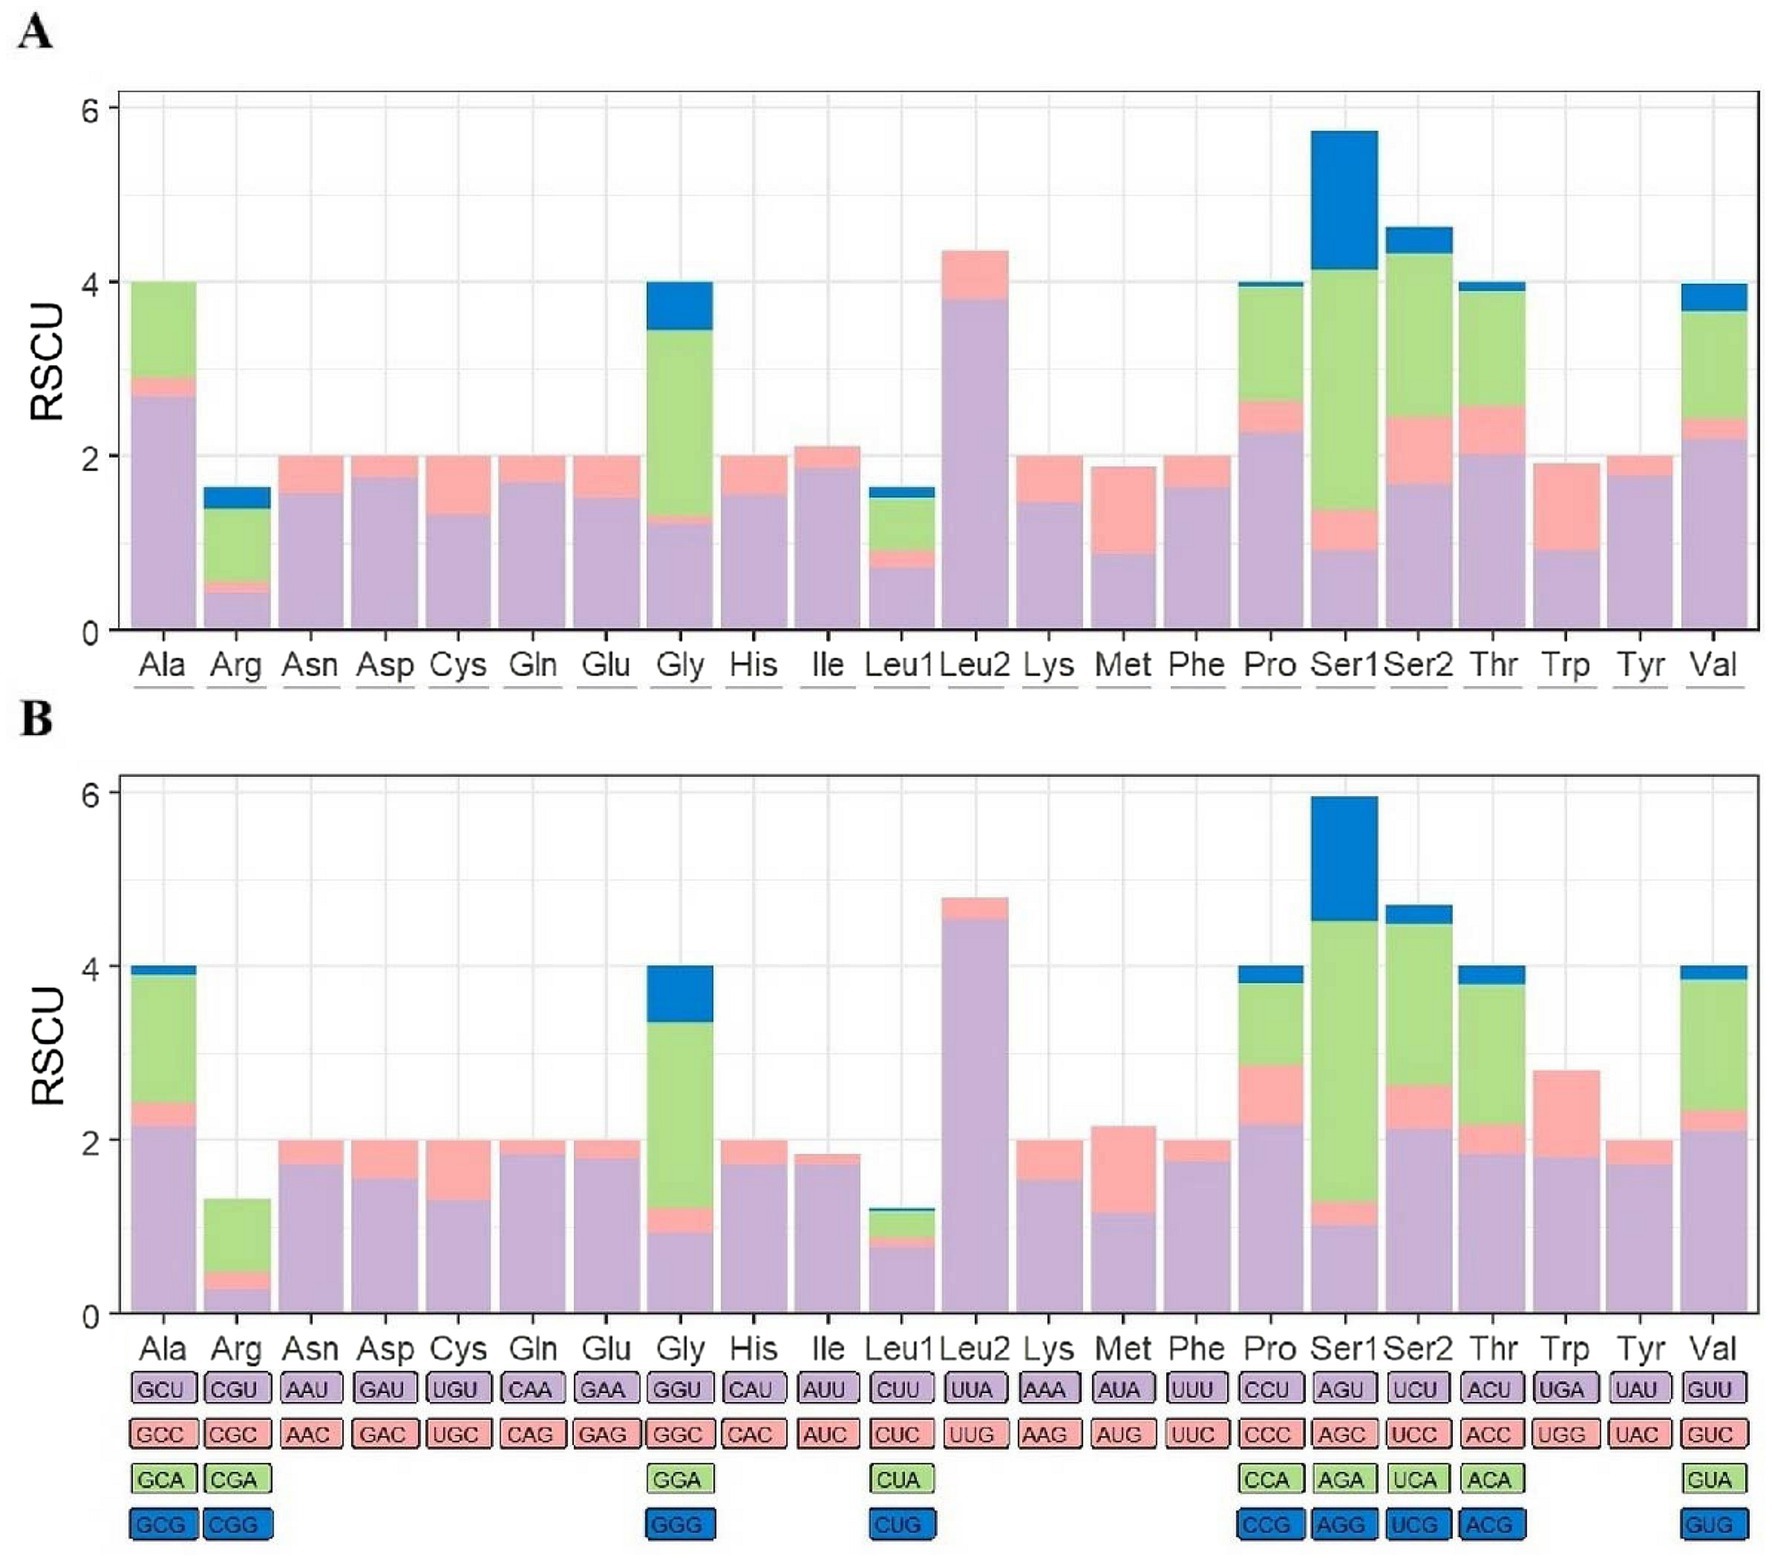
Figure 2. Ctenophthalmus yunnanus (A) and Frontopsylla diqingensis (B) protein-coding gene relative synonymous codon usage (RSCU).
3.3 Transfer and ribosomal RNA genes (tRNAs and rRNAs): structures and compositional features
Among the 22 tRNAs of C. yunnanus and F. diqingensis, 14 tRNAs are located on the H chain and 8 tRNAs are located on the L chain. Except for trnS1, which lacks the DHU arm, the remaining 21 tRNAs exhibit the typical cloverleaf structure. For C. yunnanus, the tRNA length ranges from 61 to 72 bp, with trnC being the shortest and trnK the longest. The A + T content is 80.07%, and both the AT-skew and GC-skew exhibit positive values. There are a total of 19 base mismatches, with G-U mismatches being the most frequent, occurring 15 times, followed by U–U mismatches, which occur 4 times. As for F. diqingensis, the tRNA length ranges from 62 to 70 bp, with trnG and trnL1 as the shortest and trnK as the longest. The A + T content for this species is 80.19%, and similarly, both the AT-skew and GC-skew are also positive. The predicted tRNA secondary structures exhibited a total of 21 non-canonical base pairings, comprising 17 G-U wobble pairs and 4 U–U mismatches (Supplementary Tables S1, S2 and Supplementary Figure S1).
The rRNA genes of C. yunnanus and F. diqingensis comprise both rrnL and rrnS, with the trnV gene located between them. The length of the 16S rRNA in C. yunnanus is 1,251 bp, whereas the 12S rRNA is 780 bp long. The AT content for the 16S rRNA and the 12S rRNA stands at 81.85 and 80.90%, respectively, and with both the negative AT-skew and positive GC-skew. In F. diqingensis, the 16S rRNA has a length of 1,281 bp, with the 12S rRNA measuring 786 bp. The AT content for the 16S rRNA in this species is 82.98%, while for the 12S rRNA, it is 81.30%. Additionally, both the AT-skew and GC-skew values for these two rRNAs are positive (Supplementary Tables S1, S2).
3.4 Comparative mitochondrial genomics analysis of the fleas
In this study, we compared C. yunnanus and F. diqingensis with the mitochondrial genomes of the flea species published on NCBI in terms of genome length, AT and GC content, base skew of the nucleotide sequence and the codon usage frequency of the PCGs. We found that the mitochondrial genome lengths of most flea species are approximately 16,000 bp. However, we observed that Pulex irritans, Ctenocephalides orientis, C. felis felis, C. felis, Xenopsylla cheopis, and Ceratophyllus wui possess significantly longer mitochondrial genomes compared to other flea species. In terms of AT content and base skew of nucleotide sequences, the majority of flea species examined in this study exhibited an AT content of approximately 78%. However, the AT content for C. orientis (83.21%), C. felis felis (82.88%), C. felis (83.13%), and X. cheopis (82.83%) was significantly higher than that of the other flea species. Furthermore, we observed that, except for the AT-skew (0.001) of Neopsylla specialis and both the AT-skew (0.024) and GC-skew (0.248) of Leptopsylla segnis were positive, the AT-skew and GC-skew were negative for the remaining flea species included in this study (Supplementary Table S4). Additionally, we analyzed the codon usage frequency of the PCGs across these flea species. The analysis revealed that among the 13 PCGs, the codons UUA, UUU, and AUU were utilized more frequently (Figure 3).

Figure 3. Heat map of codon usage frequency.
3.5 Nucleotide diversity analysis and non-synonymous/synonymous (Ka/Ks) substitution ratio
Analysis of the 13 PCGs revealed that the Ka/Ks ratio was less than 1 for all genes. Among them, atp8 exhibited the highest Ka/Ks value, followed by nad5, nad4, nad4L, and nad2, whereas cox1 had the lowest. This pattern indicates that all 13 PCGs are under purifying selection (Figure 4A). Additionally, nad5, nad6, and nad2 displayed the highest nucleotide diversity (Pi > 0.30), while cox1 exhibited the lowest Pi value (Pi < 0.13) (Figure 4B).
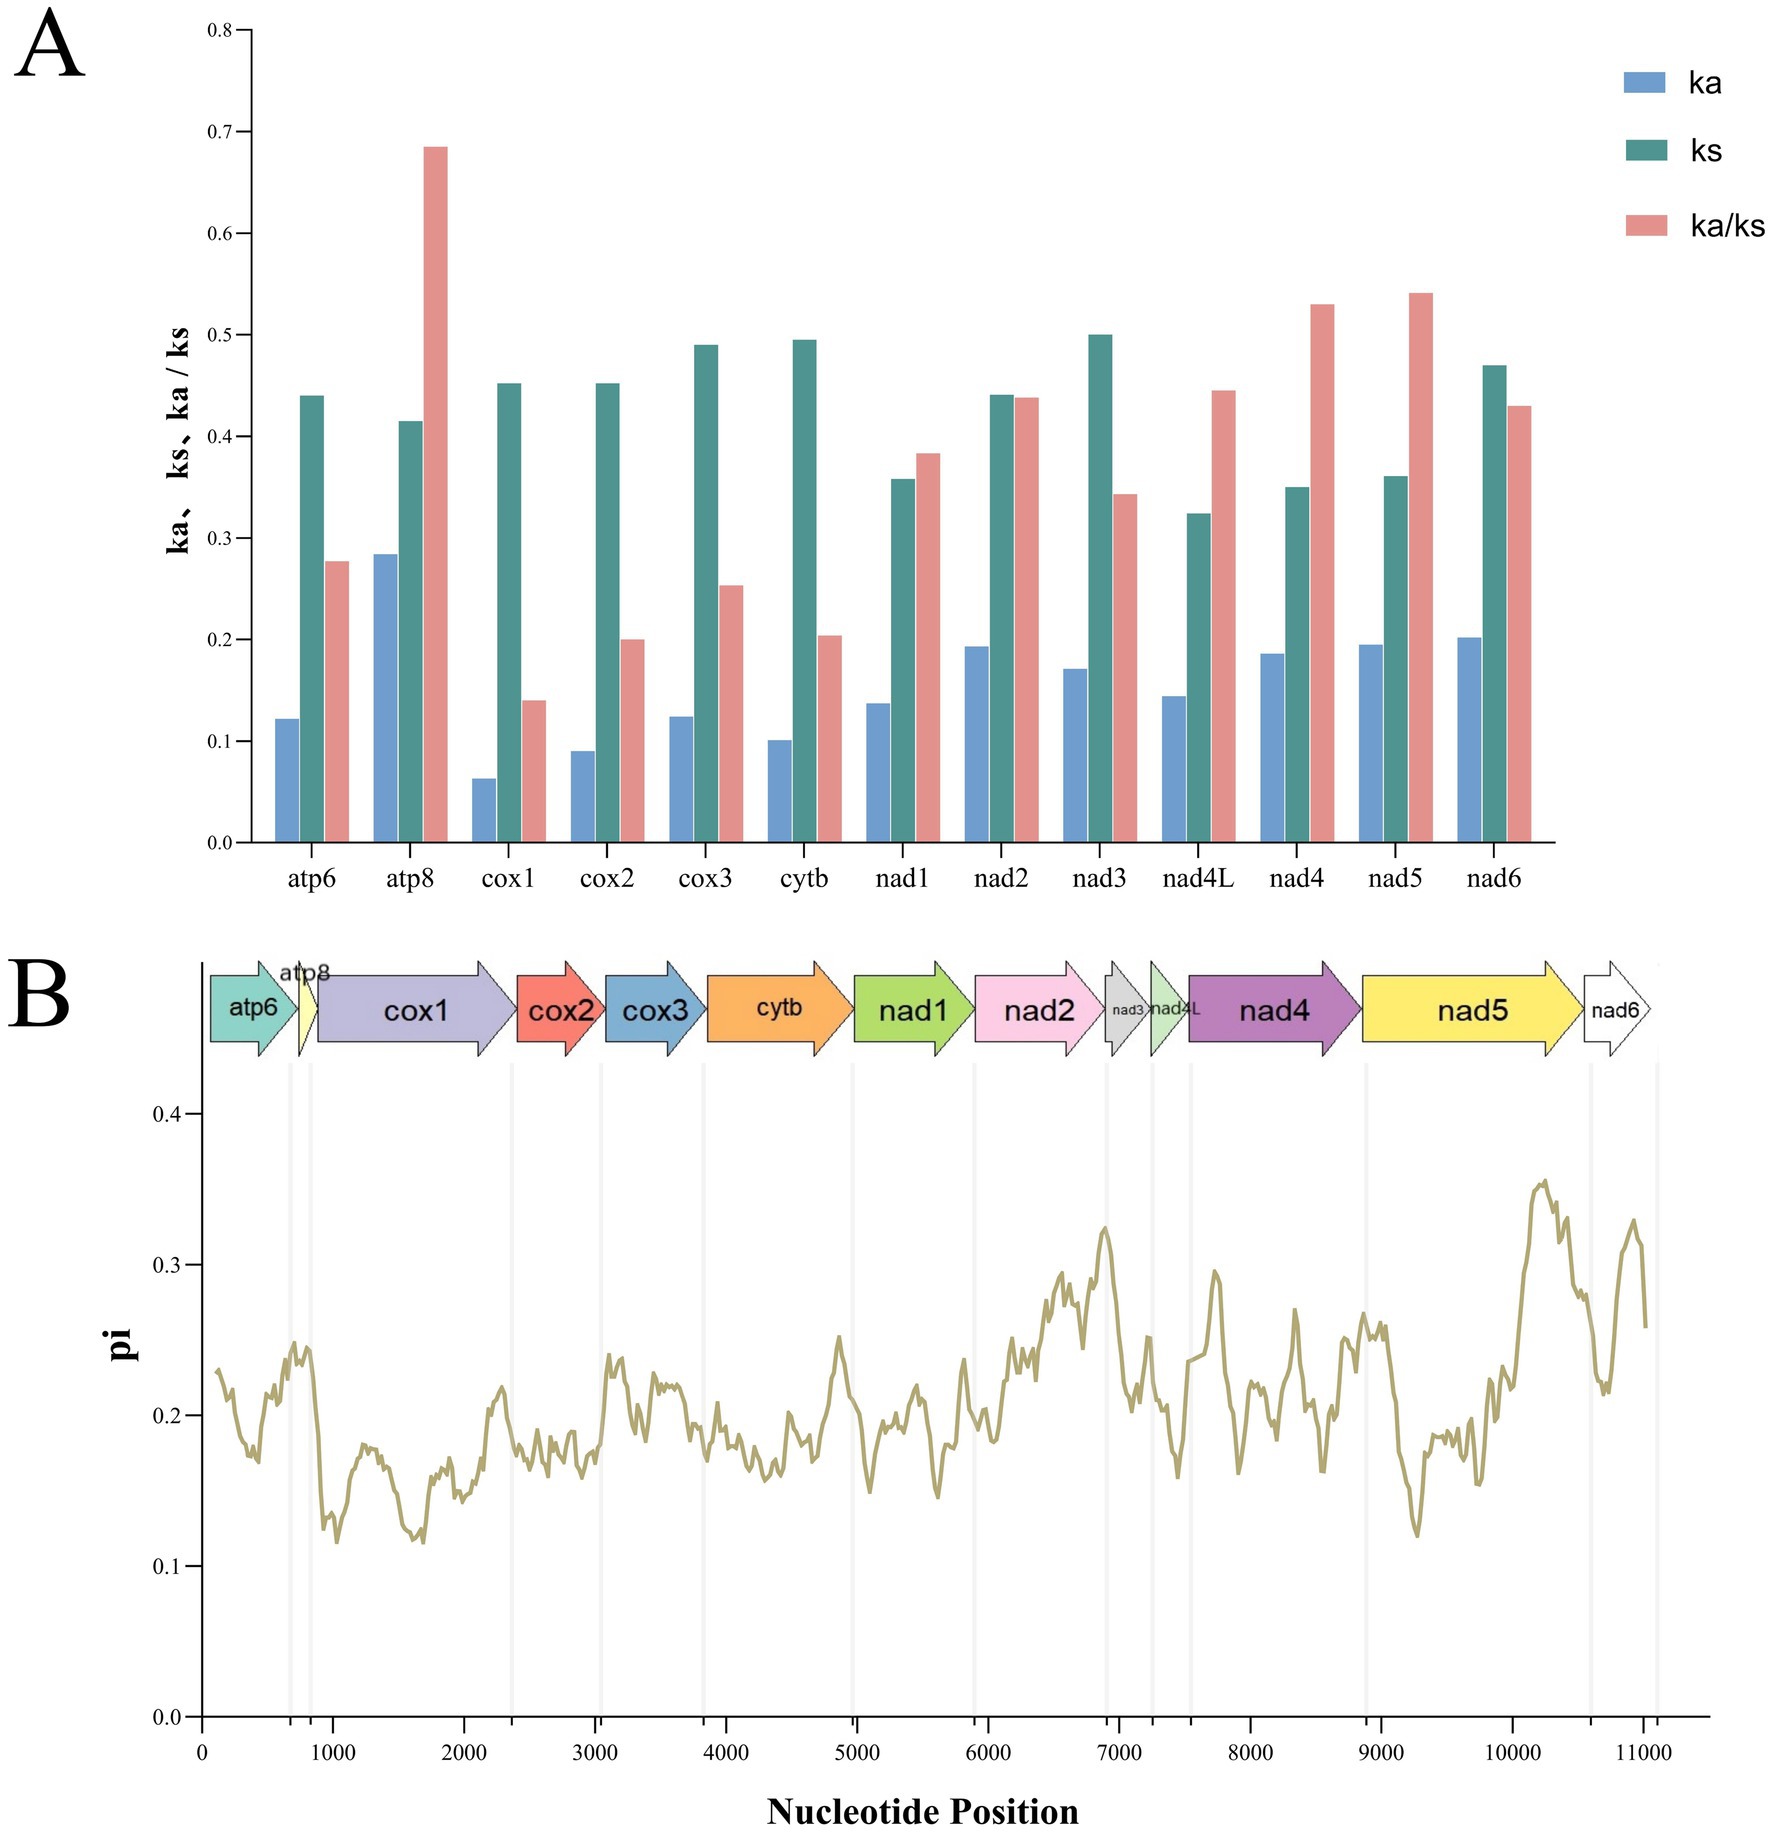
Figure 4. Non-synonymous (Ka) to synonymous (Ks) ratios of 13 protein-coding genes in mitochondrial genomes of the order Siphonaptera (A). And nucleotide diversity (Pi) of mitochondrial genomes of the flea species from the order Siphonaptera. The size of the sliding window is 200 bp with each step of 20 bp. The arrows above the figure indicate protein-coding genes (B).
3.6 Phylogenetic analysis
Using Boreus elegans (HQ696579) as the outgroup, four phylogenetic trees were constructed based on the PCG123 and PCG12 datasets, respectively, using the ML method and BI method (Figure 5). The analysis results showed that the family Pulicidae stably formed a monophyletic group in all phylogenetic trees, while the families Ctenophthalmidae, Leptopsyllidae, and Ceratophyllidae all exhibited obvious paraphyletic characteristics. In addition, the flea species of Leptopsyllidae and Ceratophyllidae were concentrated in the same clade, suggesting a close phylogenetic relationship between the two families. In all four trees, F. diqingensis and F. spadix always clustered together with high support values, indicating their close phylogenetic relationship; C. yunnanus and C. quadratus also clustered into one clade with high support values, which showed that each of these two species had a close phylogenetic relationship.
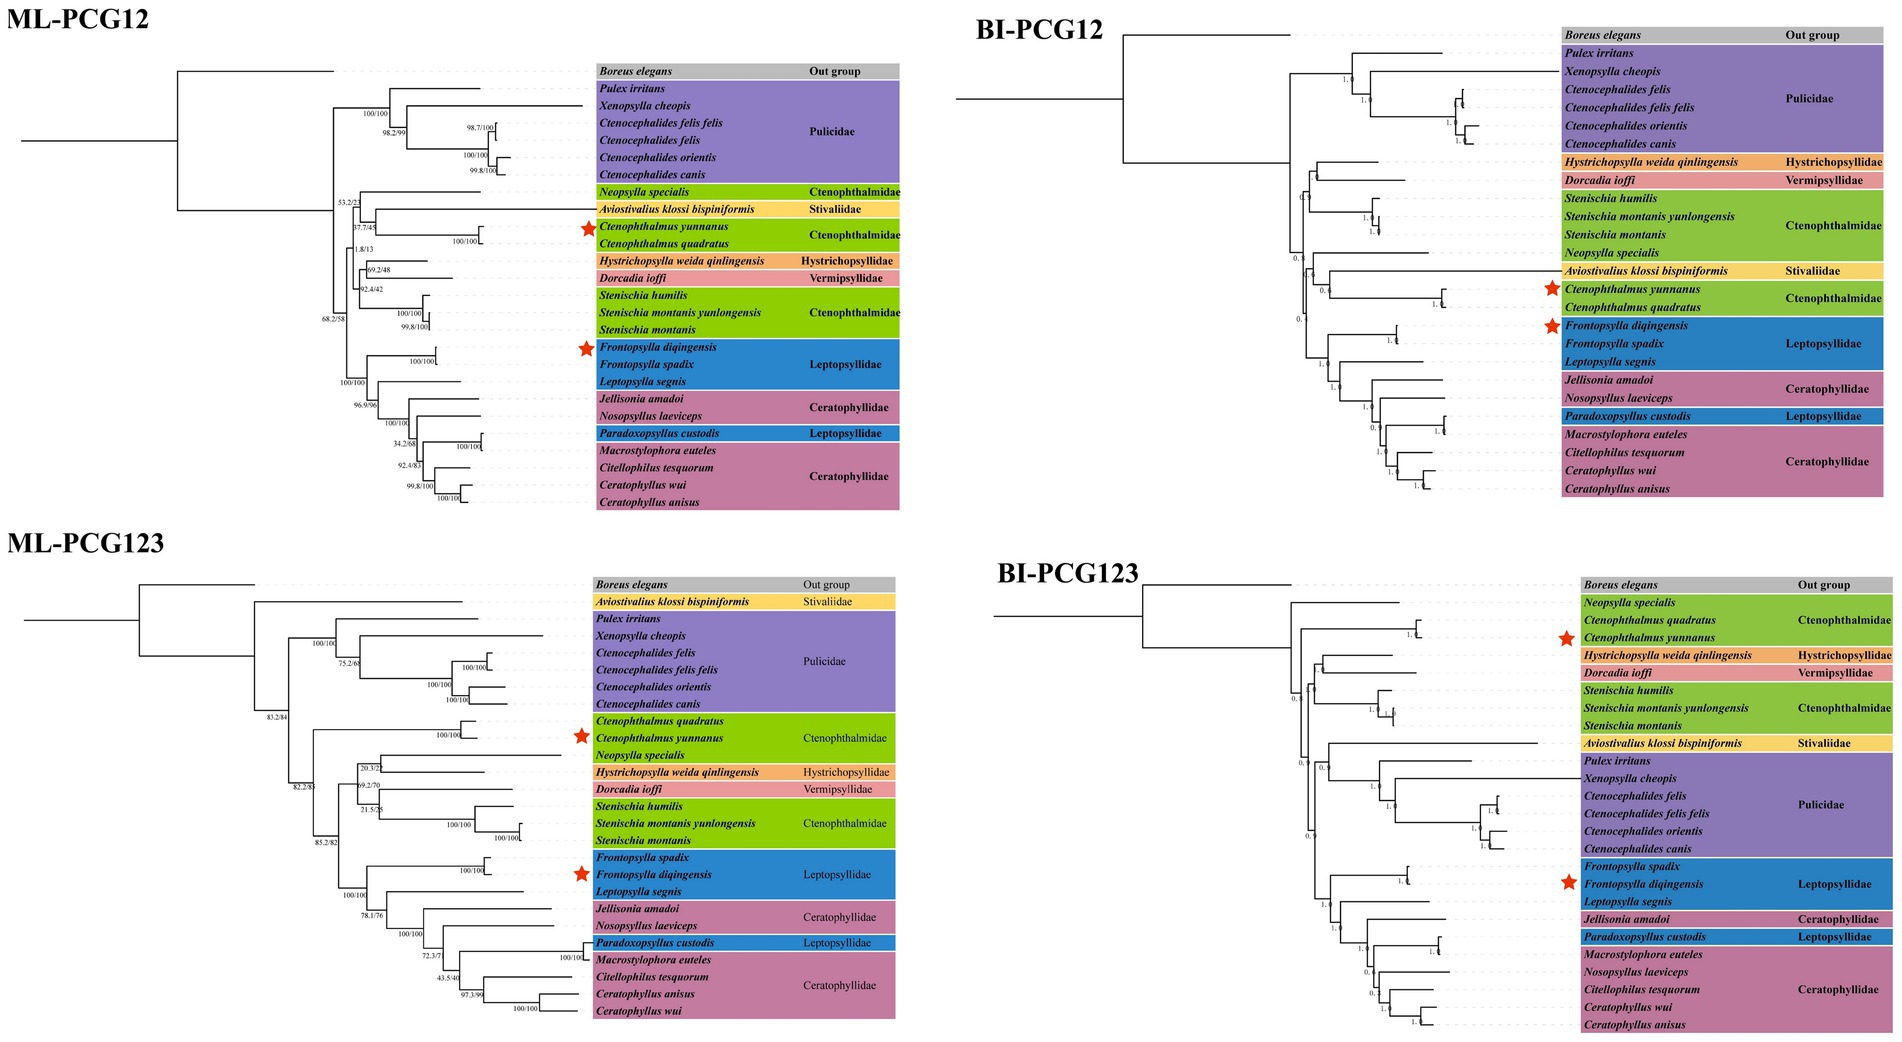
Figure 5. Phylogenetic reconstruction of Siphonaptera based on PCG123 and PCG12 datasets using Bayesian inference and Maximum likelihood. Boreus elegans (HQ696579) was used as the outgroup. The numbers beside the nodes are posterior probabilities (BI) and SH-Alrt/UFboot (ML) indicates the species in this study.
3.7 Divergence time estimation
According to divergence time estimation results, the most recent common ancestor of extant Siphonaptera dates back to the Cretaceous period, although the major intraordinal divergence events occurred after the K-Pg boundary. This study reveals that the family Pulicidae diverged from a clade comprising Ctenophthalmidae, Leptopsyllidae, Vermipsyllidae, Stivaliidae, Hystrichopsyllidae, and Ceratophyllidae approximately 83.43 Mya. Among them, Ctenophthalmidae, to which C. yunnanus belongs, began to diverge around 66.43 Mya, while Leptopsyllidae, which includes F. diqingensis, initially diverged approximately 58.96 Mya (Figure 6).
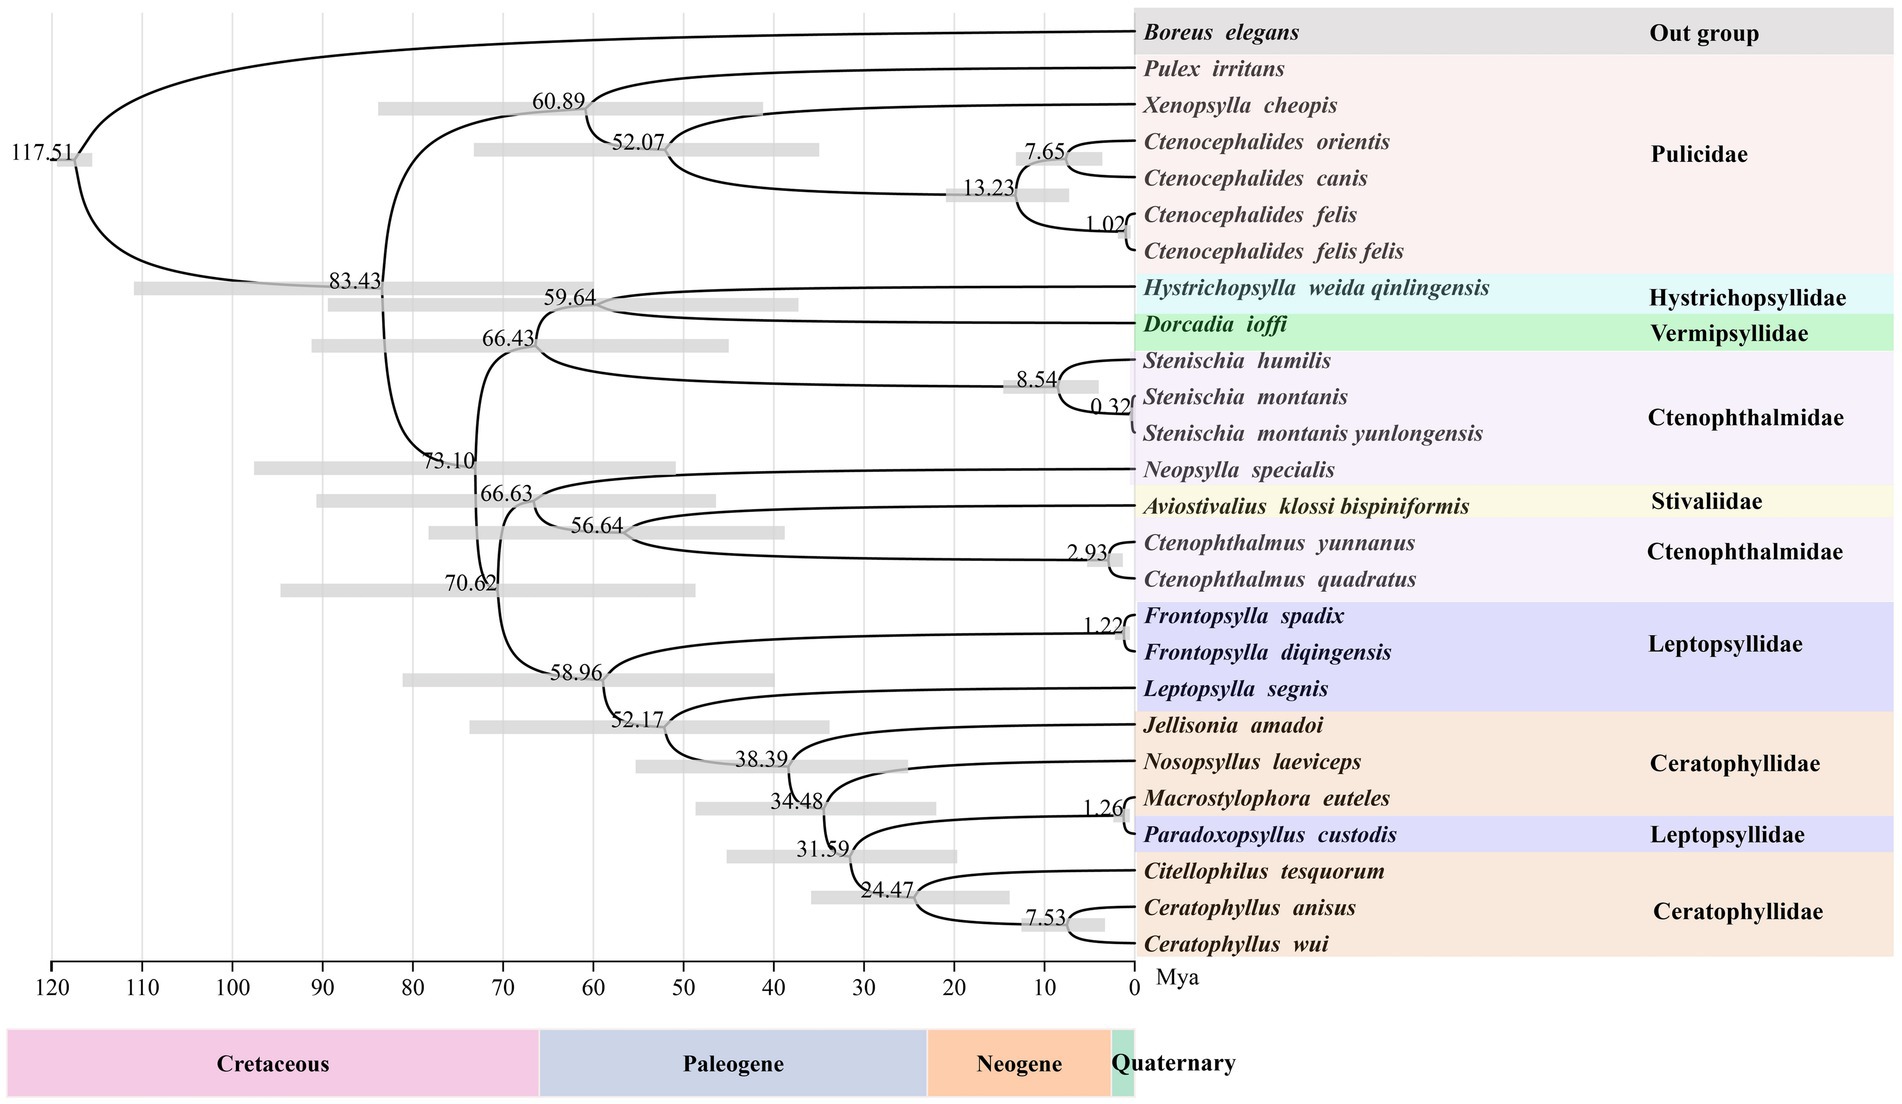
Figure 6. Divergence time estimation for the various lineages within the order Siphonaptera (node labels represent the mean values of the estimated ages, with node bars indicating 95% confidence intervals).
4 Discussion
Fleas are a widespread group of obligate ectoparasites that cause multifaceted harm to their hosts through biting and blood-feeding activities. On one hand, they can directly trigger clinical conditions such as allergic dermatitis, pruritus, alopecia, and anemia, significantly compromising host health and welfare. On the other hand, and more importantly, fleas serve as vectors for a variety of zoonotic pathogens-including Rickettsia, Bartonella, plague bacterium, and tapeworms-thereby substantially increasing the risk of cross-species transmission of infectious diseases between animals and humans. This poses persistent and complex challenges to regional and even global public health security. Furthermore, flea infestations lead to reduced productivity in livestock and poultry, increased veterinary costs for companion animals, and rising expenses for control measures, collectively resulting in extensive and substantial economic losses (2, 30, 31). Therefore, accurate identification of flea species is essential. Nevertheless, depending exclusively on morphological traits, the host, and geographical distribution when identifying fleas can present difficulties. Such methods are limited by environmental changes and sample size. In contrast, mitochondrial DNA, characterized by its small genome, high conservatism, maternal inheritance, and rapid evolutionary rate, serves as an effective molecular marker to enhance the accuracy of flea species identification (32).
In this research, we conducted the analysis of the mitochondrial genomes of C. yunnanus and F. diqingensis. A comparative analysis was performed on the mitochondrial genomes of flea species that have been published and are accessible on NCBI, focusing on the mitochondrial genome features, nucleotide diversity, selective pressure, and phylogenetic relationships. The results of this study show that the stop codons of most PCGs are typical ones (UAA and UAG); meanwhile, some genes are also detected to use incomplete stop codons (T). Notably, these incomplete stop codons are converted into functional stop codons through post-transcriptional polyadenylation (19, 33–35). Research has revealed the presence of base mismatches in tRNA genes, with G-U mismatches being the most prevalent. Previous studies have indicated that such mismatches are predominantly enriched at the junction regions between the single-stranded V loop and the TΨC helix of tRNA. This structural characteristic may arise from the sharp turn of the polynucleotide chain at this location, where G-U pairing effectively stabilizes the transition of this backbone conformation. Notably, G-U mismatches in tRNA genes not only contribute to the formation of their higher-order structures but also exhibit a high degree of conservation throughout evolution. Despite the presence of mismatches, these sites can be corrected through RNA editing mechanisms, thereby not affecting the normal transport function of tRNA. These features hold significant biological importance for maintaining the structural stability and functional specificity of tRNA molecules (36, 37).
The RSCU values for C. yunnanus and F. diqingensis were calculated. And the number of codons with RSCU value >1 in both fleas was 26, and both of them had the largest RSCU value of UUA. An RSCU value of less than 1 demonstrates a weak preference for codons, whereas an RSCU of exactly 1 reflects no preference, conversely, an RSCU greater than 1 shows a strong preference for codon usage (38). This suggests that UUA is the strongest preference for use among the 13 PCGs of the two flea species studied. Additionally, it was noted that the majority of codons terminating with A or U exhibited RSCU values exceeding 1, whereas those concluding with G or C showed RSCU values under 1, which is consistent with patterns found in other metazoans (39). The analysis of nucleotide diversity revealed that the cox1 gene exhibits the lowest Pi value. In the analysis of selective pressures, the Ka/Ks ratio is used to assess whether there is selective pressure on PCGs. Specifically, a Ka/Ks ratio greater than 1 suggests positive selection, which implies that the gene might be undergoing adaptive changes. A ratio of 1 is considered neutral selection, indicating that the gene’s evolution is not affected by natural selection. In contrast, a Ka/Ks ratio less than 1 indicates purifying selection, meaning that the gene is likely to maintain its original function and minimize harmful mutations (40). Therefore, among the 13 PCGs in the mitochondrial genome examined in this study, the Ka/Ks ratios were all less than 1, indicating that these 13 PCGs are under purifying selection. Additionally, in both nucleotide diversity analysis and selection pressure analysis, the cox1 gene exhibited the lowest pi value and Ka/Ks ratio, suggesting that it demonstrates the lowest level of variation and evolutionary rate. Consequently, this gene fragment can also be applied to taxa with closely related, ambiguous, and highly variable morphological characteristics (13, 41, 42). Moreover, it has long been recognized as a universal barcode for species identification (43, 44).
In relation to the study of the phylogenetic connections within the order of fleas, the research team led by Whiting et al. (45) performed phylogenetic analyses utilizing four distinct gene fragments: 18S rDNA, 28S rDNA, COII, and EF1-α. These analyses incorporated 128 representative flea species globally, encompassing 16 families and 83 genera. To deduce evolutionary relationships, both the direct optimization method and the ML method were utilized. Their results demonstrate that at the section-level classification unit, Tungidae, Lycopsyllidae, Pygiopsyllidae, Stivaliidae, Stephanociricidae, Rhopalopsyllidae, Pulicidae, Ceratophyllidae, Ischnopsyllidae, and Chimaeropsyllidae form monophyletic groups. Conversely, Hystrichopsyllidae, Ctenophthalmidae, and Leptopsyllidae show distinct paraphyletic traits (45). However, Whiting et al.’s study was based solely on four single gene fragments (18S rDNA, 28S rDNA, COII, and EF1-α), which inherently limited the phylogenetic signals obtained. Recognizing this constraint, the authors themselves emphasized the necessity of incorporating new molecular data to clarify the systematic classification and phylogeny of fleas. This study confirmed the monophyly of Pulicidae, along with the paraphyletic nature of Ctenophthalmidae and Leptopsyllidae. The results obtained are largely in accordance with those from many earlier studies (14, 28, 46, 47). Notably, the results of this study indicate that the family Ceratophyllidae exhibits a paraphyletic characteristic. This finding is consistent with the majority of previous mitochondrial genome-based studies, whereas it contradicts the conclusions of Whiting et al. However, due to the current scarcity of flea mitochondrial genome data, this gap significantly limits the depth of phylogenetic studies on fleas. Therefore, it is essential to continuously expand the availability of mitochondrial genomic data for fleas. Meanwhile, since nuclear genes can provide more reliable and comprehensive evolutionary signals when resolving the evolutionary relationships of higher - rank taxa, the integration of nuclear genome data will also be indispensable for clarifying deep - level phylogenetic relationships in future studies.
The phylogenetic relationships between Siphonaptera and other insect orders have long been a focal point of debate and research in entomological systematics. As an independent branch on the insect phylogenetic tree, the order Siphonaptera is supported by various morphological characteristics, including lateral flattening, winglessness and piercing-sucking mouthparts, as well as its unique living habits. In the 19th century, some scholars posited that fleas were closely related to beetles based on their external morphology (48). However, in the late 20th century, Willi Hennig (49) demonstrated that fleas are closely related to scorpionflies (Mecoptera) and true flies (Diptera), together constituting the group Antliophora. Phylogenetic analyses using 18S and 28S rRNA, along with cox2 and EF-1α genes, revealed that the order Mecoptera is polyphyletic, with the order Siphonaptera being a branch of Mecoptera. Additionally, Siphonaptera is recognized as a sister group to the family Boreidae, while the family Nannochoristidae is placed as a sister group to the clade comprising Boreidae and Siphonaptera (50–53). In 2020, Tihelka et al. (54) selected 26 representative species from the group Antliophora, encompassing all suborders of the order Mecoptera, Siphonaptera and Diptera. Additionally, based on transcriptome data previously collected by the “Evolution of a Thousand Insect Transcriptomes (1KITE)” team, 1,478 directly homologous single-copy protein-coding nuclear genes were retrieved. The researchers also constructed smaller data matrices that included the mitochondrial genomes of 29 species in conjunction with multiple genes. The research results indicate that the order Siphonaptera is nested within the order Mecoptera and exhibits a sister group relationship with the family Nannochoristidae (54). Furthermore, a phylogenetic analysis conducted in 2022 by Yu Zhang et al. based on mitochondrial genomes reveals a sister relationship between Siphonaptera and the clade comprising Diptera, Mecoptera, Megaloptera, and Neuroptera (29).
Both the present study and the work by Yu Zhang et al. employed mitochondrial genomes for phylogenetic reconstruction, yet with distinct research foci: our study specifically addresses the phylogenetic relationships within Siphonaptera species, while Zhang et al.’s investigation centers on the phylogenetic position of Siphonaptera relative to Antliophora insects. Notably, both studies share a common limitation: incomplete taxonomic sampling across flea lineages. Although compelling evidence from various studies has demonstrated both the genetic distinctiveness and specific phylogenetic patterns among different flea species within Siphonaptera, as well as between Siphonaptera and Antliophora, these findings require further validation through additional research. Mitochondrial genomes serve as highly effective molecular markers, offering dual utility for both precise flea species identification and comprehensive phylogenetic analyses. Nevertheless, current data availability remains critically limited, as evidenced by the NCBI database containing fewer than 30 complete mitochondrial genomes representing the entire order Siphonaptera (55–59). Therefore, future studies incorporating a broader representation of Siphonaptera mitochondrial genomes, with extensive sampling across diverse species, will be crucial for elucidating the phylogenetic relationships among different flea species within Siphonaptera, as well as the phylogenetic position of this order relative to Antliophora. Meanwhile, the findings of this study also provide important guidance for flea control practices. Significant differentiation exists among flea lineages in terms of ecological adaptability, host preference, and vector competence, and such functional divergence in an evolutionary context directly influences their disease transmission potential. Therefore, elucidating the phylogenetic status and evolutionary trajectory of key vector flea species will not only help reveal the evolutionary mechanisms underlying their transmission-related traits but also offer a theoretical basis for targeted control strategies.
This study estimates that the most recent common ancestor of the extant flea crown-group could be traced back to the Cretaceous. The establishment of this key time node provides an important calibration point for reconstructing the evolutionary history of fleas. It is noteworthy that although the ancestral lineages of fleas had already formed in the Cretaceous, molecular clock analyses reveal that the substantial divergence events of most extant lineages occurred predominantly after the K-Pg boundary. This finding is consistent with the research conclusions of Zhu et al., which not only confirms that flea evolution is significantly correlated with geological historical events but also reveals the crucial role of the K-Pg extinction event in the formation of flea diversity (24). From an evolutionary biology perspective, this pattern of divergence timing strongly suggests that the adaptive radiation of mammals (particularly rodents and chiropterans) after the K-Pg boundary likely created new niche opportunities for fleas, thereby promoting their subsequent lineage divergence. This discovery provides new empirical evidence for understanding the co-evolutionary patterns between hosts and parasites on a macro-evolutionary scale. However, given that this study utilized mitochondrial genome data and the current scarcity of definitive flea fossils, potential errors in the divergence time estimation cannot be ruled out; mitochondrial genomes evolve faster than nuclear genomes, a characteristic that makes them more suitable for studies at lower taxonomic ranks but limits their application in research involving higher taxonomic ranks. Therefore, expanding species representation and geographic coverage is expected to facilitate a clearer resolution of the evolutionary history and diversification patterns of this group.
5 Conclusion
This research presents the assembly of the mitochondrial genomes of C. yunnanus and F. diqingensis. In both nucleotide diversity analysis and selection pressure analysis, the cox1 gene exhibited the lowest values for Pi and Ka/Ks. Additionally, phylogenetic analysis indicated that both the family Ctenophthalmidae, which includes C. yunnanus, and the family Leptopsyllidae, which includes F. diqingensis, are paraphyletic. Divergence time estimation indicates that the most recent common ancestor of crown-group fleas diverged during the Cretaceous period, while the majority of extant lineages within Siphonaptera underwent diversification following the K-Pg boundary. This research not only enriches the mitochondrial genome database of fleas but also provides valuable insights for flea genetics and phylogenetic studies. However, the absence of mitochondrial genome data for all flea lineages necessitates the acquisition of additional mitochondrial genome data to address taxonomic issues and controversies across various orders of fleas, thereby aiding in the formulation of more effective prevention and control strategies.
Data availability statement
The nucleotide sequences of the C. yunnanus and F. diqingensis mitogenome were deposited in NCBI (https://www.ncbi.nlm.nih.gov/) under accession number OR780664 and OR780662, respectively.
Ethics statement
The manuscript presents research on animals that do not require ethical approval for their study.
Author contributions
ST: Writing – original draft, Formal analysis, Software, Methodology, Visualization, Investigation, Conceptualization, Data curation. LC: Visualization, Data curation, Methodology, Investigation, Conceptualization, Writing – original draft. JW: Conceptualization, Funding acquisition, Writing – original draft, Formal analysis, Methodology. BC: Writing – original draft, Formal analysis, Data curation, Methodology. SL: Writing – original draft, Data curation, Methodology. MD: Methodology, Data curation, Writing – original draft. DJ: Funding acquisition, Writing – original draft, Methodology. WG: Investigation, Validation, Supervision, Writing – review & editing, Project administration. QZ: Supervision, Writing – review & editing, Investigation, Project administration, Validation. XY: Funding acquisition, Validation, Resources, Writing – review & editing, Supervision, Project administration.
Funding
The author(s) declare that financial support was received for the research and/or publication of this article. This work was supported by the Special Basic Cooperative Research Programs of Yunnan Provincial Undergraduate Universities’ Association (Grant No. 202401BA070001-005) and Yunnan Fundamental Research Projects (Grant No. 202401AT070084), Scientific Research Fund of Yunnan Education Department (2024 J0857), the Special Basic Cooperative Research Programs of Yunnan Provincial Undergraduate Universities’ Association (Grant No. 202301BA070001-045).
Acknowledgments
We express our gratitude to Zongti Shao for his invaluable assistance in the collection and morphological identification of specimens.
Conflict of interest
The authors declare that the research was conducted in the absence of any commercial or financial relationships that could be construed as a potential conflict of interest.
Generative AI statement
The authors declare that no Gen AI was used in the creation of this manuscript.
Any alternative text (alt text) provided alongside figures in this article has been generated by Frontiers with the support of artificial intelligence and reasonable efforts have been made to ensure accuracy, including review by the authors wherever possible. If you identify any issues, please contact us.
Publisher’s note
All claims expressed in this article are solely those of the authors and do not necessarily represent those of their affiliated organizations, or those of the publisher, the editors and the reviewers. Any product that may be evaluated in this article, or claim that may be made by its manufacturer, is not guaranteed or endorsed by the publisher.
Supplementary material
The Supplementary material for this article can be found online at: https://www.frontiersin.org/articles/10.3389/fvets.2025.1683581/full#supplementary-material
References
1. Kaminsky, R, and Mäser, P. Global impact of parasitic infections and the importance of parasite control. Front Parasitol. (2025) 4:1546195. doi: 10.3389/fpara.2025.1546195
2. Moore, CO, André, MR, Šlapeta, J, and Breitschwerdt, EB. Vector biology of the cat flea Ctenocephalides felis. Trends Parasitol. (2024) 40:324–37. doi: 10.1016/j.pt.2024.02.006
3. Iannino, F, Sulli, N, Maitino, A, Pascucci, I, Pampiglione, G, and Salucci, S. Fleas of dog and cat: species, biology and flea-borne diseases. Vet Ital. (2017) 53:277–88. doi: 10.12834/VetIt.109.303.3
4. Olivo-Freites, C, Davar, K, Gallardo-Huizar, O, Vijayan, T, and Younes, R. Case report: cardiovascular manifestations due to flea-borne typhus. Am J Trop Med Hyg. (2024) 110:150–4. doi: 10.4269/ajtmh.22-0794
5. Blanton, LS. Rickettsia typhi in Southern California: a growing flea-borne threat. Am J Trop Med Hyg. (2024) 110:1–2. doi: 10.4269/ajtmh.23-0742
6. Salomon, J, Leeke, E, Montemayor, H, Durden, C, Auckland, L, Balasubramanian, S, et al. On-host flea phenology and flea-borne pathogen surveillance among mammalian wildlife of the Pineywoods of East Texas. J Vector Ecol. (2024) 49:R39–r49. doi: 10.52707/1081-1710-49.2.R39
7. Self, S, Yang, Y, Walden, H, Yabsley, MJ, McMahan, C, and Herrin, BH. A nowcast model to predict outdoor flea activity in real time for the contiguous United States. Parasit Vectors. (2024) 17:27. doi: 10.1186/s13071-023-06112-5
8. Rajamannar, V, Govindarajan, R, Kumar, A, and Samuel, PP. A review of public health important fleas (Insecta, Siphonaptera) and flea-borne diseases in India. J Vector Borne Dis. (2022) 59:12–21. doi: 10.4103/0972-9062.328977
9. Schütte, K, Springer, A, Brandes, F, Reuschel, M, Fehr, M, and Strube, C. Ectoparasites of European hedgehogs (Erinaceus europaeus) in Germany and their health impact. Parasit Vectors. (2024) 17:2. doi: 10.1186/s13071-023-06081-9
10. Linardi, PM, and Santos, JL. Ctenocephalides felis felis vs. Ctenocephalides canis (Siphonaptera: Pulicidae): some issues in correctly identify these species. Rev Bras Parasitol Vet. (2012) 21:345–54. doi: 10.1590/s1984-29612012000400002
11. Chotelersak, K, Machida, R, Thipaksorn, A, Samung, Y, and Ruangsittichai, J. Mitochondrial COI barcoding of Pulicidae fleas and ultrastructural differentiation of the cat flea by scanning electron microscopy. Infect Genet Evol. (2025) 133:105793. doi: 10.1016/j.meegid.2025.105793
12. Li, J, Yan, B, He, H, Xu, X, Ruan, Y, and Yang, M. Characterization of the complete mitochondrial genome of a flea beetle Luperomorpha xanthodera (Coleoptera: Chrysomelidae: Galerucinae) and phylogenetic analysis. Genes (Basel). (2023) 14:414. doi: 10.3390/genes14020414
13. Zhang, Y, Nie, Y, Deng, YP, Liu, GH, and Fu, YT. The complete mitochondrial genome sequences of the cat flea Ctenocephalides felis felis (Siphonaptera: Pulicidae) support the hypothesis that C. felis isolates from China and USA were the same C. f. felis subspecies. Acta Trop. (2021) 217:105880. doi: 10.1016/j.actatropica.2021.105880
14. Pu, J, Lin, X, and Dong, W. The first Mitogenome of the genus Amphalius (Siphonaptera: Ceratophyllidae) and its phylogenetic implications. Parasitology. (2024) 151:1085–95. doi: 10.1017/s0031182024000635
16. Bernt, M, Donath, A, Jühling, F, Externbrink, F, Florentz, C, Fritzsch, G, et al. MITOS: improved de novo metazoan mitochondrial genome annotation. Mol Phylogenet Evol. (2013) 69:313–9. doi: 10.1016/j.ympev.2012.08.023
17. Meng, G, Li, Y, Yang, C, and Liu, S. MitoZ: A toolkit for animal mitochondrial genome assembly, annotation and visualization. Nucleic Acids Res. (2019) 47:e63. doi: 10.1093/nar/gkz173
18. Chan, PP, Lin, BY, Mak, AJ, and Lowe, TM. tRNAscan-Se 2.0: improved detection and functional classification of transfer RNA genes. Nucleic Acids Res. (2021) 49:9077–96. doi: 10.1093/nar/gkab688
19. Chen, W, Miao, K, Wang, J, Wang, H, Sun, W, Yuan, S, et al. Five new mitogenomes sequences of Calidridine sandpipers (Aves: Charadriiformes) and comparative Mitogenomics of genus Calidris. PeerJ. (2022) 10:e13268. doi: 10.7717/peerj.13268
20. Rozas, J, Ferrer-Mata, A, Sánchez-DelBarrio, JC, Guirao-Rico, S, Librado, P, Ramos-Onsins, SE, et al. DnaSP 6: DNA sequence polymorphism analysis of large data sets. Mol Biol Evol. (2017) 34:3299–302. doi: 10.1093/molbev/msx248
21. Kalyaanamoorthy, S, Minh, BQ, Wong, TKF, von Haeseler, A, and Jermiin, LS. ModelFinder: fast model selection for accurate phylogenetic estimates. Nat Methods. (2017) 14:587–9. doi: 10.1038/nmeth.4285
22. Letunic, I, and Bork, P. Interactive tree of life (iTOL) V5: an online tool for phylogenetic tree display and annotation. Nucleic Acids Res. (2021) 49:W293–6. doi: 10.1093/nar/gkab301
23. Lewis, RE, and Grimaldi, D. A pulicid flea in Miocene Amber from the Dominican Republic (Insecta, Siphonaptera, Pulicidae). American museum Novitates; no.3205. New York American Museum of Natural History (1997). 1–9.
24. Zhu, Q, Hastriter, MW, Whiting, MF, and Dittmar, K. Fleas (Siphonaptera) are cretaceous, and evolved with Theria. Mol Phylogenet Evol. (2015) 90:129–39. doi: 10.1016/j.ympev.2015.04.027
25. Giribet, DG. The first fossil cyphophthalmid (Arachnida, Opiliones) from Bitterfeld amber, Germany. J Arachnol. (2003) 31:371–8. doi: 10.1636/H03-03
26. Penney, D, Green, DI, and Mellish, C. Biodiversity of fossils in Amber from the major world deposits. Siri Scientific Press. (2010).
27. Xie, J, Chen, Y, Cai, G, Cai, R, Hu, Z, and Wang, H. Tree visualization by one table (tvBOT): A web application for visualizing, modifying and annotating phylogenetic trees. Nucleic Acids Res. (2023) 51:W587–92. doi: 10.1093/nar/gkad359
28. Fu, YT, Xun, Y, Peng, YY, Zhang, Y, and Wu, X. The complete mitochondrial genome of the rodent flea Nosopsyllus laeviceps: genome description, comparative analysis, and phylogenetic implications. Parasit Vectors. (2024) 17:253. doi: 10.1186/s13071-024-06329-y
29. Zhang, Y, Fu, YT, Yao, C, Deng, YP, Nie, Y, and Liu, GH. Mitochondrial phylogenomics provides insights into the taxonomy and phylogeny of fleas. Parasit Vectors. (2022) 15:223. doi: 10.1186/s13071-022-05334-3
30. Colonia, CB, Ramírez-Hernández, A, Gil-Mora, J, Agudelo, JC, Castaño Villa, GJ, Pino, C, et al. Flea-borne rickettsia species in fleas, Caldas department, Colombia. J Infect Dev Ctries. (2020) 14:1155–63. Epub 20201031. doi: 10.3855/jidc.12524
31. Riepl, M. Heartworm-, flea-, and tick-associated diseases in dogs: a review of common parasites and drug classes prophylactic against them. Int J Pharm Compd. (2024) 28:188–93.
32. Yang, C, Dong, X, Wang, Q, Hou, X, Yuan, H, and Li, X. Mitochondrial genome characteristics of six Phylloscopus species and their phylogenetic implication. PeerJ. (2023) 11:e16233. doi: 10.7717/peerj.16233
33. Liu, J, Dai, J, Jia, J, Zong, Y, Sun, Y, Peng, Y, et al. Characterization and phylogenetic analysis of the complete mitochondrial genome of Saturnia Japonica. Biochem Genet. (2022) 60:914–36. doi: 10.1007/s10528-021-10129-9
34. Hamdan, B, Seixas, VC, Nunes, GL, Oliveira, G, Bonatto, SL, Vidal, A, et al. The Brazilian Atlantic Bushmaster Lachesis (Linnaeus, 1766) Mitogenome with insights on Snake evolution and divergence (Serpentes: Viperidae: Crotalinae). An Acad Bras Cienc. (2023) 95:e20220973. doi: 10.1590/0001-3765202320220973
35. Dai, ST, Feng, DX, and Sun, DP. Characterization and phylogenetic analysis of the complete mitochondrial genomes of two tiny Necrophagous Phorid flies, Metopina sagittata and Puliciphora borinquenensis (Diptera: Phoridae). J Med Entomol. (2022) 59:120–8. doi: 10.1093/jme/tjab152
36. Watanabe, Y, Kawai, G, Yokogawa, T, Hayashi, N, Kumazawa, Y, Ueda, T, et al. Higher-order structure of bovine mitochondrial tRNA(SerUGA): chemical modification and computer modeling. Nucleic Acids Res. (1994) 22:5378–84. doi: 10.1093/nar/22.24.5378
37. Wakita, K, Watanabe, Y, Yokogawa, T, Kumazawa, Y, Nakamura, S, Ueda, T, et al. Higher-order structure of bovine mitochondrial tRNA(Phe) lacking the 'conserved' GG and T psi CG sequences as inferred by enzymatic and chemical probing. Nucleic Acids Res. (1994) 22:347–53. doi: 10.1093/nar/22.3.347
38. Liu, H, Lu, Y, Lan, B, and Xu, J. Codon usage by chloroplast gene is bias in Hemiptelea davidii. J Genet. (2020) 99. doi: 10.1007/s12041-019-1167-1
39. Wu, T, Ma, X, Wang, F, Xie, L, Lv, Q, Zeng, M, et al. First description of the mitogenome features of Neofoleyellides genus (Nematoda: Onchocercidae) isolated from a wild bird (Pyrrhocorax pyrrhocorax). Animals (Basel). (2022) 12:2854. doi: 10.3390/ani12202854
40. Kang, N, and Hu, H. Adaptive evidence of mitochondrial genes in Pteromalidae and Eulophidae (hymenoptera: Chalcidoidea). PLoS One. (2023) 18:e0294687. doi: 10.1371/journal.pone.0294687
41. Ullah, I, Sattar, S, Ali, I, Farid, A, Ullah, A, Eid, RA, et al. Molecular epidemiology of cystic echinococcosis in rural Baluchistan, Pakistan: a cross-sectional study. Pathogens. (2022) 12:40. doi: 10.3390/pathogens12010040
42. Ferreira, MST, Vogel, FSF, Sangioni, LA, Cezar, AS, Braunig, P, de Avilla, BS, et al. Sarcocystis species identification in cattle hearts destined to human consumption in southern Brazil. Vet Parasitol Reg Stud Rep. (2018) 14:94–8. doi: 10.1016/j.vprsr.2018.09.002
43. Zhao, Q, Abuzeid, AMI, He, L, Zhuang, T, Li, X, Liu, J, et al. The mitochondrial genome sequence analysis of Ophidascaris baylisi from the Burmese python (Python molurus bivittatus). Parasitol Int. (2021) 85:102434. doi: 10.1016/j.parint.2021.102434
44. Hebert, PD, Cywinska, A, Ball, SL, and de Waard, JR. Biological identifications through DNA barcodes. Proc Biol Sci. (2003) 270:313–21. doi: 10.1098/rspb.2002.2218
45. Whiting, MF, Whiting, AS, Hastriter, MW, and Dittmar, K. A molecular phylogeny of fleas (Insecta: Siphonaptera): origins and host associations. Cladistics. (2008) 24:677–707. doi: 10.1111/j.1096-0031.2008.00211.x
46. Lin, X, Pu, J, and Dong, W. The first mitogenome of the subfamily Stenoponiinae (Siphonaptera: Ctenophthalmidae) and implications for its phylogenetic position. Sci Rep. (2024) 14:18179. doi: 10.1038/s41598-024-69203-y
47. Chen, B, Duan, M, Liu, S, Liu, Y, Tang, S, Jiang, D, et al. The complete mitochondrial genome and phylogenetic implications of Paradoxopsyllus custodis and Stenischia montanis yunlongensis. Sci Rep. (2024) 14:31555. doi: 10.1038/s41598-024-84175-9
48. Crowson, RA. Die Stammesgeschichte Der Insekten. Systematic Biology (1970) 19:393–6. doi: 10.2307/2412281
49. Kristensen, N. The phylogeny of hexapod “orders”. A critical review of recent accounts. J Zool Syst Evol Res. (1975) 13:1–44. doi: 10.1111/j.1439-0469.1975.tb00226.x
50. Whiting, MF. Mecoptera is paraphyletic: multiple genes and phylogeny of Mecoptera and Siphonaptera. Zool Scr. (2002) 31:93–104. doi: 10.1046/j.0300-3256.2001.00095.x
51. Chalwatzis, N, Hauf, J, Van De Peer, Y, Kinzelbach, R, and Zimmermann, FK. 18s ribosomal Rna genes of insects: primary structure of the genes and molecular phylogeny of the Holometabola. Ann Entomol Soc Am. (1996) 89:788–803. doi: 10.1093/aesa/89.6.788
52. Whiting, MF, Carpenter, JC, Wheeler, QD, and Wheeler, WC. The Strepsiptera problem: phylogeny of the Holometabolous insect orders inferred from 18s and 28s ribosomal DNA sequences and morphology. Syst Biol. (1997) 46:1–68. doi: 10.1093/sysbio/46.1.1
53. Whiting, MF. Phylogeny of the Holometabolous insect orders based on 18s ribosomal DNA: when bad things happen to good data. Exs. Springer (2002). p. 69–83. doi: 10.1007/978-3-0348-8114-2_5
54. Tihelka, E, Giacomelli, M, Huang, D, Pisani, D, and Cai, C. Fleas are parasitic scorpionflies. Palaeoentomol. (2020) 3:641–53. doi: 10.11646/palaeoentomology.3.6.16
55. Liu, Y, Chen, B, Lu, X, Liu, S, Jiang, D, Wang, X, et al. Analysis of complete Mitogenomes and phylogenetic relationships of Frontopsylla spadix and Neopsylla Specialis. Front Vet Sci. (2023) 10:1250381. doi: 10.3389/fvets.2023.1250381
56. Chen, B, Liu, YF, Lu, XY, Jiang, DD, Wang, X, Zhang, QF, et al. Complete mitochondrial genome of Ctenophthalmus quadratus and Stenischia humilis in China provides insights into fleas phylogeny. Front Vet Sci. (2023) 10:1255017. doi: 10.3389/fvets.2023.1255017
57. Zhang, Y, Nie, Y, Li, LY, Chen, SY, Liu, GH, and Liu, W. Population genetics and genetic variation of Ctenocephalides felis and Pulex irritans in China by analysis of nuclear and mitochondrial genes. Parasit Vectors. (2022) 15:266. doi: 10.1186/s13071-022-05393-6
58. Tan, L, Yao, X, Liu, J, Lei, C, Huang, Q, and Hu, B. The complete mitochondrial genome of the flea Hystrichopsylla Weida Qinlingensis (Siphonaptera: Hystrichopsylla). Mitochondr DNA B Resour. (2023) 8:501–3. doi: 10.1080/23802359.2022.2053367
59. Cameron, SL. Insect mitochondrial genomics: implications for evolution and phylogeny. Annu Rev Entomol. (2014) 59:95–117. doi: 10.1146/annurev-ento-011613-162007
61. Van Loghem, JJ. Classification of the Plague-Bacillus. Antonie Van Leeuwenhoek (1944) 10:15. doi: 10.1007/bf02272779
Keywords: Ctenophthalmus yunnanus , Frontopsylla diqingensis , fleas, mitochondrial genome, phylogenetic analysis, comparative analyses
Citation: Tang S, Chen L, Wu J, Chen B, Liu S, Duan M, Jiang D, Gu W, Zhang Q and Yang X (2025) Mitogenomic architecture and phylogenetic placement of Ctenophthalmus yunnanus and Frontopsylla diqingensis: insights from comparative genomics. Front. Vet. Sci. 12:1683581. doi: 10.3389/fvets.2025.1683581
Edited by:
Yukifumi Nawa, Khon Kaen University, ThailandReviewed by:
Yuxuan Huang, Huazhong Agricultural University, ChinaLorenzo Halasan, National Sun Yat-sen University, Taiwan
Copyright © 2025 Tang, Chen, Wu, Chen, Liu, Duan, Jiang, Gu, Zhang and Yang. This is an open-access article distributed under the terms of the Creative Commons Attribution License (CC BY). The use, distribution or reproduction in other forums is permitted, provided the original author(s) and the copyright owner(s) are credited and that the original publication in this journal is cited, in accordance with accepted academic practice. No use, distribution or reproduction is permitted which does not comply with these terms.
*Correspondence: Wei Gu, Z3c3NzdAMTYzLmNvbQ== Quanfu Zhang, MjYyMjA0NTgwN0BxcS5jb20= Xing Yang, eWFuZzA4MjIwMDEzQDE2My5jb20=
†These authors have contributed equally to this work