 Xinlei Wang1,2†
 Liheng Zhang1†
 Liyu Yang1Pengkun Yang1,2
 Yingying Qiao1Zhanbing Han1Jiaying Fan1,2Qiang Li1Dingding Zhang1
 Zhuanjian Li3,4
 Xiangtao Kang3,4Juan Du5
 Ruiting Li1*
- 1College of Animal Science and Technology, Henan University of Animal Husbandry and Economy, Zhengzhou, China
- 2Henan Key Laboratory of Healthy Breeding and Efficient Reproduction of Livestock and Poultry, Zhengzhou, China
- 3College of Animal Science and Technology, Henan Agricultural University, Zhengzhou, China
- 4Key Research Project of the Shennong Laboratory, Zhengzhou, China
- 5Zhengzhou Health College, Zhengzhou, China
Tyrosine is known to influence melanin generation; however, its involvement in melanin production in chicken feathers is unknown. We evaluated the feather color of H-line chickens fed diets containing different concentrations of tyrosine (0, 0.4, 0.6, 0.8, and 1.0%). The results indicated that a diet containing 1.0% tyrosine fed for 40 days significantly increased melanin deposition in the feathers (p < 0.05). Following this observation, we collected feather follicle tissue from chickens fed either 0% or 1.0% tyrosine at the 40-day time point for transcriptome sequencing. RNA-seq analysis identified a total of 314 DEGs, comprising 116 upregulated and 198 downregulated genes. KEGG analysis of feather follicle tissue revealed that 7 DEGs (EDNRB2, WNT3, POMC, INS, FLT3, CACNA2D3, and CACNA1I) mapped to melanin-related pathways, including the melanogenesis, MAPK signaling and Wnt signaling pathways. We also identified specific protein interactions within the melanin pathway, including EDNRB2–MLPH and WNT3–FGF16 interactions. Notably, the expression level of the EDNRB2 gene reached its peak at 10 weeks within the 0–12 week growth period in H-line chickens. In primary chicken melanocytes, EDNRB2 expression was quantified following tyrosine supplementation and was found to be markedly elevated at a concentration of 10−6 mol/L, significantly higher than the control and other treatment groups (p < 0.05). Overall, our findings suggest the significant involvement of the tyrosine-induced EDNRB2 regulatory network in melanin levels in sub-Columbian plumage. Taken together, these findings increase our understanding of the molecular mechanisms that regulate tyrosine-mediated melanin deposition in chicken plumage.
1 Introduction
The chicken, with diverse plumage color combinations and patterns, ranks among the most colorful terrestrial vertebrates, thereby capturing the interest of researchers (1). Feather color not only attracts the opposite sex but also deters predators from chickens. Feather color is an important external characteristic in chickens (2). It not only is a significant identifying feature for different breeds but also influences consumers’ choices when selecting high-quality live poultry in markets, so it holds economic significance (3). With the rapid development of integrated agriculture, improving feed nutrition to maintain and improve feather color is essential. Altering the plumage color phenotype by adding nutrients to the feed, with the aim of identifying key genes that influence this phenotype, has become an important approach in poultry breeding.
Chicken feather color is determined by the quantity and distribution of melanin, which are dependent on the interaction between genotype and nutrition (4). Modern technological advances and scientific research have resulted in the identification of numerous mutations in genes affecting chicken feather color, including dominant white (I), recessive white (c), barring (B), spots (mo), extended black (E), dark brown (DB), and Columbia, among others (5–9). Nutritional factors can also affect melanin deposition in animals (10). For example, a combination of vitamin C and vitamin E supplementation can be used to treat age spots or melasma in humans (11). Additional studies have demonstrated a notable decrease in UV-induced skin redness and enhancements in skin hydration and elasticity after the oral administration of lutein (12). Similarly, goldfish fed spirulina and astaxanthin-enriched brine shrimp presented improvements in pigmentation and skin redness indices (13). However, there have been no reports on the impact of exogenous nutrient supplementation on chicken feather color.
Melanin synthesis is performed by melanocytes in melanosomes (14), which then transfer melanin granules to adjacent keratinocytes, resulting in melanin accumulation and, in chickens, the production of pigmented feathers (15). In mature melanocytes, tyrosine is acted upon by tyrosinase and tyrosinase-related proteins to produce DOPA, which subsequently undergoes further oxidation to dopaquinone. Finally, after further reactions, dopaquinone is converted to melanin, which affects fur color, body color, and skin color phenotypes (16, 17). At present, some reports indicate that the addition of moderate amounts of tyrosine can promote the formation of melanin in animals. For example, Li reported that adding tyrosine to the diet can enhance melanin deposition in the breast muscles of Xichuan black-boned chickens (18). A tyrosine-deficient diet can cause black cat fur to become reddish-brown (19). By adjusting the concentrations of copper and specific amino acids, such as phenylalanine and tyrosine, in the diet, the deposition of red pigments in the white fur of dogs can be significantly increased (20). Additionally, increasing the intake of tyrosine in the diet can increase the deposition of black pigments in dog fur (21). However, the effects of a tyrosine diet on melanin deposition in chicken feathers and the underlying mechanism are still unclear.
Three “Yufen I” hybrid lines were established from Chinese commercial laying hens by Henan Agricultural University. The H line is characterized by mostly white feathers, accompanied by black barring on the primary and secondary feathers, as well as the hackles and tail. While this coloration resembles the Columbian plumage, it involves black barring rather than verticle stripes and is thus termed “sub-Columbian” (22). Theoretical studies on the Columbian plumage pattern began as early as 1955 (23). Previous studies in our laboratory have shown that sub-Columbian plumage is influenced by SLC45A2 and CDKN2A, which are inherited as dominant companions (22). Moreover, transcriptome sequencing of the sub-Columbian feathers, including black and white follicles from the dorsal neck region and white follicles from the abdominal neck, revealed that MED23 and GNAQ are essential for melanin accumulation (24). Additionally, by analyzing transcriptome data from feather follicles from differently colored chickens (yellow, sub-Columbian, and silver) in their necks and wings, it was determined that elevated SLC45A2 and GPNMB levels could enhance melanin deposition in feathers from H-line chickens (25). Although the genetic foundation of feather color in H line chickens is relatively well understood, the regulatory molecular mechanisms underlying melanin deposition in feathers through the addition of tyrosine in feed are not widely known. EDNRB2, a gene crucial for melanoblast differentiation and migration along the dorsolateral pathway, plays a significant role in controlling melanin deposition in the muscles of black-boned chickens (18, 26, 27). However, whether the expression of EDNRB2 is regulated by tyrosine, thereby influencing chicken plumage coloration, remains an unanswered question. This study focuses on H line hens as the research subjects, establishing a no-tyrosine group and groups with varying concentrations of tyrosine in the feed. Samples were collected at different times to determine the time and concentration of tyrosine addition that significantly affect feather color changes. The transcriptomes of neck follicles from untreated controls and tyrosine-treated chickens were sequenced, and the differentially expressed genes (DEGs) affecting feather color changes in follicles under tyrosine supplementation were screened. Using these data, we analyzed the temporal expression characteristics of the candidate gene EDNRB2 in different stages of H line hens, as well as the expression patterns before and after the addition of tyrosine to melanocytes (Figure 1). This study aimed to determine the optimal tyrosine supplementation in feed to increase melanin deposition in the feather color of H line hens and to elucidate the underlying molecular mechanisms involved.

Figure 1. Flow chart for screening and validating the effects of adding tyrosine to the diet on plumage color-associated genes in H line chickens.
2 Materials and methods
2.1 Sample collection
The H line chickens were provided by the Center of Poultry Germplasm Resources of Henan Agricultural University. A total of 200 20-week-old H-line laying hens were randomly assigned to five dietary treatments: one control group and four treatment groups (Groups I-IV). Each group consisted of 4 biological replicates, with 10 hens per replicate. The control group was fed a standard basal diet (Supplementary Table S1) and the four treatment groups received the same basal diet supplemented with tyrosine at concentrations of 0.4, 0.6, 0.8, and 1.0%, respectively. The tyrosine (purity 99%) used for supplementation was obtained from Swire Coca-Cola Drinks Co., Ltd. (Zhengzhou, Henan Province, China). The tyrosine was thoroughly incorporated into the basal diet using a commercial feed mixer to ensure uniform distribution within each formulated feed type. All hens were housed under identical environmental conditions. They were provided with unrestricted access to water and were fed twice daily according to the standard feeding regimen for the laying period.
On the 1st, 12th, 22nd and 40th days after tyrosine addition, the black spots of the nuchal follicle tissue of each group of hens (5 groups of 40) were scored using a YN-15 precision colorimeter (ThreeNH Technology, China), which operates on the CIE L*a*b* color space. Prior to measurement, the instrument was calibrated according to the manufacturer’s protocol using a standard white calibration tile. In the CIE L*a*b* model, the L* value represents lightness on a scale from 0 (pure black) to 100 (pure white), while a* and b* values represent the green-red and blue-yellow axes, respectively. As the plumage in this study exhibited a black-to-white spectrum, only the L* value was adopted for analysis. For each chicken, three feathers from the dorsal neck region were carefully selected. On each feather, a consistent measurement location near the tip was identified. Three replicate measurements were taken at this same spot per feather, ensuring the measuring aperture was in full and perpendicular contact with the feather surface to avoid ambient light interference. This procedure yielded nine raw L* readings per chicken, from which a mean value was calculated and recorded as the definitive neck feather lightness (L*) for the individual.
Based on the analysis results of the L* values, the treatment group with the most significant differences in feather color due to the addition of tyrosine was selected. From this treatment group and the control group, 3 hens were randomly selected from each group (a total of 6) to collect samples of the follicular tissue from their necks. Feather surfaces were wiped with cotton soaked in 75% alcohol, and tweezers were used to clamp the feather root; the follicular tissue was then separated using small forceps and placed in liquid nitrogen.
2.2 RNA sequencing
Six follicular tissues from the control (C) and treatment (T) groups were sent to Huada Gene (Shenzhen) for transcriptome sequencing (3 biological replicates in each group). Extraction of total RNA was performed using TRIzol (Invitrogen, United States). A fragment analyzer (Agilent 5200) was used to measure quality parameters such as RNA sample concentration and sample integrity. Six RNA-seq libraries (C1, C2, C3, T1, T2 and T3) were constructed after library purification (1.5% agarose gel electrophoresis). Library sequencing was performed on an Illumina HiSeq 4000 platform. Following the removal of adapter sequences and low-quality data, the raw and high-quality sequence lengths were calculated, along with the Q20 and Q30 values. Cutadapt was used to remove sequences that did not meet the quality criteria to obtain high-quality sequence data, which were then evaluated thoroughly before further analyses were conducted.
2.3 Bioinformatics analyses
Clean reads were aligned with the reference genome (Gallus_gallus-5.0) using HISAT (28). Transcript expression levels were determined using RSEM1 (29), with quantification as fragments per kilobase million (FPKM) values. EdgeR software (version 3.14.0) was utilized to assess expression variations among the groups to identify DEGs, using the criteria of p-value<0.05 and |log2FC (fold change)| > 1.5.
GO and KEGG analyses of the DEGs were performed using clusterProfiler in R (v3.6.1), using p < 0.05 as the significance threshold for enrichment.
Protein–protein interaction networks (PPI) were constructed to further investigate functional interactions between these DEGs. DEGs were mapped using STRING,2 and significant interactions with a combined score of >0.4 were selected for further analysis. Cytoscape (version 3.4.0) was utilized for network visualization.
2.4 Spatiotemporal expression pattern analysis
Six healthy one-day-old H line hens were selected from the Henan Agricultural University resource field and raised in individual cages. The neck feather follicle tissues were collected from the animals at 1d, 2, 4, 6, 8, 10, and 12 weeks of age, separated, and frozen in liquid nitrogen for preservation.
2.5 Tyrosine treatment of chicken melanocytes
Chicken primary melanocytes were isolated and cultured as described previously (25). Melanocytes were isolated from the peritoneum of Xichuan black-bone chickens at 20 embryonic days. The tissue was washed with PBS containing antibiotics, minced, and digested with dispase II and trypsin–EDTA at 37 °C for 1 h. The digestion was halted by adding supplemented Medium 254. The cell suspension was then filtered through a series of meshes, centrifuged, and the resulting pellet was resuspended to obtain the melanocytes, which were cultured at 37 °C with 5% CO₂. Cells (1 × 10⁴/ml) were grown in normal melanocyte medium, whereas experimental melanocytes were grown in media supplemented with various concentrations of tyrosine (10−9, 10−8, 10−7, and 10−6) mol/L for 3 days. The medium was replaced daily with fresh medium containing the corresponding tyrosine concentrations. After the treatment period, cells were collected and stored at −80 °C.
2.6 qRT–PCR
RNA was extracted from cells and tissues using TRIzol as above and was reverse-transcribed to cDNA using the Qiagen Reverse Transcription Kit. Primer Premier 6.0 was utilized for primer design; primers were synthesized by Shanghai Sangon Bioengineering Corporation Ltd. (Shanghai, China) and the sequences are given in Supplementary Table S2. The internal reference was GAPDH. A series of qRT–PCRs were conducted using 10 ul of SYBR master mix (Vazyme, Nanjing, China), 2 ul of cDNA, 7 ul of ultrapure water, and 0.5 ul of each primer (10 mM). The qRT–PCR program comprised predenaturation for 30 s at 95 °C, 40 3-s cycles at 95 °C and 30 s at 60 °C. The results were calculated as relative expression levels using the 2−ΔΔCt method (30).
2.7 Statistical analysis
GraphPad Prism 9 was utilized to calculate, analyze, and plot all the data. Data are expressed as the mean ± standard error of the mean (S. E. M.). One-way ANOVA and Student’s t-test were used for statistical analysis. Data are shown as means ± standard errors with p < 0.05 considered statistically significant.
3 Results
3.1 Feather color analysis after tyrosine feeding to H line chickens
An experiment in which tyrosine was added to the feed of H line hens revealed that a higher tyrosine concentration in the feed was associated with a lower feather L* value, that is, darker black spots. In addition, a longer duration of tyrosine feeding was correlated with a lower feather color L* value (Table 1). Feather melanin spot L* values were significantly lower in chickens fed a 1.0% tyrosine diet compared to those on a tyrosine-free diet after 40 days (p < 0.05) (Figure 2). Furthermore, within the 1.0% tyrosine group, the L* value decreased progressively over time, with the value at 40 days being significantly lower than at the start of the experiment (p < 0.05). This study found that feeding H line chickens with a diet containing 1.0% tyrosine for 40 days significantly increased the deposition of melanin in their feathers (p < 0.05).

Table 1. Effects of dietary tyrosine concentration and supplementation duration on feather melanin spot L* values.

Figure 2. Phenotypic effect of tyrosine on feather color. Representative feathers from the dorsal neck of hens fed a control (0% tyrosine) (A) or a 1.0% tyrosine-supplemented (B) diet for 40 days.
3.2 Descriptive statistics of the RNA-seq data
Follicle tissue gene expression in the C1, C2, C3, T1, T2, and T3 groups were analyzed by RNA-seq, and 43.04 ~ 44.07 MB of filtered clean reads were obtained. The per-sample mapping rate against the reference genome was between 82.40 and 86.95%. The average Q20 was 96.47%, and the average Q30 was 87.72% (Supplementary Table S3). Thus, the quality of the data was sufficient for further analysis.
3.3 DEG analysis
To clarify the pathways underlying the effects of tyrosine on feather color, DEGs between the control and tyrosine-fed follicles were analyzed. Overall, 13,956 genes were detected, from which 314 DEGs were identified between the C and T groups (p < 0.05). Of these, 116 were upregulated and 198 were downregulated in the T group (Figure 3). Notably, these DEGs included two marker genes of melanin deposition, EDNRB2 and MLPH.

Figure 3. Follicle tissue DEGs between the C and T groups. (A) Up- and down-regulated gene numbers. (B) Volcano plot of genes identified by RNA-seq, including both upregulated and downregulated genes.
3.4 Verification by qRT-PCR
The accuracy and reliability of the RNA-seq data were verified by randomly selecting six genes (WNT11, WNT3, GNAQ, PVALB, EDNRB2, and PRKCB) for qRT-PCR analysis. Assessment of expression and comparison with the RNA-seq data demonstrated the credibility of the RNA-seq data (Figure 4).

Figure 4. qRT–PCR verification of the RNA-seq data (n = 3).
3.5 GO analysis
The functions of the DEGs were analyzed further by GO enrichment. The GO classification system encompasses three primary categories, namely, biological process (BP), cellular component (CC), and molecular function (MF). Enrichment in the BP category primarily involved “cellular process,” “cell,” and “cell part,” while in MF, the most enriched subcategories were “binding,” “protein binding,” and “organic cyclic compound binding,” and in CC, “cell,” “cell part,” and “membrane” (Figure 5A). Notably, the DEGs observed among H line hens fed tyrosine were enriched mainly in BP (cellular process, biological regulation and regulation of biological process). Moreover, the DEGs showed marked enrichment in multicellular biological processes, transmembrane signaling receptor activity, and signaling receptor activity (p < 0.05) (Figures 5B,C).

Figure 5. GO enrichment analysis of DEGs. (A) DEG GO classifications. (B) Bubble diagram showing top 20 enriched GO terms. (C) GO enrichment circle.
3.6 KEGG analysis
As shown in Figure 6A, 72 DEGs were enriched in 5 KEGG Class A pathways and 16 KEGG Class B pathways. The KEGG enrichment circle plot revealed that the DEGs were the most enriched in neuroactive ligand–receptor interactions, the MAPK pathway and cytokine–cytokine receptor interactions (Figure 6B). Specifically, tyrosine supplementation resulted in significant changes in 4 pathways (p < 0.05), namely, “neuroactive ligand–receptor interactions,” “cytokine–cytokine receptor interactions,” “the intestinal immune network for IgA production,” and “valine, leucine and isoleucine biosynthesis” (Figure 6C). As indicated in Supplementary Table S4, the DEGs were associated with melanin-related pathways such as melanogenesis, the MAPK, Wnt, cAMP, PI3K-Akt, Notch, TGF-β, calcium, and mTOR pathways, as well as adrenergic signaling in cardiomyocytes. Notably, the network plot revealed relationships among the melanin-associated pathways involved in melanogenesis, MAPK and Wnt signaling; therefore, we focused on the 7 DEGs in these pathways (EDNRB2, WNT3, POMC, INS, FLT3, CACNA2D3, and CACNA1I; Figure 6D), which were likely to be involved in tyrosine-mediated feather color development (Figure 7).

Figure 6. KEGG analysis of DEGs. (A) DEG enrichment in KEGG Class A and B pathways. (B) KEGG enrichment circle. (C) Bubble diagram showing top 20 KEGG pathways. (D) Network plot of the interactions between different pathways.
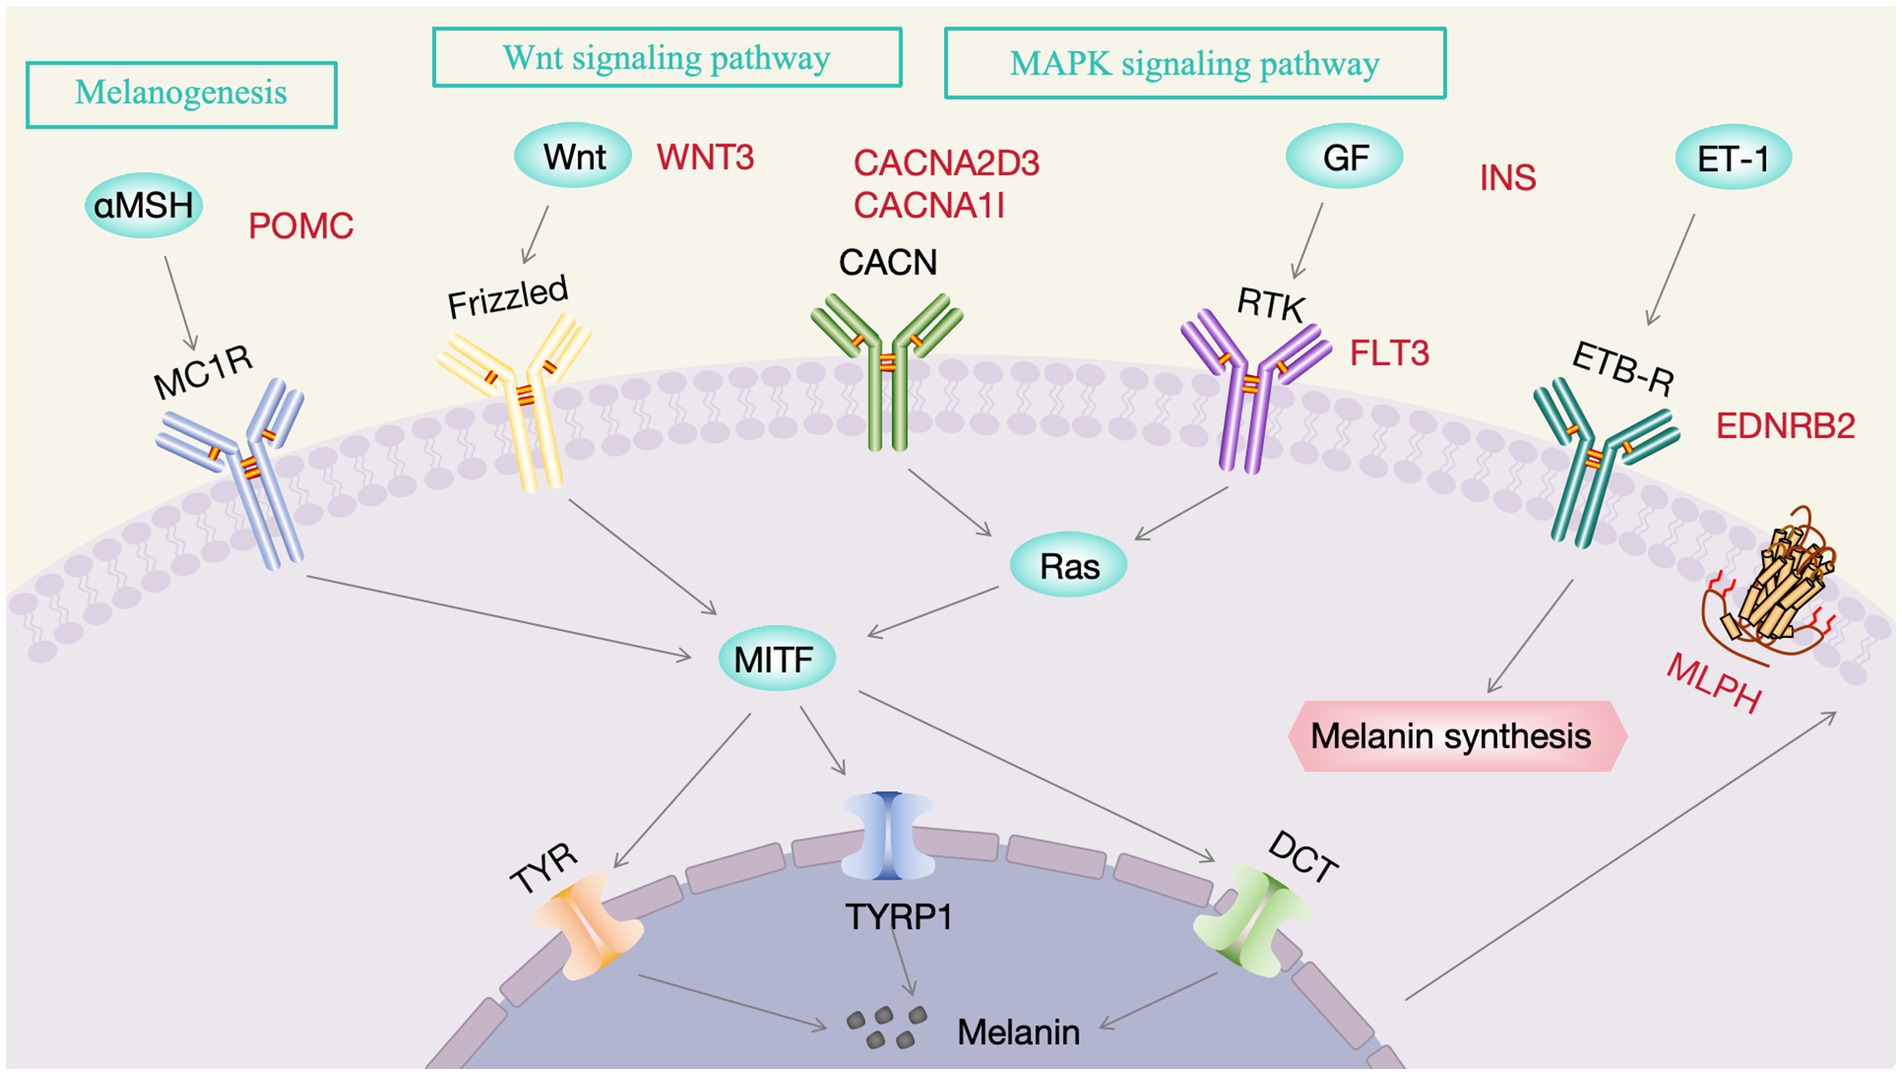
Figure 7. The mechanism of action of tyrosine on feather coloration. Red color indicates DEGs, while black represents non-DEGs.
3.7 DEG PPI network
The network consisted of 160 proteins and 172 interactions (Figure 8), among which the CD79B, IL21R, CXCR5, POU2AF1, CD72AG, CD72, PAX5, and VPREB3 proteins participated in more than 10 interactions. Notably, these networks are enriched in proteins involved in several melanin-related pathways. For example, POMC interacts with NPFFR1, INS, SSTR1, AGT, SSTR3, POU1F1, and TAC1, of which POMC participates in melanogenesis and INS participates in the MAPK and mTOR pathways. In addition, EDNRB2 interacted with MLPH, and WNT3 interacted with FGF16; among these, EDNRB2 and WNT3 showed enrichment in melanogenesis, whereas FGF16 showed enrichment in the MAPK pathway. Moreover, ACTC1, which is enriched in adrenergic signaling in cardiomyocytes, interacts with MYOG, CENPA, MYH1A, and MYBPC2; GRIN1, which is enriched in the calcium signaling pathway, interacts with GRIN2B, ARC, GRM3, and CAMKV. In addition, CACNA2D3 and FLT3, which are enriched in the MAPK signaling pathway, are connected to TENM4 and FGF16, respectively.

Figure 8. PPI network of DEGs. Nodes in the PPI network are colored on the basis of degree, with darker nodes indicating a greater degree.
3.8 Temporal expression analysis of EDNRB2
On the basis of the enrichment results of the KEGG pathways and PPIs related to the DEGs, we observed that EDNRB2 is not only annotated in the melanogenesis pathway but also interacts with the melanosome transport protein MLPH. To investigate the temporal expression characteristics of EDNRB2 at 1 d, 2 w, 4 w, 6 w, 8 w, 10 w, and 12 w in H line hens, we performed qRT–PCR with cDNA samples from neck follicle tissues at each time point (Figure 9). Notably, the expression levels of EDNRB2 were the highest at 10 W, and the expression levels were significantly different from those at other time points (p < 0.01).

Figure 9. Expression profile of EDNRB2 in the follicle tissue of H line hens at different stages. Data are expressed as mean ± SD (n = 6). Different uppercase letters within groups indicate highly significant differences (p < 0.01).
3.9 Analysis of EDNRB2 expression in chicken melanocytes after tyrosine supplementation
In this study, chicken primary melanocytes were selected, and the expression of EDNRB2 was verified by adding different concentrations of tyrosine to the cells. It was found that EDNRB2 levels in chicken melanocytes were highest when the tyrosine concentration was 10−6 mol/L, and the differences were markedly greater than those of the control (0 mol/L) and 10−9, 10−8, and 10−7 mol/L treatment groups (p < 0.05) (Figure 10).

Figure 10. Expression profile of EDNRB2 in primary melanocytes of chickens treated with different concentrations of tyrosine. Data are expressed as mean ± SD (n = 3). Different lowercase letters within groups indicate significant differences (p < 0.05).
4 Discussion
The color of chicken feathers is influenced not only by genetic factors but also by nutritional factors. Although many of the genes related to feather colors have been characterized, the molecular mechanisms controlling melanin deposition in feathers in relation to dietary nutrient intake have not yet been fully explored. Tyrosine is known to be associated with melanin formation. Studies have shown that feeding tyrosine can increase the melanin content in animals, but there is no relevant research indicating that tyrosine can increase melanin in chicken feathers. In this study, we allocated chickens with sub-Columbian plumage to different tyrosine supplementation groups to determine the optimal dosage and feeding time for inducing black spots in feathers. The results indicated that dietary tyrosine affects the melanin content in feathers in a concentration-dependent manner. Specifically, when the tyrosine content in the feed is 1.0% and the feeding duration is 40 days, it can significantly increase the melanin content in the follicles (p < 0.05). Similarly, in previous work, dietary supplementation with 0.8% tyrosine was found to promote the deposition of melanin in the pectoral muscles of the Xichuan black-bone chicken (18). This study provides guidance for the nutritional regulation of feather color in the H line chickens and the breeding of excellent germplasm. These findings provide a theoretical foundation for the development and utilization of tyrosine in improving melanin deposition in chicken feathers.
Indeed, deciphering the effects of tyrosine-mediated gene upregulation or downregulation on feather follicle melanin deposition represents an interesting topic. The elucidation of the mechanisms responsible for melanin deposition in chicken feathers through tyrosine is extremely important for the development and utilization of sub-Columbian plumage. Transcriptome sequencing is a high-throughput method used to examine RNA molecules in tissues, with a focus on gene expression patterns and changes. Because black spots are present on the necks of chickens with sub-Columbian plumage, we selected a blank control group and an optimal feeding group of chicken neck follicle tissues for transcriptome sequencing to analyze the molecular mechanism through which tyrosine promotes melanin deposition in feathers. The marker gene MLPH, which is associated with melanin deposition, was detected in our transcriptome sequencing data. MLPH is a structural protein that facilitates the transport of mature melanosomes in melanocytes, which can cause melanosomes to aggregate in the dendrites of melanocytes and thereby regulate animal skin and coat color (31, 32). The expression of MLPH varies across tissues, as mature melanosomes are transported to dendritic terminals within melanocytes for short-distance movement, which is correlated with the expression levels and activity of the Rab27a, MLPH, and MyoVa ternary complex (33). Mutations in human MLPH can lead to Griscelli syndrome, which is characterized by abnormal skin pigmentation and light silver–white hair starting in infancy (34). The lavender diluted feather phenotype in chickens, akin to that of Japanese quail, is due to mutations in MLPH (35, 36). Combined with previous results, we hypothesized that the MLPH expression level is associated with tyrosine-mediated melanin deposition in the chicken.
Enrichment analyses were performed to elucidate DEG functions. KEGG pathway analysis revealed that the DEGs EDNRB2, WNT3, POMC, INS, FLT3, CACNA2D3, and CACNA1I were involved in melanogenesis and MAPK and Wnt signaling, all of which are known to be interconnected with each other. Melanogenesis is a complex biosynthetic process in melanocytes that leads to the production of melanin pigments through a series of enzymatic and chemically catalyzed reactions (37). EDNRB2 and POMC both showed enrichment in the melanogenesis pathway, and their involvement in melanin production is well-documented. POMC is mainly secreted in the hypothalamus and acts as a precursor polypeptide hormone and is associated with the morphological differentiation and the production of melanin in B16-F10 melanoma cells (38, 39). Moreover, POMC is converted into hormones derived from it, including ACTH and α-MSH (39). α-MSH increases peroxide levels in melanocytes to stimulate the synthesis of melanin (40). MITF is a melanocyte-specific transcription factor that can directly bind and activate the tyrosinase promoter, upregulating tyrosinase levels and promoting melanin production (41). The Wnt axis is known to regulate MITF expression (42). This involves Wnt binding to the G-protein coupled receptor Frizzled, inactivating GSK3β and ultimately resulting in β-catenin accumulation (43–46). This β-catenin undergoes nuclear translocation where it binds to Lef-TCF, thereby increasing MITF expression and stimulating melanin synthesis (47, 48). Wnt3 is part of a group of approximately 20 ligands involved in the Wnt axis, influencing cell proliferation and differentiation (49). Therefore, we speculate that WNT3 may promote the proliferation of melanocytes through the WNT signaling pathway. In addition, an interaction between Wnt3 and FGF16 was found when comparing the C and T groups. FGF family proteins are typically involved in cell proliferation, differentiation, and survival, and it is thus suggested that an interaction between Wnt3 and FGF16 may promote proliferation (50). The MEK and ERK kinases associated with the MAPK axis are known to activate melanocyte receptors (51). Ligands bind to the extracellular domain of the receptor, activating a cascade (Ras–Raf–MEK–ERK) that leads to the upregulation of MITF (51). P38 phosphorylation induces MITF expression, in turin upregulating proteins associated with melanin production and thus melanin synthesis (52). The INS gene encodes insulin, which activates the insulin signaling pathway during the process of cell differentiation, thereby promoting cell maturation (53). FLT3 is a type III receptor tyrosine kinase, and its ligand can induce dimerization and activate its intrinsic tyrosine kinase activity, leading to autophosphorylation and the initiation of several signaling cascades, including the MAPK signaling pathway (54, 55). CACNA2D3 and CACNA1I are both gene families associated with calcium channels that play key roles in the regulation of intracellular calcium ion concentration, influencing cell proliferation and differentiation by affecting the MAPK signaling pathway (56). Thus, we speculate that these DEGs are involved in melanin production, although the precise genetic process requires further research.
Among the DEGs identified here, EDNRB2 is worthy of attention because it not only participates in melanin-related pathways but also interacts with the MLPH protein. EDNRB2, an EDNRB paralog, encodes a seven-transmembrane-domain G protein-coupled receptor (26, 27, 57, 58). EDNRB2 dysfunction affects pigment synthesis, leading to white fur and pink skin (59–61). EDNRB2 is also associated with the migration and differentiation of melanocytes and has been linked to plumage color in quail, chickens, and domestic ducks (7, 27, 61, 62). Chicken feathers from the embryonic stage to adulthood undergo 3 ~ 4 generations of replacement, and we call this phenomenon production molting; after many molts, the feather color becomes stable. At 55 days of age, the third-generation feathers (young feathers) of chickens begin to appear, and the feather color on the body surface of chickens is mature or nearly mature and tends to be stable (63). Our own observations in the H-line chickens are consistent with this timeline: starting from yellow chick down, the chickens develop their characteristic sub-Columbian plumage pattern through successive molting, with the definitive coloration becoming stable by approximately 10 weeks of age. This developmental timeline explains the peak in EDNRB2 expression at 10 weeks within the 0-12w expression profile, suggesting a crucial role for EDNRB2 in the formation of the sub-Columbian plumage pattern and the associated melanin deposition process.
The black pigment in the feathers of chickens is produced in melanocytes through a series of biochemical reactions involving tyrosine, and many studies have indicated that adding tyrosine to melanocytes can promote melanin deposition (64). For example, the addition of tyrosine to culture medium promoted melanin synthesis in mouse B16 melanoma cells (65). Adding 400 μM L-tyrosine to Ham’s F-10 medium led to the induction of melanin pigment production in human melanoma cells (66). Treating in vitro-induced primary chicken melanocytes with varying amounts of tyrosine promoted melanin proliferation and increased the tyrosinase content in the cells (18). Here, marked increases in the levels of EDNRB2 were observed after the addition of 10−6 mol/L tyrosine to chicken primary melanocytes. However, a previous study reported that the highest expression level of EDNRB2 in chicken primary melanocytes was observed when 10−9 mol/L tyrosine was added, indicating that the optimal concentration for increasing EDNRB2 may be related to the cell state and culture conditions (18). In summary, we confirmed that exogenously added tyrosine can promote the expression of EDNRB2 at the cell level, thereby facilitating melanin deposition.
5 Conclusion
The results of our study reveal that a 40-day diet with 1.0% tyrosine can significantly intensify the darkness of black spots on the feathers of sub-Columbian (p < 0.05). To further explore the mechanism of action, we conducted transcriptomic sequencing analysis on the feather follicle tissues of the control group and the tyrosine treatment group (which received a diet supplemented with 1.0% tyrosine for 40 days) using RNA-seq technology. Tyrosine induction of melanin deposition in follicular tissues of chickens with sub-Columbian plumage might be significantly affected by the EDNRB2-mediated regulatory network. These results advance the knowledge of the molecular regulation of melanin deposition in sub-Columbian plumage, establishing a basis for feeding and breeding practices to modulate melanin levels in H-line chickens.
Data availability statement
The datasets supporting the conclusions of this article are included within the article and its additional files. Transcriptome sequencing data were deposited in the NCBI SRA database (SRA accession: PRJNA578584).
Ethics statement
All animal experimental procedures were approved by the Experimental Animal Ethics Review Committee (HNUAHEER 2425105) at Henan University of Animal Husbandry and Economy. The studies were conducted in accordance with the local legislation and institutional requirements. Written informed consent was obtained from the owners for the participation of their animals in this study.
Author contributions
XW: Data curation, Project administration, Validation, Formal analysis, Methodology, Conceptualization, Writing – original draft, Investigation, Writing – review & editing. LZ: Supervision, Writing – review & editing, Project administration, Data curation, Conceptualization. LY: Data curation, Writing – review & editing, Methodology, Validation, Formal analysis, Conceptualization. PY: Conceptualization, Investigation, Writing – review & editing, Data curation, Validation, Methodology. YQ: Data curation, Conceptualization, Formal analysis, Writing – review & editing, Validation, Methodology. ZH: Investigation, Project administration, Writing – review & editing, Data curation, Methodology. JF: Data curation, Conceptualization, Writing – review & editing, Methodology, Investigation. QL: Supervision, Writing – review & editing, Formal analysis, Methodology, Investigation, Conceptualization. DZ: Writing – review & editing, Methodology, Investigation, Conceptualization, Validation, Formal analysis. ZL: Methodology, Data curation, Project administration, Conceptualization, Funding acquisition, Resources, Writing – review & editing, Supervision. XK: Investigation, Conceptualization, Resources, Funding acquisition, Writing – review & editing, Project administration, Methodology, Supervision. JD: Formal analysis, Validation, Methodology, Writing – review & editing, Conceptualization. RL: Data curation, Methodology, Conceptualization, Validation, Investigation, Writing – review & editing, Writing – original draft, Project administration, Resources.
Funding
The author(s) declare that financial support was received for the research and/or publication of this article. This work was supported by the China Agriculture Research System of MOF and MARA (CARS-40), the Key Research Project of the Shennong Laboratory (SN01-2022-05), Modern Agricultural Industry Technology System of Henan Province (HARS-22-18-G3), and the Science and Technology Project of Henan province of China (242102110069).
Conflict of interest
The authors declare that the research was conducted in the absence of any commercial or financial relationships that could be construed as a potential conflict of interest.
The reviewer DW declared a past co-authorship with the authors ZL, XK to the handling editor.
Generative AI statement
The authors declare that no Gen AI was used in the creation of this manuscript.
Any alternative text (alt text) provided alongside figures in this article has been generated by Frontiers with the support of artificial intelligence and reasonable efforts have been made to ensure accuracy, including review by the authors wherever possible. If you identify any issues, please contact us.
Publisher’s note
All claims expressed in this article are solely those of the authors and do not necessarily represent those of their affiliated organizations, or those of the publisher, the editors and the reviewers. Any product that may be evaluated in this article, or claim that may be made by its manufacturer, is not guaranteed or endorsed by the publisher.
Supplementary material
The Supplementary material for this article can be found online at: https://www.frontiersin.org/articles/10.3389/fvets.2025.1720520/full#supplementary-material
Footnotes
References
1. Mata-Estrada, A, González-Cerón, F, Pro-Martínez, A, Torres-Hernández, G, Bautista-Ortega, J, Becerril-Pérez, CM, et al. Comparison of four nonlinear growth models in creole chickens of Mexico. Poult Sci. (2020) 99:1995–2000. doi: 10.1016/j.psj.2019.11.031
2. Roulin, A, and Ducrest, AL. Genetics of colouration in birds. Semin Cell Dev Biol. (2013) 24:594–608. doi: 10.1016/j.semcdb.2013.05.005
3. Huang, T, Pu, Y, Song, C, Sheng, Z, and Hu, X. A quantitative trait locus on chromosome 2 was identified that accounts for a substantial proportion of phenotypic variance of the yellow plumage color in chicken. Poult Sci. (2020) 99:2902–10. doi: 10.1016/j.psj.2020.01.030
4. Sturm, RA, Teasdale, RD, and Box, NF. Human pigmentation genes: identification, structure and consequences of polymorphic variation. Gene. (2001) 277:49–62. doi: 10.1016/s0378-1119(01)00694-1
5. Kerje, S, Sharma, P, Gunnarsson, U, Kim, H, Bagchi, S, Fredriksson, R, et al. The dominant white, dun and smoky color variants in chicken are associated with insertion/deletion polymorphisms in the Pmel17 gene. Genetics. (2004) 168:1507–18. doi: 10.1534/genetics.104.027995
6. Chang, CM, Coville, JL, Coquerelle, G, Gourichon, D, Oulmouden, A, and Tixier-Boichard, M. Complete association between a retroviral insertion in the tyrosinase gene and the recessive white mutation in chickens. BMC Genomics. (2006) 7:19. doi: 10.1186/1471-2164-7-19
7. Kinoshita, K, Akiyama, T, Mizutani, M, Shinomiya, A, Ishikawa, A, Younis, HH, et al. Endothelin receptor B2 (Ednrb2) is responsible for the tyrosinase-independent recessive white (Mo(W)) and mottled (Mo) plumage phenotypes in the chicken. PLoS One. (2014) 9:e86361. doi: 10.1371/journal.pone.0086361
8. Schwochow Thalmann, D, Ring, H, Sundström, E, Cao, X, Larsson, M, Kerje, S, et al. The evolution of sex-linked barring alleles in chickens involves both regulatory and coding changes in Cdkn2a. PLoS Genet. (2017) 13:e1006665. doi: 10.1371/journal.pgen.1006665
9. Gunnarsson, U, Kerje, S, Bed'hom, B, Sahlqvist, AS, Ekwall, O, Tixier-Boichard, M, et al. The dark brown plumage color in chickens is caused by an 8.3-kb deletion upstream of Sox10. Pigment Cell Melanoma Res. (2011) 24:268–74. doi: 10.1111/j.1755-148X.2011.00825.x
10. Seok Won, L, Jae Heon, K, Hyerim, S, Jin Kyung, S, Seong Su, H, and Yong Chool, B. Luteolin 7-sulfate attenuates melanin synthesis through inhibition of Creb- and Mitf-mediated tyrosinase expression. Antioxidants (Basel). (2019) 8:4. doi: 10.3390/antiox8040087
11. Rhie, G, Shin, MH, Seo, JY, Choi, WW, Cho, KH, Kim, KH, et al. Aging- and photoaging-dependent changes of enzymic and nonenzymic antioxidants in the epidermis and dermis of human skin in vivo. J Invest Dermatol. (2001) 117:1212–7. doi: 10.1046/j.0022-202x.2001.01469.x
12. Palombo, P, Fabrizi, G, Ruocco, V, Ruocco, E, Fluhr, J, Roberts, R, et al. Beneficial long-term effects of combined oral/topical antioxidant treatment with the carotenoids lutein and zeaxanthin on human skin: a double-blind, placebo-controlled study. Skin Pharmacol Physiol. (2007) 20:199–210. doi: 10.1159/000101807
13. Elshafey, AE, Khalafalla, MM, Zaid, AAA, Mohamed, RA, and Abdel-Rahim, MM. Source diversity of Artemia enrichment boosts goldfish (Carassius Auratus) performance, β-carotene content, pigmentation, immune-physiological and transcriptomic responses. Sci Rep. (2023) 13:21801. doi: 10.1038/s41598-023-48621-4
14. Silvia, Y, Hae Ran, L, Seong Min, H, Ji-Young, K, Tong Ho, K, Ai Young, L, et al. Aspacochioside C from Asparagus cochinchinensis attenuates eumelanin synthesis via inhibition of Trp2 expression. Sci Rep. (2023) 13:14831. doi: 10.1038/s41598-023-41248-5
15. Guo, H, Yang, K, Deng, F, Xing, Y, Li, Y, Lian, X, et al. Wnt3a inhibits proliferation but promotes melanogenesis of Melan-a cells. Int J Mol Med. (2012) 30:636–42. doi: 10.3892/ijmm.2012.1028
16. Slominski, A, Tobin, DJ, Shibahara, S, and Wortsman, J. Melanin pigmentation in mammalian skin and its hormonal regulation. Physiol Rev. (2004) 84:1155–228. doi: 10.1152/physrev.00044.2003
17. Ebanks, JP, Wickett, RR, and Boissy, RE. Mechanisms regulating skin pigmentation: the rise and fall of complexion coloration. Int J Mol Sci. (2009) 10:4066–87. doi: 10.3390/ijms10094066
18. Li, D, Wang, X, Fu, Y, Zhang, C, Cao, Y, Wang, J, et al. Transcriptome analysis of the breast muscle of Xichuan black-bone chickens under tyrosine supplementation revealed the mechanism of tyrosine-induced melanin deposition. Front Genet. (2019) 10:457. doi: 10.3389/fgene.2019.00457
19. Yu, S, Rogers, QR, and Morris, JG. Effect of low levels of dietary tyrosine on the hair colour of cats. J Small Anim Pract. (2001) 42:176–80. doi: 10.1111/j.1748-5827.2001.tb01798.x
20. Watson, A, Le Verger, L, Guiot, AL, Feugier, A, and Biourge, V. Nutritional components can influence hair coat colouration in white dogs. J Appl Anim Nutr. (2017) 5:e5. doi: 10.1017/jan.2016.3
21. Watson, A, Wayman, J, Kelley, R, Feugier, A, and Biourge, V. Increased dietary intake of tyrosine upregulates melanin deposition in the hair of adult black-coated dogs. Anim Nutr. (2018) 4:422–8. doi: 10.1016/j.aninu.2018.02.001
22. Li, R, Wang, X, Wang, Y, Liu, D, Zhang, Y, Liu, Y, et al. Research note: combined analysis of Bsa-Seq based mapping and RNA-seq reveals candidate genes associated with sub-Columbian plumage in H line chickens. Poult Sci. (2023) 102:102665. doi: 10.1016/j.psj.2023.102665
23. Jaap, RG. Shank color and barred plumage in Columbian-colored chickens. Poult Sci. (1955) 34:389–95. doi: 10.3382/ps.0340389
24. Wang, X, Li, D, Song, S, Zhang, Y, Li, Y, Wang, X, et al. Combined transcriptomics and proteomics forecast analysis for potential genes regulating the Columbian plumage color in chickens. PLoS One. (2019) 14:e0210850. doi: 10.1371/journal.pone.0210850
25. Li, R, Wang, Y, Liu, Y, Li, D, Tian, Y, Liu, X, et al. Effects of Slc45a2 and Gpnmb on melanin deposition based on transcriptome sequencing in chicken feather follicles. Animals Basel. (2023) 12:16. doi: 10.3390/ani13162608
26. Harris, ML, Hall, R, and Erickson, CA. Directing pathfinding along the dorsolateral path - the role of Ednrb2 and Ephb2 in overcoming inhibition. Development. (2008) 135:4113–22. doi: 10.1242/dev.023119
27. Pla, P, Alberti, C, Solov'eva, O, Pasdar, M, Kunisada, T, and Larue, L. Ednrb2 orients cell migration towards the dorsolateral neural crest pathway and promotes melanocyte differentiation. Pigment Cell Res. (2005) 18:181–7. doi: 10.1111/j.1600-0749.2005.00230.x
28. Li, H, and Durbin, R. Fast and accurate short read alignment with burrows-wheeler transform. Bioinformatics. (2009) 25:1754–60. doi: 10.1093/bioinformatics/btp324
29. Li, B, and Dewey, CN. Rsem: accurate transcript quantification from RNA-seq data with or without a reference genome. BMC Bioinformatics. (2011) 12:323. doi: 10.1186/1471-2105-12-323
30. Pfaffl, MW. A new mathematical model for relative quantification in real-time rt-Pcr. Nucleic Acids Res. (2001) 29:e45. doi: 10.1093/nar/29.9.e45
31. Uyen, LDP, Nguyen, DH, and Kim, EK. Mechanism of skin pigmentation. Biotechnol Bioprocess Eng. (2008) 13:383–95. doi: 10.1007/s12257-008-0143-z
32. Langford, GM. Actin- and microtubule-dependent organelle motors: interrelationships between the two motility systems. Curr Opin Cell Biol. (1995) 7:82–8. doi: 10.1016/0955-0674(95)80048-4
33. Hume, AN, Ushakov, DS, Tarafder, AK, Ferenczi, MA, and Seabra, MC. Rab27a and Myova are the primary Mlph interactors regulating melanosome transport in melanocytes. J Cell Sci. (2007) 120:3111–22. doi: 10.1242/jcs.010207
34. Ménasché, G, Ho, CH, Sanal, O, Feldmann, J, Tezcan, I, Ersoy, F, et al. Griscelli syndrome restricted to hypopigmentation results from a melanophilin defect (Gs3) or a Myo5a F-exon deletion (Gs1). J Clin Invest. (2003) 112:450–6. doi: 10.1172/jci18264
35. Vaez, M, Follett, SA, Bed'hom, B, Gourichon, D, Tixier-Boichard, M, and Burke, T. A single point-mutation within the Melanophilin gene causes the lavender plumage colour dilution phenotype in the chicken. BMC Genet. (2008) 9:7. doi: 10.1186/1471-2156-9-7
36. Bed'hom, B, Vaez, M, Coville, JL, Gourichon, D, Chastel, O, Follett, S, et al. The lavender plumage colour in Japanese quail is associated with a complex mutation in the region of Mlph that is related to differences in growth, feed consumption and body temperature. BMC Genomics. (2012) 13:442. doi: 10.1186/1471-2164-13-442
37. Pillaiyar, T, Manickam, M, and Jung, SH. Recent development of Signaling pathways inhibitors of melanogenesis. Cell Signal. (2017) 40:99–115. doi: 10.1016/j.cellsig.2017.09.004
38. Gregoric, N, Groselj, U, Bratina, N, Debeljak, M, Zerjav Tansek, M, Suput Omladic, J, et al. Two cases with an early presented proopiomelanocortin deficiency-a long-term follow-up and systematic literature review. Front Endocrinol (Lausanne). (2021) 12:689387. doi: 10.3389/fendo.2021.689387
39. Liu, GS, Tsai, HE, Weng, WT, Liu, LF, Weng, CH, Chuang, MR, et al. Systemic Pro-opiomelanocortin expression induces melanogenic differentiation and inhibits tumor angiogenesis in established mouse melanoma. Hum Gene Ther. (2011) 22:325–35. doi: 10.1089/hum.2010.090
40. Panich, U, Onkoksoong, T, Limsaengurai, S, Akarasereenont, P, and Wongkajornsilp, A. Uva-induced melanogenesis and modulation of glutathione redox system in different melanoma cell lines: the protective effect of gallic acid. J Photochem Photobiol B. (2012) 108:16–22. doi: 10.1016/j.jphotobiol.2011.12.004
41. Hyeon-Mi, K, and Chang-Gu, H. Drug repurposing of Voglibose, a diabetes medication for skin health. Pharmaceuticals (Basel). (2025) 18:224. doi: 10.3390/ph18020224
42. Cho, M, Ryu, M, Jeong, Y, Chung, YH, Kim, DE, Cho, HS, et al. Cardamonin suppresses melanogenesis by inhibition of Wnt/Beta-catenin Signaling. Biochem Biophys Res Commun. (2009) 390:500–5. doi: 10.1016/j.bbrc.2009.09.124
43. Yamada, T, Hasegawa, S, Inoue, Y, Date, Y, Yamamoto, N, Mizutani, H, et al. Wnt/β-catenin and kit Signaling sequentially regulate melanocyte stem cell differentiation in Uvb-induced epidermal pigmentation. J Invest Dermatol. (2013) 133:2753–62. doi: 10.1038/jid.2013.235
44. Bellei, B, Pitisci, A, Catricalà, C, Larue, L, and Picardo, M. Wnt/β-catenin Signaling is stimulated by α-melanocyte-stimulating hormone in melanoma and melanocyte cells: implication in cell differentiation. Pigment Cell Melanoma Res. (2011) 24:309–25. doi: 10.1111/j.1755-148X.2010.00800.x
45. Lin, X, Meng, X, and Lin, J. The possible role of Wnt/β-catenin signalling in vitiligo treatment. J Eur Acad Dermatol Venereol. (2023) 37:2208–21. doi: 10.1111/jdv.19022
46. Guo, H, Xing, Y, Liu, Y, Luo, Y, Deng, F, Yang, T, et al. Wnt/β-catenin signaling pathway activates melanocyte stem cells in vitro and in vivo. J Dermatol Sci. (2016) 83:45–51. doi: 10.1016/j.jdermsci.2016.04.005
47. De Robertis, EM, and Ploper, D. Sperm motility requires Wnt/Gsk3 stabilization of proteins. Dev Cell. (2015) 35:401–2. doi: 10.1016/j.devcel.2015.11.009
48. Ploper, D, and De Robertis, EM. The Mitf family of transcription factors: role in Endolysosomal biogenesis, Wnt Signaling, and oncogenesis. Pharmacol Res. (2015) 99:36–43. doi: 10.1016/j.phrs.2015.04.006
49. Teh, C, Sun, G, Shen, H, Korzh, V, and Wohland, T. Modulating the expression level of secreted Wnt3 influences cerebellum development in zebrafish transgenics. Development. (2015) 142:3721–33. doi: 10.1242/dev.127589
50. Ding, HY, and Ma, HX. Significant roles of anti-aging protein klotho and fibroblast growth Factor23 in cardiovascular disease. J Geriatr Cardiol. (2015) 12:439–47. doi: 10.11909/j.issn.1671-5411.2015.04.017
51. Hemesath, TJ, Price, ER, Takemoto, C, Badalian, T, and Fisher, DE. Map kinase links the transcription factor microphthalmia to C-kit signalling in melanocytes. Nature. (1998) 391:298–301. doi: 10.1038/34681
52. Smalley, K, and Eisen, T. The involvement of P38 mitogen-activated protein kinase in the alpha-melanocyte stimulating hormone (alpha-Msh)-induced melanogenic and anti-proliferative effects in B16 murine melanoma cells. FEBS Lett. (2000) 476:198–202. doi: 10.1016/s0014-5793(00)01726-9
53. Al-Hasani, K, Marikar, SN, Kaipananickal, H, Maxwell, S, Okabe, J, Khurana, I, et al. Ezh2 inhibitors promote β-like cell regeneration in Young and adult type 1 diabetes donors. Signal Transduct Target Ther. (2024) 9:2. doi: 10.1038/s41392-023-01707-x
54. Annesley, CE, and Brown, P. The biology and targeting of Flt3 in Pediatric Leukemia. Front Oncol. (2014) 4:263. doi: 10.3389/fonc.2014.00263
55. Zheng, R, Levis, M, Piloto, O, Brown, P, Baldwin, BR, Gorin, NC, et al. Flt3 ligand causes autocrine Signaling in acute myeloid Leukemia cells. Blood. (2004) 103:267–74. doi: 10.1182/blood-2003-06-1969
56. Khare, D, Basu, B, and Dubey, AK. Electrical stimulation and piezoelectric biomaterials for bone tissue engineering applications. Biomaterials. (2020) 258:120280. doi: 10.1016/j.biomaterials.2020.120280
57. Lecoin, L, Sakurai, T, Ngo, MT, Abe, Y, Yanagisawa, M, and Le Douarin, NM. Cloning and characterization of a novel endothelin receptor subtype in the avian class. Proc Natl Acad Sci USA. (1998) 95:3024–9. doi: 10.1073/pnas.95.6.3024
58. Braasch, I, and Schartl, M. Evolution of endothelin receptors in vertebrates. Gen Comp Endocrinol. (2014) 209:21–34. doi: 10.1016/j.ygcen.2014.06.028
59. Kelsh, RN, Harris, ML, Colanesi, S, and Erickson, CA. Stripes and belly-spots -- a review of pigment cell morphogenesis in vertebrates. Semin Cell Dev Biol. (2009) 20:90–104. doi: 10.1016/j.semcdb.2008.10.001
60. Fontanesi, L, Vargiolu, M, Scotti, E, Latorre, R, Faussone Pellegrini, MS, Mazzoni, M, et al. The kit gene is associated with the English spotting coat color locus and congenital megacolon in checkered Giant rabbits (Oryctolagus Cuniculus). PLoS One. (2014) 9:e93750. doi: 10.1371/journal.pone.0093750
61. Li, L, Li, D, Liu, L, Li, S, Feng, Y, Peng, X, et al. Endothelin receptor B2 (Ednrb2) gene is associated with spot plumage pattern in domestic ducks (Anas Platyrhynchos). PLoS One. (2015) 10:e0125883. doi: 10.1371/journal.pone.0125883
62. Miwa, M, Inoue-Murayama, M, Aoki, H, Kunisada, T, Hiragaki, T, Mizutani, M, et al. Endothelin receptor B2 (Ednrb2) is associated with the panda plumage colour mutation in Japanese quail. Anim Genet. (2007) 38:103–8. doi: 10.1111/j.1365-2052.2007.01568.x
63. Meng-Jie, C., Wen-Yan, X, Shi-Guang, J, Xiu-Qi, W, Hui-Chao, Y, and Chun-Qi, G. Molecular Signaling and Nutritional Regulation in the Context of Poultry Feather Growth and Regeneration. Front Physiol (2020) 10. doi: 10.3389/fphys.2019.01609
64. Maysam, M, and Martin, F. Therapeutic cell engineering: designing programmable synthetic genetic circuits in mammalian cells. Protein Cell. (2021) 13:476–89. doi: 10.1007/s13238-021-00876-1
65. Ikeda, M, Ishima, Y, Kinoshita, R, Chuang, VTG, Tasaka, N, Matsuo, N, et al. A novel S-Sulfhydrated human serum albumin preparation suppresses melanin synthesis. Redox Biol. (2018) 14:354–60. doi: 10.1016/j.redox.2017.10.007
Keywords: chicken, sub-Columbian plumage, EDNRB2, tyrosine, RNA-seq
Citation: Wang X, Zhang L, Yang L, Yang P, Qiao Y, Han Z, Fan J, Li Q, Zhang D, Li Z, Kang X, Du J and Li R (2025) Transcriptomic insights into the effects of tyrosine on sub-Columbian plumage in H line chickens. Front. Vet. Sci. 12:1720520. doi: 10.3389/fvets.2025.1720520
Edited by:
Miguel H. A. Santana, University of São Paulo, BrazilReviewed by:
Zhanwei Teng, Henan Institute of Science and Technology, ChinaDandan Wang, Henan Institute of Science and Technology, China
Xiangyong Qu, Hunan Agricultural University, China
Copyright © 2025 Wang, Zhang, Yang, Yang, Qiao, Han, Fan, Li, Zhang, Li, Kang, Du and Li. This is an open-access article distributed under the terms of the Creative Commons Attribution License (CC BY). The use, distribution or reproduction in other forums is permitted, provided the original author(s) and the copyright owner(s) are credited and that the original publication in this journal is cited, in accordance with accepted academic practice. No use, distribution or reproduction is permitted which does not comply with these terms.
*Correspondence: Ruiting Li, bGlydWl0aW5nMjEwQDE2My5jb20=
†These authors have contributed equally to this work and share first authorship