 Pedro Lladó
 Roberto Barumerli
 Robert Baumgartner
 Piotr Majdak
- 1Acoustics Lab, Department of Information and Communication Engineering, Aalto University, Espoo, Finland
- 2Acoustics Research Institute, Austrian Academy of Sciences, Vienna, Austria
In augmented reality scenarios, headphones obstruct the direct path of the sound to the ears, affecting the users’ abilities to localize surrounding sound sources and compromising the immersive experience. Unfortunately, the assessment of the perceptual implications of wearing headphones on localization in ecologically valid scenarios is costly and time-consuming. Here, we propose a model-based tool for automatic assessment of the dynamic localization degradation (DLD) introduced by headphones describing the time required to find a target in an auditory-guided visual search task. First, we introduce the DLD score obtained for twelve headphones and the search times with actual listeners. Then, we describe the predictions of the headphone-induced DLD score obtained by an auditory model designed to simulate the listener’s search time. Our results indicate that our tool can predict the degradation score of unseen headphones. Thus, our tool can be applied to automatically assess the impact of headphones on listener experience in augmented reality applications.
1 Introduction
Auditory augmented-reality (AR) applications enhance the real world with virtual sounds, often presented via headphones (Nagele et al., 2021; Neidhardt and Zerlik, 2021; Schneiderwind et al., 2021), or more generally, via head-worn devices (HWDs) with acoustic drivers, such as head-mounted displays. These HWDs interfere with the natural transmission of the sound to the ears (Zimpfer and Sarafian, 2014; Ahrens et al., 2019; Denk et al., 2020; Lladó et al., 2022b; Poirier-Quinot and Lawless, 2023). This interference may affect the user’s ability to localize sounds from their surrounding, therefore potentially compromising the level of immersion (Gupta et al., 2018; Schneiderwind et al., 2021) or even safety (Brungart et al., 2004; Simpson et al., 2005). The development of AR-compatible headphones without perceptual degradation of the natural sound is considered one of the main technical challenges in binaural sound reproduction (Engel and Picinali, 2017; Nagele et al., 2021).
Multiple behavioral studies have shown that wearing an HWD hinders the listeners’ localization performance (Vause and Grantham, 1999; Bolia et al., 2001; Zimpfer and Sarafian, 2014; Brown et al., 2015; Lladó et al., 2022b). Listeners localize sounds by extracting the spatial information (e.g., source direction) from acoustic features generated by the interaction between the listeners’ anatomy and the acoustic field (Middlebrooks, 2015). Previous studies have shown that listeners wearing an HWD demonstrate significantly larger localization errors when compared to the open-ear condition, especially along the front-back and up-down dimensions (Vause and Grantham, 1999; Van den Bogaert et al., 2006; Van den Bogaert et al., 2008; Brungart et al., 2007; Zimpfer and Sarafian, 2014; Denk et al., 2018; Denk et al., 2019; Lladó et al., 2022b). However, those studies considered static conditions where both listener and sound source do not move. Such conditions do not necessarily represent an ecologically valid scenario for AR where listeners dynamically interact with the environment (Simpson et al., 2005; Neidhardt and Zerlik, 2021).
In order to introduce ecologically valid elements in evaluating HWDs, search tasks have been proposed (Bolia et al., 2001; Simpson et al., 2005). Within such tasks, the subject is asked to identify the position of the target and the search time required to respond is measured. While these paradigms have been extensively applied to assess visual perception (Wolfe, 1994; Eckstein, 2011; Wolfe and Horowitz, 2017), some studies included auditory cues to aid the task (Perrott et al., 1996; Bolia et al., 1999; Bolia et al., 1001; Simpson et al., 2005). The combination of auditory and visual cues result in faster responses than visual-only cues, especially when introducing distractors. Following this idea, an auditory-guided visual search test has shown that the time to find the visual source is a sensitive behavioural measure to study the effect of altered localization cues caused by HWDs (Bolia et al., 2001; Simpson et al., 2005; Lladó et al., 2024). This task appears to be of higher ecological relevance than a simple localization task under static listening conditions because it involves the integration of visual and auditory cues over time (Simpson et al., 2005).
Behavioural tests are time-consuming and require specific hardware. As a more efficient alternative, data analysis methods are employed to model the effects introduced by HWDs. One approach tries to identify the degradation of monaural cues by evaluating the spectral average ratio between the magnitudes of the transfer functions measured on the dummy head with and without the HWD (Genovese et al., 2018; Gupta et al., 2018; Porschmann et al., 2019; Denk et al., 2020; Meyer-Kahlen et al., 2020; Schneiderwind et al., 2021). Similarly, the evaluation of the interaural time and level differences obtained from the measurements with HWDs demonstrated how interaural cues are degraded compared to the measurements without the HWDs (Genovese et al., 2018; Gupta et al., 2018; Porschmann et al., 2019; Denk et al., 2020; Lladó et al., 2022a). Both evaluation approaches are limited to static scenarios and do not consider the dynamic interaction between the listener and the environment.
This article proposes a method to computationally assess the spatial effects of wearing HWDs in the auditory-guided visual search task. Our study is visualized in Figure 1, with our method shown in the lower path. As an input, our method requires the acoustically measured head-related transfer functions (HRTFs) of the HWDs under test. As the output, the method returns the degree of dynamic localization degradation on a six-level scale, with one representing the open-ear condition and six representing the most severe degradation. First, an auditory model simulates the listener’s behavior in the auditory-guided visual search task from Lladó et al. (2024) in the open-ear and HWD conditions. For this step, we took a Bayesian auditory localization model for static conditions (Barumerli et al., 2023) and extended it to account for temporal integration and voluntary head movements of a listener searching for the target (Wolfe, 1994). Then, our method classifies the model’s estimates to return the degree of degradation. To test our method, we consider twelve commercially available headphones to evaluate the predicted degradations of against those reported in a previous behavioral experiment (Lladó et al., 2024).
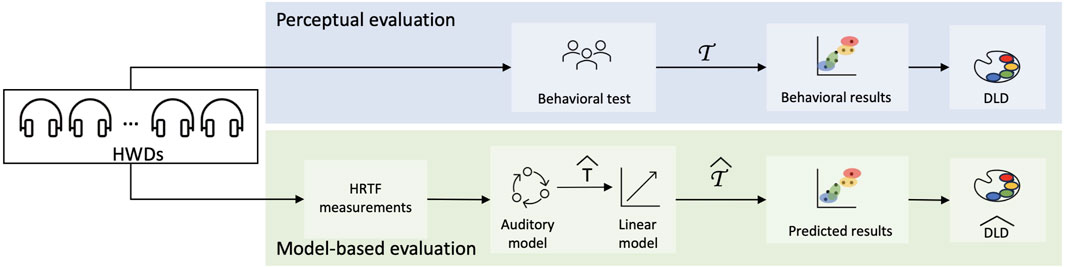
Figure 1. Overview of our study for the prediction of the HWD-induced dynamic localization degradation (DLD). The upper path (perceptual evaluation) shows the procedure to obtain the DLD computed from the normalized times to find the target
2 Degree of degradation: Behavioral data
We describe here the relevant elements of the behavioural experiment presented in Lladó et al. (2024) and introduce the degradation score based on a classification method.
2.1 Experimental task
The previously conducted behavioral experiment collected the search time required to find a target loudspeaker showing an even number of LEDs and playing a sound (Lladó et al., 2024). Twenty subjects between 19 and 39 years of age with self-reported normal hearing and normal or corrected vision were tested on 13 conditions. One condition served as the reference as subjects were listening with their open ears (OE), i.e., without any headphones on. In the twelve other conditions, subjects wore one of the headphones described in Table 1, covering a representative range of commercially available products applicable in AR systems.
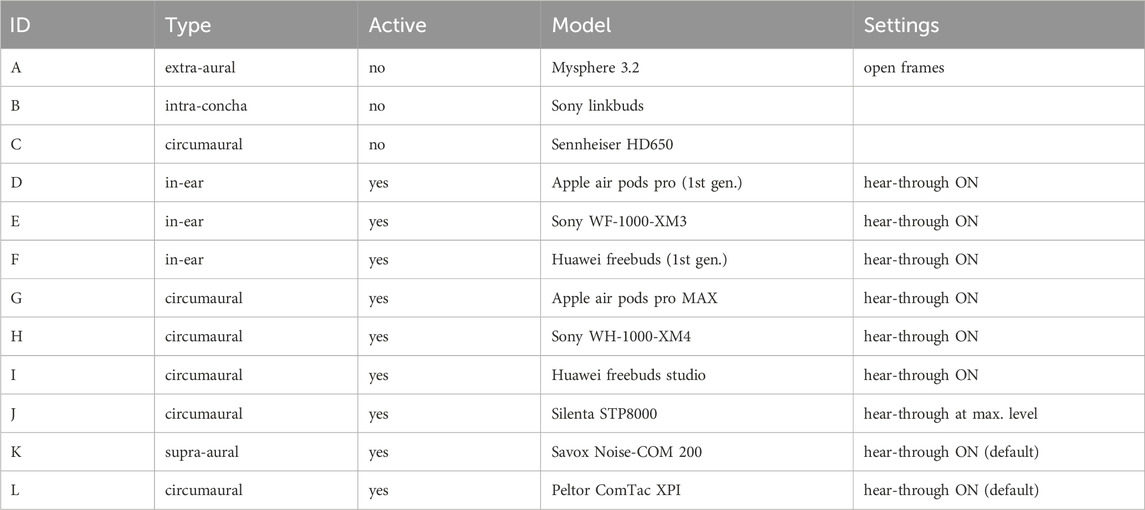
Table 1. Summary of the studied headphones and the settings used throughout the whole study. Devices ‘J’, ‘K’ and ‘L’ are hearing protectors with active hear-through option.
The experiment was conducted in the anechoic room ‘Wilska’ at the Aalto Acoustics Lab, Espoo, Finland. Thirty-two Genelec 8331A coaxial loudspeakers were distributed in a spherical array with a radius of 2.04 m from the center of the room. Each loudspeaker was equipped with a 4-LED board forming a 2 × 2 matrix (15 mm × 15 mm for the LED centers) to display visual information. Two hand-held buttons were used as the interface for the listeners to control the experiment and give responses.
Each trial began with the participant facing the frontal loudspeaker. After releasing the hand-held buttons and a break of 1 s, the stimulus presentation from the target loudspeaker started. The sound stimulus was intermittent pink noise (250 ms on, 250 ms off, with onset and offset ramps of 10 ms) with an A-weighted sound pressure level of 65 dB SPL. During each trial, LEDs in all loudspeakers were illuminated but only the target loudspeaker had an even number of LEDs. The goal was to find the target and report the number of illuminated LEDs. The participants were instructed to press the left hand-held button if the number of illuminated LEDs was two, or the right one if the number of illuminated LEDs was four. The participants were instructed to respond as quickly as possible. Trials stopped immediately after a response was given. There was an upper limit of 14 noise bursts limiting each trial to 7 s, but this limit was never reached. More details on the methods can be found in Lladó et al. (2024).
2.2 Search time
The search time Tj,s,h was the time between the stimulus onset and the participant response for each trial j and subject s being tested with headphones h. The search times were then normalized by applying the z-transform:
with μs representing the mean and σs the standard deviation across all trials j of a subject s under all conditions together. The normalized search time
The left panel of Figure 2 shows the normalized search times per headphones condition. The median search time in the ‘OE’ condition was 0.96 s, and resulted in a normalized search time of −0.88. The headphones generally increased the search times and the slowest responses were found using headphones ‘K’, which resulted in a median search time of 1.68 s and a normalized search time of 0.05. For an exhaustive analysis focused on matching the acoustic characteristics of each studied headphones to the search times, see Lladó et al. (2024).
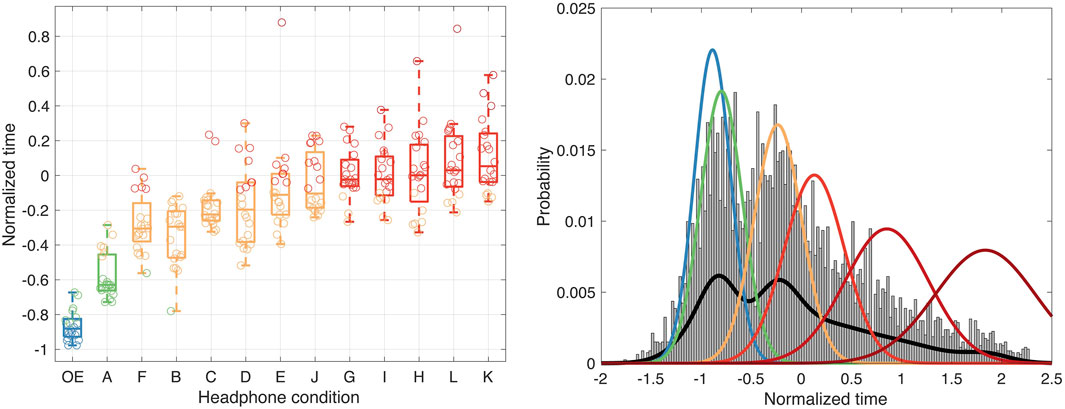
Figure 2. Normalized search times observed in the behavioral experiment in Lladó et al. (2024). Left panel: Normalized search time per condition (‘OE’: open-ear condition, i.e., without any headphone). Each point represents the median search time of a participant. Data points are colored according to the listener-dependent DLD classification; boxplots are colored according to the DLD score assigned to each headphone. Right panel: Histogram of all available normalized search times (bars), with the individual Gaussians that define the DLD scale (color lines) and the joint GMM (black line) fitted to the normalized search times.
2.3 Dynamic localization degradation (DLD) score
In order to classify the degree of degradation caused by a HWD, we introduce the dynamic localization degradation (DLD) score. The DLD score is based on the search time obtained in the behavioural experiment for each subject s and headphones h. The DLD score is an output of a classification and thus more generic and easier to interpret than the absolute search time that largely depends on specific choices in task design (Liu and Wickens, 1992).
In order to calculate the DLD score, the normalized and cleaned search times were the input to a classifier. The classifier is based on the Gaussian mixture model (GMM), which was selected because of its simplicity and efficiency (Peel and MacLahlan, 2000; McLachlan et al., 2019). To fit the GMM, we used the function fitgmdist from MATLAB version 2022a (Mathworks Inc.). The number of Gaussian components K was selected to minimize the Akaike information criterion (AIC Akaike, 1974). Before training the classifier, we excluded extremely long search times (less than 4%) by removing trials showing normalized time larger than three scaled median absolute deviations from the median (rmoutliers using the median method in MATLAB version 2022a, Mathworks Inc.). The right panel of Figure 2 shows the histogram of the normalized search times with the fitted Gaussians. The minimum AIC was reached with K = 6 Gaussians.
Then, we sorted the fitted Gaussians by their mean μk with the idea of the sorting order reflecting the DLD score. For each subject s and condition h, the median normalized time
where μk and σk are the mean and standard deviation, respectively, of the kth Gaussian. Table 2 shows the averages μk and standard deviations σk of the individual Gaussians after the sorting.
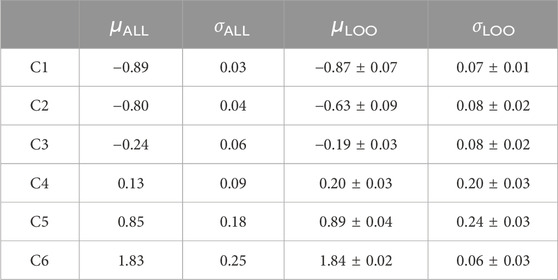
Table 2. Analysis of the Gaussian components for computing the DLD score using all the behavioral data and in leave-one-out (LOO) cross-validation for prediction (see Section 3.3). The LOO reported values are the average ± the standard deviation obtained across conditions.
The color in Figure 2 (left panel) shows the computed values for the DLD scale for each headphone, both at the individual level (circles) and group level (boxplots). The algorithm assigned the ‘OE’ condition to the first cluster. Headphones ‘A’ were assigned to the second cluster. The headphones ‘F’, ‘B’, ‘C’, ‘D’, ‘E’, and ‘J’ were assigned to the third cluster. The headphones ‘G’, ‘I’, ‘H’, ‘L’, and ‘K’ were assigned to the fourth cluster. The fifth cluster accounted for the DLD of some listeners, but after computing the median over the group, these DLD were assigned to the fourth cluster. The sixth cluster was not assigned at all because it contained individual trials with especially large search times only.
3 Degree of degradation: Predictions
We predicted the degree of degradation in three steps. First, we predicted the search time by means of an auditory model. This model requires acoustic data about the headphones in the form of HRTFs. Second, we mapped the predicted search time to the normalized search times. Third, the DLD score was computed by means of the classification described in Sec. 2.3.
3.1 HRTFs dataset
For the thirteen conditions included in the experimental task, HRTFs of a head-and-torso simulator (KEMAR 45BC, G.R.A.S. Inc.) wearing the studied headphones were measured. These HRTFs were measured in the same room, with the same equipment and in the same conditions as in the experimental task. The HRTF dataset is available online (see Data Availability Statement).
3.2 Auditory model
The model simulates the active search task on a trial basis, assuming that listeners accumulate spatial information over subsequent sounds. Therefore, the auditory model implements an online estimation of the source direction as an iterative mechanism as shown in Figure 3. The model treats each noise burst as a stationary observation and extracts the directional information following the Bayesian model proposed in Barumerli et al. (2023). The model combines the information from subsequent observations utilizing Bayesian belief updating (Ma et al., 2023). Importantly, the model only incorporates visual evidence in the form of a visual check, performed after the acoustic cues are processed. This is motivated by the experimental results obtained by Simpson et al. (2005), which show that the task performance in open ears conditions does not vary significantly when increasing the number of distractors (locations with an odd number of illuminated LEDs and without a corresponding sound stimulus) from five to fifty. These results suggest that the acoustic cues are dominant over the visual ones for this specific task.
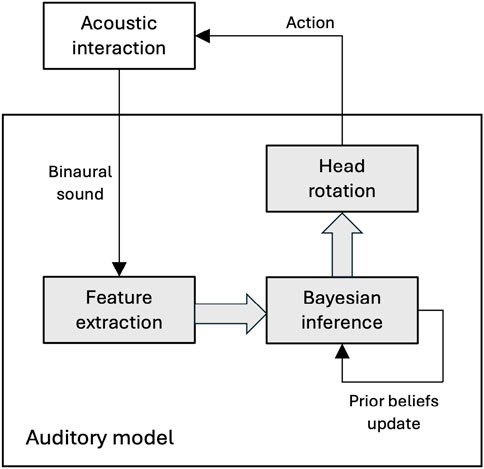
Figure 3. Schematic representation of the dynamic auditory model employed to simulate user behavior in the active search task. The model takes as an input a binaural sound that simulates the sound spatialization as in the real experiment. Then, the model extracts from the auditory signal a set of spatial features, and it updates the internal belief with such new sensory evidence by relying on the Bayesian inference. From the internal beliefs, the model infers the sound direction and simulates a head rotation by aligning the head direction to the new estimate. After this action, the simulation moves forward by generating a new binaural sound if the head is not pointing to the actual sound source direction.
The model starts by extracting a set of noisy spatial features xt from the binaural stimulus generated by a virtual sound source. The binaural stimulus was generated by filtering a 250 ms noise burst with the HRTF of the location of the virtual source φ relative to the head direction φh. From the binaural stimulus, the model computes four spatial features: interaural time difference xitd, interaural level difference xild, and monaural spectral gradients for the left
Additionally, the noise covariance matrix Σ is diagonal and characterized as:
where
From the set of spatial features xt, the model uses Bayesian inference to estimate the probability of the sound direction φ in each iteration t. To this end, the model weights the likelihood function with the prior distribution to obtain the posterior distribution:
We simplified p (xt|φ, x1:t−1) to p (xt|φ) since xt is conditionally independent from x1:t−1 given φ.
The computation of the likelihood function follows the model for static sound localisation (Barumerli et al., 2023) which compares xt to the feature templates Xφ containing noiseless features of Eq. 3 for every sound direction φ. The template features were computed from the acoustically measured HRTFs and interpolated over a quasi-uniform spherical grid containing N = 1980 points generated with a quadrature of spherical t-designs (Hardin and Sloane, 1996; Gräf and Potts, 2011). Spatial interpolation was based on 15th-order spherical harmonics followed by Tikhonov regularization (Zotkin et al., 2009).
For the first noise burst in the sequence, the prior distribution is uniform p(φ) = N−1, i.e., we assume that the subject has no information about the actual sound location at the beginning of the trial. Then, the posterior distribution is calculated and its maximum used to determine the model’s current estimate of sound direction. Then, the model simulates the head rotation towards
where m ∼vMF(0, κm) accounts for the uncertainty in the sensorimotor process and is defined as the von Mises-Fisher distribution with zero mean and concentration parameter κm (Ley and Verdebout, 2017). Importantly, the concentration parameter κm can be transformed to a dispersion parameter with the formula
To update the spatial belief for the next time point t + 1, the posterior distribution p (φ|x1:t) is propagated as the new prior distribution, which is additionally rotated in an egocentric manner (Rodrigues, 1840) to account for the new head orientation. The model iterates over further time points until the angular distance between the new head orientation and the target source
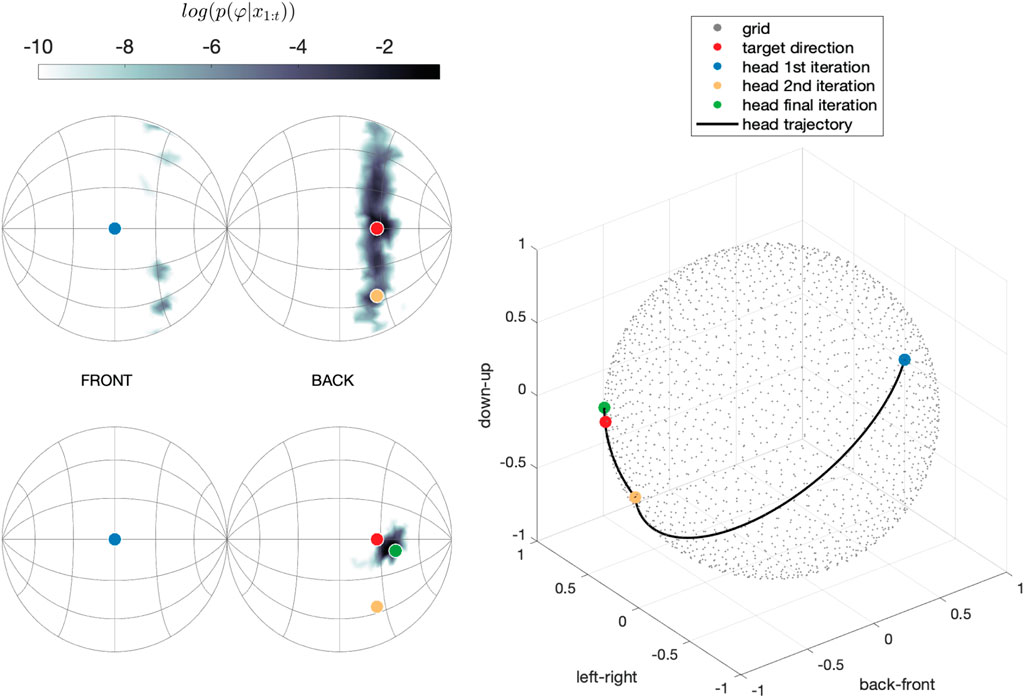
Figure 4. Posterior distributions and head orientations determined by the auditory model in an example trial. Left panels: posterior distributions p(Φx(1:t)) after the first (above) and second (below) noise bursts, shown on a logarithmic scale to increase the readability. Right panel: trajectory of head orientations performed iteratively to spot the target.
3.2.1 Model calibration and evaluation
In order to calibrate the model, we predicted the search time
For each headphones h, we computed
where β1 and β0 were fitted with the function fitlm (MATLAB version R2022a, Mathworks, Inc.).
Figure 5 shows the predicted normalized search times
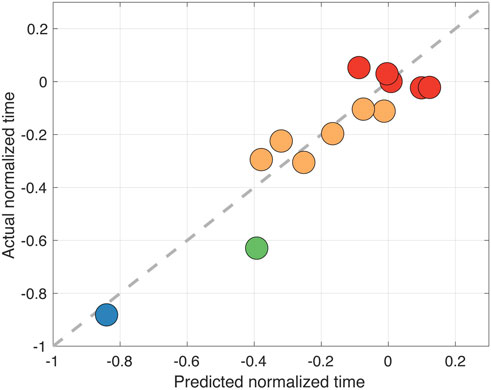
Figure 5. Predicted normalized search times (after mapping the auditory-model estimates with the linear model) versus the actual normalized times from behavioral data (R2 = 0.59). Each dot represents a test condition, where its color represents its actual DLD score. The gray dashed line represents perfect prediction of the normalized times.
3.3 Score predictions
We evaluated the ability and the robustness of our methodology to predict DLD score by combining the auditory model presented in the previous section and the classification method presented in Sec 2.3. Because of the limited amount of HWDs available to this study that might hinder the generalization over unseen devices, we performed a leave-one-out cross validation (Hastie et al., 2009, Chapter 7) where we compared the actual and predicted DLD scores.
We calculated the predictions for a specific pair of headphones h by excluding the corresponding behavioral data from the training procedure of the classifier. For each headphones h, the model estimates
Similarly, the cluster centers of the classifier were then recomputed from the behavioral data without data from headphones h. To avoid the number of clusters fluctuating depending on the excluded headphones, K was six as computed in Sec. 2.3. The most-right column of Table 2 shows the averages calculated from the parameters of the cluster centers. The stable values for the Gaussian parameters, μLOO,k and σLOO,k, showed that the GMM classifier did not vary significantly over LOO iterations.
Finally, we predicted the DLD score
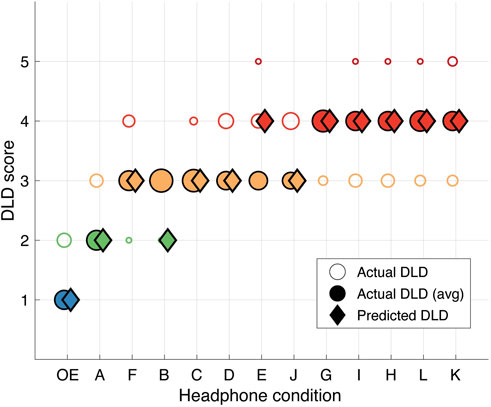
Figure 6. Model-based predicted DLD scores compared to the actual DLD scores for each condition. The circles represent actual DLD scores and their size show the subject-level count. The filled circles show the DLD score computed for the group-level median time for each condition. The diamonds represent the predicted DLD scores. These predictions were obtained from the cross validation, i.e., excluding the behavioral data from each condition for its evaluation.
4 Discussion
We proposed a method to automatically assess the increased search time to find a target observed when listeners wear an HWD. The assessment relies on predicting the dynamic localization degradation (DLD) score, a six-level scale based on subjects’ time to find a target in the auditory-guided visual search task. Furthermore, we proposed an auditory model to predict the DLD score of an HWD. We demonstrated the robustness of the DLD predictions by means of a cross-validation approach to account for unseen HWDs. Our method has the advantage of being more ecologically valid as compared to contrasting the effects of an HWD by means of localization performance obtained in static tasks (Simpson et al., 2005).
4.1 Actual and predicted degree of degradation
Our classification results indicate that our clustering procedure is sensitive to classifying headphones by means of normalized search times. We found that even a slight deviation from the ‘OE’ condition can increase search time. For example, ‘OE’ and the headphones ‘A’ having the least impact on the search times were clustered into C1 and C2, respectively. This was expected since wearing headphones ‘A’ resulted in significantly larger localization errors, even though its design (i.e., open headphones) should provide a high level of transparency (Lladó et al., 2022b). Moreover, we obtained a larger separation between the cluster centers for the transition in the search times from cluster C2 to C3 and then from C3 to C4. This clear separation can be related to the differences in the mechanical designs of the corresponding headphones, which introduce different degradations of the acoustic features. The set of devices in cluster C3 were earbuds, open-back headphones and in-ear headphones with active hear-through. These slightly modify the pinnae cues, showing a large impact compared to an open headphones design (i.e., as in cluster C2) but a smaller difference in search times compared to cluster C4 – hear-through headphones and hearing protection devices that completely cover the pinnae. Headphones ‘J’ seems to be an exception because it was a hear-through circumaural headphones clustered into C3. Interestingly, the GMM yielded two additional clusters, C5 and C6, which did not find a correspondence to a specific headphones design. These clusters account for the very long search times observed in some trials, where the source was particularly difficult to find, i.e., localization of elevated or rear sources. This extreme degree of degradation was only perceived by a subset of subjects (see Figure 6), and the results from the cross-validation suggest considering C5 and C6 an idiosyncrasy in the collected behavioral data.
Our leave-one-out cross-validation showed that the prediction of the DLD score by means of the simulations done with the auditory model were correctly classified in eleven out of thirteen conditions. This high rate of correct classification results from the stability of the cluster parameters across validation conditions (see Table 2) and indicates that the estimated clusters were stable even when headphones were removed from our dataset. However, we did find a misclassification of the headphones ‘B’ and ‘E’, both members of the C3 cluster. Headphones ‘B’ showed a large variance across listeners in the behavioral task (see Figure 2) and adopting the manikin’s HRTF may not represent our pool of listeners for this headphone. Similarly, the misclassification for headphones ‘E’ may result in the incapability of the classifier to discriminate between the third and fourth clusters which both already indicate a high degree of degradation. Although our classification method is limited in such borderline cases, its high classification rate suggests high stability when classifying novel unseen headphones.
4.2 Limitations and future directions
The proposed model considers several aspects in modelling the behavioral mechanism, such as a slow temporal integration of spatial cues (Hofman and Van Opstal, 1998; Kayser et al., 2015). However, the model does not consider listeners’ anatomical constraints in head rotations yet (Gilman et al., 1979). For the present task, the high correlation between behavioral and predicted degradation scores suggests this simplification to be appropriate. Different experimental tasks may require further consideration of anatomical constraints.
Our methods can be adapted or expanded to other scenarios and experimental tasks to provide deeper insights into the degradation level for AR applications. It can be used to model more detailed search strategies or to consider alternative behavioral paradigms, such as navigation. Depending on the scope, it might be required to extend the auditory model. In the first step, the model could be extended to account for natural head rotations. Interestingly, most of the available models of head rotation do not consider auditory targets (Thurlow et al., 1967; Glenn and Vilis, 1992; Ceylan et al., 2000; Kunin et al., 2007). However, recent literature showed how head rotations might influence the dynamic computation of the acoustic cues (Macpherson, 2013; McLachlan et al., 2023). This integration would help the virtual agent to exploit the localization cues similarly as humans do (McLachlan et al., 2021). Furthermore, such an extended model may also help in providing more insights into the interplay between the sensory accumulation and decision-making process on a finer time scale (Kayser et al., 2015). These extensions could allow quantifying the degree of degradation on a trial-by-trial basis instead of relying on averaged search times. With the availability of such more complex auditory models, it would be possible to gain deeper insights into the interaction between the environment and listeners, and it would provide a quantitative approach for better headphones designs.
From an application point of view, our methodology is ready to be integrated into the development pipeline of headphones for AR, or HWDs in general. Our methodology can be applied to pre-select prototypes likely to be successful when tested in behavioral experiments. This could be beneficial to evaluate the quality of experience in an early stage of development (Nagele et al., 2021; Schneiderwind et al., 2021). Alternatively, our method could be adapted to consider the effects of acoustic individualization (Daugintis et al., 2023) of wearable devices when individually measured HRTFs are available. Thus, listener-specific HRTFs and localization data could be included to fine-tune the model to predict listener’s individual degradation caused by a specific headphone. This would further personalize the rendering scheme of a specific pair of headphones or even identify specific requirements for individual listeners.
5 Conclusion
We proposed a method to automatically predict the headphone-induced increase in search time in an auditory-guided visual search task, which presents a higher ecological validity than static sound-source localization tests. The proposed dynamic localization degradation (DLD) score was designed to cluster the search times for a pair of headphones automatically. The method is based on an auditory model simulating the behavioral task and predicting the DLD score. Our predictions were tested in a cross-validation with the actual DLD scores from the behavioral experiments.
The cross-validation method showed a high rate of correct classifications for unseen headphones indicating a high robustness of our method even with unseen headphones. The obtained clusters depended on the openness of the headphones design, suggesting that designs that maintain the listener’s pinnae cues are more suitable for AR scenarios in which space perception is an important aspect of the application. Our method is ready to be extended for listener-specific assessments, e.g., when accounting for individually measured HRTFs.
Data availability statement
Publicly available datasets were analyzed in this study. The model and the data to reproduce this study were integrated in the Auditory Modeling Toolbox [AMT, (Majdak et al., 2022)] available at https://amtoolbox.org. The current implementation of the model can be found in the source code branch “llado2024” https://sourceforge.net/p/amtoolbox/code/ci/llado2024/tree. Our model implementation will be fully integrated and released in the upcoming version of the AMT.
Ethics statement
The studies involving humans were approved by Aalto University Ethical Committee. The studies were conducted in accordance with the local legislation and institutional requirements. Written informed consent for participation was not required from the participants or the participants’ legal guardians/next of kin in accordance with the national legislation and institutional requirements.
Author contributions
PL: Conceptualization, Data curation, Investigation, Methodology, Software, Writing–original draft, Writing–review and editing. RB: Conceptualization, Data curation, Investigation, Methodology, Software, Writing–original draft, Writing–review and editing. RB: Conceptualization, Funding acquisition, Investigation, Methodology, Resources, Supervision, Writing–original draft, Writing–review and editing. PM: Conceptualization, Funding acquisition, Investigation, Methodology, Resources, Supervision, Writing–original draft, Writing–review and editing.
Funding
The author(s) declare that financial support was received for the research, authorship, and/or publication of this article. This study received funding from the European Union’s Horizon 2020 research and innovation funding programme (grant no. 101017743, project “SONICOM”–Transforming auditory-based social interaction and communication in AR/VR) and from the Austrian Science Fund (FWF, grant no. ZK66, project “Dynamates”–Dynamic auditory predictions in human and non-human primates).
Conflict of interest
The authors declare that the research was conducted in the absence of any commercial or financial relationships that could be construed as a potential conflict of interest.
Publisher’s note
All claims expressed in this article are solely those of the authors and do not necessarily represent those of their affiliated organizations, or those of the publisher, the editors and the reviewers. Any product that may be evaluated in this article, or claim that may be made by its manufacturer, is not guaranteed or endorsed by the publisher.
References
Ahrens, A., Lund, K. D., Marschall, M., and Dau, T. (2019). Sound source localization with varying amount of visual information in virtual reality. PloS one 14, e0214603. doi:10.1371/journal.pone.0214603
Akaike, H. (1974). A new look at the statistical model identification. IEEE Trans. automatic control 19, 716–723. doi:10.1109/tac.1974.1100705
Barumerli, R., Majdak, P., Geronazzo, M., Meijer, D., Avanzini, F., and Baumgartner, R. (2023). A bayesian model for human directional localization of broadband static sound sources. Acta Acust. 7, 12. doi:10.1051/aacus/2023006
Baumgartner, R., Majdak, P., and Laback, B. (2014). Modeling sound-source localization in sagittal planes for human listeners. J. Acoust. Soc. Am. 136, 791–802. doi:10.1121/1.4887447
Bolia, R. S., D’Angelo, W. R., and McKinley, R. L. (1999). Aurally aided visual search in three-dimensional space. Hum. factors 41, 664–669. doi:10.1518/001872099779656789
Bolia, R. S., D’Angelo, W. R., Mishler, P. J., and Morris, L. J. (2001). Effects of hearing protectors on auditory localization in azimuth and elevation. Hum. Factors 43, 122–128. doi:10.1518/001872001775992499
Brown, A. D., Beemer, B. T., Greene, N. T., Argo IV, T., Meegan, G. D., and Tollin, D. J. (2015). Effects of active and passive hearing protection devices on sound source localization, speech recognition, and tone detection. PLoS One 10, e0136568. doi:10.1371/journal.pone.0136568
Brungart, D. S., Hobbs, B. W., and Hamil, J. T. (2007). “A comparsion of acoustic and psychoacoustic measurements of pass-through hearing protection devices,” in 2007 IEEE Workshop on Applications of Signal Processing to Audio and Acoustics (IEEE), 70–73.
Brungart, D. S., Kordik, A. J., and Simpson, B. D. (2004). The effects of single and double hearing protection on the localization and segregation of spatially-separated speech signals (l). J. Acoust. Soc. Am. 116, 1897–1900. doi:10.1121/1.1786812
Ceylan, M., Henriques, D., Tweed, D., and Crawford, J. (2000). Task-dependent constraints in motor control: pinhole goggles make the head move like an eye. J. Neurosci. 20, 2719–2730. doi:10.1523/jneurosci.20-07-02719.2000
Daugintis, R., Barumerli, R., Picinali, L., and Geronazzo, M. (2023). “Classifying non-individual head-related transfer functions with a computational auditory model: calibration and metrics,” in ICASSP 2023-2023 IEEE International Conference on Acoustics, Speech and Signal Processing (ICASSP) (IEEE), 1–5.
Denk, F., Ewert, S. D., and Kollmeier, B. (2018). Spectral directional cues captured by hearing device microphones in individual human ears. J. Acoust. Soc. Am. 144, 2072–2087. doi:10.1121/1.5056173
Denk, F., Ewert, S. D., and Kollmeier, B. (2019). On the limitations of sound localization with hearing devices. J. Acoust. Soc. Am. 146, 1732–1744. doi:10.1121/1.5126521
Denk, F., Schepker, H., Doclo, S., and Kollmeier, B. (2020). Acoustic transparency in hearables - technical evaluation. J. Audio Eng. Soc. 68, 508–521. doi:10.17743/jaes.2020.0042
Engel, I., and Picinali, L. (2017). “Long-term user adaptation to an audio augmented reality system,” in 24th International Congress on Sound and Vibration (London: ICSV).
Genovese, A., Zalles, G., Reardon, G., and Roginska, A. (2018). “Acoustic perturbations in hrtfs measured on mixed reality headsets,” in Proceedings of the AES International Conference on Audio for Virtual and Augmented Reality (Redmond, Washington, USA: Audio Engineering Society).
Gilman, S., Dirks, D. D., and Hunt, S. (1979). Measurement of head movement during auditory localization. Behav. Res. Methods & Instrum. 11, 37–41. doi:10.3758/bf03205429
Glenn, B., and Vilis, T. (1992). Violations of listing’s law after large eye and head gaze shifts. J. Neurophysiology 68, 309–318. doi:10.1152/jn.1992.68.1.309
Gräf, M., and Potts, D. (2011). On the computation of spherical designs by a new optimization approach based on fast spherical fourier transforms. Numer. Math. 119, 699–724. doi:10.1007/s00211-011-0399-7
Gupta, R., Ranjan, R., He, J., and Woon-Seng, G. (2018). “Investigation of effect of vr/ar headgear on head related transfer functions for natural listening,” in Proceedings of the AES International Conference on Audio for Virtual and Augmented Reality (Redmon, Washington, USA: Audio Engineering Society).
Hardin, R. H., and Sloane, N. J. (1996). Mclaren’s improved snub cube and other new spherical designs in three dimensions. Discrete Comput. Geometry 15, 429–441. doi:10.1007/bf02711518
Hastie, T., Tibshirani, R., Friedman, J. H., and Friedman, J. H. (2009) The elements of statistical learning: data mining, inference, and prediction, 2. Springer.
Hofman, P. M., and Van Opstal, A. J. (1998). Spectro-temporal factors in two-dimensional human sound localization. J. Acoust. Soc. Am. 103, 2634–2648. doi:10.1121/1.422784
Kayser, H., Hohmann, V., Ewert, S. D., Kollmeier, B., and Anemüller, J. (2015). Robust auditory localization using probabilistic inference and coherence-based weighting of interaural cues. J. Acoust. Soc. Am. 138, 2635–2648. doi:10.1121/1.4932588
Kunin, M., Osaki, Y., Cohen, B., and Raphan, T. (2007). Rotation axes of the head during positioning, head shaking, and locomotion. J. neurophysiology 98, 3095–3108. doi:10.1152/jn.00764.2007
Ley, C., and Verdebout, T. (2017) Modern directional statistics. CRC Press. doi:10.1201/9781315119472
Liu, Y., and Wickens, C. D. (1992). Use of computer graphics and cluster analysis in aiding relational judgment. Hum. Factors 34, 165–178. doi:10.1177/001872089203400203
Lladó, P., Hyvärinen, P., and Pulkki, V. (2022a). Auditory model-based estimation of the effect of head-worn devices on frontal horizontal localisation. Acta Acust. 6, 1. doi:10.1051/aacus/2021056
Lladó, P., Hyvärinen, P., and Pulkki, V. (2024). The impact of head-worn devices in an auditory-aided visual search task. J. Acoust. Soc. Am. 155, 2460–2469. doi:10.1121/10.0025542
Lladó, P., McKenzie, T., Meyer-Kahlen, N., and Schlecht, S. J. (2022b). Predicting perceptual transparency of head-worn devices. J. Audio Eng. Soc. 70, 585–600. doi:10.17743/jaes.2022.0024
Ma, W. J., Kording, K. P., and Goldreich, D. (2023) Bayesian models of perception and action: an introduction. MIT press.
Macpherson, E. A. (2013). “Cue weighting and vestibular mediation of temporal dynamics in sound localization via head rotation,” in Proceedings of Meetings on Acoustics ICA2013 (Montreal, Canada: Acoustical Society of America), 19, 050131. doi:10.1121/1.4799913
Majdak, P., Hollomey, C., and Baumgartner, R. (2022). Amt 1. X: A toolbox for reproducible research in auditory modeling. Acta Acust. 6, 19. doi:10.1051/aacus/2022011
McLachlan, G., Majdak, P., Reijniers, J., Mihocic, M., and Peremans, H. (2023). Dynamic spectral cues do not affect human sound localization during small head movements. Front. Neurosci. 17, 1027827. doi:10.3389/fnins.2023.1027827
McLachlan, G., Majdak, P., Reijniers, J., and Peremans, H. (2021). Towards modelling active sound localisation based on bayesian inference in a static environment. Acta Acust. 5, 45. doi:10.1051/aacus/2021039
McLachlan, G. J., Lee, S. X., and Rathnayake, S. I. (2019). Finite mixture models. Annu. Rev. statistics its Appl. 6, 355–378. doi:10.1146/annurev-statistics-031017-100325
Meyer-Kahlen, N., Rudrich, D., Brandner, M., Wirler, S., Windtner, S., and Frank, M. (2020). “Diy modifications for acoustically transparent headphones,” in 148th Convention of the Audio Engineering Society (Vienna, Austria: Audio Engineering Society). E-Brief 603.
Middlebrooks, J. C. (2015). Sound localization. Handb. Clin. neurology 129, 99–116. doi:10.1016/b978-0-444-62630-1.00006-8
Nagele, A. N., Bauer, V., Healey, P. G., Reiss, J. D., Cooke, H., Cowlishaw, T., et al. (2021). Interactive audio augmented reality in participatory performance. Front. Virtual Real. 1, 610320. doi:10.3389/frvir.2020.610320
Neidhardt, A., and Zerlik, A. M. (2021). The availability of a hidden real reference affects the plausibility of position-dynamic auditory AR. Front. Virtual Real. 2, 678875. doi:10.3389/frvir.2021.678875
Perrott, D. R., Cisneros, J., Mckinley, R. L., and D’Angelo, W. R. (1996). Aurally aided visual search under virtual and free-field listening conditions. Hum. factors 38, 702–715. doi:10.1518/001872096778827260
Poirier-Quinot, D., and Lawless, M. S. (2023). Impact of wearing a head-mounted display on localization accuracy of real sound sources. Acta Acust. 7 (3), 3. doi:10.1051/aacus/2022055
Porschmann, C., Arend, J. M., and Gillioz, R. (2019). “How wearing headgear affects measured head-related transfer functions,” in Proceedings of the EAA Spatial Audio Signal Processing Symposium (Paris, France: Artwork Size), 1–6. 6 pages. doi:10.25836/SASP.2019.27
Rodrigues, O. (1840). Des lois géométriques qui régissent les déplacements d’un système solide dans l’espace, et de la variation des coordonnées provenant de ces déplacements considérés indépendamment des causes qui peuvent les produire. J. de mathématiques pures appliquées 5, 380–440.
Schneiderwind, C., Neidhardt, A., and Meyer, D. (2020). Comparing the effect of different open headphone models on the perception of a real sound source. In Audio Engineering Society Conference: 2020 AES International Conference on Audio for Virtual and Augmented Reality (Redmond, Washington, USA: Audio Engineering Society).
Simpson, B. D., Bolia, R. S., McKinley, R. L., and Brungart, D. S. (2005). The impact of hearing protection on sound localization and orienting behavior. Hum. Factors 47, 188–198. doi:10.1518/0018720053653866
Thurlow, W. R., Mangels, J. W., and Runge, P. S. (1967). Head movements during sound localization. J. Acoust. Soc. Am. 42, 489–493. doi:10.1121/1.1910605
Van den Bogaert, T., Doclo, S., Wouters, J., and Moonen, M. (2008). The effect of multimicrophone noise reduction systems on sound source localization by users of binaural hearing aids. J. Acoust. Soc. Am. 124, 484–497. doi:10.1121/1.2931962
Van den Bogaert, T., Klasen, T. J., Moonen, M., Van Deun, L., and Wouters, J. (2006). Horizontal localization with bilateral hearing aids: without is better than with. J. Acoust. Soc. Am. 119, 515–526. doi:10.1121/1.2139653
Vause, N. L., and Grantham, D. W. (1999). Effects of earplugs and protective headgear on auditory localization ability in the horizontal plane. Hum. Factors 41, 282–294. doi:10.1518/001872099779591213
Wolfe, J. M. (1994). Guided search 2.0 a revised model of visual search. Psychonomic Bull. Rev. 1, 202–238. doi:10.3758/bf03200774
Wolfe, J. M., and Horowitz, T. S. (2017). Five factors that guide attention in visual search. Nat. Hum. Behav. 1, 0058. doi:10.1038/s41562-017-0058
Zimpfer, V., and Sarafian, D. (2014). Impact of hearing protection devices on sound localization performance. Front. Neurosci. 8, 135. doi:10.3389/fnins.2014.00135
Keywords: augmented reality, sound localization, head-worn device, auditory model, dynamic listening
Citation: Lladó P, Barumerli R, Baumgartner R and Majdak P (2024) Predicting the effect of headphones on the time to localize a target in an auditory-guided visual search task. Front. Virtual Real. 5:1359987. doi: 10.3389/frvir.2024.1359987
Received: 22 December 2023; Accepted: 29 April 2024;
Published: 07 June 2024.
Edited by:
Akrivi Katifori, Athena Research Center, GreeceReviewed by:
Rohith Venkatakrishnan, University of Florida, United StatesRudi Haryadi, Sultan Ageng Tirtayasa University, Indonesia
Copyright © 2024 Lladó, Barumerli, Baumgartner and Majdak. This is an open-access article distributed under the terms of the Creative Commons Attribution License (CC BY). The use, distribution or reproduction in other forums is permitted, provided the original author(s) and the copyright owner(s) are credited and that the original publication in this journal is cited, in accordance with accepted academic practice. No use, distribution or reproduction is permitted which does not comply with these terms.
*Correspondence: Pedro Lladó, cGVkcm8ubGxhZG9AYWFsdG8uZmk=
†Present address: Roberto Barumerli, Department of Neurological Biomedical and Movement Sciences, University of Verona, Verona, Italy