 Ashkan F. Hayati
 Amit Barde
 Ihshan Gumilar
 Abdul Momin
 Gun Lee
 Alex Chatburn
 Mark Billinghurst
- 1The Empathic Computing Laboratory, Science, Technology Engineering, and Mathematics, The University of South Australia, Adelaide, SA, Australia
- 2The Empathic Computing Laboratory, Auckland Bioengineering Institute, The University of Auckland, Auckland, New Zealand
- 3Department of IT Indian Institute of Information Technology, Allahabad, India
- 4Cognitive Neuroscience Laboratory, The University of South Australia, Adelaide, SA, Australia
This study investigates inter-brain synchronization during a collaborative visual search task performed in Virtual Reality (VR), and compares it to the same task executed in a real-world environment. Previous research has demonstrated that collaborative visual search in real-world settings leads to measurable neural synchrony, as captured through EEG hyperscanning. However, limited work has explored whether similar neural dynamics occur in immersive VR. In this study, we recorded EEG hyperscanning data from participant pairs engaged in a joint visual search task, conducted in both VR and physical settings. Our results reveal that inter-brain synchronization occurred in the VR condition at levels comparable to the real world. Furthermore, greater neural synchrony was positively correlated with better task performance across both conditions. These findings demonstrate that VR is a viable platform for studying inter-brain dynamics in collaborative tasks, and support its use for future team-based neuroscience research in simulated environments.
1 Introduction
This paper explores brain synchronization between people in Virtual Reality (VR) and compares it to brain synchronization in the real world. Recent neuroscience research has shown that brain activity can synchronize between people engaged in a cooperative task (Williams Woolley et al., 2007; Mu et al., 2018; Toppi et al., 2016). The synchronization level can be a measure of efficiency in collaboration, that may enhance the utility of standard outcome measures such as response time, accuracy and engagement. Brain synchronization may provide feedback for facilitating collaboration, enhancing learning and improving team performance (Szymanski et al., 2017). This is because successful teams have a “shared attention” resulting from more functional connectivity between the neuroelectric activities of the team members (Astolfi et al., 2011).
Brain synchronization has been extensively studied in wide range of tasks involving social interactions, particularly in cooperative and competitive scenarios (Park et al., 2022; Mendoza-Armenta et al., 2024; ?). However, there has been very little study of brain synchronization in VR. Previous research suggests that we tend to behave similarly in both the real-world and VR (Bailenson et al., 2003; Gillath et al., 2008). So a key question is: “does brain synchronization occur in VR in a similar manner to in the real world”? This is important because there may be perceptual and cognitive differences between reality and VR that may make it more difficult to observe brain synchronization.
Relatively little research has been conducted on brain synchronization in VR, but preliminary results are promising as they show collaborative tasks in VR can significantly impact inter-brain synchrony. Gumilar et al. (2022) found that that gaze direction plays a crucial role in inter-brain synchrony during collaboration in VR (see Figure 1). Furthermore, collaborative design behavior in VR based on inter-brain synchrony has been explored, highlighting the differences in collaborative design behavior between VR and the real world, and providing objective evidence for studying human neural activity in natural environments (Ogawa and Shimada, 2023). For example, Gumilar et al. (2021b) reports on a hyperscanning study in VR that replicates a previous study on hyperscanning in a real world finger tracking task (Yun et al., 2012), finding that brain synchronization also occurs in VR. Similarly, emerging work in the field of hyperscanning and VR by other researchers (Barde et al., 2019; Hajika et al., 2019) demonstrates that hyperscanning can be used across a range of applications to improve collaborative experiences in VR. Overall, VR has shown a similar impact on inter-brain synchrony in comparison to the real world environment during collaborative tasks, offering promising avenues for future research and improvements in collaborative VR experiences.
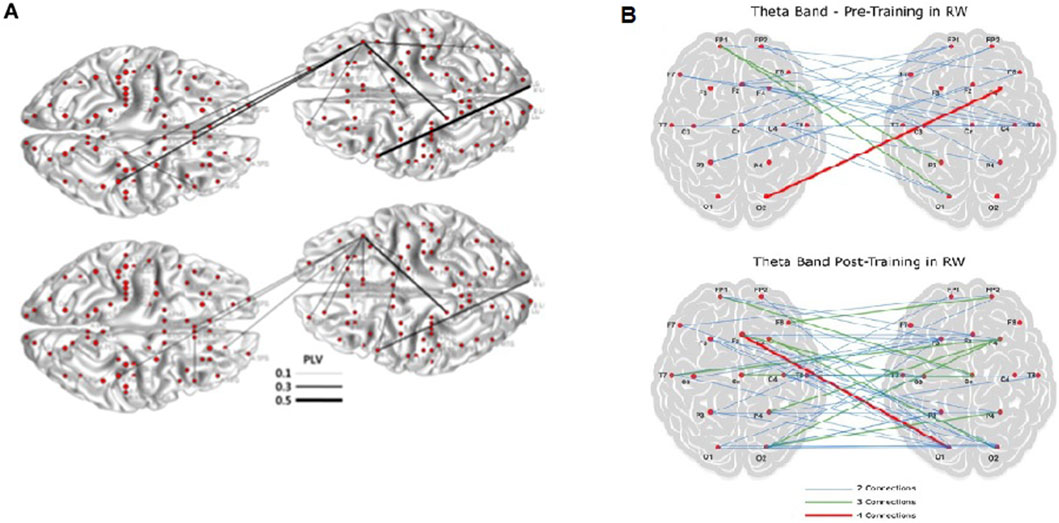
Figure 1. Analysis used in hyperscanning to investigate between brain relationships. (A) From Yun et al. (2012) The phase locking value (PLV) topography between various regions of interest for two participants is depicted for theta (4–7.5 Hz) and beta (12–30 Hz) oscillations. (B) From (Gumilar et al., 2022) Significant number of inter-brain connections appeared to be in the same frequencies for theta (4–7.5 Hz) band.
These studies have focused on joint action tasks in VR, such as finger tracking (Gumilar et al., 2021b) and elevating collaborative artistic experiences (Hajika et al., 2019), but not many study have been conducted on joint attention tasks. Joint attention refers to the coordinated focus of two or more individuals on a common target simultaneously. This concept plays a crucial role in social interactions, aiding in understanding others’ intentions and goals (Battich et al., 2021). Research suggests that joint attention can enhance visual information encoding and processing, potentially impacting multisensory integration tasks (Lee et al., 2021). Previous research has showed that brain synchronization occurs in real world joint attention tasks, such as a visual search activity (Szymanski et al., 2017). In this paper we report on brain synchronization in a VR joint attention task and compare it to brain synchronization in the same task conducted in the real world.
The main contributions of this paper are:
1. Presenting the first known example of a brain synchronization study completed in VR for a joint attention task.
2. Providing a comparative study comparing brain synchronization in both VR and the real world for the same joint attention task.
3. Demonstrating empirical evidence of correlation between task performance and inter-brain synchrony.
In the remainder of the paper we first provide an outline of related work and how it informs our study. Then we describe the methods used to conduct the study. This is followed by reviewing the data analysis techniques used for the study and the results obtained following data processing. Next, we present a discussion section where we put the results we have obtained into context and discuss on the limitations. Finally, we conclude with the ways in which this research can be further extended.
2 Background
Our research is based on earlier studies in hyperscanning, visual search tasks, and inter-brain synchrony across virtual reality (VR) and real-world settings. In this section, we review pivotal related work in each domain, elucidating how our investigation extends beyond these foundations to explore neural alignment in immersive VR environments.
2.1 Inter-brain synchrony in VR and real-world
Inter-brain synchrony (IBS) refers to the way brain activity syncs up between people during social interactions, helping them understand and feel for each other. Mental effort, social signals, and virtual characters can have a big impact on how well this brain connection works.
High cognitive load can weaken the ability to process social cues by reducing inter-brain synchrony. For instance, research has shown that conflicting social signals can elicit neural correlates of cognitive conflict, as measured by alpha and mid-brain theta oscillations, highlighting the impact of cognitive load on neural alignment during interactions (Abubshait et al., 2022; Gumilar et al., 2021c). Also, inter-brain synchrony aligns neural activity during social interactions, enhancing understanding and empathy, with eye gaze increasing gamma-band IBS in real-world (RW) settings and alpha-band IBS in virtual reality (VR), although VR’s effectiveness lags due to technological limits like delayed feedback (Luft et al., 2022; Gumilar et al., 2022).
Recent studies on team training and performance, including research using dual-EEG recordings, suggest that theta and alpha brainwaves play a key role in how we think during tasks (Cross et al., 2022). Theta waves, often tied to working memory and staying focused, seem to predict how well people do in group activities (Alekseichuk et al., 2016). In real-life situations, stronger inter-brain synchrony is related to improved teamwork, such as making decisions together or coordinating smoothly (Reinero et al., 2021; Mu et al., 2018). However, in VR, things become more complicated. The difficulty of the task and how real the VR world feels can affect these brainwaves. For example, while engaging VR setups can keep theta-driven focus sharp, issues such as clunky embodiment, slow feedback, or awkward eye-contact simulations might throw off the natural rhythm of alpha and theta waves between teammates (Pan et al., 2024).
In addition, research revealed that resting-state EEG markers–those brain signals captured when someone is at rest–can predict how well individuals will perform and even tell team members apart in a two-person group. Moreover, during simpler tasks, theta and alpha brainwaves proved to be solid clues about how someone would handle tougher training scenarios later on. These results highlight just how crucial brain oscillations are for teamwork, both in thinking and moving together, supporting what earlier studies have found about brain activity during cooperative efforts (Cross et al., 2022; Schwartz et al., 2022).
2.1.1 Insights from VR-Mediated neural coupling
Inter-brain synchrony reflects the degree to which neural oscillations align between individuals during social exchanges. The differences in synchrony observed between virtual reality and real-world contexts may stem from the distinct neurophysiological mechanisms underlying these interactions. In everyday social interactions, the combination of sensory information and environmental social cues helps forming a clear perception, enhancing attention, and strengthening brain-to-brain connections (Seijdel et al., 2024; Cuomo, 2025). Virtual reality environments, however, can either support or hinder inter-brain synchrony depending on factors like immersion level, perceptual consistency, and attention demands. High-immersion VR setups can improve synchrony by increasing shared attention and sensorimotor feedback (Tarr et al., 2018). However, low-quality VR systems or poor visual-auditory alignment may cause attentional distractions, reducing neural coordination. This highlights the complex role of technology in influencing inter-brain dynamics.
Also, visual immersion and embodiment within virtual environments significantly enhance inter-brain synchrony by aligning participants’ sensory experiences and reinforcing neural coupling (Hu et al., 2017). Studies indicate that immersive settings with shared visual perspectives elicit synchronized neural activity, strengthening interpersonal connections during collaborative tasks (Gumilar et al., 2022). Furthermore, embodiment, defined as the perception of inhabiting a virtual body, modulates neural responses, influencing both perceptual and motor processes during interactions (Khalil et al., 2022). Perceptual coherence, facilitated by synchronized sensory inputs, promotes unified experiences, enhancing the smoothness of interactions and the robustness of neural alignment (Pérez et al., 2017). These findings highlight the necessity of integrating these factors to design virtual environments that effectively support collaborative neural dynamics.
2.2 Hyperscanning
Hyperscanning is the simultaneous acquisition or recording of neural activity from two or more individuals who are interacting during a particular motor or cognitive task (Babiloni and Astolfi, 2014). This can be done using several recording techniques. For example, functional near-infrared spectroscopy (fNIRS) hyperscanning uses InfraRed (IR) light shone into the head as a method to measure inter-personal interactions in a natural context (Scholkmann et al., 2013). Functional Magnetic Resonance Imaging (fMRI) images deeper into the brain, and is a technique which was used for hyperscanning for the first time in 2002 (Montague et al., 2002). However, the most common method is to use multiple electroencephalographic (EEG) recordings for simultaneous measurement of brains during a cooperative task (Babiloni et al., 2006).
The primary purpose of using hyperscanning is to look for synchronization of brain activity, which tends to occur when two or more people collaborate to achieve a common goal. For instance, by using hyperscanning in a training scenario, it is possible to accurately assess neural connectivity between brains in real-time which can enable the trainer to make dynamic and more accurate decisions about the approach to be taken during the training process (Barde et al., 2020a). Accurate real-time analysis is one of the overarching goals of the research that is being pursued in the use of hyperscanning and VR. However, advances in this field have only been possible in recent years.
The number of hyperscanning studies have increased owing to the growing availability of low cost, high quality EEG hardware and software tools. In recent years, EEG hardware has evolved from being an unwieldy and wired piece of equipment to a wireless and easy-to-use tool. Modern day EEG headsets enable researchers to run studies in more real-world environments (i.e., outside the lab) and even allow for ambulatory studies to be carried out (Liebherr et al., 2021).
A common thread that links a majority of the hyperscanning studies is that they were mostly carried out in a traditional lab setting (Saito et al., 2010; Yun et al., 2012) or were set-up to mimic a real-world scenario (Babiloni et al., 2006; Toppi et al., 2016). Some studies attempted to investigate the effect of face-to-face interactions between participants using a variety of different tasks, including finger pointing/tracking exercises (Yun et al., 2012), music performance (Acquadro et al., 2016) and economic exchange (?). The finger tracking task is especially popular among researchers because gesture is thought to represent the most basic form of social interaction, besides eye gaze (Yun et al., 2012). Finger tracking allows us to look at synchrony from a neural as well as physical perspective, i.e., physical manifestation of inter-brain synchrony by means of identical or mirrored body movements among participant pairs.
Hyperscanning has been used to explore collaboration in the real world, but there has been little research that applies it in VR (Barde et al., 2019, 2020a; Gumilar et al., 2021a). In one of the few examples, Gumilar et al. (2021b) conducted a finger tracking task in VR, extending an earlier work Barde et al. (2019). Both of these previous work report that they were able to observe brain synchronization in VR that matched brain activity in the same real world task. However, they were based on joint action tasks, not on joint attention task. A related study demonstrated that inter-brain synchrony can occur in cooperative online gaming without physical co-presence, using EEG to measure brain activity during a multiplayer game (Wikström et al., 2022). The findings showed that synchronization across frequency bands decreased during a playing session but was elevated in the second session, indicating that virtual environments, though not specifically VR, can support inter-brain synchrony dynamics. This study highlights the potential for virtual settings to facilitate neural alignment, although it notes the dependence on task design and session progression. Another study used hyperscanning EEG to show that collaborative spatial navigation in VR involves neural synchronization, with distinct delta, theta, and alpha band patterns reflecting role-specific strategies and increased delta causality, but reduced theta/gamma couplings in faster dyads (Chuang et al., 2024). Moreover, a research found that real-like avatars in VR produced the highest number of significant EEG sensor pairs, followed by full-body and head-hand, suggesting that more realistic avatars enhance neural synchronization (Yigitbas and Kaltschmidt, 2024). Furthermore, a study using EEG hyperscanning demonstrated that a shared mixed-reality (MR) environment enhances inter-brain synchronization during cooperative motor tasks compared to individual tasks, with a significant correlation between task performance and synchronization, validating MR’s effectiveness for collaboration (Ogawa and Shimada, 2023). Lastly, a study in an Augmented Reality (AR) setting showed that performing synchronized movements beforehand in remote AR education improves quiz scores, brain synchrony between students, and feelings of closeness, compared to unsynchronized movements, with a clear link between quiz scores and brain synchrony, indicating that synchronized movements improve learning (You et al., 2024).
Given the lack of extended research in this area, we attempt to bridge this gap by studying how VR and neural activity measurements can be combined to investigate cognitive tasks in collaborative VR environments. Our study attempts to gather information on how monitoring neural activity in VR can measure inter-brain synchrony in VR environments on a joint attention task, and how it is comparable to measuring inter-brain synchrony in the real-world environment. In particular we explore brain synchronization in a collaboration on a visual search task in VR, extending earlier work done in the real-world (Szymanski et al., 2017).
2.3 Joint attention and visual search tasks
Vision is considered the most dominant of our senses (Krishna, 2012). We rely on it to navigate through environments we encounter, and it also serves as a way to corroborate what the auditory sense detects in an environment (Witkin et al., 1952; Jackson, 1953). The visual faculty relies on a host of complex cues–color, depth, motion etc., – in order to make accurate judgements regarding regions or objects of interest, and the environments in which these are based. Visual search tasks involve finding specific objects among distractors in a visual display, whether in 2D or 3D environments, with varying levels of cognitive demand (Santos, 2023; Anderson and Lee, 2023; Zhang and Pan, 2022). These tasks can range from routine searches like locating keys on a table to more critical searches like identifying tumors in medical images (Samiei and Clark, 2022). The efficiency of visual search can be influenced by factors such as the size and eccentricity of the target object, with larger and more eccentric targets being found faster with fewer fixations (Wolfe, 2010).
It is the complexities encompassing the visual sense which makes visual search tasks a great tool to analyze a number of factors that affect interaction, cognition and other processes. For example, researchers have used visual search tasks to explore the difference between how visual and auditory cues are assimilated in order to locate a target in an environment (Barde et al., 2020). Other researchers have looked at how motivation and the strategies employed by users affect performance in a visual search task (Boot et al., 2009).
In the neuroscience domain, visual search tasks have been used to induce neural activity of a given band of frequencies (Tallon-Baudry et al., 1997), to study memory (Postle, 2021; Peterson et al., 2001) and to study the effect of visual distractors on task performance (Won et al., 2020; Tanrıkulu et al., 2020), among other things. While an exhaustive review is beyond the scope of this paper, we can clearly see that the visual search is a popular method employed by researchers. Visual search tasks can also be adapted to study a range of cognitive and neurological processes that affect our functioning as humans. Employing visual search tasks in VR offers a valuable method for studying human attention processes. Studies have shown that VR can provide a more ecologically valid setting for visual search experiments, allowing for improved visual realism and participant interaction (Hadnett-Hunter et al., 2022). Also, research has demonstrated that immersive VR technology can effectively evaluate spatial and distractor inhibition attention using complex 3D objects, replicating previous findings and supporting the use of VR for such assessments (Ajana et al., 2023). Additionally, distractions in VR activities can impact task performance, with task-oriented selective attention enhancing performance without compromising the flow experience (Bian et al., 2020). So, this collective evidence reveals the potential of VR for investigating visual search tasks and its connection to attention mechanisms, including joint attention systems.
There are a number of papers that have used hyperscanning to explore brain synchronization in joint attention tasks in the real world (Lachat et al., 2012; Szymanski et al., 2017). For example, Lachat et al. (2012) performed a hyperscanning study and used an eye-gaze task in a face-to-face setup to find the relation between joint attention and alpha and mu bands. Szymanski et al. (2017) provided evidence that during joint attention in a visual search study, local and inter-brain phase synchronization increases and behavioral team performance is correlated with phase synchronization. They also found that neural phase synchronization correlates to social facilitation, which may reveal neural correlates for better performance among some teams when compared to others. In our work, we make a novel contribution by presenting results from the first known joint attention brain synchronization experiment in VR, and compare them with the real world studies. In the next section we describe our experimental method, including the hypothesis, task, and participants.
3 Method
3.1 Hypothesis
The main purpose of our study was to evaluate inter-brain synchrony in a VR environment in a representative joint visual search task, comparing the results of a real-world study with those obtained in VR. We believe that such comparisons are good indicators of how real-world tasks translate to VR by maintaining similar neural activity as seen in the real-world (Gumilar et al., 2021b). They also provide empirical evidence that demonstrates neural inter-connectivity can be achieved in a manner similar to that in the real-world. Furthermore, use of VR has shown positive impacts on collaboration efficiency (Xanthidou et al., 2023). Previous studies have highlighted that virtual knowledge sharing positively influences team effectiveness, especially when supported by collaborative technologies (Farooq and Bashir, 2023). Additionally, remote collaboration in virtual reality, particularly through head-mounted displays (HMD), enhances the sense of co-presence among users, indicating improved collaboration effectiveness (Latini et al., 2022; Bayro et al., 2022). So, we can investigate if brain synchronization in VR collaborative tasks is higher than similar tasks in the “real-world” environment.
To that end, the three hypotheses for our research are:
• H1: Inter-brain phase synchronization will increase during visual search task cooperation in the real-world (reproducing the result of previous real world studies).
• H2: Phase synchronization will occur during a visual search task in VR in a manner which is not significantly different than the real-world.
• H3: Task performance in VR will be higher than in the real-world.
3.2 Participants
Twenty-eight individuals (9 female, 19 male) were recruited via flyers, university mailing lists, social media advertisements and personal contacts. Participants were mostly university students or staff aged between 21 and 39 years (M = 29.11, SD = 6.27). All dyads knew each other previously (i.e., were classmates or colleagues). All participants were right-handed, presented normal or corrected-to-normal visual acuity, and provided informed written consent to participate in the study. No neurological, psychiatric or psychological problems or brain injury history were reported by any of the participants, as determined in a preliminary screening phase. They were also asked if they have previous experience with VR. Nine out of 28 participants (32%) didn’t have any experience with VR while 51.5% used VR several times per month.
Prior to conducting the experiment we calculated the required sample size to achieve an acceptable power in the analysis using G*Power version 3.1. We found that to achieve a power of 0.85, 24 participants were required. Hence, our sample size is sufficient for the experimental validity. Participation was voluntary, and each of the participants were given a $40 gift voucher as compensation for taking part in the study.
3.3 Task and Procedure
The visual search task for participants involved locating target objects within a static scene. This static scene included 82 distractor objects usually found in an office or home (e.g., toys, kitchenware, office stationary and small home objects). The objects used and the experiment method followed was adapted from a similar real world study reported in Szymanski et al. (2017).
The object combinations were displayed on a wall using a video projector for the real-world condition (RW) and were presented in a head mounted display (HMD) for the VR condition (Figure 2). Participants could see a blank scene displaying an object name in the VR environment asking them to count a specific target object on the shelves in front of them, which could be zero, one or two objects amongst a collection of random objects. The same object never appeared as a target more than once in the same display condition, either VR or RW, and each time a different combination of random objects was displayed for them. This was done to prevent participants from being able to memorize and predict the placement of target objects during the experiment. These conditions were designed for both the RW and VR environments. Users had the freedom to look around in the VR environment as they normally would in the real-world. This was done to mimic, as closely as possible, the task carried out in the real-world condition.
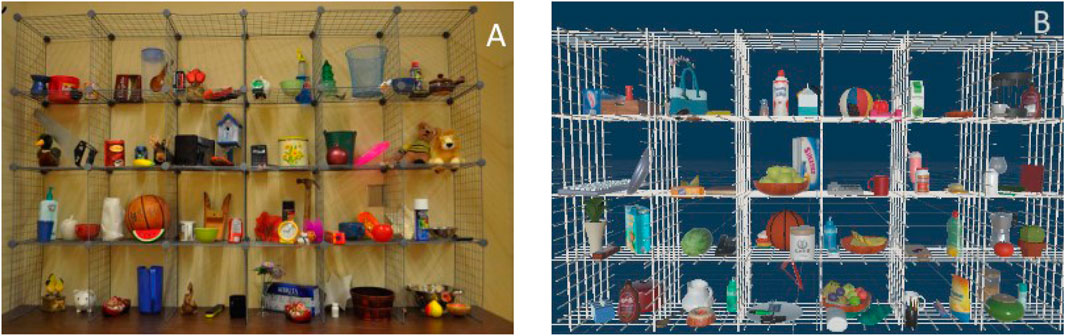
Figure 2. A set of 82 distracting objects in (A) the real world adapted from Szymanski et al. (2017) and (B) the VR environment.
The study was designed as a 2 × 2 within-subjects experiment with two factors: 1) environment and 2) cooperation. Participants experienced four conditions in total; in each environment (VR or RW) there were two conditions where participants performed the task individually, or completed the task as a team. In team conditions, participants sat side by side in the same room, having the same view and they were given a question about the object which they had to look for in the next scene, and to find the number of occurrences of that specific object. Participants were instructed in team condition to decide on a strategy to collaborate and find the objects faster and in a more accurate way. For example, they could divide the shelves in 2 sections (i.e., top/down or left/right of the shelves) and each participant looked for the objects only in half of the shelves. In both individual and team conditions, each participant was asked to find 14 objects in 14 different scenes of random placements in each environment condition (VR and Real-world). In the VR mode, participants had to wear an HTC VIVE VR HMD and experienced the same number of scenes. The VIVE headset featured a 110 field of view, a refresh rate of 90 Hz and built-in headphones.
In this study, the order of environments and conditions for study groups was randomly selected to counterbalance the experiment, however the order of questions was the same for each group. In the individual condition in both environments, participants were given the same set of questions and objects placement while each participant could not see the other participants’ scenes and questions during the experiment in the study room.
After three practice trials, the main task started in which participants saw three scenes with collections of objects from where the participants were asked to find target objects and count their number. The target object that was required to be found was communicated to them in advance by showing a message on the screen asking to find a certain object. Once reading the question, participants pulled the trigger on a handheld controller which showed a scene in which a shelf of objects was displayed. Participants were required to search this scene to decide on the number of targets they had found. Following this, they moved to the next scene by pressing the trigger on a handheld controller which showed the same question again and they had to call out the answer, i.e., the number of objects they found. EEG signals were recorded at the beginning of the search task and paused at the end of the task so the synchronization was based on the starting and ending time of the activity (Figure 3). This ensured that neural activity that was recorded only represented the time that was spent on collaborative search tasks which was mostly less than 20 s to answer each question.
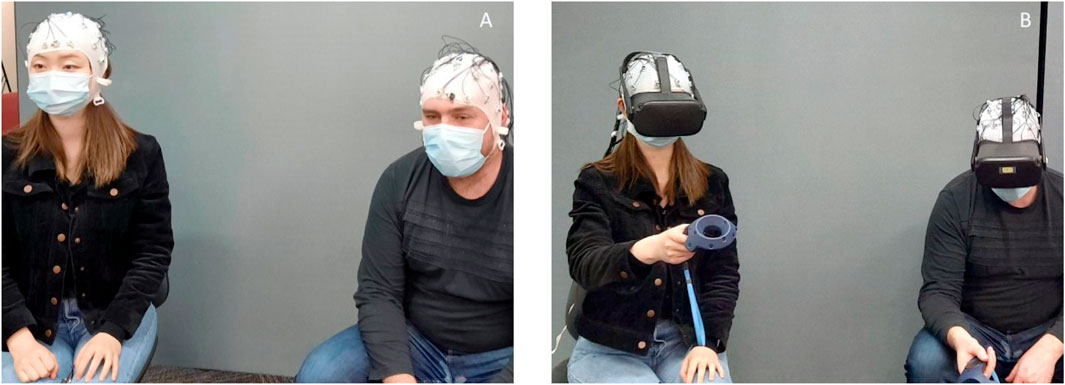
Figure 3. EEG hyperscanning during the study in (A) the real world and (B) the VR environment.
After each team condition, subjects were surveyed on how they felt about their partner’s presence and cooperation during the visual search task. This was done by asking them to complete a short Likert scale survey (see Figure 4), where they rated items on a scale of 1 (totally disagree) to 7 (totally agree). This questionnaire was adapted from a study by Gupta et al. (2016).
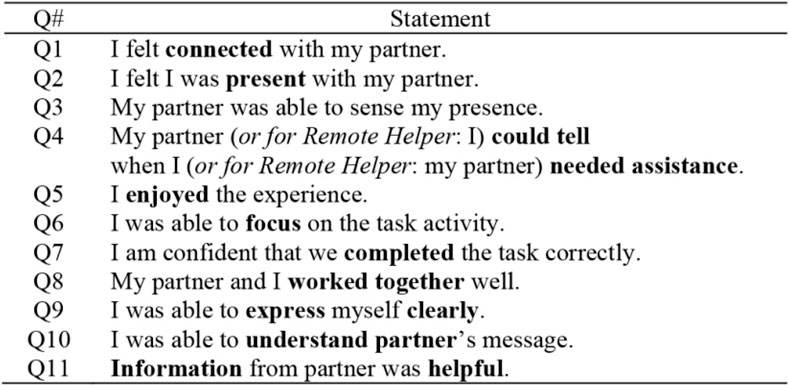
Figure 4. Likert scale rating questions on co-presence and cooperation adapted from Gupta et al. (2016).
3.4 EEG data acquisition
During the tasks, neural activity was recorded using two sets of 32 electrodes (Ag/AgCl) Brain Vision LiveAmp EEG devices1. Separate amplifiers with individual ground electrodes were used for each person linked to two PCs to collect synchronized brain signals. For the placement of EEG electrodes on scalp, the international 10–20 system was used. The EEG channels were recorded at a sampling rate of 512 Hz. Two other computers with multiple synchronized screens were used for stimulus presentation. Prior to data collection, we adjusted electrode placements until all signals indicating optimal impedance
3.5 Behavioral analysis
The accuracy of answers was calculated for each individual and team conditions using the data analysis methods provided in prior work (Szymanski et al., 2017). Efficiency was calculated based on the number of correct answers, and the time participants took to find the objects was also recorded. These were compared between the team and the individual sessions as well as VR and RW environments.
3.6 EEG data analysis
Two pairs (one male-male and one female-female) were excluded from the analysis due to technical issues with EEG recording hardware. As a result, only data from 24 participants (twelve pairs) was analysed. The recorded data was processed using MNE Python2 and the HyPyP library for Python (Ayrolles et al., 2021). This was done to determine which environment showed a higher neural synchrony in social sessions. Prior research suggested that the Circular Correlation Coefficient (CCorr) offers enhanced robustness in detecting artificial inter-brain associations (Burgess, 2013). Therefore, we utilized CCorr (Jammalamadaka and Sengupta, 2001) to evaluate the synchrony between the two cerebral signals. The integration of this equation into the HyPyP library facilitated its application for analyzing inter-brain synchronization data.
To reduce electrical interference, the EEG data were initially pre-processed using a 50 Hz notch filter and a band-pass filter (1–60 Hz). The filters were implemented using the MNE-Python library (Gramfort et al., 2013), employing finite impulse response (FIR) filters to preserve phase information critical for PLV calculations. Default filter orders were used as provided by MNE-Python version 22.3.0, ensuring minimal distortion of the phase relationships between signals.
Motion artifacts induced by the VR headset, along with eye movement and muscle (EMG/EOG) noise, were addressed using a machine learning technique from MNE-Python integrated into the HyPyP module, a Python tool for inter-brain synchrony research as well as independent component analysis (ICA). To assess signal quality, the signal-to-noise ratio (SNR) was estimated post-preprocessing for a subset of data, yielding an average SNR of approximately 3.2 dB (SD = 0.8 dB) across conditions, indicating acceptable signal clarity for phase synchronization analysis despite the challenges posed by VR headset movements. An automatic rejection threshold, implemented via the auto-reject package (Jas et al., 2017), rejected approximately 5%–10% of epochs across participants, with paired rejection ensuring synchrony analysis integrity. When a participant’s data was rejected, the corresponding epoch for the other participant was automatically rejected as well.
3.7 Phase locking value (PLV) analysis
The Phase Locking Value (PLV) is a measurement of the relative phase difference between two signals (Lachaux et al., 1999). In EEG hyperscanning, the PLV is used to analyze the phase of pairs of simultaneous EEG signals. This is one of the most frequently used methods to demonstrate that brain-to-brain coupling exists between individuals in social interactions (Haresign et al., 2022; Gumilar et al., 2021a). The PLV takes values on the scale of [0, 1] in which 0 being the situation where there is no phase synchrony and 1 reflecting the situation where relative phases are identical in all trials. From filtered and pre-processed EEG data, the phase value of the signal using the Hilbert transform can be extracted. As originally proposed by Lachaux et al. (1999), PLV is derived from this phase information by calculating a time-varying value for neural synchrony and is computed as:
Where N indicates the total number of epochs (the data organized into equal parts according to a specified time frame) and
In this study, we began by calculating the PLV, denoted as the “real” PLV for this analysis, for each set of 1024 (32 × 32) connections, performed according to Equation 1. For the control measure, random PLV scores were generated by randomizing the epoch of the recorded data prior to PLV calculation. This randomization process was iterated 200 times for each electrode pair, resulting in a distribution of 200 randomized PLV scores. Subsequently, the “real” PLV score for each electrode pair was compared to the distribution of randomized PLV scores. This comparison allowed for the evaluation of whether the observed PLV score exceeded the level of random chance synchronization (Yun et al., 2012), and if it was significant.
4 Results
4.1 Statistical analysis
In this study we adopted the PLV method using the HyPyP package and used the analysis method of Gumilar et al. (2022) to find the functional connectivity between the two interacting brains. Before processing raw data, the MNE-Python package (Gramfort et al., 2013) and the HyPyP package were utilized for pre-processing the raw EEG signals. According to their method, there were 1024 electrode pairs (32 × 32 electrodes) for each pair of participants. So, there were 1024 PLV scores between 0 and 1 that indicated the magnitude of inter-brain synchrony for all possible pairs. By applying a cut-off (p < 0.05) to a distribution of the PLV scores (1024 PLV scores for each pair of subjects), we extracted only those scores that were below the threshold. Pairs with PLV scores above the 95% confidence interval were retained as significant PLV scores which reflect the top 5% highest synchronization and we call them significant connections or significant connectivity. The total number of aligned electrode pairs (significant connections) were counted (out of 1024 total pairs) for each condition along with the frequency bands (i.e., theta, alpha, beta, and gamma) within which they were observed. Tables 1, 2 presents an overview of the total number of connections that were observed along with a band-wise breakdown of the inter-brain connections.
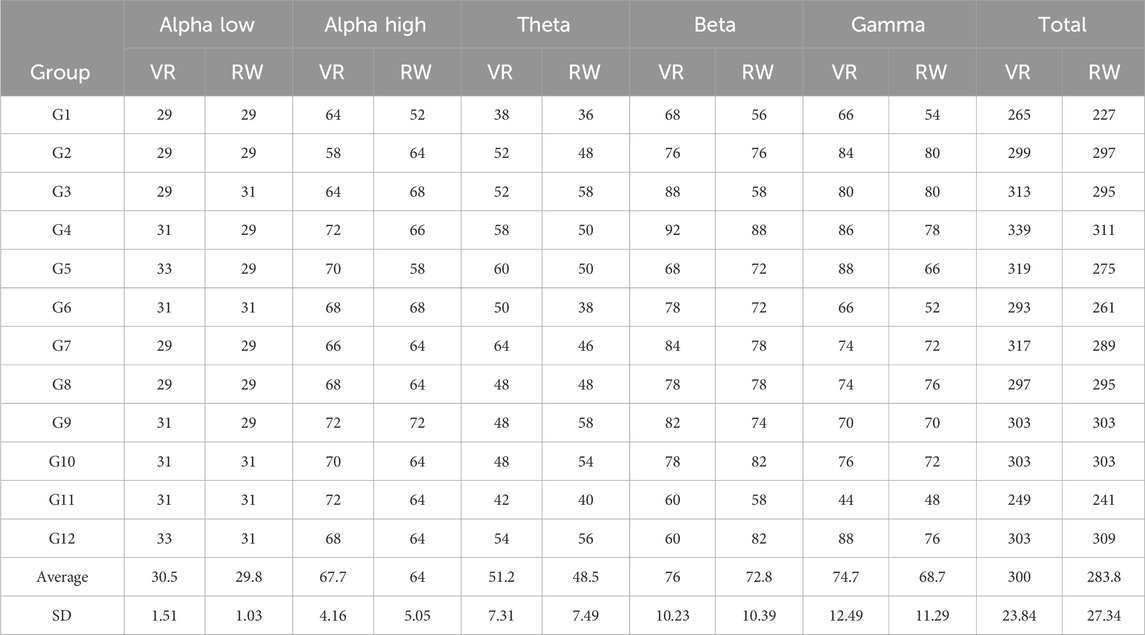
Table 1. Number of strong brain connections in team condition (VR vs RW environments).
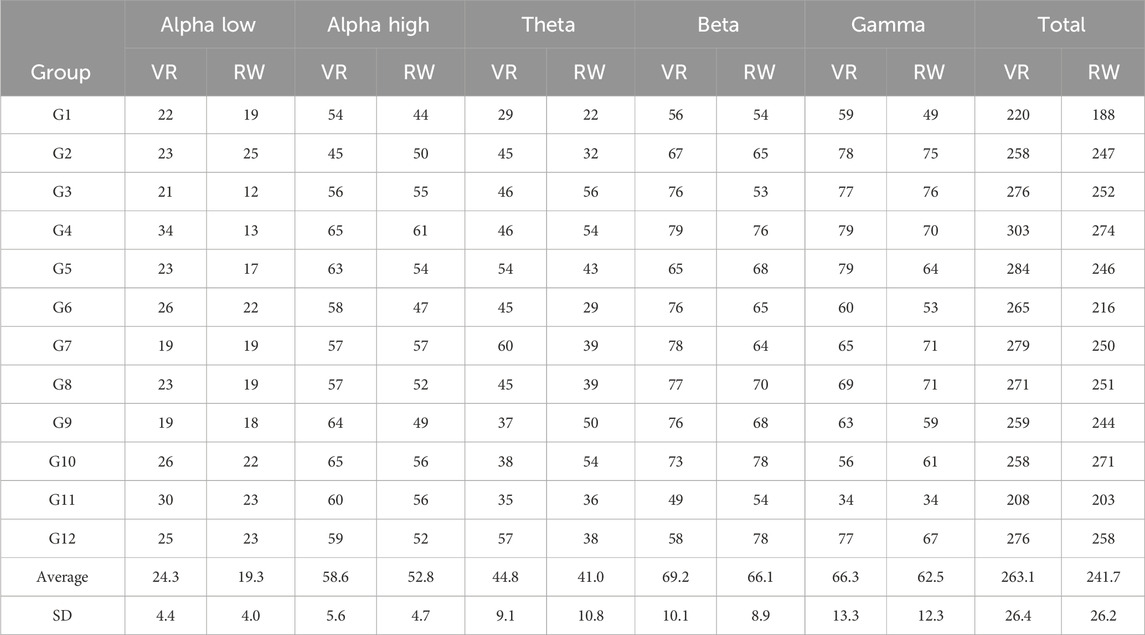
Table 2. Number of strong brain connections in individual condition (VR vs RW environments).
4.2 EEG data analysis results
4.2.1 Individual vs team conditions
Tables 1, 2 summarises the results of each conditions. Our data analysis using paired t-tests shows that the number of significant connections between participants’ brains in the team condition (mean = 283.8, SD = 27.3) was significantly higher (
We also found that the average response time of each pair in the RW environment in the individual condition was significantly less than the response time in the team condition in the same environment
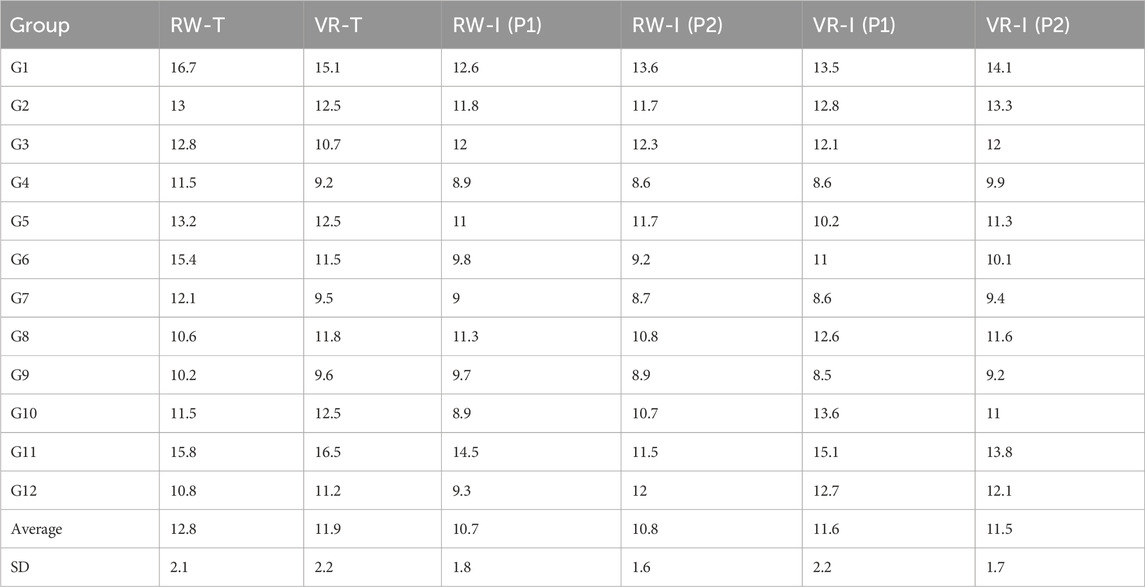
Table 3. Response time for individual condition comparing to team condition in both VR and RW environments.
4.2.2 Regression analysis
Regression analysis results demonstrate a significant positive relationship between task performance and inter-brain synchrony in RW condition
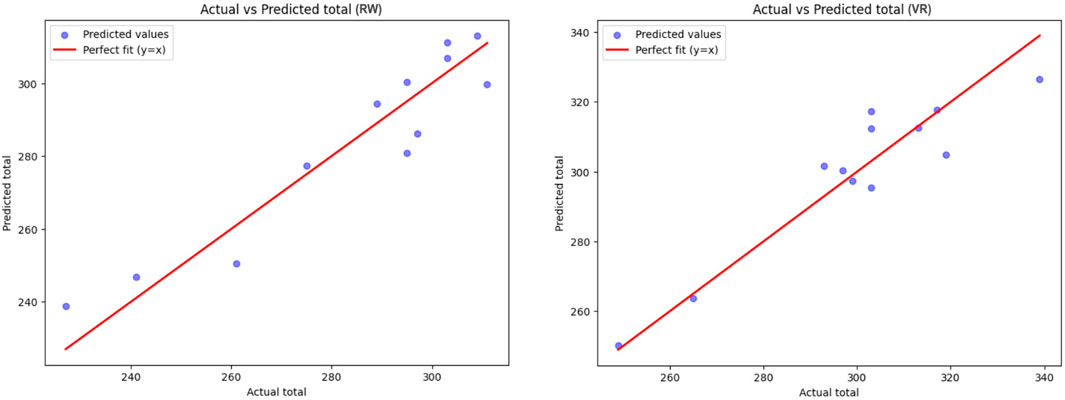
Figure 5. Regression analysis for task performance and inter-brain synchrony in RW
The regression model for real-world condition is articulated as follows:
The regression model, with an R-squared value of 0.8913, accounts for approximately 89% of the variance in total, indicating robust predictive capability. The Mean Squared Error (MSE) of 74.46 reinforces the model’s correctness by signifying a comparatively minor average squared deviation between observed and projected values.
For VR dataset, the regression model is expressed as:
The regression model explains about 87.24% of the changes in the data, as shown by an R-squared value of 0.8724, which means it fits the data well. The Mean Squared Error (MSE) of 66.47 shows that the average difference between predicted and real total scores is quite small, proving the model predicts steadily. These numbers together show the model works well to find the total score, with Time and correct answers having big but different effects on the result (Figure 6).
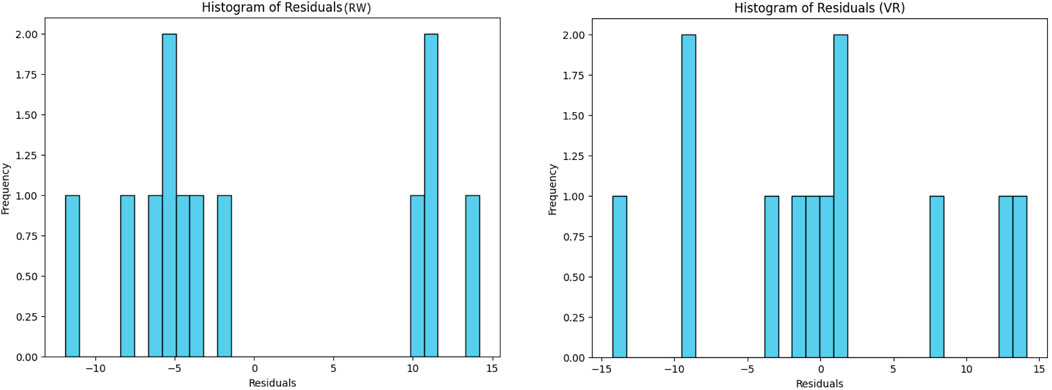
Figure 6. Residuals histograms in the RW and VR conditions.
More checking with residual analysis and Bland-Altman plots, done in both Real-World (RW) and Virtual Reality (VR) settings, shows the regression models give fair predictions. The average residual is almost zero
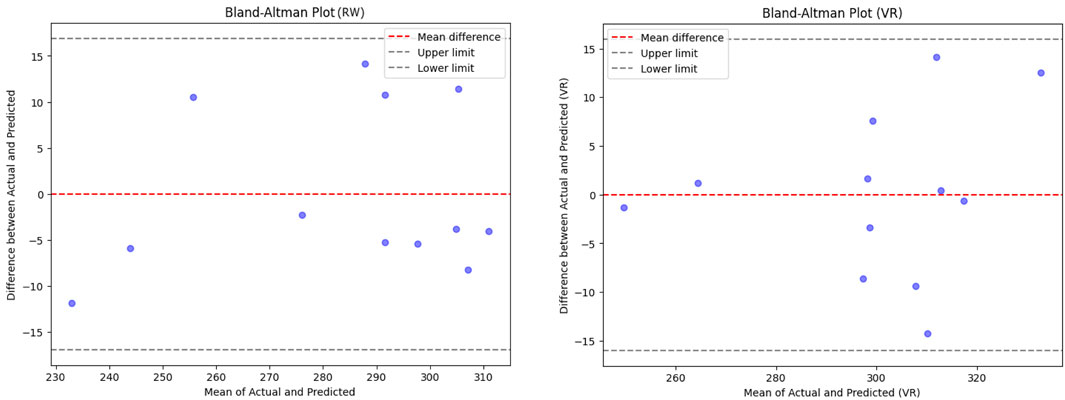
Figure 7. Bland-Altman comparison of measurement agreement in RW and VR conditions.
Overall, both models catch the data patterns well, as seen in their high R-squared values and decent prediction correctness. Though the data is a bit off from being perfectly normal, this happens often in real studies and does not ruin the results. Future work could try changing the data or using stronger methods to improve the findings’ sureness. Still, for practical use, the models are strong and trustworthy enough.
4.2.3 Correlation test
By running data analysis using PLV method and calculating the number of significant connections between all 1024 electrode pairs in each group in both real-world and VR conditions, we noticed a high correlation between the correct answers and number of significant connections in Beta, Gamma and Theta bands in both VR and RW, but no significant correlation was found in alpha-low and alpha-high bands, as expected (Table 4). This is because the Alpha band is mostly related to relaxation state or slow activity which was not included in our cooperative task.
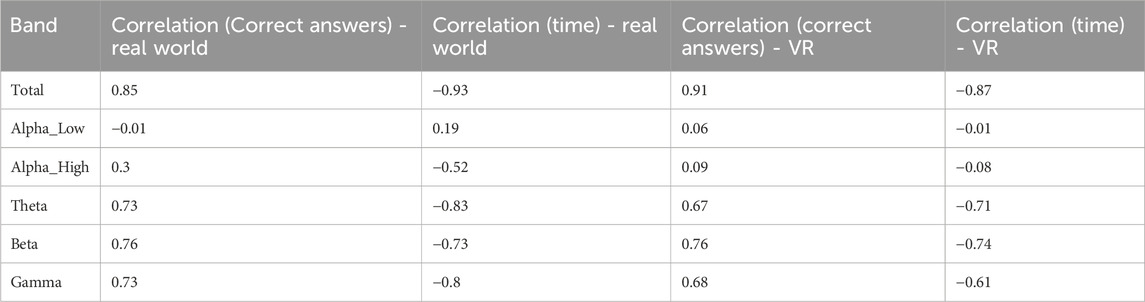
Table 4. Correlation test results (
We also noticed that there was a high number of connections between specific brain areas which appeared in most of participants during the search task in Beta, Theta and Gamma bands (Figure 8) specially in the same electrode pairs. However, the strong connections that appeared in both VR and the RW environments were almost the same. Figure 9 presents all the brain areas with significant correlation seen in all subjects which represents the similarity of most areas in subject pairs. These heat-map grids also show that there are less connections in the frontal areas of the brain and the strongest connections appears from center to back areas of the brain. Although there were many common areas with strong connections in both VR and the RW environments, some connections were seen distinctively in each environment (Figure 10). In the VR condition more unique active brain areas have been seen in Beta and Theta bands.
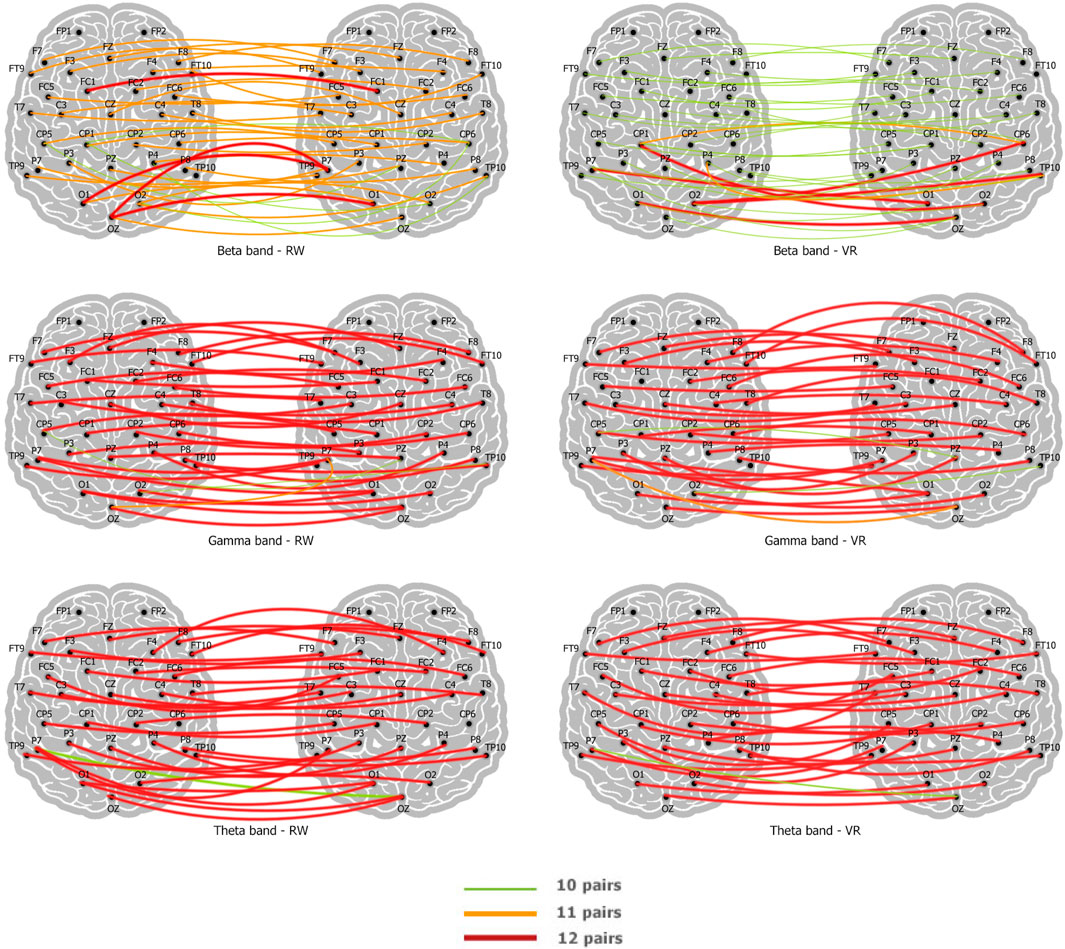
Figure 8. Comparing brain areas which reflected more inter-brain synchrony appeared in most subjects.
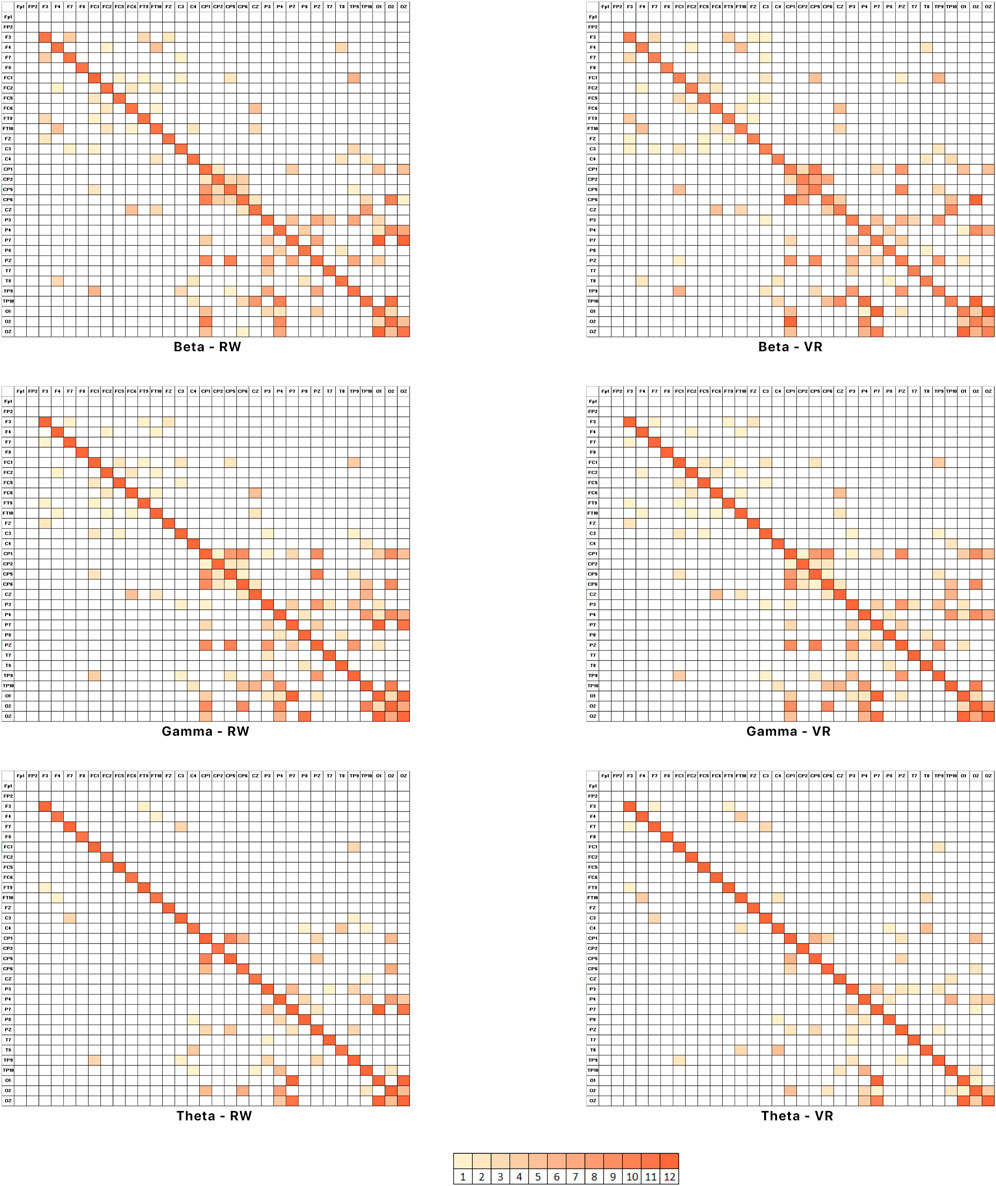
Figure 9. Comparing brain areas which reflected more inter-brain synchrony appeared in all subjects.
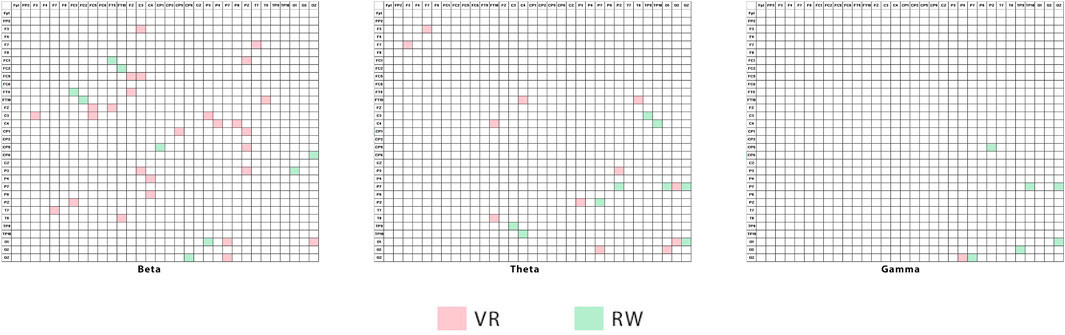
Figure 10. Strong connections unique in each environment.
4.2.4 Beta band
Based on the correlation analysis, we observed that in the Beta band (13.5–29.5 Hz) the number of significant connections demonstrated a strong correlation with the number of correct answers in both the RW and VR environments (RW = 0.76, VR = 0.76). The Beta band is generally thought to be associated with listening, thinking, analytical problem solving and decision making (Sherlin, 2009). Given that these were activities that the participants were involved in as part of the task, the increased activity in this band, especially for pairs with a greater percentage of correct answers, appears logical and in line with previous literature (Szymanski et al., 2017).
4.2.5 Gamma band
Our analysis also revealed a strong correlation between the Gamma band and total number of correct answers, i.e., the greater the number of significant connection observed between the participants’ brains in Gamma band, the better performance (RW = 0.73, VR = 0.68). Gamma is measured between 30 and 44 Hz and is the only frequency band found in every part of the brain. The subjective feeling states for gamma bands are thinking and integrated thoughts, high-level information processing and binding (Kaiser and Lutzenberger, 2003). It’s also associated with information-rich task processing which was a part of this study.
4.2.6 Theta band
Theta activity is classified as “slow” (4–7 Hz) and is associated with creativity, intuition, daydreaming, and fantasizing. It also serves as a storage area for memories and emotions, sensations (Carson, 2010; Bekkedal et al., 2011). We observed a strong correlation between the number of correct answers and the number of significant brain connections in Theta band in both RW and VR environments (RW = 0.73, VR = 0.67).
4.2.7 All bands results
Our statistical analysis reveals an improvement in the number of correct answers (Figure 11) and faster response time (Figure 12) when the total number of significant brain connections across all bands is increased. Correlation tests showed a meaningful correlation between total number of strong connections and correct answers in the VR and RW conditions as well as response time in both environments (Table 4).
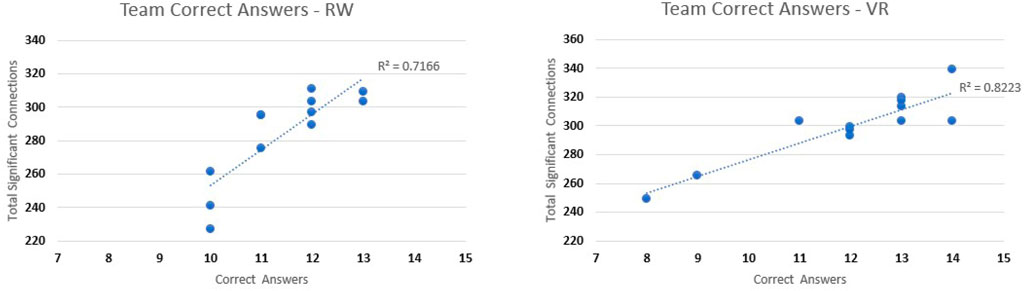
Figure 11. Correct answers and total number of significant connections across all bands.
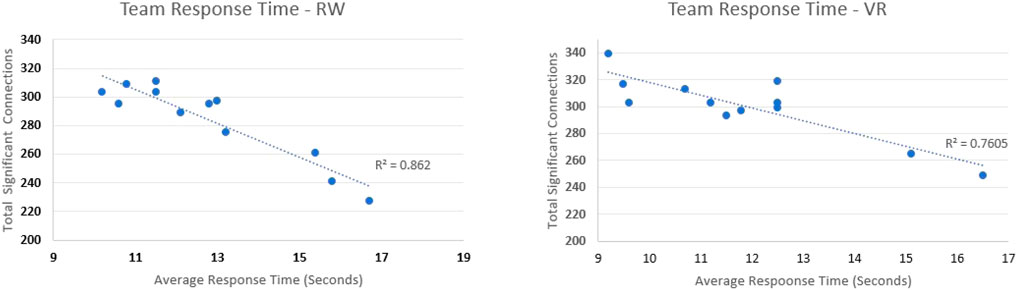
Figure 12. Average response time and total number of significant connections across all bands.
4.3 Subjective data analysis
Statistical analysis of the subjective data using a correlation test and the Wilcoxon signed-rank test demonstrated that there appeared to be no correlation between how the participants felt and the proportion of correct answers, or time on task. The rating scores from the subjective questionnaire results also demonstrated no significant differences (p
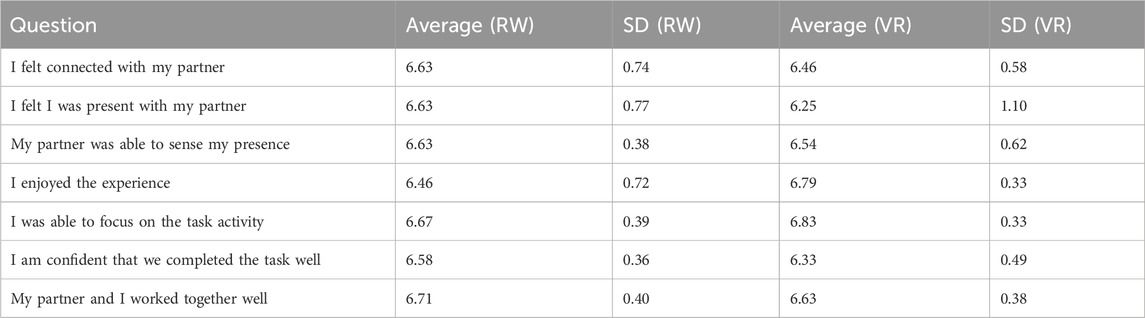
Table 5. Subjective data analysis result (average and SD in Likert scale rating for RW and VR).
4.3.1 Mediation analysis
We also conducted a mediation analysis to test whether the path “task performance
4.3.2 Participants’ VR experience effect
Our study included one group new to VR, four with a single VR-experienced member, and seven where both teammates were VR-familiar. To address the potential confounding effect of participants’ VR experience and the limitations of our final sample size
5 Discussion
The research study detailed in this paper set out to explore the neural correlates of cooperation in VR versus the RW using the hyperscanning technique for a joint attention task. We chose an existing real world visual search task that had previously been found to produce brain synchronization (Szymanski et al., 2017). This was replicated in the RW and in VR to study the similarities and/or differences in the inter-brain connectivity of the pairs undertaking the task. Task completion times and a subjective measures of presence and cooperation were recorded in order to evaluate their correlation with inter-brain connectivity measures.
For both the VR and real world conditions, statistical analysis revealed that dyads with a higher number of significant inter-brain connections performed better at the collaborative visual search tasks than dyads with a lower number of significant inter-brain connections. It also appears that teams with a higher number of inter-brain connections within the three bands (beta, gamma and theta) performed significantly better at the task than dyads that had less number of connections within those bands. Interestingly, studies have shown that alterations in theta band activities in occipital and frontal brain areas can significantly impact memory processing and performance (Takase et al., 2019). Additionally, enhancements in frontal theta and beta oscillatory synchronizations have been linked to improved executive abilities, attention control, and memory maintenance during working memory tasks, showcasing the importance of different frequency band oscillations in cognitive processes (Tian et al., 2021). While there appears to be few studies in VR looking at inter-brain synchrony, the results obtained here appear to suggest that a large amount of inter-brain connectivity within a certain set of bands can be a predictor of outcomes in a joint attention collaborative task.
Our results in this study demonstrate that there appears to be a meaningful correlation of inter-brain connectivity within certain bands and the number of correct answers and time of doing the requested visual search task. It also demonstrations effective collaboration between individuals when they display a certain level of inter-brain connectivity across a range of bands. These results indicate that there is potential to evoke activity in those bands among collaborating individuals which shows some correlation in the number of significant connections and collaboration efficiency without considering the causality. This, in turn, could aid in measuring or monitoring the quality of collaboration between individuals and result in improved task completion times, as based on this study results, there’s a correlation and brain synchrony in VR comparable to the same task in the real world.
So, in terms of the three hypotheses, we did indeed see an increase in brain synchronization from individual to team conditions in the real world, reproducing the previous results of Szymanski et al. (2017), so hypothesis H1 was supported. We also observed brain synchronization in the visual search task in VR for most of the EEG bands, so hypothesis H2 was supported. However, there was no significant increase in brain synchronization in the VR condition, compared to the real world condition in task completion time (t (11) = 2.2, p = 0.073) and number of correct answers (t (11) = 2.2, p = 0.206), so hypothesis H3 was not supported.
While these results are promising, it must be noted that there is still an element of uncertainty to the research detailed in this paper. Hyperscanning is an emerging technique that has found usage in a number of fields that explore the different facets of collaboration, both in real and virtual environments. A major factor determining the validity of the results obtained via Hyperscanning are the analysis methods. In its current state, there exist several methods for processing data that have stirred a considerable debate within the community with regards to their validity and ability to reliably measure and represent inter-brain synchrony. However, notwithstanding these methods, Hyperscanning has shown itself to be a useful technique to capture neural data from two or more individuals interacting simultaneously both in the real and virtual environments.
6 Limitations of the research
Although these results are very interesting, there are a number of limitations with the study that will have to be addressed in future work. We tried to reproduce the results of a similar real world study Szymanski et al. (2017) and compare it to running the study in a VR environment. So the task employed for this study was very simple and the results obtained may not be generalizable to a wider range of VR activities. In the future we would like to explore a range of different joint activity tasks in VR, such as object matching, tracking, and text comprehension, among others. The task simplicity meant that there was only a small range in the number of correct answers, which may have limited amount of data points for the correlation measures. In the future we will look for tasks that can produce a wider range of performance measures. The participants were all university students or staff which may limit the applicability of the results. For example, elderly may exhibit different behaviours. In the future we plan to test with a wider range of subjects.
Another important limitation was lack of a standard data analysis method or tool in EEG hyperscanning studies to identify synced brain signals, so we had to work on different techniques and prepare custom scripts for data analysis to get reliable results. Automatic visualizing tools for such studies are also not yet available to draw different understandable brain figures and connections. There is a great opportunity for developers to work on such tools to be used in future hyperscanning studies.
In addition to this, it is also important to note that another limitation is the lack of directionality analysis in our PLV results. PLV measures phase synchronization but does not distinguish the direction of information flow, such as whether a “leader-follower” neurodynamic pattern exists, potentially involving enhanced parietal-to-frontal information flow in VR. This could provide insights into hierarchical collaboration dynamics, as parietal regions are associated with spatial attention and frontal regions with executive control. The absence of analyses like Granger causality or Phase Lag Index limits our ability to explore these patterns, which was not feasible in the current study due to time and resource constraints. Future work should address this by incorporating directionality measures to better understand the neural mechanisms of VR-based collaboration.
Technical problems and limitations were also considerable in this study. Placing VR displays on EEG caps added some pressure on a few electrodes and in some cases caused electrode movements and signal weakness. To overcome this issue and have reliable EEG signals, we had to reset the electrodes placements and EEG setup after each condition which increased the study time and led to EEG gel dryness. So we needed to reapply gel on the head to prevent signal loss and enable capture of constant signals. In the future VR HMDs such as the OpenBCI Galea3 will become available which has EEG sensors into the HMD, reducing this problem.
Moreover, the possibility of EEG signal interference caused by the VR head-mounted displays was another limitation of this study. To control or reduce the interference, the participants were asked to avoid unnecessary movements to minimize the electrical noise from the device, movement-related artifacts, or changes in electrode placement when wearing the headset. To address this, future studies could use VR headsets with built-in EEG sensors, which may improve signal stability and reduce motion-related noise. Additionally, multiple signal processing techniques were used to help separate brain signals from unwanted interference. However, we note that other processing methods such as surrogate analysis or machine learning-based noise removal methods can be employed for upcoming studies in the future to enhance the signal quality.
Finally, another limitation was that the study participants were mainly university students, which may not represent the general population. Students often have similar experiences, education levels, and familiarity with technology, which could influence the results. Future research should include a wider range of participants, such as people of different ages, backgrounds, and professional experiences. This would make the findings more applicable to real world settings. Increasing the number of participants and including individuals with different levels of VR experience could also provide insights into how familiarity with VR affects brain synchrony and collaboration quality.
7 Conclusion and future work
In this paper we presented results from one of the first brain synchronization studies using a joint attention task in VR. We observed inter-brain synchrony occurred in the VR environment similar to the real world as well as increased phase synchronization between the brains.
The results confirm that brain synchronization can occur in a joint attention task in VR and produces similar results to those seen in the real-world. This implies that collaborative VR environments could be used as a means to elicit, promote and increase inter-brain synchrony among individuals. VR could be also used to perform more controlled experiments that might help better understanding brain synchronization in the real world, exploring more about the social neuroscience of communication, and creating guidelines for developing better collaborative VR experiences.
There are many directions that this research could go in the future. In the limitations section we outlined some work that could be done to address some of the shortcomings of this study. In addition to this, we would like to explore what features could be added to VR experiences to increase the amount of brain synchronization. For example, in VR it is possible for both people in the real world to have the same viewpoint and share the same virtual body. This shared perception may increase the amount of brain synchronization (Gumilar et al., 2022). Another interesting area of research would be to see if other physiological cues also synchronize in collaborative tasks. For instance, VR HMDs may have integrated eye tracking, heart rate sensors and EEG sensors4. Using these, it would be interesting to see if pupil dilation and heart rate demonstrate the kind of synchronization between participants that we have observed with neural activity. Finally, we would like to explore brain synchronization in large group settings in VR, and see if this could be used as a potential team performance enhancement tool in the future.
This research is just the beginning of various work that can be done to explore the potential of VR for social neuroscience studies. We hope that the study detailed in this paper will inspire others to continue research in this area.
Data availability statement
The datasets presented in this article are not readily available because the IP of the data belongs to the University of South Australia and collected data could not be shared. Requests to access the datasets should be directed to unisa.edu.au.
Ethics statement
The studies involving humans were approved by Ms Tess Penglis, Manager of Research Ethics Committee - University of South Australia. The studies were conducted in accordance with the local legislation and institutional requirements. The participants provided their written informed consent to participate in this study. Written informed consent was obtained from the individual(s) for the publication of any potentially identifiable images or data included in this article.
Author contributions
AFH: Writing – original draft, Writing – review and editing, Formal Analysis, Investigation, Methodology, Project administration, Resources, Software, Visualization. AB: Writing – review and editing. IG: Software, Writing – review and editing. AM: Software, Writing – review and editing. GL: Writing – review and editing. AC: Supervision, Writing – review and editing. MB: Supervision, Writing – review and editing.
Funding
The author(s) declare that no financial support was received for the research and/or publication of this article.
Acknowledgments
Some paragraphs in this manuscript were refined with the assistance of OpenAI’s ChatGPT-4 (March 2024 version, https://openai.com/chatgpt), which was used under the authors’ supervision to improve grammar and clarity. All content was critically reviewed and approved by the authors.
Conflict of interest
The authors declare that the research was conducted in the absence of any commercial or financial relationships that could be construed as a potential conflict of interest.
Publisher’s note
All claims expressed in this article are solely those of the authors and do not necessarily represent those of their affiliated organizations, or those of the publisher, the editors and the reviewers. Any product that may be evaluated in this article, or claim that may be made by its manufacturer, is not guaranteed or endorsed by the publisher.
Footnotes
1https://pressrelease.brainproducts.com/liveamp/
2https://mne.tools/stable/index.html
3https://shop.openbci.com/products/galea
4https://openbci.com/community/introducing-galea-bci-hmd-biosensing/
References
Abubshait, A., Parenti, L., Perez-Osorio, J., and Wykowska, A. (2022). Misleading robot signals in a classification task induce cognitive load as measured by theta synchronization between frontal and temporo-parietal brain regions. Front. Neuroergonomics 3, 838136. doi:10.3389/fnrgo.2022.838136
Acquadro, M. A., Congedo, M., and De Riddeer, D. (2016). Music performance as an experimental approach to hyperscanning studies. Front. Hum. Neurosci. 10, 242. doi:10.3389/fnhum.2016.00242
Ajana, K., Everard, G., Lejeune, T., and Edwards, M. G. (2023). A feature and conjunction visual search immersive virtual reality serious game for measuring spatial and distractor inhibition attention using response time and action kinematics. J. Clin. Exp. Neuropsychology 45, 292–303. doi:10.1080/13803395.2023.2218571
Alekseichuk, I., Turi, Z., De Lara, G. A., Antal, A., and Paulus, W. (2016). Spatial working memory in humans depends on theta and high gamma synchronization in the prefrontal cortex. Curr. Biol. 26, 1513–1521. doi:10.1016/j.cub.2016.04.035
Anderson, B. A., and Lee, D. S. (2023). Visual search as effortful work. J. Exp. Psychol. General 152, 1580–1597. doi:10.1037/xge0001334
Astolfi, L., Toppi, J., Fallani, F. D. V., Vecchiato, G., Cincotti, F., Wilke, C. T., et al. (2011). Imaging the social brain by simultaneous hyperscanning during subject interaction. IEEE Intell. Syst. 26, 38–45. doi:10.1109/mis.2011.61
Ayrolles, A., Brun, F., Chen, P., Djalovski, A., Beauxis, Y., Delorme, R., et al. (2021). Hypyp: a hyperscanning python pipeline for inter-brain connectivity analysis. Soc. Cognitive Affect. Neurosci. 16, 72–83. doi:10.1093/scan/nsaa141
Babiloni, F., and Astolfi, L. (2014). Social neuroscience and hyperscanning techniques: past, present and future. Neurosci. & Biobehav. Rev. 44, 76–93. doi:10.1016/j.neubiorev.2012.07.006
Babiloni, F., Cincotti, F., Mattia, D., Mattiocco, M., Fallani, F. D. V., Tocci, A., et al. (2006). “Hypermethods for eeg hyperscanning,” in 2006 international conference of the IEEE engineering in medicine and biology society (IEEE), 3666–3669.
Bailenson, J. N., Blascovich, J., Beall, A. C., and Loomis, J. M. (2003). Interpersonal distance in immersive virtual environments. Personality Soc. Psychol. Bull. 29, 819–833. doi:10.1177/0146167203029007002
Barde, A., Gumilar, I., Hayati, A. F., Dey, A., Lee, G., and Billinghurst, M. (2020a). “A review of hyperscanning and its use in virtual environments,”, 7. Multidisciplinary Digital Publishing Institute, 55. doi:10.3390/informatics7040055Informatics
Barde, A., Saffaryazdi, N., Withana, P., Patel, N., Sasikumar, P., and Billinghurst, M. (2019). Inter-brain connectivity: comparisons between real and virtual environments using hyperscanning, 338–339.
Barde, A., Ward, M., Lindeman, R., and Billinghurst, M. (2020). The use of spatialised auditory and visual cues for target acqusition in a search task. Available online at: https://aes2.org/publications/elibrary-page/?id=20875.
Battich, L., Garzorz, I., Wahn, B., and Deroy, O. (2021). The impact of joint attention on the sound-induced flash illusions. Atten. Percept. & Psychophys. 83, 3056–3068. doi:10.3758/s13414-021-02347-5
Bayro, A., Ghasemi, Y., and Jeong, H. (2022). “Subjective and objective analyses of collaboration and co-presence in a virtual reality remote environment,” in 2022 ieee conference on virtual reality and 3d user interfaces abstracts and workshops (vrw) (IEEE), 485–487.
Bekkedal, M. Y., Rossi III, J., and Panksepp, J. (2011). Human brain eeg indices of emotions: delineating responses to affective vocalizations by measuring frontal theta event-related synchronization. Neurosci. & Biobehav. Rev. 35, 1959–1970. doi:10.1016/j.neubiorev.2011.05.001
Bian, Y., Zhou, C., Chen, Y., Zhao, Y., Liu, J., and Yang, C. (2020). “The role of the field dependence-independence construct on the flow-performance link in virtual reality,” in Symposium on interactive 3D graphics and games, 1–9.
Boot, W. R., Becic, E., and Kramer, A. F. (2009). Stable individual differences in search strategy? the effect of task demands and motivational factors on scanning strategy in visual search. J. Vis. 9, 7. doi:10.1167/9.3.7
Burgess, A. P. (2013). On the interpretation of synchronization in eeg hyperscanning studies: a cautionary note. Front. Hum. Neurosci. 7, 881. doi:10.3389/fnhum.2013.00881
Carson, S. (2010). Your creative brain: seven steps to maximize imagination, productivity, and innovation in your life, 1. John Wiley & Sons.
Chuang, C.-H., Peng, P.-H., and Chen, Y.-C. (2024). Leveraging hyperscanning eeg and vr omnidirectional treadmill to explore inter-brain synchrony in collaborative spatial navigation. arXiv preprint arXiv:2406.06327.
Cross, Z. R., Chatburn, A., Melberzs, L., Temby, P., Pomeroy, D., Schlesewsky, M., et al. (2022). Task-related, intrinsic oscillatory and aperiodic neural activity predict performance in naturalistic team-based training scenarios. Sci. Rep. 12, 16172. doi:10.1038/s41598-022-20704-8
Cuomo, G. (2025). Integrating sensory-motor and social dynamics: multisensory processing and social factors in interpersonal interactions.
Farooq, R., and Bashir, M. (2023). Moderating role of collaborative technologies on the relationship between virtual knowledge sharing and team effectiveness: lessons from covid-19. Glob. Knowl. Mem. Commun. 74, 753–776. doi:10.1108/gkmc-03-2023-0110
Gillath, O., McCall, C., Shaver, P. R., and Blascovich, J. (2008). What can virtual reality teach us about prosocial tendencies in real and virtual environments? Media Psychol. 11, 259–282. doi:10.1080/15213260801906489
Gramfort, A., Luessi, M., Larson, E., Engemann, D. A., Strohmeier, D., Brodbeck, C., et al. (2013). MEG and EEG data analysis with MNE-Python. Front. Neurosci. 7, 267. doi:10.3389/fnins.2013.00267
Gumilar, I., Barde, A., Hayati, A. F., Billinghurst, M., Lee, G., Momin, A., et al. (2021a). “Connecting the brains via virtual eyes: eye-gaze directions and inter-brain synchrony in VR,” in Extended abstracts of the 2021 CHI conference on human factors in computing systems (New York, NY, USA: Association for Computing Machinery), 350. 1–7.
Gumilar, I., Barde, A., Sasikumar, P., Billinghurst, M., Hayati, A. F., Lee, G., et al. (2022). “Inter-brain synchrony and eye gaze direction during collaboration in vr,” in CHI conference on human factors in computing systems extended abstracts, 1–7.
Gumilar, I., Sareen, E., Bell, R., Stone, A., Hayati, A., Mao, J., et al. (2021b). A comparative study on inter-brain synchrony in real and virtual environments using hyperscanning. Comput. & Graph. 94, 62–75. doi:10.1016/j.cag.2020.10.003
Gumilar, I., Sareen, E., Bell, R., Stone, A., Hayati, A., Mao, J., et al. (2021c). A comparative study on inter-brain synchrony in real and virtual environments using hyperscanning. Comput. & Graph. 94, 62–75. doi:10.1016/j.cag.2020.10.003
Gupta, K., Lee, G. A., and Billinghurst, M. (2016). Do you see what i see? the effect of gaze tracking on task space remote collaboration. IEEE Trans. Vis. Comput. Graph. 22, 2413–2422. doi:10.1109/tvcg.2016.2593778
Hadnett-Hunter, J., O’Neill, E., and Proulx, M. J. (2022). Contributed session ii: visual search in virtual reality (vsvr): a visual search toolbox for virtual reality. J. Vis. 22, 19. doi:10.1167/jov.22.3.19
Hajika, R., Gupta, K., Sasikumar, P., and Pai, Y. S. (2019). Hyperdrum: interactive synchronous drumming in virtual reality using everyday objects, 15–16.
Haresign, I. M., Phillips, E., Whitehorn, M., Goupil, L., Noreika, V., Leong, V., et al. (2022). Measuring the temporal dynamics of inter-personal neural entrainment in continuous child-adult eeg hyperscanning data. Dev. Cogn. Neurosci. 54, 101093. doi:10.1016/j.dcn.2022.101093
Hu, Y., Hu, Y., Li, X., Pan, Y., and Cheng, X. (2017). Brain-to-brain synchronization across two persons predicts mutual prosociality. Soc. cognitive Affect. Neurosci. 12, 1835–1844. doi:10.1093/scan/nsx118
Jackson, C. (1953). Visual factors in auditory localization. Q. J. Exp. Psychol. 5, 52–65. doi:10.1080/17470215308416626
Jammalamadaka, S. R., and Sengupta, A. (2001). Topics in circular statistics Singapore: world scientific.
Jas, M., Engemann, D. A., Bekhti, Y., Raimondo, F., and Gramfort, A. (2017). Autoreject: automated artifact rejection for MEG and EEG data. NeuroImage 159, 417–429. doi:10.1016/j.neuroimage.2017.06.030
Kaiser, J., and Lutzenberger, W. (2003). Induced gamma-band activity and human brain function. Neurosci. 9, 475–484. doi:10.1177/1073858403259137
Khalil, A., Musacchia, G., and Iversen, J. R. (2022). It takes two: interpersonal neural synchrony is increased after musical interaction. Brain Sci. 12, 409. doi:10.3390/brainsci12030409
Krishna, A. (2012). An integrative review of sensory marketing: engaging the senses to affect perception, judgment and behavior. J. consumer Psychol. 22, 332–351. doi:10.1016/j.jcps.2011.08.003
Lachat, F., George, N., Lemaréchal, J. D., and Conty, L. (2012). Oscillatory brain correlates of live joint attention: a dual-eeg study. Front. Hum. Neurosci. 6, 156. doi:10.3389/fnhum.2012.00156
Lachaux, J.-P., Rodriguez, E., Martinerie, J., and Varela, F. J. (1999). Measuring phase synchrony in brain signals. Hum. brain Mapp. 8, 194–208. doi:10.1002/(sici)1097-0193(1999)8:4<194::aid-hbm4>3.0.co;2-c
Latini, A., Di Loreto, S., Di Giuseppe, E., D’Orazio, M., Di Perna, C., Lori, V., et al. (2022). “Assessing people’s efficiency in workplaces by coupling immersive environments and virtual sounds,” in International conference on sustainability in energy and buildings (Springer), 120–129.
Lee, D., Jaques, N., Kew, C., Wu, J., Eck, D., Schuurmans, D., et al. (2021). Joint attention for multi-agent coordination and social learning. arXiv preprint arXiv:2104.07750.
Liebherr, M., Corcoran, A. W., Alday, P. M., Coussens, S., Bellan, V., Howlett, C. A., et al. (2021). Eeg and behavioral correlates of attentional processing while walking and navigating naturalistic environments. Sci. Rep. 11, 22325. doi:10.1038/s41598-021-01772-8
Luft, C. D. B., Zioga, I., Giannopoulos, A., Di Bona, G., Binetti, N., Civilini, A., et al. (2022). Social synchronization of brain activity increases during eye-contact. Commun. Biol. 5, 412. doi:10.1038/s42003-022-03352-6
Mendoza-Armenta, A. A., Blanco-Téllez, P., García-Alcántar, A. G., Ceballos-González, I., Hernández-Mustieles, M. A., Ramírez-Mendoza, R. A., et al. (2024). Implementation of a real-time brain-to-brain synchrony estimation algorithm for neuroeducation applications. Sensors 24, 1776. doi:10.3390/s24061776
Montague, P., Berns, G. S., Cohen, J. D., McClure, S. M., Pagnoni, G., Dhamala, M., et al. (2002). Hyperscanning: simultaneous fmri during linked social interactions. NeuroImage 16, 1159–1164. doi:10.1006/nimg.2002.1150
Mu, Y., Cerritos, C., and Khan, F. (2018). Neural mechanisms underlying interpersonal coordination: a review of hyperscanning research. Soc. Personality Psychol. Compass 12, e12421. doi:10.1111/spc3.12421
Ogawa, Y., and Shimada, S. (2023). Inter-subject eeg synchronization during a cooperative motor task in a shared mixed-reality environment. Virtual Worlds (MDPI) 2, 129–143. doi:10.3390/virtualworlds2020008
Pan, Z., Wang, Z., Zhou, X., Zhao, L., Hu, D., and Wang, Y. (2024). Exploring collaborative design behavior in virtual reality based on inter-brain synchrony. Int. J. Human–Computer Interact. 40, 8340–8359. doi:10.1080/10447318.2023.2279419
Park, J., Shin, J., and Jeong, J. (2022). Inter-brain synchrony levels according to task execution modes and difficulty levels: an fnirs/gsr study. IEEE Trans. Neural Syst. Rehabilitation Eng. 30, 194–204. doi:10.1109/tnsre.2022.3144168
Pérez, A., Carreiras, M., and Duñabeitia, J. A. (2017). Brain-to-brain entrainment: eeg interbrain synchronization while speaking and listening. Sci. Rep. 7, 4190. doi:10.1038/s41598-017-04464-4
Peterson, M. S., Kramer, A. F., Wang, R. F., Irwin, D. E., and McCarley, J. S. (2001). Visual search has memory. Psychol. Sci. 12, 287–292. doi:10.1111/1467-9280.00353
Postle, B. R. (2021). Cognitive neuroscience of visual working memory. Work. Mem. State Sci., 333–357. doi:10.1093/oso/9780198842286.003.0012
Reinero, D. A., Dikker, S., and Van Bavel, J. J. (2021). Inter-brain synchrony in teams predicts collective performance. Soc. cognitive Affect. Neurosci. 16, 43–57. doi:10.1093/scan/nsaa135
Saito, D. N., Tanabe, H. C., Izuma, K., Hayashi, M. J., Morito, Y., Komeda, H., et al. (2010). “stay tuned”: inter-individual neural synchronization during mutual gaze and joint attention. Front. Integr. Neurosci. 4, 127. doi:10.3389/fnint.2010.00127
Samiei, M., and Clark, J. J. (2022). Target features affect visual search, a study of eye fixations. arXiv preprint arXiv:2209.13771. doi:10.48550/arXiv.2209.13771
Santos, T. R. (2023). Visual search. Oxf. Res. Encycl. Psychol. doi:10.1093/acrefore/9780190236557.013.846
Scholkmann, F., Holper, L., Wolf, U., and Wolf, M. (2013). A new methodical approach in neuroscience: assessing inter-personal brain coupling using functional near-infrared imaging (fniri) hyperscanning. Front. Hum. Neurosci. 7, 813. doi:10.3389/fnhum.2013.00813
Schwartz, L., Levy, J., Endevelt-Shapira, Y., Djalovski, A., Hayut, O., Dumas, G., et al. (2022). Technologically-assisted communication attenuates inter-brain synchrony. Neuroimage 264, 119677. doi:10.1016/j.neuroimage.2022.119677
Seijdel, N., Schoffelen, J.-M., Hagoort, P., and Drijvers, L. (2024). Attention drives visual processing and audiovisual integration during multimodal communication. J. Neurosci. 44, e0870232023. doi:10.1523/jneurosci.0870-23.2023
Sherlin, L. H. (2009). “Diagnosing and treating brain function through the use of low resolution brain electromagnetic tomography (loreta),” in Introduction to quantitative EEG and neurofeedback: advanced theory and applications, 83–102.
Szymanski, C., Pesquita, A., Brennan, A. A., Perdikis, D., Enns, J. T., Brick, T. R., et al. (2017). Teams on the same wavelength perform better: inter-brain phase synchronization constitutes a neural substrate for social facilitation. Neuroimage 152, 425–436. doi:10.1016/j.neuroimage.2017.03.013
Takase, R., Boasen, J., and Yokosawa, K. (2019). “Different roles for theta-and alpha-band brain rhythms during sequential memory,” in 2019 41st annual international conference of the IEEE engineering in medicine and biology society (EMBC) (IEEE), 1713–1716.
Tallon-Baudry, C., Bertrand, O., Delpuech, C., and Pernier, J. (1997). Oscillatory γ-band (30–70 hz) activity induced by a visual search task in humans. J. Neurosci. 17, 722–734. doi:10.1523/jneurosci.17-02-00722.1997
Tanrıkulu, Ö. D., Chetverikov, A., and Kristjánsson, Á. (2020). Encoding perceptual ensembles during visual search in peripheral vision. J. Vis. 20, 20. doi:10.1167/jov.20.8.20
Tarr, B., Slater, M., and Cohen, E. (2018). Synchrony and social connection in immersive virtual reality. Sci. Rep. 8, 3693. doi:10.1038/s41598-018-21765-4
Tian, Y., Zhou, H., Zhang, H., and Li, T. (2021). Research on differential brain networks before and after wm training under different frequency band oscillations. Neural Plast. 2021, 6628021–6628112. doi:10.1155/2021/6628021
Toppi, J., Borghini, G., Petti, M., He, E. J., De Giusti, V., He, B., et al. (2016). Investigating cooperative behavior in ecological settings: an eeg hyperscanning study. PloS one 11, e0154236. doi:10.1371/journal.pone.0154236
Veliev, A. (2024). Enhancing team coordination through interpersonal neural synchrony achieved with neurofeedback training. University of Twente. Master’s thesis.
Wikström, V., Saarikivi, K., Falcon, M., Makkonen, T., Martikainen, S., Putkinen, V., et al. (2022). Inter-brain synchronization occurs without physical co-presence during cooperative online gaming. Neuropsychologia 174, 108316. doi:10.1016/j.neuropsychologia.2022.108316
Williams Woolley, A., Richard Hackman, J., Jerde, T. E., Chabris, C. F., Bennett, S. L., and Kosslyn, S. M. (2007). Using brain-based measures to compose teams: how individual capabilities and team collaboration strategies jointly shape performance. Soc. Neurosci. 2, 96–105. doi:10.1080/17470910701363041
Witkin, H. A., Wapner, S., and Leventhal, T. (1952). Sound localization with conflicting visual and auditory cues. J. Exp. Psychol. 43, 58–67. doi:10.1037/h0055889
Won, B.-Y., Forloines, M., Zhou, Z., and Geng, J. J. (2020). Changes in visual cortical processing attenuate singleton distraction during visual search. Cortex 132, 309–321. doi:10.1016/j.cortex.2020.08.025
Xanthidou, O. K., Aburumman, N., and Ben-Abdallah, H. (2023). Collaboration in virtual reality: survey and perspectives.
Yigitbas, E., and Kaltschmidt, C. (2024). Effects of human avatar representation in virtual reality on inter-brain connection. arXiv preprint arXiv:2410, 21894. doi:10.48550/arXiv.2410.21894
You, J., Jung, M., and Kim, K. K. (2024). “Inter brain synchrony in remote ar education: can warming up activities positively impact educational quality?,” in 2024 IEEE international symposium on mixed and augmented reality (ISMAR) (IEEE), 584–593.
Yun, K., Watanabe, K., and Shimojo, S. (2012). Interpersonal body and neural synchronization as a marker of implicit social interaction. Sci. Rep. 2, 959. doi:10.1038/srep00959
Keywords: hyperscanning, brain synchronization, virtual reality, remote collaboration, social neuroscience, social facilitation, EEG, joint attention
Citation: Hayati AF, Barde A, Gumilar I, Momin A, Lee G, Chatburn A and Billinghurst M (2025) Inter-brain synchrony in real-world and virtual reality search tasks using EEG hyperscanning. Front. Virtual Real. 6:1469105. doi: 10.3389/frvir.2025.1469105
Received: 23 July 2024; Accepted: 10 April 2025;
Published: 15 May 2025.
Edited by:
James Harland, RMIT University, AustraliaReviewed by:
Haijun Duan, Shaanxi Normal University, ChinaStefan Marks, Auckland University of Technology, New Zealand
Copyright © 2025 Hayati, Barde, Gumilar, Momin, Lee, Chatburn and Billinghurst. This is an open-access article distributed under the terms of the Creative Commons Attribution License (CC BY). The use, distribution or reproduction in other forums is permitted, provided the original author(s) and the copyright owner(s) are credited and that the original publication in this journal is cited, in accordance with accepted academic practice. No use, distribution or reproduction is permitted which does not comply with these terms.
*Correspondence: Ashkan F. Hayati, YXNoa2FuLmhheWF0aUB1bmlzYS5lZHUuYXU=