 Sammeli Liikkanen1*
 Tero Jalkanen2
 Mika Mäkinen2
 Teppo Huttunen2Reijo Kilpeläinen3Jori Reijula4Jonna Heimonen4Anssi Mäkiniemi1
 Giovanni Gentile5Christopher Eccleston6,7
- 1Orion Corporation, Orion Pharma, R&D, Espoo, Finland
- 2EstiMates Oy, Turku, Finland
- 3Healthware International, Helsinki, Finland
- 4Live Foundation (Live-säätiö sr), Iisalmi, Finland
- 5Newel Health Srl, Salerno, Italy
- 6Department for Health, Centre for Pain Research, University of Bath, Bath, United Kingdom
- 7Department of Experimental-Clinical and Health Psychology, Ghent University, Ghent, Belgium
Introduction: Chronic pain (CP) is a major public health problem. Reliable measurement of movement, activity, and other changes due to chronic pain and its treatment is a challenge in healthcare. Wearable data collected from randomized clinical trials contains potential signals that could be further developed into digital biomarkers.
Methods: In a community clinic setting patients suffering from musculoskeletal disorders with chronic pain used a novel digital therapeutic intervention using virtual reality (Rohkea™ VR Therapy). Movement and clinical assessment data were collected using the sensors in the Oculus Quest. Wearable data were collected during the study interventions (frequent treatment sessions of Rohkea™ VR Therapy). Data were analyzed using exploratory statistical analysis.
Results: In line with the earlier research, participants with chronic pain were able to increase the movement speed of the hand controllers during the intervention. They were also more cautious in moving their head compared to a reference group. Participants were less likely to reach out with their active hand than the reference group. Additionally, those with chronic pain had more difficulties with exercises in which they were required to pick up virtual objects situated lower in the virtual reality environment. Participants were able to increase their range of motion during the intervention. Given the small sample size, the results should be viewed as tentative and supportive of earlier findings from randomized controlled trials.
Discussion/Conclusion: The findings reinforce previous results observed in the randomized controlled trials. That similar findings occur in both a clinical trial and a real-world environment is encouraging and is further support for implementation of a virtual reality intervention in everyday clinical settings.
Introduction
Chronic pain is defined as pain that persists or recurs for 3 months or longer (Treede et al., 2019). It is a common condition, difficult to assess and treat. In 2020, approximately 619 million people globally were affected by low back pain, with projections reaching 843 million by 2050 (GBD 2021 Low Back Pain Collaborators, 2023). These individuals were more likely to have worse health status and to use more healthcare. Chronic pain can also result in structural degeneration, movement impairments, disability, an increased risk of developing more severe diseases (Lin et al., 2023), and is a significant public health issue, increasing healthcare costs and causing substantial personal suffering (Alford et al., 2010; Freburger et al., 2009; Pizzo and Clark, 2012).Although there is no clear consensus regarding the definition of suffering caused by pain, it is evident that chronic pain leads to several negative outcomes impacting the quality of life (Noe-Steinmüller et al., 2024). Furthermore, for some conditions like nonspecific low back pain, chronic pain may be considered a disease in its own right (Treede et al., 2019).
The current gold standard for diagnosing chronic pain is patient self-report (Rahman et al., 2023). However, interoception, the identification of a bodily state and reporting on it, is influenced by multiple psychosocial factors (Boring et al., 2021). Although an objective measure of a subjective experience is not possible, the measurement of behavioural or physiological changes that occur in the context of pain is possible, and can be highly instructive, especially if correlative, stable, and predictive of relevant outcomes. Sometimes, these correlates are all one can measure, if self-report is not possible. A variety of digital solutions include wearable or portable sensors that can provide digital signals which show promise to provide what has become known as a digital biomarker–a stable physiological and/or behavioural correlate of pain. (Boring et al., 2021; Vitali et al., 2023).
Wearable sensors offer significant potential for detecting and monitoring the effects of chronic pain in real-world settings (Vitali et al., 2023). For example, sensing of movement in low back pain has been reported by many studies. Concrete examples include the use of a wearable sensor for monitoring lower back activity (Baijot et al., 2021) and the use of an inertial sensor for classification of low back pain patients (Davoudi et al., 2020). Moreover, the use of multiple sensors is likely to be even more beneficial. For example, Spencer et al. introduces a strain sensor array which can be used to effectively monitor spinal motion for more accurate biomechanical analyses (Spencer et al., 2023), whereas Moon et al. have proposed a sensor cluster for measuring lumbopelvic movements (Moon et al., 2023). It has also been shown that a cost-effective motion-capture sensor data can be used to categorize patients with low or high risk for nonspecific low back pain (Abdollahi et al., 2020). Moreover, a 2-year case report demonstrated that a commercially available smart ring can be used for long-term monitoring of low back pain symptoms (Fonseka et al., 2022). Wearable sensors do not only provide data for the assessment of chronic pain parameters, but they can also be used to predict the treatment response to different therapies. For example, in the case of Spinal Cord Stimulation (SCS), which is a well-established therapy for treating chronic pain, data from wearable devices has been used to predict patient response to SCS therapy (Heros et al., 2023; Patterson D. G. et al., 2023; Patterson D. et al., 2023). Despite the encouraging use cases, it is fair to acknowledge that the role of wearables in healthcare outcomes in chronic disease is not always clear, and demonstration of causality can pose a challenge in some cases (Mattison et al., 2022).
The use of digital signals shows great promise in assessment of chronic pain and its impact. Sensor data can be used to supplement traditional medical interventions which include methods such as spinal injections, surgery, and pharmacological interventions (Freburger et al., 2009). However, traditional treatments are often associated with unwanted or adverse events and are not always effective in treating chronic pain. It is crucial to recognize that the experience of chronic pain patients can be improved through education about pain and its consequences and giving the patients a more active role in managing their own pain (Pizzo and Clark, 2012). Virtual reality (VR)-based treatments offer a cost-effective means to achieve this goal. The use of VR environments in treating chronic pain (Darnall et al., 2020) and more specifically chronic low back pain (Garcia et al., 2021; Eccleston et al., 2022; Liikkanen et al., 2022) has been demonstrated to be effective in controlled trial settings. The patients participating in the VR treatments show improvements compared to the control group on several pain-related outcomes, such as reduced pain intensity (Garcia et al., 2021) and reduced kinesiophobia (Eccleston et al., 2022). Moreover, the use of VR has been linked to increased movement speed which correlated with a self-reported reduction in pain-related fear of movement (Liikkanen et al., 2022). Gröhn et al. reported that movement data gathered from VR environment can also be used for identifying chronic low back pain patients from healthy volunteers (Gröhn et al., 2023). These results suggest that movement data from VR environments gathered under controlled trial settings can be used as digital biomarkers for detecting pain. It is, however, not clear whether the results obtained under controlled trial settings translate into tangible benefits observable in a real-world scenario.
In this study, we explore if similar results are observed in a real-world setting, where participants suffering from musculoskeletal disorders are allowed to use the VR environment at their own pace and time. The aim of the study was to observe how participants use the VR environment in a real-world setting. Based on previous observations under RCT setting, our main hypothesis was that the VR intervention would help participants improve their movement speed. Additionally, the aim was to screen the data for potential signals of pain-related fear of movement that could be used to inform a digital biomarker for chronic pain.
Materials and methods
Study description
This was an open, non-randomized, real-world data study. An immersive virtual reality environment, as described in earlier studies (Eccleston et al., 2022; Liikkanen et al., 2022) was provided to participants with the aim of reducing pain, movement related fear of further pain and reinjury, and reducing disability. The VR environment consisted of a summer cabin, which provided the user access to three types of rehabilitative games. The three game types were 1) picking different objects in a virtual orchard, 2) packaging smaller boxes into a larger box, and 3) following the movements of a slowly moving orb. The study outlined a set of predefined games each participant was suggested to do. Additionally, the participants had the opportunity to engage in additional training in the VR platform based on their personal preferences.
VR pilot study participants were recruited from a larger pool of patients participating in conventional rehabilitation by means of physical therapy or group therapy based on individual need. VR therapy was offered as a supplementary treatment on top of conventional methods. Approximately 20% of the people who were offered the VR treatment option took on the offer. Eleven participants were recruited, all who had pain lasting for 3 months or longer. The participants had a history of musculoskeletal disorders and were mostly recruited through Finnish government sponsored rehabilitation program (TULES). Independent healthcare professionals examined all participants prior to entering the program. All participants were assessed to benefit from participation in a rehabilitation program under an outpatient rehabilitation setting. The TULES rehabilitation program is intended for individuals with properly diagnosed musculoskeletal disorder affecting the back, neck, shoulder or upper/lower limb(s). However, the individual diagnoses of the subjects participating in the VR pilot were not separately recorded as a part of the study data.
Four participants withdrew from the study: one due to nausea, one due to difficulty standing during exercises because of pain, and two citing time constraints related to family and work. The study was conducted in real-world settings, in which participants were allowed to use the VR environment at their own pace and time. The tentative study period suggested for the participants was 12 weeks, but this was not mandated, and participants were allowed to use the equipment for longer. Four participants without chronic pain completed a set of pre-defined tasks in the VR experience to provide an approximate real-world benchmark for the study. The benchmark tasks were completed within 1 day. This reference group consisted of healthy volunteers. Budgetary and project ownership related reasons restricted the possibility of extending the length of training sessions for the reference group to match the 12 weeks provided for the pain group. Due to the feasibility and observational nature of the study design, all participants were instructed to use the VR environment freely to mimic real world usage. Table 1 shows the demographics of the participants for the pain and reference groups. We would like to emphasize that the small number of participants in the current study makes it challenging to draw any definitive conclusions, and ideally confirmatory studies with larger sample sizes will be conducted in the future.
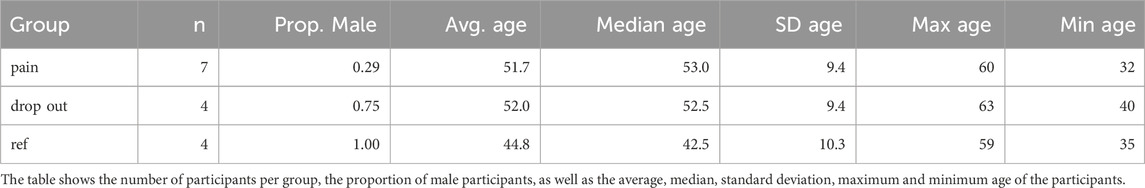
Table 1. Demographics for the study participants for the pain, dropout, and reference groups, respectively.
Statistical methods and data collection
This pilot feasibility study involved an exploratory data analysis, to gather preliminary insights, by exploring trends and patterns in the data. Data analysis was conducted using R version 4.3.2 (R Core Team and R, 2023; Wickham et al., 2019). In addition to base R, ggplot2 (Wickham, 2016), ggpubr (Kassambara, 2023), RColorBrewer (Neuwirth, 2022), and flextable (Gohel and Skintzos, 2025) packages were used in image and table creation. Moreover, readxl (Wickham and Bryan, 2025), lubridate (Grolemund and Wickham, 2011), forcats (Wickham), stringr (Wickham, 2023), dplyr (Wickham et al., 2023), readr (Wickham et al., 2024a), tidyr (Wickham et al., 2024b), and tibble (Müller and Wickham, 2023) packages were used for data analysis.
Statistical tests
Analysis of variance (ANOVA) was used for comparing group means. Standard ANOVA assumptions were verified.
Data collection and processing
Data from the virtual reality environment were collected from the participants using Meta Oculus Quest 2 VR equipment. Most importantly, the data contained the
Movement speeds
A small percentage of the movement sections contained individual outlier observations with very high movement speeds. These outliers were attributed to the VR equipment momentarily losing the reference coordinate value, which resulted in singular unrealistically high movement speeds. These observations were detected by marking any observations more than 10 Median Absolute Deviations (MAD) away from the median speed of the movement section as an outlier. The outliers were smoothed by taking the average speed of the previous and following observations. Moreover, movement sections where the total movement length during the picking motion was less than 0.1 m were excluded from the analysis.
Distance of the hand controller from the headset was calculated via simple vector subtraction for both hands at each time point. For example, given the headset position
The derived datasets for reproducing the results in this study are available as open data (Liikkanen et al., 2025).
Linear regression and Monte Carlo simulations were used for estimating improvements in observed movement speed. Furthermore, standard error of the mean, was calculated from the standard deviation for the fitted slopes by:
where
Questionnaire data
Fear of movement and re-injury
The Tampa Scale of Kinesiophobia (TSK) was used to measure fear of pain and (re)injury on movement (Miller et al., 1991). The questionnaire was completed by the participants at the beginning and at the end of the study. This 17-item measure gives a score from 17 to 68, with higher scores indicating higher fear of pain or (re)injury on movement.
Disability assessment
World Health Organization Disability Assessment Schedule (WHODAS 2.0) was used to measure disability. WHODAS 2.0 is a questionnaire which measures disability in six domains: cognition, mobility, self-care, getting along, life activities, and participation. The questionnaire was completed at the beginning and at the end of the study.
Quality of life
World Health Organization Quality of Life Brief Scale (WHOQOL-BREF) was used to measure the quality of life of the participants. WHOQOL-BREF is a 26-item questionnaire which measures the quality of life in four domains: physical health, psychological health, social relationships, and environment. The questionnaire was completed at the beginning and at the end of the study. The WHOQOL-BREF score ranges from 0 to 100, with higher scores indicating better quality of life.
Ethical approval
This study was performed as commercial pilot in real world settings, and thus no ethical approval was obtained. Participants gave their consent to participate.
Results
The data analysis focused on the picking game, where the participants gathered mushrooms, raspberries and apples in an orchard. Exploratory data analysis revealed that the data gathered from the other two activities was challenging to analyze in a meaningful way. The number of participants and the number of unique picking events recorded per group is listed in Table 2. The control group conducted all the VR assignments within a 1-day session, whereas those with chronic pain had the opportunity to use the VR equipment at home without a predefined schedule.
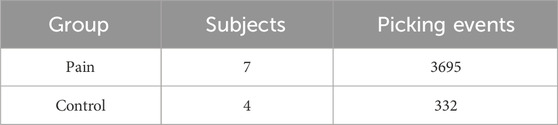
Table 2. The number of participants by group, and the amount of unique picking events analyzed.
As the control group conducted all the VR assignments within 1 day, it is challenging to assess how the performance of these subjects developed over time. However, for the pain group, we can explore how the participants adapted to the VR environment over time. One simple measure for assessing how comfortable they were in using the VR equipment is to calculate how evenly they use their hands. The active hand controller (left/right), i.e., which hand was used to grab and release an object in the VR environment, is recorded as a metadata tag in the data. Figure 1 shows the calculated proportion of picking movements conducted with the right-hand controller for each distinct study day. All participants used their right hand more during the first few days, and most started to use their hands more evenly as the study progressed. Information regarding the participants’ dominant hand was not recorded.
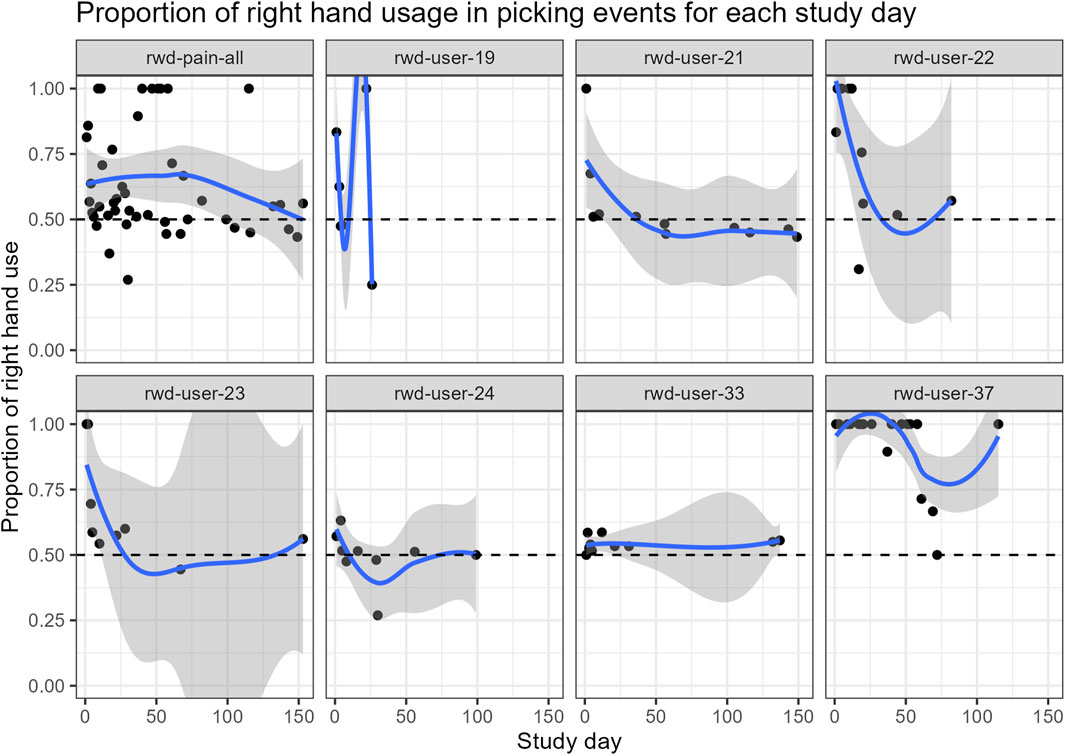
Figure 1. Proportion of picking movements conducted with the right-hand controller was calculated for each study day for the subjects in the pain group. The line is fitted with local regression (LOESS) and is only intended to guide the eye. The panel on the top left shows the pooled data for all pain subjects.
Active hand speed
The speed of the active picking hand was calculated for each time point using Equation 1. The average speed of the active hand for each picking event was calculated for each participant. In order to compare each individual starting level, the mean picking speed from exercises performed on the first study day were compared to the performance of the reference group. Figure 2 shows a comparison between the groups for the mean speed of picking events recorded during the first study day.
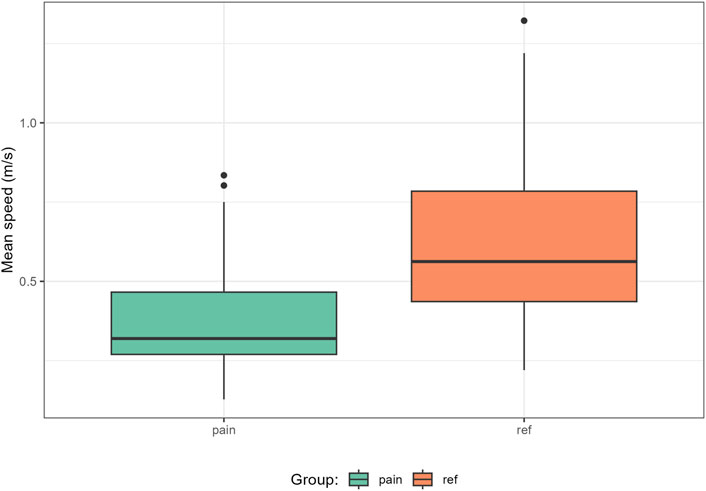
Figure 2. Mean movement speed of the active hand for each picking event for the pain subjects and the reference group during day 1.
From Figure 2 we can see that there is a clear difference in the mean picking speed of the active hand between the two groups. The reference participants are faster on average. However, we want to ensure that this is not caused by certain individuals only. Table 3 shows the nested ANOVA results for the average movement speeds of the groups on day 1, where the participants are included as a nested factor inside the two distinct groups. The results suggest that the difference in the average movement speeds is affected by both the user and the group they belong to.
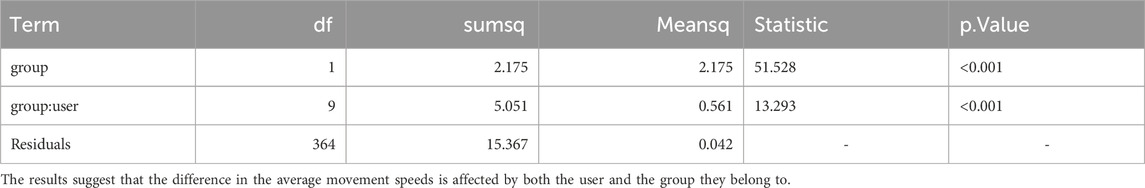
Table 3. Nested ANOVA results for factors contributing to the average movement speeds of the active hand on day 1.
In the beginning the pain group was slower than the reference group. We were interested to discover if the VR intervention influences the movement speed. Figure 3 displays the mean movement speed of the active hand for each picking event for the pain participants during the study as a function of study day. One notable observation is that the data are sparse. Most participants have large gaps in between exercise days, which underlines the real-world study setting. Moreover, the general level of mean speed values for the active hand differs somewhat between individuals. Part of the sparseness is attributable to the option participants had within the experience to undertake activities other than picking.
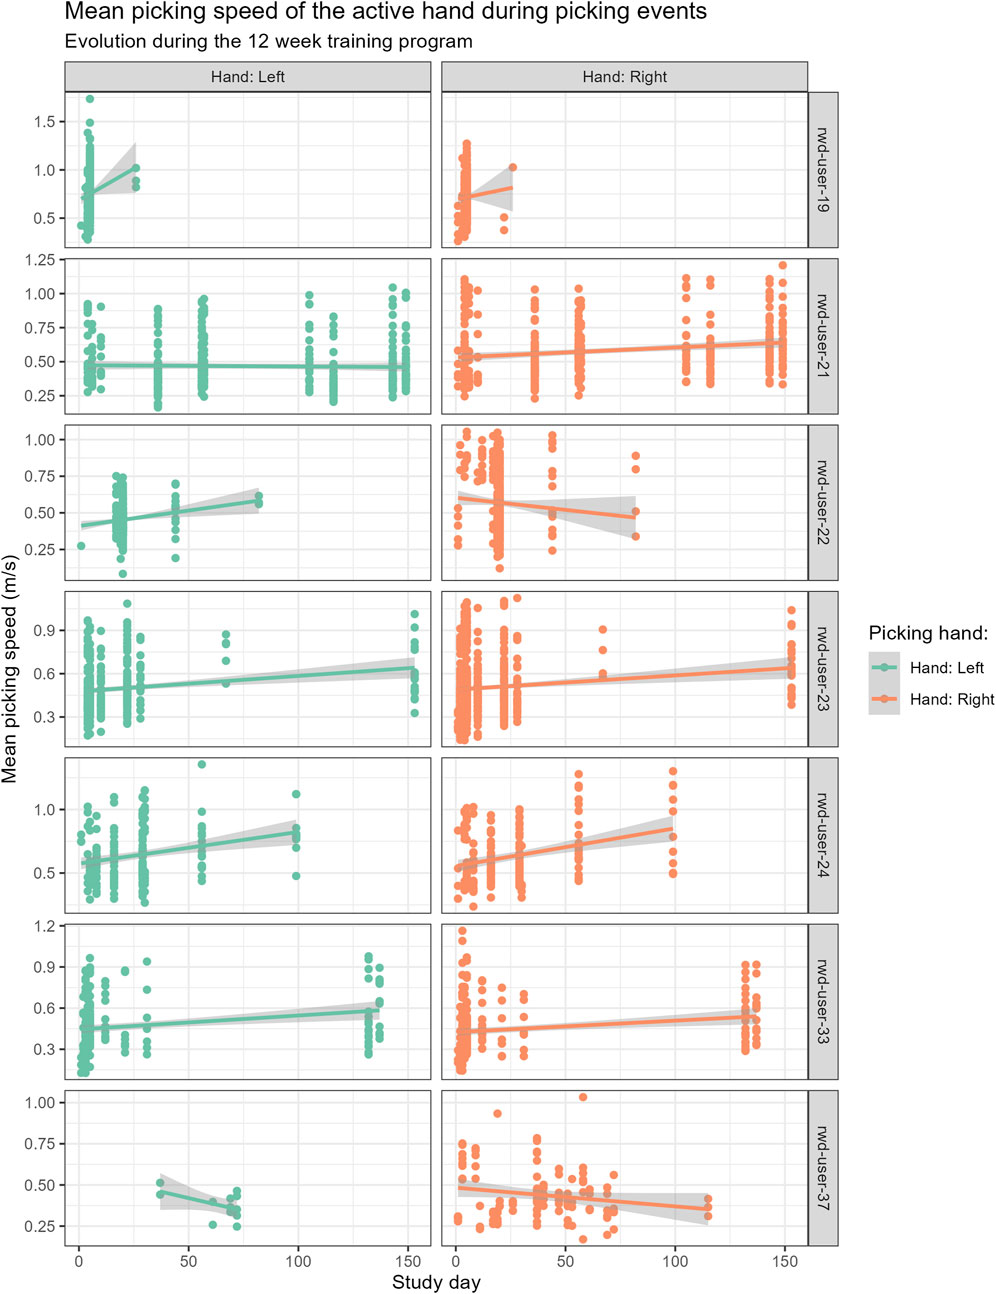
Figure 3. Mean movement speed of the active hand for each picking event for the pain subjects during the study. Linear regression line was fitted to the observations to visualize the trend.
The sparseness of the data makes it more challenging to evaluate the progress individuals might be making during the study. To assess the expected evolution of active hand speed during the VR intervention we decided to combine observations from different participants. To do this we first normalized the data per individual to span values from 0 to 1. Additionally, to mimic the randomness involved in recruitment a Monte Carlo simulation was devised. At each simulation round four pain participants were chosen at random. The mean active hand speeds for the selected participants were pooled together and a bootstrap sample of 1001 observations was drawn from the pooled data. In total 3000 simulations were run this way, and the slope of the linear regression fit of the normalized data was recorded for each bootstrap sample. This allowed us to simulate the randomness caused by the patient population sample and the random differences between individual picking events. In essence, this allowed us to create a digital twin of the study population.
Figure 4 shows a distribution of the simulated slopes fitted to the normalized mean speed data. A positive slope value indicates that the participants can increase the movement speed of their active hand during the study, and we can see that the majority of the simulated slopes are positive. From the Monte Carlo simulations we can estimate the mean and standard error for the slope of the active hand speed during the program.
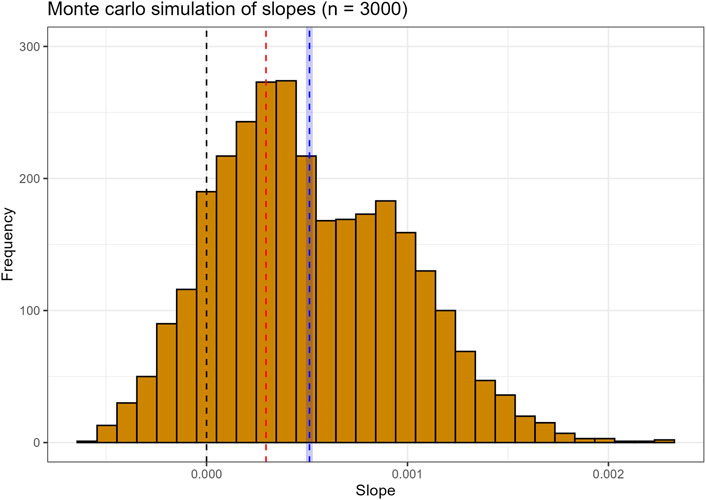
Figure 4. Monte Carlo simulation of slopes fitted to bootstrapped samples from normalized mean speed data. The red dashed line is the slope value of a linear model fitted to all normalized observations. The blue dashed line is the mean of the simulated slopes, and the blue shaded area shows the 95% confidence intervals for the estimated mean slope.
We can calculate the confidence interval for the average Monte Carlo estimate for the slopes fitted to the normalized mean speed data using Equation 3. Looking at Figure 4 we can see that the Monte Carlo estimate for the slope is considerably larger than the point estimate we get from fitting to all normalized mean speed observations. This supports the notion that all participants do not exhibit comparable performance, and individual outcomes can vary.
The Monte Carlo estimate for the normalized data is quite abstract. To get something more tangible we can easily calculate the estimated speed improvement of the active hand during the 12-week intervention. In order to do this, we need to convert the normalized speeds back to the original scale. Since the speeds were normalized per individual and the data were pooled, it makes little sense to calculate the speed improvements for each study participant. Instead, we calculate the speed improvement for a hypothetical person with average movement speeds ranging from 0.15 m/s to 1.1 m/s. The estimated slope on the non-normalized scale is expressed as:
where
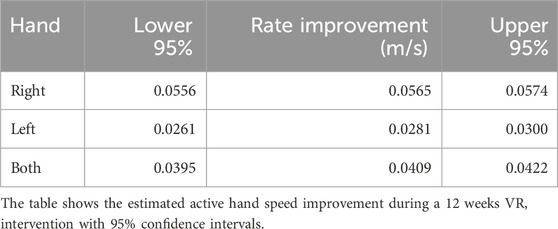
Table 4. Monte Carlo estimates for a hypothetical subject with average speeds ranging from 0.15 m/s to 1.1 m/s.
Pain related movement differences
Expecting or experiencing pain alters the way a person moves (Kantak et al., 2022). People tend to minimize or avoid movements which are thought to cause or exacerbate pain. This leads to reduced movement trajectories (Gizzi et al., 2019). Previous studies have shown that people with chronic low back pain showed a strong correlation between headset movements and clinical endpoints related to fear of movement, overall health, and quality of life (Liikkanen et al., 2022). To examine if similar signs can be found from real-world data, we compared the headset speeds between the two groups. Figure 5 shows the mean headset speeds for the participants and the reference group.
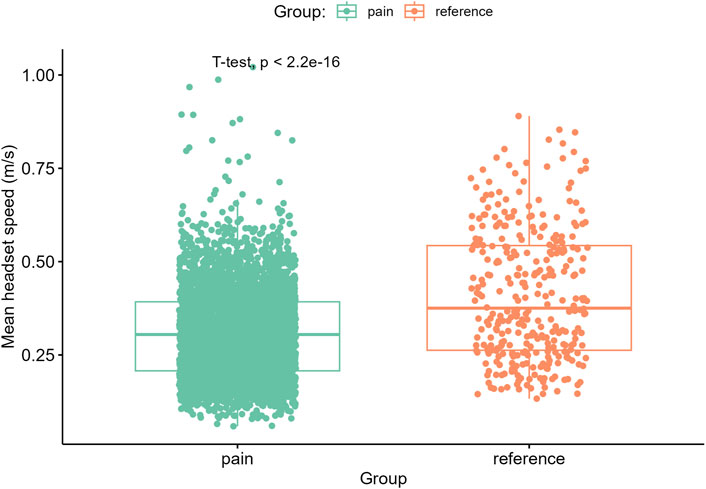
Figure 5. Mean movement speeds of the headset for each picking event during picking of objects.
The results suggest that the pain group move their head more slowly on average than the reference group. This is consistent with the idea that subjects with chronic pain avoid movement. Table 5 shows the nested ANOVA results for the mean head speeds where the participants are nested within the group. The results further support the notion that the difference in the mean head speeds is affected by both the user and the group they belong to.
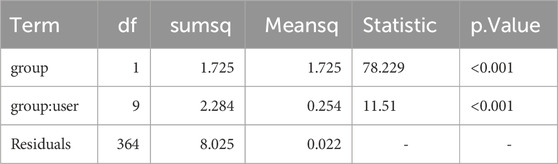
Table 5. Nested ANOVA results for the mean head speeds of the subjects in two groups during day 1.
The height of the object to be picked can affect the picking speed. It was hypothesized that fear of pain and (re)injury in chronic musculoskeletal pain will make it more difficult to pick up objects which are situated in the lower quadrant of space, out of reach of upper body movement and so requires forward spinal flexion to achieve. In other words, in order to pick mushrooms, one has to bend. Figure 6 illustrates the height distributions of different objects within the VR environment.
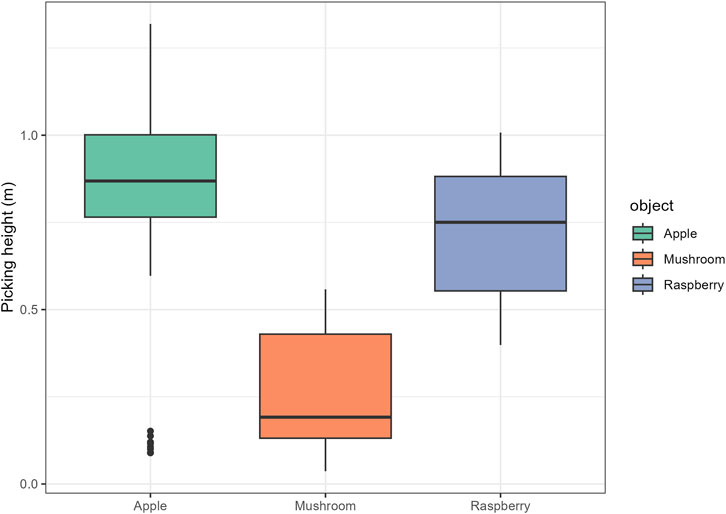
Figure 6. Distribution of picking heights for different objects.
Figure 7 shows the picking speed of the mushrooms by group. Mushrooms were the only object within the picking exercise which exhibited a statistically significant difference in the average speed of the active hand between the groups. As expected, participants with chronic pain were slower in picking up the mushrooms.
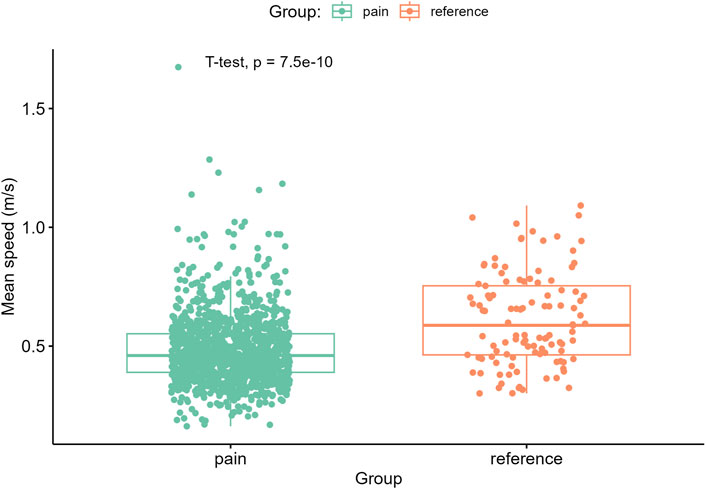
Figure 7. The mean speed of the active hand during picking of Mushrooms. Unlike with Apples and Raspberries, which are located higher up, there was a statistically significant difference between the groups.
Finally, we wanted to investigate the range of motion during the VR intervention. To this end, the distance between the hand controllers and the headset were calculated according to Equation 2. Figure 8 shows the mean distances between the hand controllers and the headset for the active and passive hand. The length of a person’s outstretched arms is roughly correlated to their height. Unfortunately, the height of the participants was not recorded, which makes it challenging to account for it. However, based on the results of passive hand distance from the headset it seems that the groups are approximately equal in this regard, which allows for comparison. Moreover, there is an interesting difference in the distance of the active hand. Those with pain do not reach out as far as the reference group.
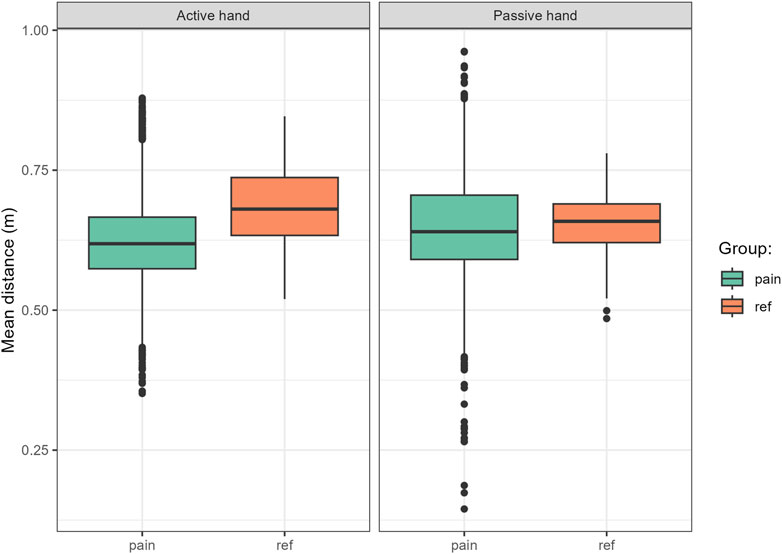
Figure 8. Mean distances between the hand controllers and the headset for the active and passive hand.
It is not surprising that the participants in the pain group do not exhibit the same range of motion as the reference group. However, it is interesting to see if those in the pain group are able to increase their range of motion during the study. We can estimate this by using a similar Monte Carlo approach as we did with the active hand speed. We again normalize the results per subject to span from 0 to 1 and repeat the same sampling procedure. The results of the Monte Carlo simulation are shown in Figure 9.
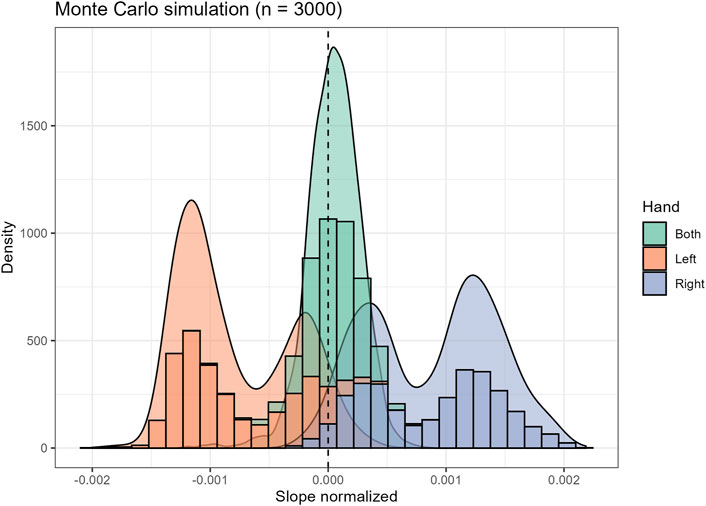
Figure 9. Monte Carlo simulation estimating the slope of the linear regression fit of the normalized distance of the active hand controller from the headset as a function of study days. A positive slope indicates an increased range of motion during the study.
There is an observable difference in improvement when the picking motion has been performed with the right hand. Based on Figure 1 it seems most if not all participants are right-handed. At least none of the subjects dominantly uses their left hand. There is an interesting contrast when we look at the left-hand results from Figure 9. Here it seems that the range of motion has decreased. It should be noted that participants are able to move freely within the VR environment, which allows them to pick up maximum of two items simultaneously. It is therefore plausible that as they get more comfortable with the VR environment, they start to use both hands more often. This could partly explain the decrease in the range of motion for the left hand.
We can calculate speculative improvements in hand to headset distance for a hypothetical user by using the converted slope estimates. The range of motion improvements for this synthetic patient with minimum and maximum recorded reach distance from 0.45 m to 0.8 m are shown in Table 6. Subtle improvements in the range of motion can be seen for the active hand in general.
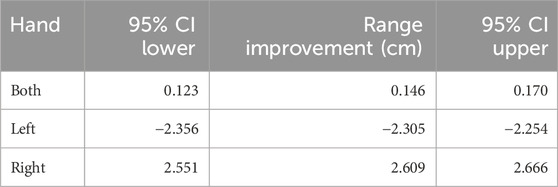
Table 6. Estimated change in range of motion for the active hand during 12 weeks VR intervention for a synthetic patient with minimum and maximum recorded distances of 0.45 m and 0.8 m between the headset and the active hand.
Self-report questionnaires
The improvement during the intervention was estimated using three questionnaires. The change during the study according to the WHOQOL-BREF is presented in Table 7. Table 8 shows the change in the Tampa Scale of Kinesiophobia and WHODAS disability assessment during the study. For TSK, a negative change indicates a reduction in the fear of movement and re-injury. Figure 10 shows a visual representation of the questionnaire data, with the calculated average improvements.
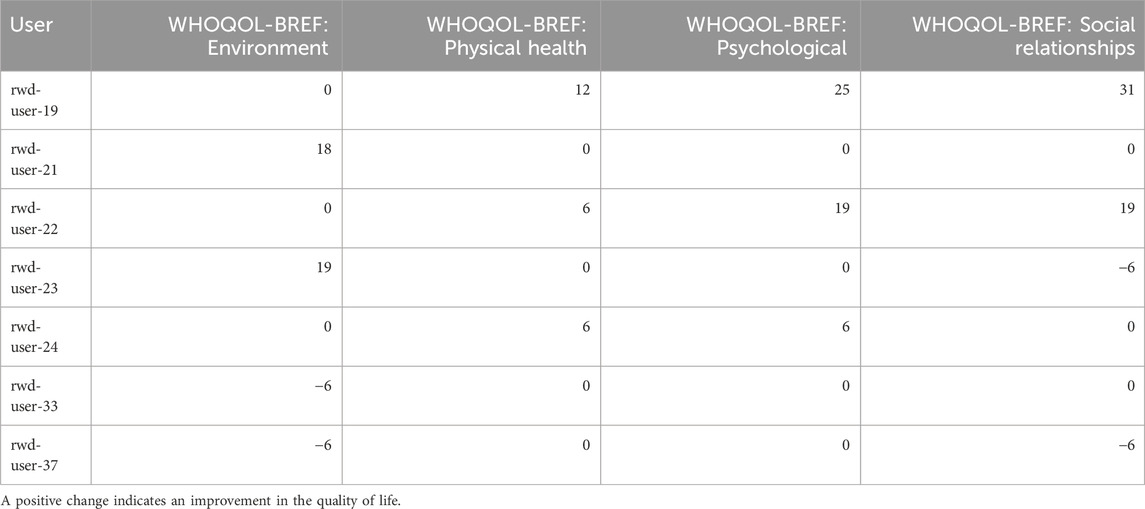
Table 7. Individual patient change scores in the WHOQOL-BREF self-assessment questionnaires during the study.
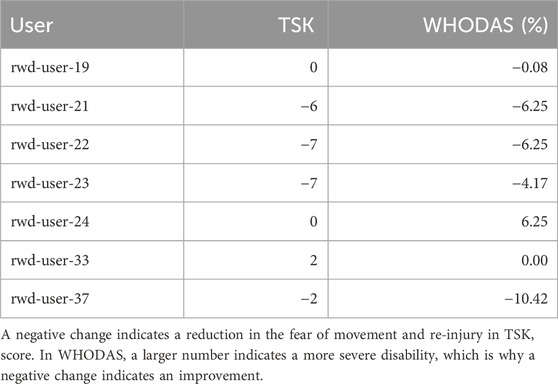
Table 8. Change in the TSK and WHODAS self-assessment questionnaires during the study.
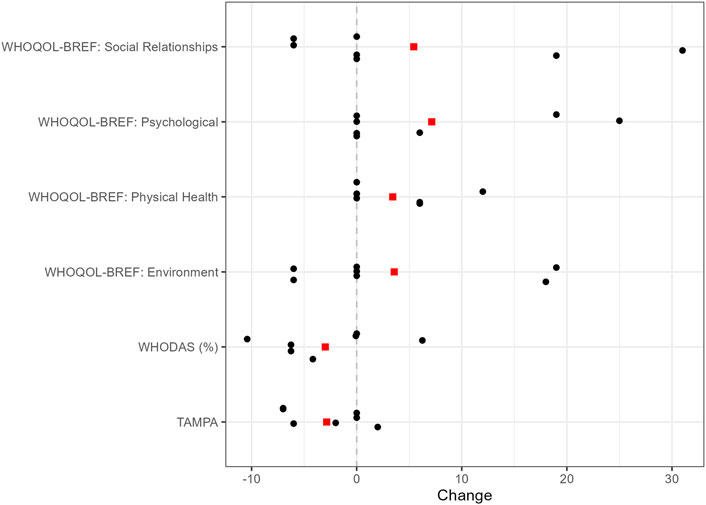
Figure 10. Visual representation of the questionnaire data. The red squares show the reported average change in each category.
Looking at Tables 7, 8 we can see that four of those in the pain group showed overall improvements in the fear of movement and re-injury, two showed no change and one worsened. Except for two people the level of disability decreased during the study for most subjects. Figure 10 displays how the average score has improved in all categories.
Discussion
In a Real World Evidence (RWE) observatory study of participants we found that those with chronic pain showed micro-avoidance movement patterns compared to those without in their experience of the VR intervention. Specifically, they moved their head less often and in a narrower range of motion and were less likely to reach out with their active hand than the reference group. Further, as expected they were slower to reach for objects in the virtual environment placed at a height that required forward spinal flexion (bending). However, participants were able to increase their range of motion after the intervention and were able to increase the movement speed of the hand controllers during the intervention. The observed improvement in movement speed supports previous reports conducted under a clinical trial setting (Liikkanen et al., 2022).
Table 1 shows a difference in the female to male (F/M) ratio between the groups. The study group started with the 11 participants (including dropouts) out of which 6 were females, whereas the reference group consisted entirely of males. Ideally the F/M ratio would be roughly the same. However, due to budgetary restrictions this was not possible. Roivainen et al. have reported that in a group of Finnish outpatients, where 87% of the patients suffered from musculoskeletal disorders, no statistically significant difference was observed in the Grooved Pegboard Test, which measures fine motor speed (Roivanen et al., 2021). This was in contrast to the gender difference found in the general population (Roivanen et al., 2021). Given the similarities between the participants in this study, we might expect that perhaps gender does not significantly affect the picking speed trends observed in this study. Nevertheless, we suggest that gender is more carefully accounted for in future studies.
While statistical analyses were conducted, the small sample size limits the significance of the findings, which should be interpreted as observational data. Further, this was undertaken in a RWE context which led to inevitable research performance problems. For example, the structure of the gathered data is not as complete as it would be for a randomized controlled trial (RCT). The study also lacks a comparator treatment group, which makes it challenging to assess any absolute effectiveness of the VR intervention. However, that the benefits of a VR intervention have been shown under RCT settings in previous studies (Garcia et al., 2021; Eccleston et al., 2022; Liikkanen et al., 2022), and the observation made in the current study are supportive of these earlier findings. The RWE settings also increase the risk for observing something akin to the survivorship bias, where participants who do not judge the VR intervention to be helpful stop doing the exercises early on. This could lead to an overestimation of the effectiveness of the VR intervention. Although the sample size is small, the wearable data generated are rich and plentiful. Still, more research with larger samples is required now that the candidate biomarkers have been identified. Active controller speed, speed of the headset, a combination of these two, and hand/headset distance are good candidate digital biomarkers that can be taken into implementation in larger studies of both the natural progression of disease, and of treatment mechanism.
Conclusion
Restrictions in movement, best explained by micro-avoidances due to fear of pain and re-injury are a promising biomarker of chronic musculoskeletal pain. In particular, a narrow range of motion of head and neck movements, and a reduction in reach movements are very promising candidates for stable biomarkers of biomechanical inefficiencies known to be significant risk factors of disability in chronic low back pain. Further, placing objects in a lower spatial quadrant that requires spinal flexion produces as large marker of avoidance. Further, this Real-World Extension of a Virtual Reality intervention for chronic pain supports earlier evidence to the efficacy of an intervention aimed at promoting engagement with feared movement to reduce disability. The results suggest that previous results from controlled clinical trials extend beyond the clinical setting. Further studies are needed to confirm the validity of the proposed biomarkers under a more controlled study setting.
Data availability statement
The original contributions presented in the study are publicly available. This data can be found here: Liikkanen et al. (2025), https://data.mendeley.com/datasets/vdz5j9nfmk/1.
Ethics statement
Ethical approval was not required for the studies involving humans because In Finland this kind of study can not seek for approval from ethical committee (not within the scope). The studies were conducted in accordance with the local legislation and institutional requirements. The participants provided their written informed consent to participate in this study.
Author contributions
SL: Writing – review and editing, Writing – original draft. TJ: Writing – review and editing, Writing – original draft. MM: Writing – original draft, Writing – review and editing. TH: Writing – original draft, Writing – review and editing. RK: Writing – review and editing, Writing – original draft. JR: Writing – review and editing, Writing – original draft. JH: Writing – review and editing, Writing – original draft. AM: Writing – review and editing, Writing – original draft. GG: Writing – review and editing, Writing – original draft. CE: Writing – review and editing, Writing – original draft.
Funding
The author(s) declare that financial support was received for the research and/or publication of this article. The study was funded by Orion Corporation Orion Pharma. Orion has received financial support from Business Finland to this study. Live Foundation has received financial support from Sitra to this study.
Acknowledgments
The authors would like to thank those brave individuals suffering from chronic pain who participated in this study as participants. We would like to also thank the staff of The Live Foundation to make this study possible. All authors confirm that this manuscript is a transparent and honest account of the reported research. This research is related to a previous study by the same authors titled “Body movement as a biomarker for use in chronic pain rehabilitation: An embedded analysis of an RCT of a virtual reality solution for adults with chronic pain.” The previous study was performed as a randomized clinical trial (https://clinicaltrials.gov/study/NCT04225884?term=virpi&rank=1) whereas the current submission is focusing on patients in a regular healthcare process. This study is following the methodology of open, non-randomized, real-world data study.
Conflict of interest
Authors SL and AM were employed by Orion Corporation.
Authors TJ, MM, and TH were employed by EstiMates Oy.
Author RK was employed by Healthware International.
Author GG was employed by Newel Health Srl.
Author CE received fee for consultation from Orion Corporation.
The authors declare that this study received funding from Orion Corporation Orion Pharma. The funder had the following involvement in the study: in the study design, analysis, interpretation of data, the writing of this article, and the decision to submit it for publication.
Generative AI statement
The author(s) declare that no Generative AI was used in the creation of this manuscript.
Publisher’s note
All claims expressed in this article are solely those of the authors and do not necessarily represent those of their affiliated organizations, or those of the publisher, the editors and the reviewers. Any product that may be evaluated in this article, or claim that may be made by its manufacturer, is not guaranteed or endorsed by the publisher.
References
Abdollahi, M., Ashouri, S., Abedi, M., Azadeh-Fard, N., Parnianpour, M., Khalaf, K., et al. (2020). Using a motion sensor to categorize nonspecific low back pain patients: a machine learning approach. Sensors 20, 3600–3616. doi:10.3390/s20123600
Alford, D. P., Krebs, E. E., Chen, I. A., Nicolaidis, C., Bair, M. J., and Liebschutz, J. (2010). Update in pain medicine. J. Gen. Intern Med. 25, 1222–1226. doi:10.1007/s11606-010-1452-4
Baijot, M., Puers, R., and Kraft, M. (2021). Monitoring lower back activity in daily life using small unintrusive sensors and wearable electronics in the context of rheumatic and musculoskeletal diseases. Sensors 21, 6362–19. doi:10.3390/s21196362
Boring, B. L., Walsh, K. T., Nanavaty, N., Ng, B. W., and Mathur, V. A. (2021). How and why patient concerns influence pain reporting: a qualitative analysis of personal accounts and perceptions of others' use of numerical pain scales. Front. Psychol. 12, 663890–14. doi:10.3389/fpsyg.2021.663890
Darnall, B. D., Krishnamurthy, P., Tsuei, J., and Minor, J. D. (2020). Self-administered skills-based virtual reality intervention for chronic pain: randomized controlled pilot study. JMIR Form. Res. 4, e17293–19. doi:10.2196/17293
Davoudi, M., Shokouhyan, S. M., Abedi, M., Meftahi, N., Rahimi, A., Rashedi, E., et al. (2020). A practical sensor-based methodology for the quantitative assessment and classification of chronic non specific low back patients (NSLBP) in clinical settings. Sensors 20, 2902–2917. doi:10.3390/s20102902
Eccleston, C., Fisher, E., Liikkanen, S., Sarapohja, T., Stenfors, C., Jääskeläinen, S. K., et al. (2022). A prospective, double-blind, pilot, randomized, controlled trial of an “embodied” virtual reality intervention for adults with low back pain. PAIN 163, 1700–1715. doi:10.1097/j.pain.0000000000002617
Fonseka, R. D., Natarajan, P., Maharaj, M. M., Rooke, K., and Mobbs, R. J. (2022). Two-year continuous data capture using a wearable sensor to remotely monitor the surgical spine patient: a case report. J. Spine Surg. 8, 170–179. doi:10.21037/jss-21-89
Freburger, J. K., Holmes, G. M., Agans, R. P., Jackman, A. M., Darter, J. D., Wallace, A. S., et al. (2009). The rising prevalence of chronic low back pain. Arch. Intern Med. 169, 251–258. doi:10.1001/archinternmed.2008.543
Garcia, L. M., Birckhead, B. J., Krishnamurthy, P., Sackman, J., Mackey, I. G., Louis, R. G., et al. (2021). An 8-week self-administered at-home behavioral skills-based virtual reality program for chronic low back pain: double-blind, randomized, placebo-controlled trial conducted during COVID-19. J. Med. Internet Res. 23, e26292–25. doi:10.2196/26292
GBD 2021 Low Back Pain Collaborators (2023). Global, regional, and national burden of low back pain, 1990-2020, its attributable risk factors, and projections to 2050: a systematic analysis of the Global Burden of Disease Study 2021. Lancet Rheumatology 5, e316–e329. doi:10.1016/s2665-9913(23)00098-x
Gizzi, L., Röhrle, O., Petzke, F., and Falla, D. (2019). People with low back pain show reduced movement complexity during their most active daily tasks. Eur. J. Pain 23, 410–418. doi:10.1002/ejp.1318
Gröhn, T., Liikkanen, S., Huttunen, T., Mäkinen, M., Liljeberg, P., and Marttinen, P. (2023). Quantifying movement behavior of chronic low back pain patients in virtual reality. ACM Trans. Comput. Healthc. 4, 1–24. doi:10.1145/3582487
Grolemund, G., and Wickham, H. (2011). Dates and times made easy withlubridate. J. Stat. Softw. 40, 1–25. doi:10.18637/jss.v040.i03
Heros, R., Patterson, D., Huygen, F., Skaribas, I., Schultz, D., Wilson, D., et al. (2023). Objective wearable measures and subjective questionnaires for predicting response to neurostimulation in people with chronic pain. Bioelectron. Med. 9, 13. doi:10.1186/s42234-023-00115-4
Kantak, S. S., Johnson, T., and Zarzycki, R. (2022). Linking pain and motor control: conceptualization of movement deficits in patients with painful conditions. Phys. Ther. and Rehabilitation J. 102, pzab289–15. doi:10.1093/ptj/pzab289
Liikkanen, S., Jalkanen, T., Mäkinen, M., Huttunen, T., Kilpeläinen, R., Reijula, J., et al. (2025). Body movement as a digital biomarker in chronic pain rehabilitation - virtual Reality Movement data. Mendeley Data V1. doi:10.17632/vdz5j9nfmk.1
Liikkanen, S., Mäkinen, M., Huttunen, T., Sarapohja, T., Stenfors, C., and Eccleston, C. (2022). Body movement as a biomarker for use in chronic pain rehabilitation: an embedded analysis of an RCT of a virtual reality solution for adults with chronic pain. Front. Pain Res. 3, 1–14. doi:10.3389/fpain.2022.1085791
Lin, A. F. C., Cunliffe, C., Chu, V. K., Chan, V., Leung, A. C., Lau, R. P., et al. (2023). Prevention-focused care: the potential role of chiropractors in Hong Kong's primary healthcare transformation. Cureus 15, e36950. doi:10.7759/cureus.36950
Mattison, G., Canfell, O., Forrester, D., Dobbins, C., Smith, D., Töyräs, J., et al. (2022). The influence of wearables on health care outcomes in chronic disease: systematic review. J. Med. Internet Res. 24, e36690–16. doi:10.2196/36690
Miller, R., Kori, S., and Todd, D. (1991). The Tampa Scale: a measure of kinesiophobia. Clin. J. Pain 7, 51–52. doi:10.1097/00002508-199103000-00053
Moon, K. S., Gombatto, S. P., Phan, K., and Ozturk, Y. (2023). Extraction of lumbar spine motion using a 3-IMU wearable cluster. Sensors 23, 182–13. doi:10.3390/s23010182
Noe-Steinmüller, N., Scherbakov, D., Zhuravlyova, A., Wager, T. D., Goldstein, P., and Tesarz, J. (2024). Defining suffering in pain. A systematic review on pain-related suffering using natural language processing. PAIN, 1–16. doi:10.1097/j.pain.0000000000003195
Patterson, D., Fishman, M., Moore, G., Skaribas, I., Heros, R., Wilson, D., et al. (2023b). ID: 219975 application of wearable data in predicting chronic pain patient's response to spinal cord stimulation. Neuromodulation 26, S46–S47. doi:10.1016/j.neurom.2023.04.080
Patterson, D. G., Wilson, D., Fishman, M. A., Moore, G., Skaribas, I., Heros, R., et al. (2023a). Objective wearable measures correlate with self-reported chronic pain levels in people with spinal cord stimulation systems. npj Digit. Med. 6, 146–149. doi:10.1038/s41746-023-00892-x
Pizzo, P. A., and Clark, N. M. (2012). Alleviating suffering 101 — pain relief in the United States. New Engl. J. Med. 366, 197–199. doi:10.1056/nejmp1109084
R Core Team, R (2023). A language and environment for statistical computing. Vienna: R Foundation for Statistical Computing.
Rahman, S., Kidwai, A., Rakhamimova, E., Elias, M., Caldwell, W., and Bergese, S. D. (2023). Clinical diagnosis and treatment of chronic pain. Diagnostics 13, 3689–12. doi:10.3390/diagnostics13243689
Roivanen, E., Suokas, F., and Saari, A. (2021). An examination of factors that may contribute to gender differences in psychomotor processing speed. BMC Psychol. 9 (190), 1–10. doi:10.1186/s40359-021-00698-0
Spencer, A. B., Billmire, D. A., Bilodeau, R. A., Emmett, D., Gibbons, A. K., Mitchell, U. H., et al. (2023). Wearable nanocomposite sensor system for motion phenotyping chronic low back pain: a BACPAC Technology Research Site. Pain Med. 24, 160–174. doi:10.1093/pm/pnad017
Treede, R.-D., Rief, W., Barke, A., Aziz, Q., Bennett, M. I., Benoliel, R., et al. (2019). Chronic pain as a symptom or a disease: the IASP classification of chronic pain for the international classification of diseases (ICD-11). PAIN 160, 19–27. doi:10.1097/j.pain.0000000000001384
Vitali, D., Olugbade, T., Eccleston, C., Keogh, E., Bianchi-Berthouze, N., and Williams, A. C. de C. (2023). Sensing behavior change in chronic pain: a scoping review of sensor technology for use in daily life. PAIN 165, 1348–1360. doi:10.1097/j.pain.0000000000003134
Wickham, H. (2023). Stringr: simple, consistent wrappers for common string operations version 1.5.1. Vienna: CRAN.
Wickham, H., Averick, M., Bryan, J., Chang, W., McGowan, L. D., François, R., et al. (2019). Welcome to the tidyverse. J. Open Source Softw. 43, 1686. doi:10.21105/joss.01686
Wickham, H., François, R., Henry, L., Müller, K., and Vaughan, D. (2023). Dplyr: a grammar of data manipulation. Vienna: CRAN.
Keywords: virtual reality, chronic pain, real world study, digital therapeutics (DTx), wearabe sensors
Citation: Liikkanen S, Jalkanen T, Mäkinen M, Huttunen T, Kilpeläinen R, Reijula J, Heimonen J, Mäkiniemi A, Gentile G and Eccleston C (2025) Body movement as a digital biomarker in chronic pain rehabilitation: a real-world pilot study using virtual reality. Front. Virtual Real. 6:1601823. doi: 10.3389/frvir.2025.1601823
Received: 03 April 2025; Accepted: 16 June 2025;
Published: 30 June 2025.
Edited by:
Otilia Obreja, Zentrum für Schmerz und Stresserkrankungen, SwitzerlandReviewed by:
Eric Chun-Pu Chu, EC Healthcare, Hong Kong SAR, ChinaBinay Biswas, ESIC Medical College and Hospital, Bihar, India
Dominika Burek, McLean Hospital, United States
Copyright © 2025 Liikkanen, Jalkanen, Mäkinen, Huttunen, Kilpeläinen, Reijula, Heimonen, Mäkiniemi, Gentile and Eccleston. This is an open-access article distributed under the terms of the Creative Commons Attribution License (CC BY). The use, distribution or reproduction in other forums is permitted, provided the original author(s) and the copyright owner(s) are credited and that the original publication in this journal is cited, in accordance with accepted academic practice. No use, distribution or reproduction is permitted which does not comply with these terms.
*Correspondence: Sammeli Liikkanen, c2FtbWVsaS5saWlra2FuZW5Ab3Jpb25waGFybWEuY29t