 Jiahui Guan
 Hsieh Fushing
- Department of Statistics, University of California, Davis, Davis, CA, United States
Upon a matrix representation of a binary bipartite network, via the permutation invariance, a coupling geometry is computed to approximate the minimum energy macrostate of a network's system. Such a macrostate is supposed to constitute the intrinsic structures of the system, so that the coupling geometry can be taken as the information content of the network or even the nonparametric minimum sufficient statistics of the network data. Based on this, pertinent null and alternative hypotheses, such as nestedness, are to be formulated according to the macrostate. That is, any efficient testing statistic needs to be a function of this coupling geometry. These conceptual architectures and mechanisms are, by and large, still missing in community ecology literature and have rendered misconceptions to be prevalent in this research area. Here, the algorithmically computed coupling geometry is shown to consist of deterministic multiscale block patterns, which are framed by two marginal ultrametric trees on row and column axes, and stochastic uniform randomness within each block found on the finest scale. Functionally, a series of increasingly larger ensembles of matrix mimicries is derived by conforming to the multiscale block configurations. Here, matrix mimicking is meant to be subject to constraints of row and column sums sequences. Based on such a series of ensembles, a profile of distributions becomes a natural device for checking the validity of testing statistics or structural indexes. An energy-based index is used for testing whether network data indeed contain structural geometry. A new version of block-based nestedness index is also proposed. Its validity is checked and compared with the existing ones. A computing paradigm, called Data Mechanics, and its application in one real data network are illustrated throughout the developments and discussions in this paper.
1. Introduction
Ever since the “assembly rules” were proposed in Diamond [1] and Case and Sidell [2], the presence-absence matrix has been the fundamental data type in community ecology. A presence-absence matrix is also called a co-occurrence matrix. In fact, from a data structural perspective, as being permutation invariant on both axes of matrix, this kind of data type should be precisely termed as a binary bipartite network. Such network data are now a major data type for understanding mutualistic system interactions in a wide range of ecological studies [3]. An ecological mutualistic system is concerned with mutually beneficial interactions between a collection of animal species and a collection of plant species. One typical example is the flowering plants and their insect pollinators. The binary bipartite network records the presence-absence of a target interaction upon each animal vs. plant entry. In other words, a binary bipartite network is used to approximate an ecological system from a mutualistic perspective. In contrast, the directed binary network is used to approximate an antagonistic system, such as a food web. It should be noted that these two binary networks have rather distinct structures and information contents. They cannot be mixed. The directed network is not being considered here.
Given its fundamental role, the controversy centered on the binary bipartite network has never faded away in the past four decades. One key reason underlying this controversy, in our opinion, is that the intrinsic mathematical architectures and proper physical mechanisms underlying such binary bipartite networks are, by and large, still missing in current ecological literature. The consequences of these missing architectures and mechanisms include (1) an observed pattern within a binary bipartite network has never been identified analytically [4]; (2) network- or matrix- based structural hypotheses are not precisely formulated [5, 6]; (3) the validity of testing statistics is not properly checked [1, 7]; and (4) the computations of p-value for statistical inference are apparently incorrect [5, 6, 8]. All these consequences are caused in part by the lack of knowledge about the information content contained within an observed binary bipartite network and the lack of proper algorithms for mimicking and generating matrices with distinct structural information. Above all, the challenging tasks of defining an effective testing statistic on matrix or network data have not been systematically resolved. Only heuristic and parsimonious solutions have been suggested so far in the literature.
All these aforementioned issues have been systematically discussed, developed, and resolved in this paper. Throughout this paper, a binary bipartite network and its approximating mutualistic system are the primary concerns. Therefore, the network's rectangular matrix representation has one axis for a collection of animals of interest and the other for a collection of plants under study. We first discuss computational developments for those visible geometric patterns that are indeed embedded within the matrix, and then we discuss whether such embedded geometric structures are coherent with the idea of nestedness. The first part of the discussion resolves the issues arising from co-occurrence matrices observed in biogeographic systems.
By making use of the fact that a binary bipartite network is permutation invariant with respect to the nodes on both the axes, a new computing paradigm, called Data Mechanics, is applied to extract a combination of a deterministic multiscale structure and a stochastic uniformity from such data [9]. The coupling of deterministic (i.e., multiscale structures) and stochastic (i.e., stochastic uniformity of blocks) structures is termed as a coupling geometry. Such coupling measures that minimize the Gromov-Wasserstein distance of these two marginal geometries are also seen to be in the vicinity of the macrostate [9]. This resultant coupling geometry is assumed to be the computable information contents of the network data, because it is very close to the minimum energy macrostates of the target system. From a statistical physics perspective, all microstates are supposed to conform to such macrostates. Such a conformation indicates a principle on how to mimic observed network data [9]. Specifically, the deterministic multiscale structures are the visible patterns contained in the data, which are those that have been missing in Connor and Simberloff [4], while the uniformity enables us to mimic and to generate various ensembles of matrices with different geometric pattern information.
Another concept proposed in this paper is that the conceptual nestedness in a data matrix has to be adapted upon the computed deterministic multiscale structure. This adaptation is meant to build the least nestedness-bearing construct containing observed deterministic multiscale structures. As such, testing the hypothesis of whether a data matrix is nested is to evaluate the degree of structural differences between this nestedness-bearing construct and the original coupling geometry's deterministic structure. Based on this concept, we propose a block-based nestedness index and compare it with three existing popular indexes. Among these three indexes, one is originally proposed in Patterson and Atmar [10] and the other two are the improved versions [11, 12]. Ironically, we found that these two improved versions are indeed improper. Throughout this paper, we use the well-studied mammal data from Patterson and Atmar [10] for illustration and expositional purposes.
2. Related Work
2.1. Nested Pattern in Ecosystem
A presence-absence co-occurrence matrix of small mammal species inhabiting forested habitats in the southern Rocky Mountains, U.S.A, has raised an interesting question, and it suggests that the extinctions are highly selective. A historical background might explain such interaction patterns. In early glacial period, the species that were restricted to the mountaintop habitats in the south expanded their range to lower altitudes and latitudes. With the retreat of continental glacier, the warmer and drier climates made the boreal habitats and taxa return to higher altitudes and latitudes. So, the southern species were left on the isolated mountaintops. The relationship between the boreal habitats and the isolated mountaintops can be considered as similar to the one between adjacent mainland and island areas. Apparently, the extinction of these two disjoint populations was determined by local probabilities.
Inspired by such phenomenon, Patterson [13] proposed a “nested subset” relationship among montane biotas: depauperate fauna support species, Which collectively comprise proper subsets of those in richer faunas. The idea of nested subset hypothesis is influential on colonization and extinction of species. Patterson and Atmar [10] stated that nestedness is a particular ecological pattern widely reported for species occurrences in metacommunities. Nestedness is found when sites with lower species richness tend to harbor proper subsets of those species present in richer sites. Other studies have also confirmed that the nested ecological pattern is ubiquitous in metacommunities [14–17]. The major explanation for the emergence of nestedness in metacommunities includes the differences in habitat features such as isolation, size, quality, and nested habitats or in species attributes such as area requirements, abundance, and tolerance to abiotic factors [10, 15–20].
Apart from metacommunities, the nested pattern is also widely found in species-interaction networks, especially in plant-animal mutualisms [3]. They analyzed 52 mutualistic networks and show that they are highly nested. Other studies have also discovered such nested ecological patterns in interaction networks including a plant-flower visitor system [21], an ant-extrafloral nectary-bearing plant network [22], a plant-herbivore assemblage [23], and a more geographically widespread mutualistic network [24]. So, mutualistic networks are neither randomly assembled nor organized in compartments arising from tight, parallel specialization.
There are three possible consequences or influences of such nested patterns on species-interaction networks. First, it may result in an abundance of interacting species, since, nested structures appear within compartments. In studies across sites or time periods species shift in position within a nested set far more often than they should shift compartments [23]. Second, nested patterns may have higher extinction rates for specialists that interact with other specialists [21]. Third, owing to the coextinction of species within these interactions over evolutionary time, these species also coevolve, causing convergence and complementarity of traits among a set of species in a nested antagonistic or mutualistic network [22, 25].
2.2. Nestedness Index
To formalize how nested the species-area relationship is, Patterson and Atmar [10] derived a “nestedness” index denoted as N index, that is, the extent of departure from perfect nestedness. To compute it, we first determine the fauna that has the lowest species richness, in which species i occurs, in which species i occurs and then count the number of absences of species i in richer faunas and mark it with (+). The Ni index is the summation of these (+)s. Such a nestedness index is used as a testing statistic while conducting a statistical hypothesis test.
Later on, several other nestedness measurements have been developed to improve the detection of nested patterns. The nestedness temperature (T) is another index proposed by Atmar and Patterson [12] as an improved version of N+. It is based on the isocline of perfect order, a curve drawn from the lower-left corner of the matrix to the upper-right corner, with curvature defined by matrix fill. Temperature is computed by summing all the “unexpected” species. Brualdi and Sanderson [26] developed BR, also known as discrepancy, as a count of the number of discrepancies that should be erased to have a perfect nestedness. It is an index that quantifies the difference between the network binary matrix and the theoretically perfect nested matrix. These nestedness measurements have two things in common: (1) they measure distinct matrix properties such as presence or absence and (2) they give different weights to these properties. However, these measurements are all associated with their own maximum degrees of nestedness. They do not consider an independent maximum benchmark derived from the concept of nestedness: decreasing marginal totals [11]. Proposed by Almeida-Neto et al. [11], nestedness metric based on overlap and decreasing fill (NODF) is a state of the art method for measuring nestedness, which is based on overlap and decreasing fill. Even though NODF includes the basic nestedness property–decreasing marginal totals–the penalty for nondecreasing marginal totals might not be large enough, because the null matrices they generated were drawn from a uniform random distribution per cell rather than fixed row and column sums.
2.3. Hypothesis Sampling
In terms of hypothesis sampling, both margins of a binary matrix should be fixed. Patterson and Atmar [10] used two sampling algorithms: (1) RANDOM0 assumed that all species had equal probabilities to be assigned and selected species using uniform probability distribution and (2) RANDOM1 used a probability distribution weighted by the actual range occurrences of species, namely, the entries of each column are drawn proportionally to the row sums, conditioned on the column sum. RANDOM1 is better and more accurate in terms of capturing the global interaction pattern. However, the margins may not be fixed because of the stochastic process of these two methods.
There are many other sampling methods with fixed margins that have been proposed. The swap method, known as checkerboard, extracts two rows and two columns from the matrix at random. Stone and Roberts [7]. If the 2 × 2 sub-matrix is a checkerboard unit, we swap it. The biggest problem with checkerboard is that it creates bias among consecutive samplings. Part of the reason for this is that the checkerboard is dependent, meaning that the generated sample matrix is correlated to its predecessor. As the difference between the two consecutively sampled matrices is at most four entries, the generated matrices will show preferences to the predecessor's matrix configurations.
The sequential swap is an improved version of the checkerboard [27]. It generates a first null matrix by performing 20,000 swaps, and then creates each subsequent null matrix by performing a single swap on the last generated matrix. However, it still cannot solve the problem of unbiasedness. Swap methods, in general, tend to be biased toward the matrices with more checkerboard units [28].
The Bayati sequential method [29] starts from a blank matrix and fills the matrix by adding an edge based on probability that is proportional to , where (d1, …dn) are the degree sequences and is an n-tuple of integers, and each of will be reduced by 1 for every iteration. The running time for bounded dmax is O(mdmax), where and dmax = max(d1, …dn). However, the probability of failure of this algorithm is o(1). While o(1) is not a big problem, asymptotically, but, in reality, the method fails even in matrices of small size. Similar to Bayati's method, there are several other approximate sampling algorithms that are based on probability that use different sampling methods such as sequential importance sampling (SIS) and Markov chain Monte Carlo (MCMC). [30–33].
Miller and Harrison [34] proposed an efficient algorithm of exact sampling. This method samples matrices from the uniform distribution over binary matrices with fixed margins. The row and column sums of the sampled matrix should be exactly the same as of the observed matrix. By grouping the same column sums as blocks and counting all the possible solutions of each row recursively, Miller's method runs in polynomial time. This method is unbiased and runs in polynomial time for matrices that are not so big; the running time will become exponential when matrix size is big (over 100 × 100) with unbounded a and b. One example is that for a 28 × 26 matrix, there are approximately 1027 solutions. The number of solutions will become almost infinitive if the matrix size is very large.
In an ecological community structure, nestedness is found when sites with lower species richness tend to harbor proper subsets of those species present in richer sites. It is a very specific species-area interaction pattern and to test such structures, an appropriate nestedness index and an efficient unbiased hypothesis sampling method are needed, which inspire us to explore them.
3. Method
3.1. From Intuitive Grouping Ideas to Coupling Geometry
Within an ecological system, all intrinsic patterns of the mutualistic interactions between a collection of animal species and a collection of plant species, beyond individual-to-individual level, are the supposed information content to be contained within the observed binary bipartite network. Such pattern information, intuitively, would be jointly expressed through clusters of similar animals coupled with clusters of similar plants in a fashion of block-wise uniformity. In other words, on multiple global levels, dissimilar clusters on one axis would reveal contrasting configurations of clusters on the other axis. As such, scientists can visualize why different clusters of animal are characterized distinctively with respect to differences among clusters of plant. This means that the information content within a binary bipartite network data is multiscale and visible, more importantly, they are computable.
Hierarchical clustering can somehow capture and help visualize block-wise clustering of a matrix, but it tends to produce clusters with imbalanced sizes and each block lacks uniformity [35]. Several multiscale tree-related methods have been developed on certain domains such as semisupervised learning, convex pattern structures, etc [36–38]. Currently, multiscale information patterns on bipartite network are being computed through a new computing paradigm, called Data Mechanics, developed in Fushing and Chen [9]. Computationally, Data Mechanics indeed attempts to solve an optimal permutation problem of achieving the minimum total variation among all possible matrix representations of the observed bipartite network. Here, the total variation is defined with respect to the choice of neighborhood system, such as the set of immediate neighbors on the rectangle matrix lattice. Detailed formula of the total variation, also known as energy in physics, is given in Supplementary Section 1.1. This discrete combinatorial optimization is operated based on the permutation invariance of a bipartite network with respect to its nodes of animals and plants. The complexity of this problem surely depends on the exponentially growing factorials of sizes of the animal and plant collections. Though the concept of pattern information content contained within a binary bipartite network is intuitive, computing for the multiscale structures can be a rather complex problem. Data Mechanics is designed to provide optimal or nearly optimal solutions to this computational problem.
The algorithm for computing ultrametric trees, a key part of Data Mechanics, is called Data Cloud Geometry (DCG). Developed in Fushing and McAssey [39], DCG intends to construct ultrametric trees via multiscale clustering, which has been widely used in many fields [40, 41]. Another important aspect of Data Mechanics is the iterative computation of ultrametric trees. Iterative algorithm has been proven that it can reduce systemetical errors and improve overal performance on many domains [42–44]. With the iterative computing of DCG on row and column axes, Data Mechanics converts unstructured binary biparite networks into multiscale block patterns framed by two ultrametric trees iteratively built upon the two axes, respectively.
The stochastic structures are found within each block formed by a core cluster on the row axis and one core cluster on the column axis. Such two-dimensional uniform randomness is subject to row sum and column sum sequences of the block involved. Here, core clusters of an ultrametric tree are identified on its bottom tree level, that is, the finest scale structure of a coupling geometry refers to block patterns formed via core clusters, whereas the coarsest structure refers to the one framed by one cluster containing all animals and another cluster containing all plants. The scales between these two extremes are specified by tree levels between the top and the bottom.
Thus, by designing all the resultant optimal and nearly optimal solutions, we illustrate multiscale block patterns through the coupled framework of two ultrametric trees built on animal and plant axes in Figures 1A,B.
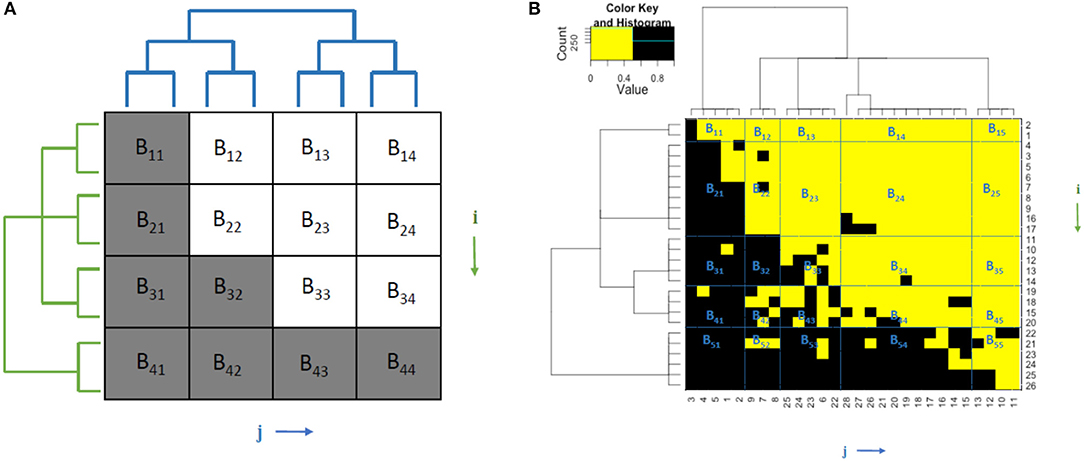
Figure 1. (A) Illustration of theoretical multiscale block structures and coupling geometry of a perfectly nested bipartite network. Interactions are marked in gray while noninteractions are in white. (B) The multiscale block structures and coupling geometry of a mammalian dataset that contains 26 mammalian species in 28 mountain ranges [10]. Interactions are in black and non-interactions are in yellow.
Coupling geometry with trees reveals multiscale block pattern information that characterizes multiple layers of interacting relationships between clusters on row and column axes. These data-driven deterministic multiscale block structures brought out by multiple tree levels of two ultrametric trees, frame and summarize the interacting relational patterns between animals and plants. The coupling relation of these two trees is, in fact, derived iteratively and alternatively by applying a computing algorithm, called DCG, which serves as the key device of Data Mechanics. The iterative procedure is designed to update a distance measure used in the previous iteration by taking the currently computed tree structural information into consideration, while the procedure of alternating between animal and plant axes is designed to build the dependence or coupling of the two trees.
Notably throughout this paper, a computed coupling geometry (with an energy of –2,184) of the mammalian data not the actual lowest energy matrix configuration, is employed as the foundation for all the developments. The reason for the parsimonious approach is purely the computational effectiveness. For instance, one of the lowest energy matrices (with energy –2,204) of the mammalian data is shown in Figure 2.
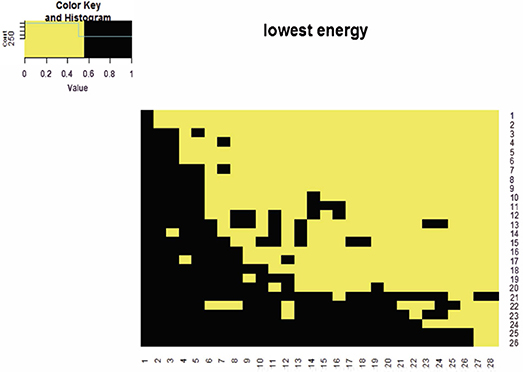
Figure 2. The heatmap of a binary matrix for the mammalian dataset. This binary matrix has the lowest energy given that the row and column sums are fixed.
Typically, the computed coupling geometry is pretty close to the solution of to the one with the lowest energy; it is the appropriate starting point for the search to find the optimal solution. However, it should be noted that it usually takes a huge amount of computing effort to achieve the optimal goal.
Besides the deterministic multiscale block structures, Data Mechanics computations also bring out block-wise stochastic randomness. This stochastic component is specifically seen as the uniformity within each block found on the finest scale.
3.2. From Coupling Geometry to Block-Based Testing Statistics for Structural Hypothesis
Here, we construct a reasonable and effective testing statistic in regard to nestedness as a hypothesized geometric structure upon an observed binary matrix or a binary bipartite network. Owing to the fact that the coupling geometry is very close to the minimum energy macrostate of the system approximated by the data network, it is necessary to treat such a coupling geometry as the minimum sufficient statistic. A fundamental principle in statistical thinking is that an efficient testing statistic should be based on the computed coupling geometry as the data's minimum sufficient statistic. Therefore, the most relevant geometric structure of nestedness must be its least version that contains the coupling geometry. So, theoretically, finding the least containment is an optimization problem.
Let NG denote the least nestedness geometric structure defined on the same matrix lattice as that of the originally observed data matrix. However, there is no need to explicitly compute it because of the multiscale block patterns of the computed coupling geometry. Thus, we only need to evaluate the functional characteristics of NG in terms of all the blocks involved, which are found on the finest scale in a coupling geometry, as shown in Figures 1, 2. This means that , the intensity of 1s in block Bij, has to satisfy the following two properties to be in accordance with nestedness.
1) 1st order property: is decreasing with respect to all the given js and, at the same time, increasing with respect to all the given is.
2) 2nd order property: , 2nd order differences on ith row:
has at most one sign change from positive (+) to negative (−), that is, being concave downward to concave upward; whereas , 2nd order differences on jth column:
has at most one sign change from negative (−) to positive (+), that is, being concave upward to concave downward.
Another property of the second order is that sequences of and contain the corresponding sequences of signs pertaining to the coupling geometry, denoted as CG. For the mammalian data, the 5 × 5 matrix of block-wise intensities of the coupling geometry is calculated as:
For j = 2, 3, 4;i = 1, 2, …, 5,
For i = 2, 3, 4;j = 1, 2, …, 5,
Based on the above block-based nestedness perspective, the following nestedness-index for a simulated matrix, denoted by S, is proposed:
The first two terms on the right-hand sides of index NCG are “costs” against the linear ordering along the column-index on every row and along the row-index on every column. The product terms are designed to be negative in value if the linear ordering holds and positive if the linear ordering fails. So, larger the NCG value, the farther it is from nestedness. The 3rd and 4th terms are for counting the coherence of the 2nd order differences with that of NG. Positive and larger values indicated incoherence or violations of nestedness.
4. Result
4.1. From Coupling Geometry to Matrix Mimicking
The primary use of a computed coupling geometry from a binary network is to make it possible for generating a series of ensembles of matrix or network mimicries bearing with decreasing degrees of geometric structural information from the finest to the coarsest scales. Matrix mimicking is subject to constraints of row and column sums sequences of the observed binary matrix, that is, a matrix mimicry is a matrix that meets the same row sum and column sum constraints. Based on such a series of ensembles, a profile of distributions becomes a natural device for checking the validity of testing statistics or structural indexes. The matrix ensemble pertaining to the finest scale of structural information is generated by patching up all simulated blocks, which are marked by core clusters of ultrametric trees of animals and plants, subject to block-version row and column sums sequences. This is an ensemble that conforms to the minimum energy macrostate of the ecological system from a statistical physics perspective. The ensemble pertaining to the coarsest scale of structures simply refers to the collection of matrices that satisfy the constraints of row sum and column sum sequences of the entire matrix observed as a block.
The generative algorithm employed here is the one proposed and used in Miller and Harrison [34]. A brief illustrating example and summary of this algorithm are given in Supplementary Section 2. But, it is worthwhile to note that this algorithm is effective for small sizes of binary data matrix, such as the mammalian data. It breaks down even on the 50 × 50 matrix. The key factor affecting the performance of the algorithm is the matrix's sparsity of 1s.
In ecological literature, 2 × 2 checkerboard switching and its improved version, curveball algorithm [45], are also popularly used to generate binary matrices with constraints of row and column sums sequences. Basically, the 2 × 2 checkerboard switching and its variants are a way of searching for new solutions by moving away from the existing ones. In contrast, Miller and Harrison's algorithm intrinsically and simultaneously solves the linear equations imposed by the constraints of row sum and column sum sequences. Thus, these two matrix matrix-generating algorithms are rather distinct in nature; both types of algorithms suffer from distinct drawbacks to be applicable widely.
The drawbacks of 2 × 2 checkerboard switching and its variants are as follows: firstly, they generate dependent matrices depending on the initial matrix, and secondly, their energy spreads are relatively too narrow, indicating that they have preference for previously sampled matrix configurations. One evident view of such drawbacks is revealed in Figure 3. Furthermore, our computer experiments show that the generating processes have rather short recurrent time cycles, that is, repeated matrices being generated too often. This phenomenon indicates that the generated trajectory might have been confined within a small region.
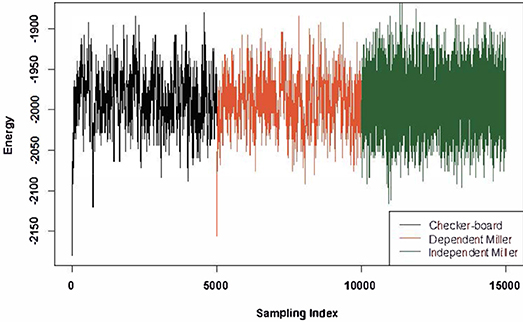
Figure 3. Energies of a total of 15,000 sampling matrices with fixed row and column sums. The formula for energy is defined in S1 (Supplementary Section 1). Three different colors represent the sampling methods used: 2 × 2 checkerboard, dependent Miller's algorithm, and independent Miller's algorithm.
Here, we tentatively propose a practical way of resolving the issue of large data matrix that currently limits Miller and Harrison's algorithm. By incorporating a randomized divide-and-conquer sampling scheme in the observed data matrix, the whole matrix is divided into blocks, on which Miller and Harrison's algorithm becomes applicable. This sampling scheme can be made to accommodate the heterogeneity brought out by the coupling geometry on both axes.
4.2. From Matrix Ensembles to Energy Profile
The entropies of this series of ensembles are defined as the logarithm of their sizes. The notation Ea×b represents that matrix ensembles are mimicked via a×b blocks, that is, an m×n matrix, is decomposed by a×b blocks. There are a×b blocks in total. Each block matrix is of the size Sm1×n1, …Sma×nb, where m = m1+m2+…ma and n = n1+n2+…nb. For example, in Figure 1A, if we decompose it by 2 × 2 blocks, we group the rows and columns into two clusters, respectively, according to their ultrametric trees. Hence, Block 1 = (B11, B21, B31, B12, B22, B32), Block 2 = (B13, B23, B33, B14, B24, B34), Block 3 = (B41, B42), and Block 4 = (B43, B44). When generating matrix ensembles, each block generates a sequence of sub-matrix ensembles that meets the same row sum and column sum constraints. By putting these a×b sub-matrix ensembles together, the matrix ensembles have the same row and column sum sequences as the matrix . It is to be noted that E1 × 1 does not require the decomposition of the observed matrix.
For the mammalian data in Figure 1B, the serial sizes of ensembles are computed via an algorithm from Miller and Harrison [34] described as follows: the size of the finest scale (E5 × 5 version) ensemble is 1.3 × 10⁸, the E4 × 2version is 4.47 × 10¹⁶, the E2 × 2 version is 1.45 × 1029, and the E1 × 1 version (the coarsest scale one) is 2.7 × 1039. Such quantities of ensemble size or entropy bring out the quantitative sense of the structural differences among multiscale block geometries embedded within the originally observed network.
Another important aspect of such differences is revealed via a profile of energy distributions, as shown in Figure 4 for the mammalian data. It is evident that the two versions, E5 × 5 and E1 × 1, of ensembles are very different in a sense that a randomly chosen matrix from the E1 × 1 ensemble would appear very different from any matrix from the E5 × 5 ensemble. The shifting-to-right pattern of the energy distribution profile strongly implies that it is computable and that the observable block patterns contained in the coupling geometry are persistently eroding. The nearly complete separation of the two energy distributions- based ensembles E5 × 5 and E1 × 1, respectively, indicates that the coupling geometry is not likely to result from a random sampling. In this fashion, the hypothesis of co-occurrence patterns is tested if the original binary bipartite network is represented by a presence-absence data matrix (See Supplementary Section 1 for comparisons of energy index with other indexes of co-occurrence).
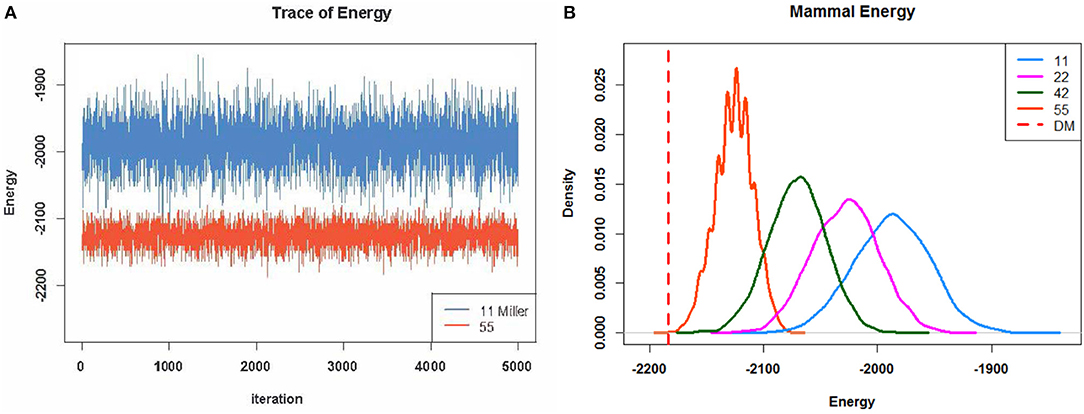
Figure 4. (A) Two energy trajectories from two scales of matrix structures. The light blue ones are sampled with fixed row and column sums of the overall matrix; however, the orange-red ones are sampled with fixed row and column sums in each 5 × 5 block. (B) Four energy distribution curves fit four different scales of block structures.
4.3. From Coupling Geometry to Block-Based Testing Statistics for Structural Hypothesis
So far, there are at least three nestedness indexes that have been proposed in literature. They are the “N+ counts” [10], T (temperature) [12], and NODF [11] indexes. We computed these three indexes and the index NCG based on four ensembles: E5 × 5, E4 × 2, E2 × 2, and E1 × 1, derived from the coupling geometry of the mammalian data. Their corresponding distributions are presented in the following four panels. From panel (a) for “N+,” though we see that the distribution based on E5 × 5 is somehow overlapping with the one based on E1 × 1, their two modes are evidently separated. Moreover, their relative positions are correct, with the distribution based on E5 × 5 being more toward the nestedness and on the left of the one based on E1 × 1. In contrast, from panels (b) and (c) for T (temperature) and NODF indexes, it can be seen that all their distributions are almost completely overlapping with each other. Such complete overlapping phenomena strongly indicate that both indexes, T (temperature) and NODF, are not effective statistics for testing nestedness given that the two ensembles E5 × 5 and E1 × 1 are very different in energy and size, so as their pattern information. Finally, on panel (d), the profile of distributions of NCG based on E5 × 5, E4 × 2, E2 × 2, and E1 × 1 is progressively shifting to the right as it is away from nestedness. Notedly, the singleton based on the ensemble E5 × 5 is located at the extreme left tail of the one based on E1 × 1; it is understood that the 2nd order differences component in such an index is the key aspect that separates the coupling geometry and matrices in E4 × 2, E2 × 2 away from E1 × 1.
Among the three existing nestedness indexes, N+, T (temperature), and NODF, the last two indexes are newly proposed and supposedly improve the first index. However, as shown in the Figure 5, these two supposedly improved versions are indeed “improper.” These two nestedness index values of the fine scale (i.e., E5 × 5, E4 × 2) and coarse scale (i.e., E2 × 2,E1 × 1) share almost the same density distributions, meaning that they are not different from each other. On the contrary, though it might not be effective, the originally proposed “N+ count” is not unreasonable, since, it separates index distributions of different scales. The only considerable part is that the finer scale, E4 × 2, has higher value distributions than E4 × 2, which theoretically should be in the opposite direction.
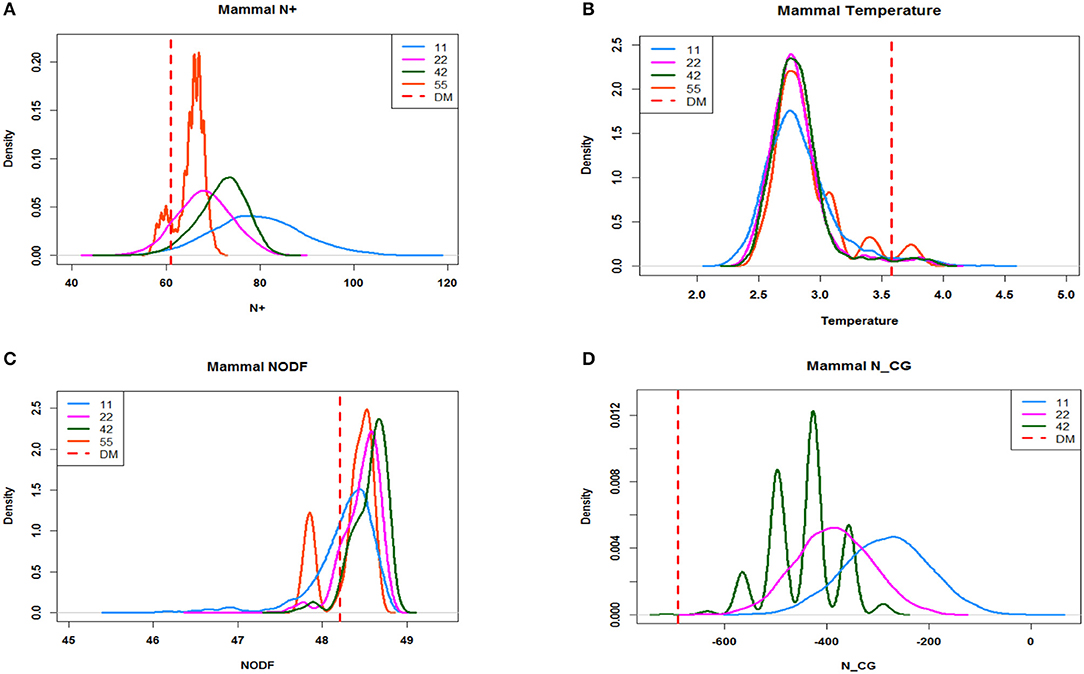
Figure 5. The distribution of different indexes that are sampled, constrained by different scales of block structures. Each index and each scale of block structure are sampled 5,000 times using Miller's algorithm. The dash line represents the indexes of Data Mechanics. (A) Distribution generated by N+. (B) Distribution generated by Temperature. (C) Distribution generated by NODF. (D) Distribution generated by NCG.
Here, we make a remark on the current state of knowledge such as the issue of how to systematically define an efficient testing statistic even on a binary bipartite network is still wide open at the current state of knowledge. In fact, it is expected because a bipartite network is indeed used to approximate a complex system state. This system state is very much nonparametric in nature in the sense of containing nonlinearity, dependence, and heterogeneity.
4.4. From Coupling Geometry to Formulating the Structural Hypothesis
Finally, we discuss two issues: (1) What are the rationales behind comparing the two distributions based on ensembles E5 × 5 and E1 × 1 in the mammalian data? (2) Why a hypothesis based on a binary bipartite network has to be formulated and tested in a conditional setting? These two issues are indeed two sides of the network data's information content.
The first insight that comes from the data's matrix representation is that the row and column sums sequences might as well be deterministic, that is, the two sequences involve no randomness at all. Such deterministic feature is formed when data are collected. Therefore, conditioning on the two sequences is not only preferable but necessary.
By means of conditioned thinking, the null and alternative hypotheses, Ho and Ha, have been formulated as follows.
Ho: The mutualistic system of animal and plant interactions does not contain nestedness related patterns beyond the minimum patterns sustained by the row and column sums sequences.
Ha: The mutualistic system of animal and plant interactions does contain more nestedness related patterns in its minimum energy macrostate than the minimum patterns sustained by the row and column sums sequences.
Under Ho for the mammalian data, the null distribution with respect to any testing statistic is exactly the corresponding distribution derived from the ensemble based on E1 × 1. However, under Ha, typically there exists one or many lowest energy macrostates embedded within an observed binary bipartite network data. For instance, we can find more than 300 matrices with the lowest energy for the mammalian data. However, explicitly finding minimum energy macrostates can be impractical because of huge computational loads. This is usually the case for large data networks. Hence, on one hand, a computable coupling geometry is the pragmatic candidate.
On the other hand, the hypothetical geometry specified on the alternative has to contain the minimum energy macrosate, so that an efficient testing statistic has a function of the coupling geometry as a minimum sufficient statistics. This is why the testing statistics is defined based on the finest scale block patterns. Such testing statistics are nearly identical with the ones defined on the real minimum energy microstates. Therefore, the distribution under Ha pertaining to any efficient testing statistics has to be singleton based on the finest scale blocks, such as E5 × 5 in the mammalian data.
Nonetheless, it is critically important to emphasize here that any non-efficient statistics will have many “observed” values under the alternative hypothesis, such as index on the mammalian data on the E5 × 5 ensemble. So, there would be a distribution of p-values. In other words, the report of one single p-value is not valid in such a hypothesis testing setting. We indeed need to report such a distribution of p-values.
5. Discussion
We computationally extracted a coupling geometry, consisting of deterministic and stochastic structures, embedded within an observed binary bipartite network as its information content. From the perspective of physics, it is a minimum energy macrostate, and, at the same time, from a statistical perspective, it is the minimum sufficient statistic. Therefore, any microstates as mimicries of the observed data network have to conform to this coupling geometry, while any potentially efficient testing statistic has to be a function of it. Furthermore, the pertinent geometric structure of nestedness has to be the least construct containing such a coupling geometry. These are fundamental facts underlying any coherent data analysis on binary bipartite networks. Significant implications include that the formulations of hypotheses need to be based on the minimum energy macrostate, and any potential nestedness index has to be in a form based on the block patterns found on the finest scale.
The computable coupling geometry also facilitates various ensembles of matrix-mimicking according to its multiscale block patterns. Owing to the fact that the profile of ensembles bears with monotonically less geometric structures, any reasonably effective nestedness index will give rise to gradually separating index-based distributions: from the finest scale to the coarsest scale. This means that an index is not effective if it misses such a gradually separating pattern. When an index, such as NCG proposed here, is defined based on the finest scale blocks, it gives rise to singleton on the finest scale ensemble. Otherwise, there would be a distribution of p-values.
On the front of generating random matrices that are subject to the two sequences of row and column sums, experiences from our computer experiments reveal that the commonly used 2 × 2 checkerboard swapping and its variants need “big” perturbations in order to achieve “more uniform” sampling. A perturbation-aided sampling scheme, based on a coupling geometry and Miller and Harrison's algorithm ([34) can generate and sample large random matrices up to 1,000 × 1,000 in size.
As a final remark, a coupling geometry computed from a binary bipartite network data can further afford an approach to compare the marginal tree structure on one axis with its corresponding phylogenetic tree as a new way of evaluating phylogenetic effects. Such a comparison of two tree structures can be performed via a technique called partial coupling geometry, which was developed in the spirit of mutual information in information theory.
Author Contributions
HF and JG designed and constructed the problem, performed computing and data analysis, and wrote and revised the manuscript.
Conflict of Interest Statement
The authors declare that the research was conducted in the absence of any commercial or financial relationships that could be construed as a potential conflict of interest.
Supplementary Material
The Supplementary Material for this article can be found online at: https://www.frontiersin.org/articles/10.3389/fams.2018.00038/full#supplementary-material
References
1. Assembly of Species Communities. In: Diamond, J. M. and Cody, M. L., editors. Ecology and Evolution of Communities. Harvard University Press, Boston, 342–344.
2. Case TJ, Sidell R. Pattern and chance in the structure of model and natural communities. Evolution (1983) 37:832–49. doi: 10.1111/j.1558-5646.1983.tb05604.x
3. Bascompte J, Jordano P, Melián CJ, Olesen JM. The nested assembly of plant–animal mutualistic networks. Proc Natl Acad Sci USA. (2003) 100:9383–7. doi: 10.1073/pnas.1633576100
4. Connor EF, Simberloff D. Species number and compositional similarity of the Galapagos flora and avifauna. Ecol Monogr. (1978) 48:219–48. doi: 10.2307/2937300
5. Gotelli NJ. Null model analysis of species co-occurrence patterns. Ecology (2000) 81:2606–21. doi: 10.1890/0012-9658(2000)081[2606:NMAOSC]2.0.CO;2
6. Ulrich W, Gotelli NJ. Null model analysis of species nestedness patterns. Ecology (2007) 88:1824–31. doi: 10.1890/06-1208.1
7. Stone L, Roberts A. The checkerboard score and species distributions. Oecologia (1990) 85:74–9. doi: 10.1007/BF00317345
8. Diamond JM, Gilpin ME. Examination of the “null” model of Connor and Simberloff for species co-occurrences on islands. Oecologia (1982) 52:64–74. doi: 10.1007/BF00349013
9. Fushing H, Chen C. Data mechanics and coupling geometry on binary bipartite networks. PLoS ONE (2014) 9:e106154. doi: 10.1371/journal.pone.0106154
10. Patterson BD, Atmar W. Nested subsets and the structure of insular mammalian faunas and archipelagos. Biol J Linn Soc. (1986) 28:65–82. doi: 10.1111/j.1095-8312.1986.tb01749.x
11. Almeida-Neto M, Guimarães P, Guimarães PR, Loyola RD, Ulrich W. A consistent metric for nestedness analysis in ecological systems: reconciling concept and measurement. Oikos (2008) 117:1227–39. doi: 10.1111/j.0030-1299.2008.16644.x
12. Atmar W, Patterson BD. The measure of order and disorder in the distribution of species in fragmented habitat. Oecologia (1993) 96:373–82. doi: 10.1007/BF00317508
13. Patterson BD. Mammalian extinction and biogeography in the southern Rocky Mountains. Extinctions (1984).
14. Wright DH, Reeves JH. On the meaning and measurement of nestedness of species assemblages. Oecologia (1992) 92:416–28. doi: 10.1007/BF00317469
15. Cutler A. Nested faunas and extinction in fragmented habitats. Conserv Biol. (1991) 5:496–504. doi: 10.1111/j.1523-1739.1991.tb00357.x
16. Cutler AH. Nested biotas and biological conservation: metrics, mechanisms, and meaning of nestedness. Landsc Urban Plann. (1994) 28:73–82. doi: 10.1016/0169-2046(94)90045-0
17. Wright DH, Patterson BD, Mikkelson GM, Cutler A, Atmar W A. comparative analysis of nested subset patterns of species composition. Oecologia (1997) 113:1–20. doi: 10.1007/s004420050348
18. Andrén H. Can one use nested subset pattern to reject the random sample hypothesis? Examples from boreal bird communities. Oikos (1994) 70:489–91. doi: 10.2307/3545790
19. Higgins L C, Willig MR, Strauss RE. The role of stochastic processes in producing nested patterns of species distributions. Oikos (2006) 114:159–67. doi: 10.1111/j.2006.0030-1299.14720.x
20. Hylander K, Nilsson C, Gunnar Jonsson, B, Göthner T. Differences in habitat quality explain nestedness in a land snail meta-community. Oikos (2005) 108:351–61. doi: 10.1111/j.0030-1299.2005.13400.x
21. Dupont YL, Hansen DM, Olesen JM. Structure of a plant–flower-visitor network in the high-altitude sub-alpine desert of Tenerife, Canary Islands. Ecography (2003) 26:301–10. doi: 10.1034/j.1600-0587.2003.03443.x
22. Guimarães PR, Rico-Gray V, Dos Reis SF, Thompson JN. Asymmetries in specialization in ant–plant mutualistic networks. Proc R Soc Lond B Biol Sci. (2006) 273:2041–7. doi: 10.1098/rspb.2006.3548
23. Lewinsohn TM, Inácio Prado P, Jordano P, Bascompte J M, Olesen J. Structure in plant–animal interaction assemblages. Oikos (2006) 113:174–84. doi: 10.1111/j.0030-1299.2006.14583.x
24. Ollerton J, McCollin D, Fautin DG, Allen GR. Finding NEMO: nestedness engendered by mutualistic organization in anemonefish and their hosts. Proc R Soc Lond B Biol Sci. (2007) 274:591–8. doi: 10.1098/rspb.2006.3758
25. Thompson JN. Mutualistic webs of species. Science (2006) 312:372–3. doi: 10.1126/science.1126904
26. Brualdi RA, Sanderson JG. Nested species subsets, gaps, and discrepancy. Oecologia (1999) 119:256–64. doi: 10.1007/s004420050784
27. Gotelli NJ, Entsminger GL. Swap and fill algorithms in null model analysis: rethinking the knight's tour. Oecologia (2001) 129:281–91. doi: 10.1007/s004420100717
28. Miklós I, Podani J. Randomization of presence-absence matrices: comments and new algorithms. Ecology (2004) 85:86–92. doi: 10.1890/03-0101
29. Bayati M, Kim JH, Saberi A. A sequential algorithm for generating random graphs. Algorithmica (2010) 58:860–910. doi: 10.1007/s00453-009-9340-1
30. Holmes R, Jones L. On uniform generation of two-way tables with fixed margins and the conditional volume test of Diaconis and Efron. Ann Stat. (1996) 24:64–8. doi: 10.1214/aos/1033066199
31. Chen Y, Diaconis P, Holmes SP, Liu JS. Sequential Monte Carlo methods for statistical analysis of tables. J Am Stat Assoc. (2005) 100:109–20. doi: 10.1198/016214504000001303
32. Greenhill C, McKay BD, Wang X. Asymptotic enumeration of sparse 0–1 matrices with irregular row and column sums. J Comb Theory A (2006) 113:291–324. doi: 10.1016/j.jcta.2005.03.005
33. Canfield ER, Greenhill C, McKay BD. Asymptotic enumeration of dense 0–1 matrices with specified line sums. J Comb Theory A (2008) 115:32–66. doi: 10.1016/j.jcta.2007.03.009
34. Miller JW, Harrison MT. Exact sampling and counting for fixed-margin matrices. Ann Stat. (2013) 41:1569–92. doi: 10.1214/13-AOS1131
35. Johnson SC. Hierarchical clustering schemes. Psychometrika (1967) 32:241–54. doi: 10.1007/BF02289588
36. Gavish M, Nadler B, Coifman RR. Multiscale Wavelets on Trees, Graphs and High Dimensional Data: Theory and Applications to Semi Supervised Learning. In: ICML'10 Proceedings of the 27th International Conference on International Conference on Machine Learning (2010) Haifa. p. 367–74.
37. Coifman RR, Gavish M. Harmonic analysis of digital data bases. In: Cohen J Zayed A. editors. Wavelets and Multiscale AnalysisWavelets and Multiscale Analysis. Springer (2011). p. 161–197.
38. Chi EC, Allen GI, Baraniuk RG. Convex biclustering. Biometrics (2017) 73:10–19. doi: 10.1111/biom.12540
39. Fushing H, McAssey MP. Time, temperature, and data cloud geometry. Phys Rev E (2010) 82:061110. doi: 10.1103/PhysRevE.82.061110
40. Balasubramaniam K, Beisner B, Guan J, Vandeleest J, Fushing H, Atwill E, et al. Social network community structure and the contact-mediated sharing of commensal E. coli among captive rhesus macaques (Macaca mulatta). PeerJ. (2018) 6:e4271. doi: 10.7717/peerj.4271
41. Gong K, Zhou J, Tohme M, Judenhofer M, Yang Y, Qi J. Sinogram Blurring Matrix Estimation From Point Sources Measurements With Rank-One Approximation for Fully 3-D PET. IEEE Trans Med Imaging (2017) 36:2179–88. doi: 10.1109/TMI.2017.2711479
42. Gong K, Cherry SR, Qi J. On the assessment of spatial resolution of PET systems with iterative image reconstruction. Phys Med Biol. (2016) 61:N193. doi: 10.1088/0031-9155/61/5/N193
43. Gong K, Guan J, Kim K, Zhang X, Fakhri GE, Qi J, et al. Iterative PET image reconstruction using convolutional neural network representation. arXiv [preprint] (2017) arXiv:171003344. Available online at: https://arxiv.org/abs/1710.03344
44. Li C, Tam PKS. An iterative algorithm for minimum cross entropy thresholding. Pattern Recogn Lett. (1998) 19:771–6. doi: 10.1016/S0167-8655(98)00057-9
Keywords: Data Mechanics, minimum energy macrostate, permutation invariant, matrix mimicking, nestedness
Citation: Guan J and Fushing H (2018) Coupling Geometry on Binary Bipartite Networks: Hypotheses Testing on Pattern Geometry and Nestedness. Front. Appl. Math. Stat. 4:38. doi: 10.3389/fams.2018.00038
Received: 19 March 2018; Accepted: 10 August 2018;
Published: 25 September 2018.
Edited by:
Hau-tieng Wu, Duke University, United StatesReviewed by:
Ronen Talmon, Technion-Israel Institute of Technology, IsraelGi-Ren Liu, National Cheng Kung University, Taiwan
Willem Van Den Boom, National University of Singapore, Singapore
Copyright © 2018 Guan and Fushing. This is an open-access article distributed under the terms of the Creative Commons Attribution License (CC BY). The use, distribution or reproduction in other forums is permitted, provided the original author(s) and the copyright owner(s) are credited and that the original publication in this journal is cited, in accordance with accepted academic practice. No use, distribution or reproduction is permitted which does not comply with these terms.
*Correspondence: Hsieh Fushing, ZmhzaWVoQHVjZGF2aXMuZWR1