 Xavier Fernández-i-Marín
- Department of Political Science, LMU Munich, Munich, Germany
The article proposes a method for producing configurations of values in firms. Values have an impact in the long-term survival of businesses and guide managerial decision-making. The method produces cross-comparable latent rates of configurations of values. Data comes from a pool of 37 firms rated by both experts and ignoramus. By using Bayesian inference and Markov Chain Monte Carlo Methods the researcher can tune the expert rater bias. This generates robust estimates using a clear, overt and systematic procedure. The scores produced by the model are compared with a simple average of all raters.
1. Introduction
Would you invest in a company that produces an environmentally friendly product following strict social and ethical standards, but whose profitability is weak? Would you work for a company that generates profits at the expense of using its employees as a mere labor force, with no long-term plans? Would you buy products of a company that sells them very cheap, but at the expense of environmental costs? The way in which companies internalize the motives, aspirations, and values of their environment (investors, employees, and consumers) reflects its own configuration of values and it allows to predict its long-term survival. A non-balanced configuration of values, namely, one that puts economic profit above all and discards any social concern or any respect for its employees, is problematic for the management of a long-term project. The rational is that certain configurations of the values can help predict the sustainability of businesses in the long run [1–3]. Extracting the configurations of values that are representative in a company is a convenient task for any manager, in order to both address day-to-day issues and to project mid and long-term evolution of the firm.
The objective of the article is to present a system to extract configurations of values for several firms deeply analyzed in the context of a large-scale European research project on user-innovation and sustainability1. The process, however, must deal with two features that are relevant to allow its generalization: cross-comparison and expert weight. First, in order to use configurations of values as explanatory variables in other contexts (say, to predict business performance, business survival, business alignment with societal values, etc…), it must be assured that cross-comparison between cases is possible and rigorous [4, 5]. Second, when incorporating information from several sources, it must be possible to weight its value between sources that are experts on specific cases and sources that have only superficial knowledge about them. In this case, it must be assured that expert elicitation and ignoramus are properly weighted [6].
The article proposes a method that extracts configurations of values from firms by combining assessments performed by several individuals. By doing so, the model makes an empirical contribution to measurement research by combining the following features: First, values are not directly measurable, but only guessed, so the model is explicit about the latent nature of such construct. Second, the method overtly deals with information provided by experts, to whom more reliability is assigned a priori vis- -vis information provided by ignoramus, whose input is also considered and weighted accordingly. Third, the method uses a “brute force” approach to extract the signal contained in the raters of several individuals. It relies on having rates from several sources (even if they are less reliable than experts) than a single (expert) source. In this sense, the potential lack of precision, the subjectivity of the experts, and the cross-expert comparison is weighted using raters that, without being experts, provide both the anchor for the cross-comparison between cases and the necessary amount of data. To sum up, using lots of noisy data, conveniently and systematically treated using a model, provides a way to generate robust estimation for a measurement scenario, in this case finding configurations of values in a firm.
The paper proceeds as follows: The first section presents the case studies that have been rated and the second how the task was performed. Then follows a presentation of the data and the procedures to extract values. The results of the procedures follow, along with a discussion of their implications. Conclusions are provided at the end.
2. Case Studies
The case studies that comprise the corpus of the EU-InnovatE project are business selected employing a multiple case study design [7] and theoretically sampled following several criteria:
• The innovation creates economic plus social and/or ecological value, thereby enhancing sustainable lifestyles.
• The process, that includes invention and commercialization, is driven by a single user or a group of users.
• All phases of the user sustainability innovation process are covered.
• Covers geographical location (European regions, namely Nordic, Central, Eastern, and Southern Europe)
• Covers domain (namely, food, mobility, energy, and living–housing).
All in all, there are 37 case studies of user-driven innovations. Seventeen of them are within big firms and the remaining 20 are cases of entrepreneurship. The complete list of case studies and their characteristics is shown in Table 1.
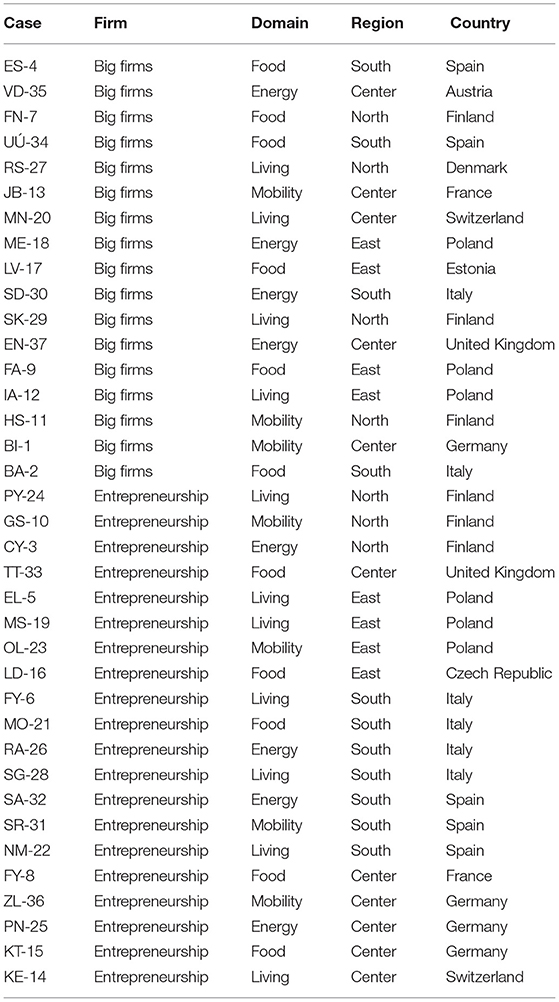
Table 1. Case studies.
3. Value Rating and Assessment
Data was collected using a web application (see the Appendix in Data Sheet 1 for a screenshot). Every rater encountered a webpage with a list of 30 values. The 30 values come from a theoretical model called Management by Values developed by Dolan et al. [1] and are organized in tree groups (called axes), namely Economic-Pragmatic, Emotional-Developmental, and Ethical-Social. This division has been tested and validated using several empirical methods [8, 9]. Recently, it has been used to assess differences in the culture and values of public service organizations in old and new EU member states [3].
The values and the axis they belong to are presented in the Appendix in Data Sheet 1.
The raters were asked to do the following:
Pick values from the original list and give them integer numbers, assigning a total of 10 points. So if you give 8 points to value A you can only assign the rest of the 2 points either to a single other value (B) or to two different values (C and D, with 1 point each).
The raters did not know which whether each specific value was in the Economic-Pragmatic, the Emotional-Developmental or the Ethical-Social axis.
Given the long list of values (30 individual values grouped in 3 axes), researchers assigned values to appear randomly in the screen every time the browser was refreshed, in order to avoid favoring or penalizing values at the top or the bottom of the list.
3.1. Combination of Raters
There were 2 different raters for each of the case study:
• Ignoramus: 4 fixed raters (JB-08, RF-13, BN-02, and LT-10) gave the anchor of the baseline values for comparison between cases and rated all the cases.
• Expert: One of the raters is the original author of the case, if reachable. If not, a colleague that participated in the writing of the original report. There were 13 raters of the original case studies, as some of them rated more than one case.
4. Data
4.1. Structure
As a result of this data collection process a dataset with a total of 1,305 observations has been obtained, comprising rates for each of the specific 30 possible values asked, for different raters and case studies.
With this data the values of the individual values have been aggregated in the tree groups of values (Economic-Pragmatic, Emotional-Developmental, and Ethical-Social) adding the scores given to each value to the respective group of values. For instance, a rater that has given 2 to competitiveness, 1 to economic success and 7 to creative energy is aggregated into 0.3 for Economic-Pragmatic (as the addition of 2+1 of the two values in that group) and 0.7 to Emotional-Developmental. So the data to be treated comprises a total of 555 observations in 37 case studies, where each case study (c) contains 15 data points [5 raters (r) * 3 axes of values (g)], where the sum of the percentage of axes of values within case study and rater must add up to one. Table 2 shows a sample of observations for illustration purposes.
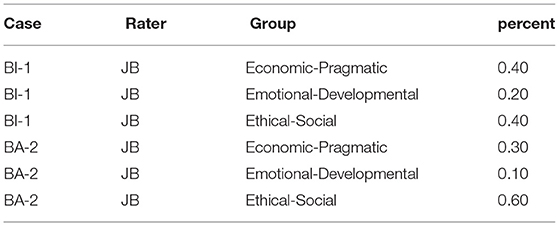
Table 2. Example of the dataset. The sum of the percentages within rater and case must add up to one.
4.2. Descriptive Statistics
The most basic descriptive distribution of the data is shown in Figure 1. It shows the distribution of case means by axes of values. The means are calculated using the 5 different rates that rate each case (4 global raters and 1 variable, which is the original author of the case). SR-31 is the case with a highest rated axis, at almost 3/4 of the configuration of values in the Economic-Pragmatic pole. The lowest band is mainly coped with Emotional-Developmental cases (ME-18, U-34, SG-28, SA-32), but also one very low configuration of Ethical-Social values at CY-3.
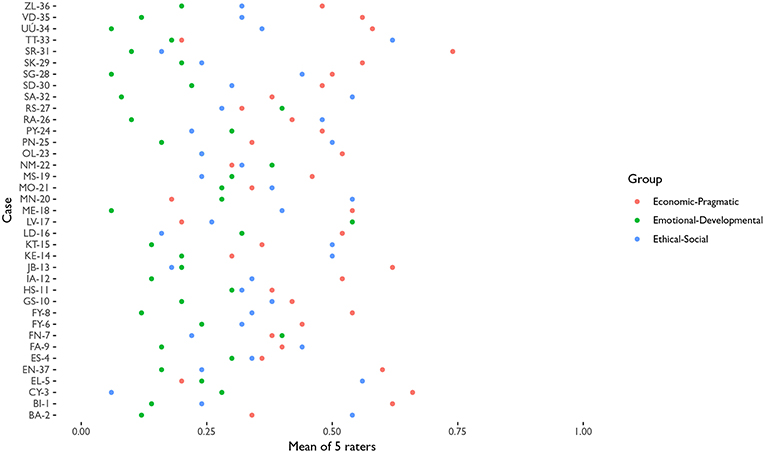
Figure 1. Average rate of the cases (mean of the 5 raters when rating each case), by axis of values.
4.3. Inter-Rater Agreement
Inter-rater agreement can not be assessed using traditional correlation-based approaches, as the cases and axis are not rated independently. That is, correlations assume that each observation is independent from the rest, but in this case the raters were asked to provide configurations. So giving more weight into one value meant that less weight was provided to a different value. Therefore, an agreement rate is defined simply as one minus the standard deviation of the 5 rates [Agreementc, g = 1 − sd(ratec, g)] between raters for each case study and axis of values. This measure is directly interpretable in terms of percent of agreement. So a 0.9 agreement means that, on average, for that case and that specific axis of values the configuration varies by (1−0.9) 10 percent between raters.
Figure 2 presents the agreement rates of each case and axis of values. It shows that most of the cases have agreement rates above 75 percent, with some cases having one of the groups of rates between 65 and 75 percent. The lowest agreement happens on the Economic-Pragmatic configuration of ZL-36, where 60 percent of agreement is reached.
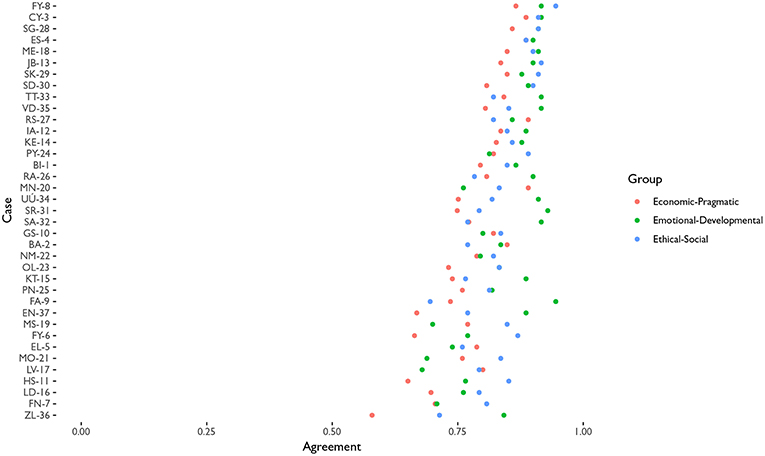
Figure 2. Distribution of agreement rates between raters by case and axis of values.
5. Estimation of Configurations of Values
The extraction of the concrete configuration of values for each case study is performed using a latent variable model. Equation (1) describes the model used to extract the distribution of rates for each axis of values in each case, where yc, r, g are the aggregated responses of each rater r to a case c and axis of values g (column “percent” in Table 2). A visual representation of the model and the relationships between parameters is also depicted in Figure 3.
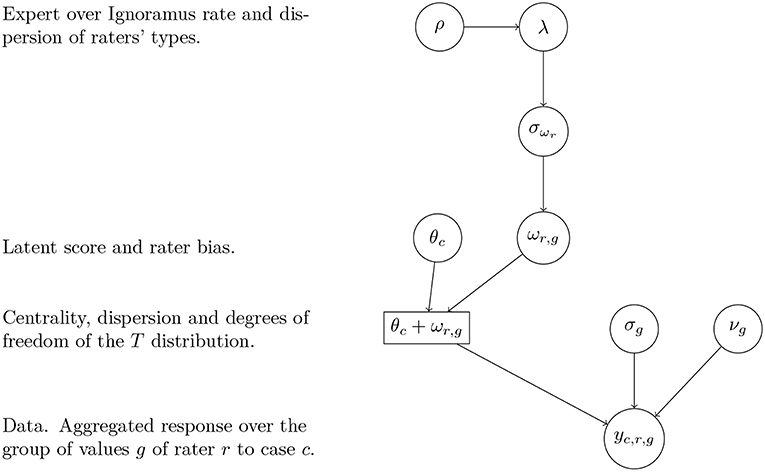
Figure 3. Directed Acyclic Graph of the connections between the parameters to estimate and the data (yc, r, g).
The response (that is, each of the rater's sum of values that belong to the Economic-Pragmatic axis, to the Emotional-Developmental and to the Ethical-Social, shown in Table 2) is modeled using a scaled and shifted T distribution (essentially, a T distribution with centrality and dispersion parameters that are allowed to vary from the mean zero and variance one solution of the standard T distribution) that allows to control for extreme cases. Therefore, this is a robust model that gives less weight to rates that depart substantially from the average. The mean of the response is the addition of the latent configuration of values (which represent the main parameters of interest, θ, the unobserved true value of every case in each group of values) and a rater bias (accounted by ω). The latent configuration of values θ is modeled using a Dirichlet distribution (the multivariate generalization of the beta distribution), which is a functional form that restricts the sum of its parameters to one. This is convenient because the restriction of the configuration of the values is that their sum has to be equal to 1.
The ω parameters control the rater bias, which is extracted from the model based on the comparison of what every rater does in general, compared to the rest of the raters. However, it is expected a priori that the expert raters will be more accurate in their evaluations of the cases (accounted with different accuracies captured by λ), so the prior standard deviations of the rater bias varies depending on whether the rater is an expert or an ignoramus.
The ρ parameter is the weight of the certainty of experts over ignoramus. But it can also be seen as a sort of tuning parameter to assess the validity of different model specifications giving different weights to the experts over ignoramus, with the following possibilities:
• If it is given the prior in the model (its log is distributed uniformly), it acts as an evaluator of what the data tells about the strength of the quality of experts over ignoramus.
• But also ρ can be given a more restrictive prior that incorporates specific knowledge about the subject in the specific setting that the model is applied. For instance, a bounded normal centered on more or less than one to give more weight to one group of raters over another.
• In the extreme, ρ can be fixed to any value that the researcher wants. For instance, when ρ = 1 the researcher assumes that no priority must be given to any specific rater. Also running the model with different fixed values would allow to validate different model specifications.
So, to sum up, the validity of the model can be judged by using an internal parameter to the model (ρ), that acts like a meta-parameter and depending on its prior specification it either estimates the relationship between experts and ignoramus (as shown hereafter) or evaluates it.
Table 3 summarizes the meaning and interpretation of the parameters to be estimated.
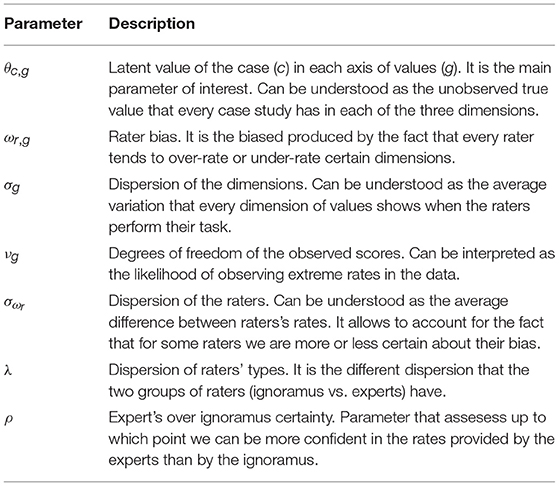
Table 3. Parameter labels and their meanings.
The model specification implies performing inference for a total of 185 parameters: 37 * 3 = 111 latent configurations of values (θ), 17 * 3 = 51 rater biases (ω), 3 error components (σ), 3 degrees of freedom for the robust model specification (ν) and 17 for the error components of the rater biases (σω). Recall that the total number of data points is 555, which makes a ratio of three data points observed for every parameter to be estimated (555/185).
A model with the previous specification (hierarchical structure of the hyper-parameters) is difficult to estimate using classical frequentist approaches, but fits naturally in the Bayesian paradigm, where prior distributions can account for the nested structure of the hyper-priors and the low ratio of data over parameters. Therefore, Bayesian inference is used to extract the posterior distributions of the parameters of interest. More specifically, the parameters are obtained using MCMC (Markov chain Monte Carlo methods) using a Gibbs sampler. JAGS [10] has been used for the estimation (code available in the Appendix in Data Sheet 1). The chains have been analyzed under R [11] using the ggmcmc [12] package. A total of 2,000 samples of two chains of simulated posteriors have been acquired under different initial values, with a burn-in period of 10,000 and thinning by 10. There is no evidence of non-convergence of the series according to the Geweke test or the potential scale reduction factor [13, 14] (see the online appendix for the full report of convergence diagnostics and visualization of posterior distributions of all the parameters).
Bayesian models require the researcher to provide prior distributions of the parameters of the model. Equation (1) shows that in general weakly informative priors were assigned. The only priors worth mentioning are those assigned to the θ distribution. In this case, the prior implies that the researcher expects that the configuration of values will be equally spread across axes of values (1/3 for each of the 3 axes of values), with an interquartile range between 13 and 50 percent for each of the axes. The remaining parameters have Uniform (U), Normal (Gaussian, N), and Gamma (G) prior distributions.
6. Results and Discussion
6.1. Configurations of Values
Figure 4 shows the mean and credible intervals (90 and 95 percent, with thick and thin lines, respectively) of the main parameters of interest, θ, which represent the latent value for the ratings in each of the cases and axes of values.
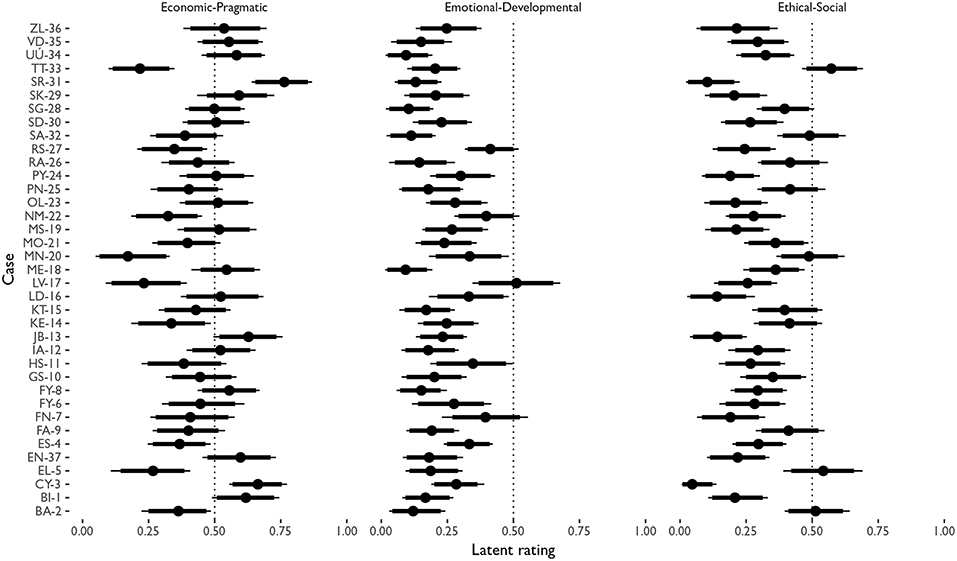
Figure 4. Caterpillar plot showing the mean (dot) and credible intervals (90 and 95 percent with thick and thin lines, respectively) of the posterior densities of θ. The dots represent the point estimate expected value of that specific case and axis of values in the latent configuration of values. The lines represent the credible intervals at standard margins of uncertainty.
Credible intervals are the Bayesian analogous to confidence intervals, but in this case no assumptions about sampling are done, and credible intervals do not have to be symmetric or follow other distributional assumptions. The figure can be read as follows: ZL-36 has a configuration of values distributed as (approximately) 55 percent Economic-Pragmatic, 25 percent Emotional-Developmental and 20 percent Ethical-Social. Compared to ZL-36, VD-35's Economic-Pragmatic percent is more certain (as its uncertainty band covers less space).
6.2. Rater Bias
Figure 5 shows the mean and credible intervals (90 and 95 percent, with thick and thin lines, respectively) of the rater biases, ω, which represent the amount of bias that is expected for each rater compared to the latent value in each of the cases and axes of values.
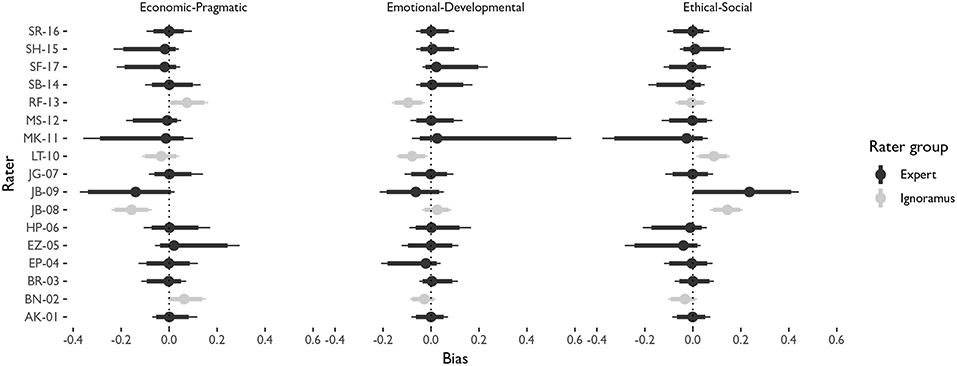
Figure 5. Caterpillar plot showing the mean (dot) and credible intervals (90 and 95 percent with thick and thin lines, respectively) of the posterior densities of ω. The dots represent the point estimate expected value of the rater bias for that specific case and axis of values in the latent configuration of values. The lines represent the credible intervals at standard margins of uncertainty.
The figure shows that global raters (those who rate all cases) have substantially lower uncertainties in their biases, as their behavior is extracted from many more observations. On the other side, raters such as MK-11, who only rated one case, show a much more uncertain bias.
6.3. Sensitivity Analysis
A sensitivity analysis of the role of priors is shown in Figure 6. The Figure shows the comparison between the fixed prior with another model with hyper-priors, letting the model decide whether the rates of the cases in the “Economic-Pragmatic” start from a higher or lower probability. If hyper-priors are used the model tends, not surprisingly, to shrink all rates toward the mean of the axis. This is a feature that may be useful for explanatory models, but in this case, where the objective is to measure the latent distribution of the configuration of values, it does not add much value.
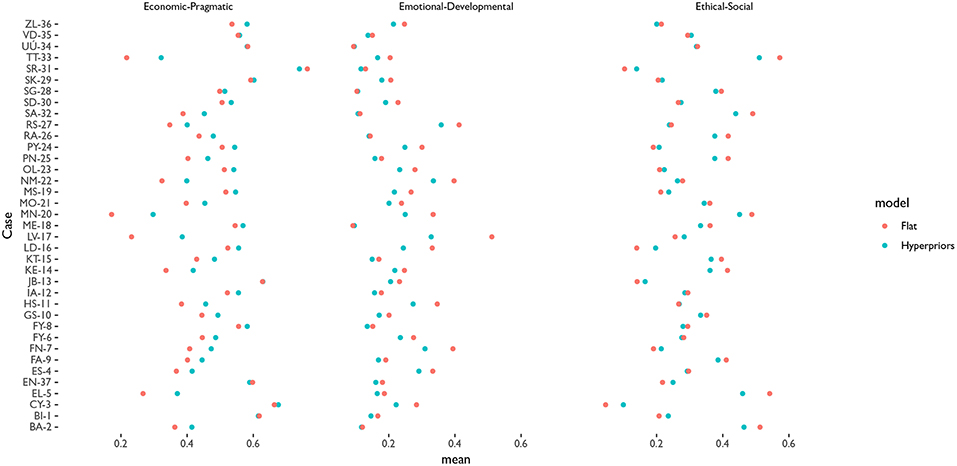
Figure 6. Comparison between the estimated latent configurations of values between the model with flat priors and the model with hyperpriors for each axis of values.
Compared to a model-based approach that takes into consideration rater bias or proper configuration of values adding up to one, the plain means tend to produce higher values for the Economic-Pragmatic axis of values and lower values for the Ethical-Social axis. Figure 7 shows the comparison of the cases estimated by the model (in the vertical axis) and the averages of raters (in the horizontal axis), for the three groups of raters.
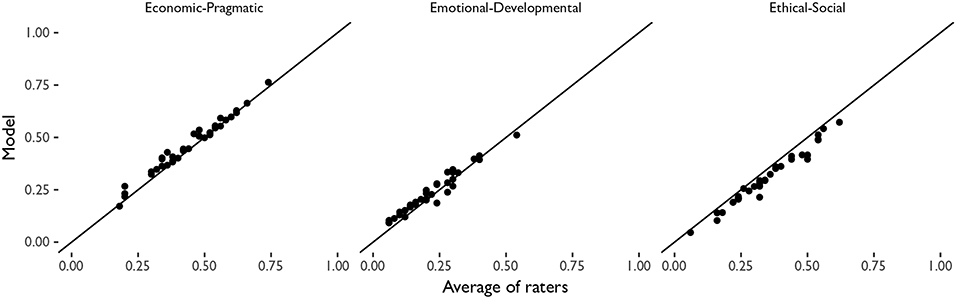
Figure 7. Comparison between the configurations of values obtained using a model-based approach (vertical axis) and a plain average of raters (horizontal axis), for each axis of values.
Figure 8 shows a comparison of the rates between the model-based approach weighting several raters and the single value provided by the original authors of the report. In this case, the original author tends to underestimate the rates for each of the axes when the model-based approach gives it low rates as well, while at the same time overestimates the rates when the case study has a high value in that axis of values. In other words, relying only on the original author of the case study would imply underrating cases with low values and overrating cases with high values. This effect is specially strong in the Emotional-Developmental axis when original authors have rated those cases as high. The implications of this finding are important, as they highlight the fact that when an expert is not accurate, it systematically not accurate (not randomly). That is, the ratings of the expert are higher in the Emotional-Developmental axis very likely because of the emotional involvement with the subject being rated, as this is not happening when rating analytical dimensions. Weighting by different raters allows us to overcome the problem that experts are humans also, and have feelings and emotions, and even when they act as experts they are not emotional-free.
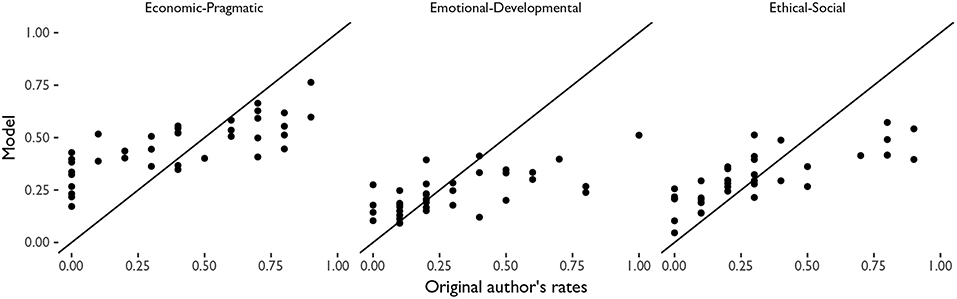
Figure 8. Comparison between the configurations of values obtained using a model-based approach (vertical axis) and the original author's rate (horizontal axis), for each axis of values.
Finally, on sensitivity analysis with regards to initial model specifications. Figure 9 shows the estimated ratio of ρ, the tuning parameter for expert weight over ignoramus. It shows that although experts are assigned to have a stronger concentration of mass around zero bias, the difference with ignoramus is not specially acute. In fact, the prior standard deviation for the biases is 0.069 for ignoramus and 0.043 for experts, making a ratio of 1.6, which means that for each expert rate it takes a bit more than one and a half ignoramus over making the same rate to overcome its judge. In other words, every expert is worth 1.6 ignoramus in this context. Based on this, the value of expert judgement is not highly appreciated, which stresses again the idea that having less than two ignoramus performing a rate of a case will provide more accurate information than a single expert.
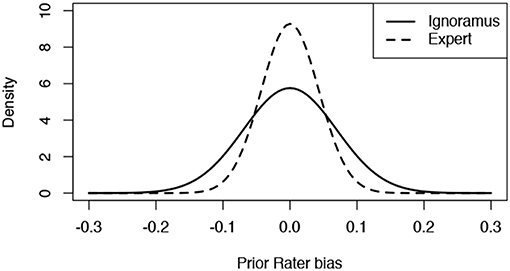
Figure 9. Prior for rater biases as estimated by the model using ρ.
7. Configurations of Values
Another way to look at the substantial results of the configurations of values is to extract the means and generate the culture of values. The tri-axial model of MSIV proposes that the combination of the three axes of values (Economic-Pragmatic, Emotional-Developmental, and Ethical-Social) generates organizational cultures when they interact, in the following way:
• Sensitivity: the combination of Ethical-Social and Emotional-Developmental values.
• Survival: the combination of Economic-Pragmatic and Ethical-Social values.
• Innovation: the combination of Economic-Pragmatic and Emotional-Developmental values.
Based on this model, the configurations of the different cultures at the case studies analyzed are represented at Figure 10. The figure shows that half of the cases have a quite balanced configuration of values, which is the appropriate output for long-term success. However, there are some departures. Most of the departures have either a focus on sensitivity (upper-left area) or on innovation (upper-right area), but the survival area is the least variable. This is not surprising, but highlights an important aspect for managers and decision-makers: the fact that for a firm to succeed in the long run some sort of combination of Economic-Pragmatic and Ethical-Social values is helpful. And only afterwards the firm can seek to position itself as an either leading business in innovation or in sensitivity, but not both dimensions at the same time.
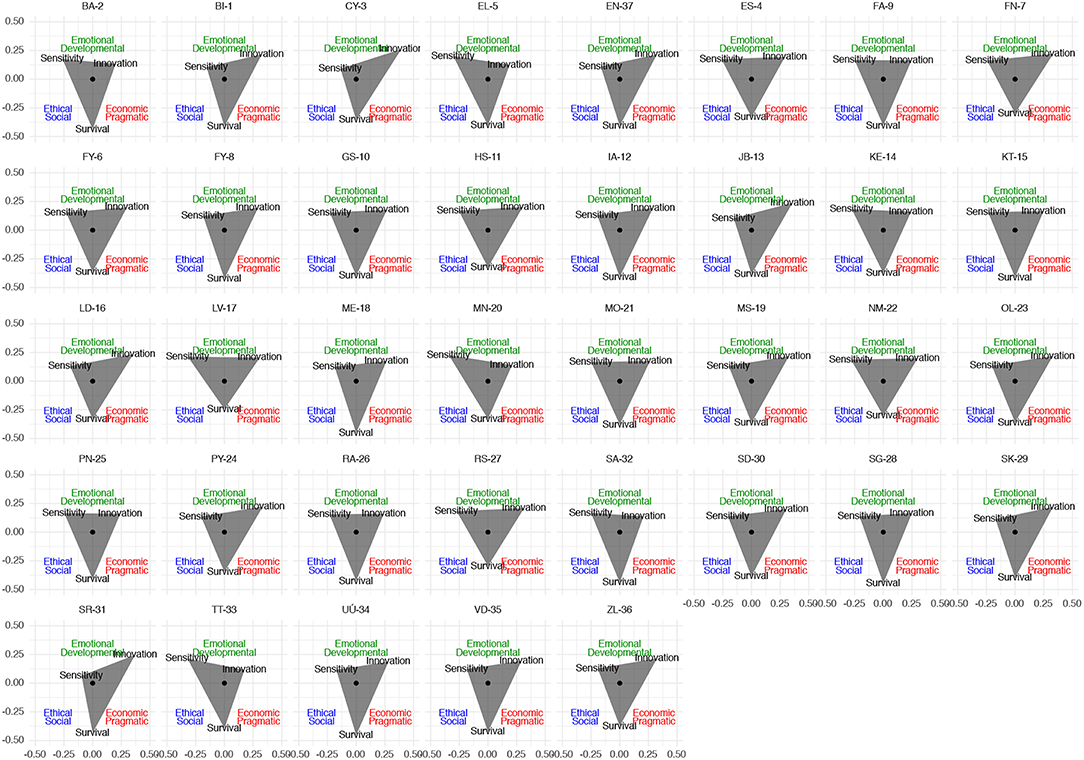
Figure 10. Configuration of the different organizational cultures of the case studies.
7.1. Classification
Based on the configuration of cultures in the case studies, a cluster analysis has been performed. Figure 11 shows the dendrogram of the distribution of case studies using a hierarchical clustering method with euclidean distances between the configurations of values in the cases. The figure shows that there are clearly two different groups according to their organizational culture. The dendrogram can be interpreted as follows: two cases that are very similar will be linked by a structure that has a very small vertical distance. For instance, MS-19 and OL-23 have a tie with a very small vertical distance. On the contrary, when vertical distances are high, this can be read as a lot of difference between the two units or groups of units. One example of this is at the left-hand side of the dendrogram, where the cluster between SR-31, CY-3, and JB-13 is quite different from the other group of cases (formed by a cluster of two big groups).
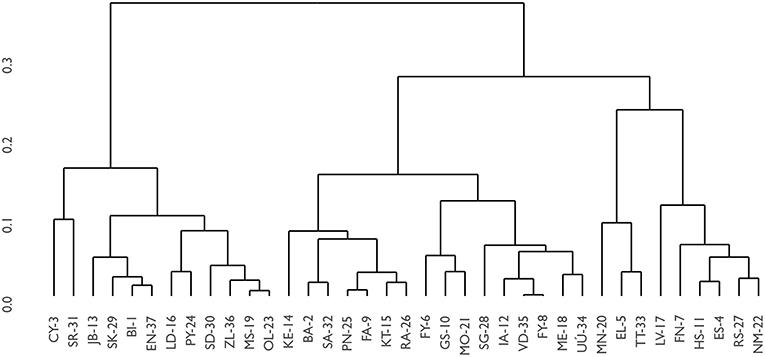
Figure 11. Dendrogram of the classification of organizational cultures of the case studies.
Figure 12 shows the distribution of variables that identify the cases and variables that define the clusters when the number of clusters is set at the number of clusters suggested by a model-based approach based on a comparison of several different cluster analysis models based on EM for a parameterized Gaussian mixture models [15]. Specifying 5 clusters maximizes the Bayesian Information Criterion.
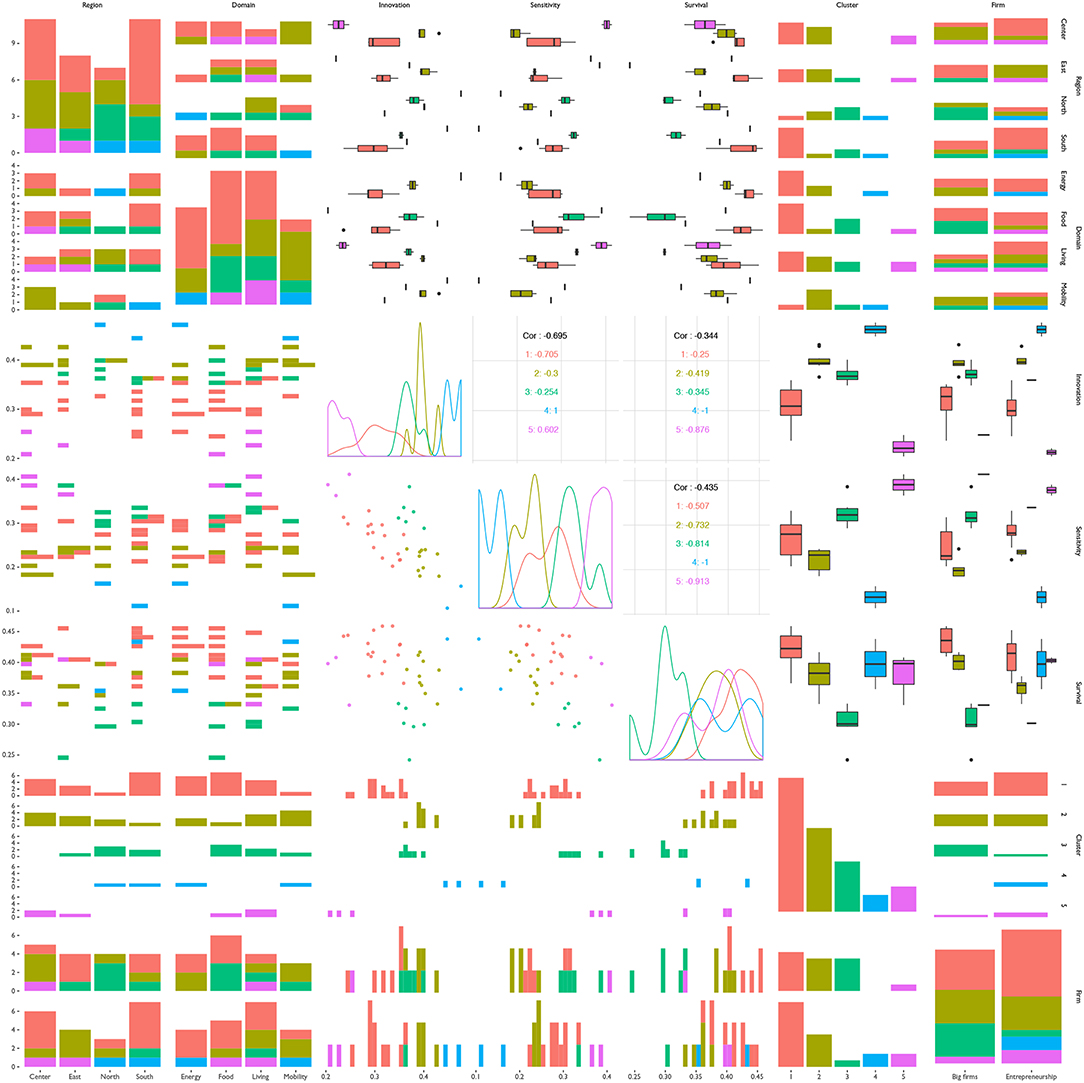
Figure 12. Pair plot between the variables that identify the cases (Country, Domain, WP), the variables that define the clusters (Innovation, Sensitivity, and Survival) and the identification of clusters (Cluster). The figure allows to understand the characteristics of every of the clusters involved. The diagonal of the matrix of plots contains the descriptive representations of the variables (for instance, boxplots for a categorical variable, and density plots for continuous ones). And the off-diagonal plots represent the bivariate associations (scatterplots in the three continuous/continuous variables, boxplots in the continuous/categorical and barplots in the categorical/categorical).
According to the distribution of values and characteristics, the 5 clusters in which case studies are organized naturally are defined by the following:2
• #1: High survival, mean sensitivity, and mean innovation, with no specific preference for a concrete domain or type of firm. Most of the cases belong to this cluster.
• #2: Low or mean survival, mean to high sensitivity, and mean innovation, mostly in the food and living domains but no preference for type of firm.
• #3: Few cases, with mean survival, low sensitivity, and very high innovation, either in the energy or mobility domain, and a slight preference toward entrepreneurship.
• #4: Similar to #1, but with low innovation; mostly energy or food cases, with no mobility, and mostly on entrepreneurship.
• #5: Similar to #3, but instead of low sensitivity and high innovation this one has very high sensitivity and very low innovation, with cases on the food and living domain and a slight inclination toward entrepreneurship.
8. Conclusions
Assessing which values are more present in a specific institution (in this case, firms and entrepreneurial projects that contain innovations addressed toward sustainability) is a challenging measurement problem that involves dealing with expert rating, subjectivity and cross-comparison. The proposed model-based approach takes into account several of those challenges by providing an overt and systematic set of assumptions, namely: by nature values are not obvious but latent, so a measurement model is more suited; rater bias may be modeled differently for experts than for individuals with no previous knowledge; it is possible for the researcher to tune the expert to ignoramus weight to accommodate the fact that raters do not always rate something that are very familiar with.
The concrete implementation of the model has lead to a result that produces lower values for Economic-Pragmatic values and higher Ethical-Social, when compared to the plain mean of the raters. Also, it tends to provide lower weight to extreme values given by the experts when those are not aligned with the rest of the ignoramus raters, specially in the Emotional-Developmental axis. The final configuration of cultures in each of the analyzed firms leads to four different clusters of configurations, from which the most persistent is the survival culture. In addition to this, some firms have very high values on innovation or on sensitivity, but those features do not go together, and most of those cases are present in entrepreneurship projects, not in big firms.
Author Contributions
The author confirms being the sole contributor of this work and has approved it for publication.
Funding
This project has received funding from the European Union's Seventh Framework Programme for research, technological development, and demonstration under grant agreement no 613194.
Conflict of Interest Statement
The author declares that the research was conducted in the absence of any commercial or financial relationships that could be construed as a potential conflict of interest.
Acknowledgments
We want to acknowledge the gradings of the raters involved in the process, as well as comments on presentations of the results that helped framing the paper in earlier stages.
Supplementary Material
The Supplementary Material for this article can be found online at: https://www.frontiersin.org/articles/10.3389/fams.2019.00012/full#supplementary-material
Footnotes
2. ^ Recall that work packages identify either cases within big firms (WP 3) or new entrepreneurship cases (WP 4).
References
1. Dolan SL, Garcia S, Richley B. Managing by Values: A Corporate Guide to Living, Being Alive, and Making a Living in the 21st Century. Palgrave Macmillan (2006).
2. Brillo J, Marin Kawamura K, Dolan SL, Fernández-i-Marín X. Managing by sustainable innovational values (msiv): an asymmetrical culture reengineering model of values embedding user innovators and user entrepreneurs. J Manage Sustainabil. (2015). 5:61–73. doi: 10.5539/jms.v5n3p61
3. Capell B, Kubra Canhilal S, Alas R, Sommer L, Ossenkop C. Mapping values in old vs new members of the European Union: a comparative analysis of public sector cultures. Cross Cult Manage. (2013) 20:503–27. doi: 10.1108/CCM-02-2013-0030
4. Hofstede GH. Culture's Consequences: Comparing Values, Behaviors, Institutions and Organizations Across Nations. Thousand Oaks, CA: Sage (2001).
5. Kolpakov A. Developing cross-cultural frame-work for public service motivation. In: International Public Service Motivation Research Conference. Bloomington, IN (2009). p. 7–9.
6. Martin TG, Burgman MA, Fidler F, Kuhnert PM, Low-Choy S, McBride M, et al. Eliciting expert knowledge in conservation science. Conserv Biol. (2012) 26:29–38. doi: 10.1111/j.1523-1739.2011.01806.x
7. Yin RK. Case Study Research: Design and Methods. 4th ed. Thousand Oaks, CA: Sage Inc., CA (2009).
8. Dolan SL. Coaching by Values (CBV): A Guide to Success in the Life of Business and the Business of Life. iUniverse (2011).
9. Abbot G, White F, Charles M. Linking values and organizational commitment. J Occup Organ Psychol. (2005) 78:531–51. doi: 10.1348/096317905X26174
10. Plummer M. JAGS: a program for analysis of Bayesian graphical models using Gibbs sampling. In: Proceedings of the 3rd International Workshop on Distributed Statistical Computing. Vienna (2003).
11. R Development Core Team. R: A Language and Environment for Statistical Computing. Vienna (2017). Available online at: http://www.R-project.org
12. Fernández-i Marín X. ggmcmc: analysis of MCMC samples and Bayesian inference. J Stat Softw. (2016) 70:1–20. doi: 10.18637/jss.v070.i09
13. Geweke JF. Evaluating the accuracy of sampling-based approaches to the calculation of posterior Moments. In: Berger JO, Bernardo JM, Dawid AP, Smith AFM, editors. Bayesian Statistics 4. Oxford, UK: Clarendon Press (1992).
14. Gelman A, Carlin JB, Stern HS, Rubin DB. Bayesian Data Analysis. 2nd ed. Boca Raton, FL: Chapman & Hall/CRC (2003).
Keywords: values, expert coding, non-expert coding, expert rater bias, Bayesian inference
Citation: Fernández-i-Marín X (2019) Extracting Configurations of Values Mixing Scores From Experts and Ignoramus Using Bayesian Modeling. Front. Appl. Math. Stat. 5:12. doi: 10.3389/fams.2019.00012
Received: 28 July 2017; Accepted: 05 February 2019;
Published: 04 March 2019.
Edited by:
Pietro Cipresso, Istituto Auxologico Italiano (IRCCS), ItalyReviewed by:
Antonio Calcagnì, University of Padova, ItalyDimitri Ognibene, University of Essex, United Kingdom
Ingo Fründ, York University, Canada
Copyright © 2019 Fernández-i-Marín. This is an open-access article distributed under the terms of the Creative Commons Attribution License (CC BY). The use, distribution or reproduction in other forums is permitted, provided the original author(s) and the copyright owner(s) are credited and that the original publication in this journal is cited, in accordance with accepted academic practice. No use, distribution or reproduction is permitted which does not comply with these terms.
*Correspondence: Xavier Fernández-i-Marín, eGF2aWVyLmZlcm5hbmRlei1pLW1hcmluQGdzaS51bmktbXVlbmNoZW4uZGU=