 Suman Saha
 Syamal Kumar Dana
- Department of Mathematics, Centre for Mathematical Biology and Ecology, Jadavpur University, Kolkata, India
In ecological landscapes, species tend to migrate between nearby patches in search of a better survivability condition. By this dispersal process, they form connectivity between the patches and thereby may develop various correlated or partially correlated population dynamics among species living in the patches. We explore various possible emergent collective population patterns using a simple ecological network model of all-to-all connected patches where we use a particular type of dispersal process that is controlled by a weighted mean-field diffusion to include the failed migration between the interacting patches. We represent the population dynamics of both the predator and prey in each patch by a modified Rosenzweig-MacArthur (mRM) model that incorporates an additional effect of habitat complexity. Our theoretical investigations on the network dynamics, using numerical and to some extent, analytical techniques, show various complex patterns, namely, 2-cluster, 3-cluster and multicluster states, and chimera states, besides synchrony (1-cluster) and homogeneous steady states (HSS) in a migrating metapopulation. An important observation is that addition of habitat complexity in the Rosenzweig-MacArthur (RM) model makes qualitative changes in the collective behaviors. Especially to mention that it shrinks the region of synchrony and broadens the region of HSS, in parameter space and, thereby leads to better survival probabilities and increased population persistence in a natural ecosystem.
1. Introduction
Dispersal is a natural tendency of species in search of a better survival condition against scarcity of food, high population density, intense grazing, or extreme climate changes. An important question in ecology is how dispersal between patches can influence the intrinsic as well as the collective behavior of the interacting species, and thereby make a balance and control of populations [1]. Earlier studies [2–6] showed that dispersal can lower the burden of high population density and reduce the chances of global extinction [7, 8], as species can migrate from over-populated patches to empty or sparsely populated patches. Population migration in fragmented patches is described as metapopulation dynamics [9, 10]. In isolated patches, species may survive in a non-equilibrium state, namely, in a state of stable limit cycle oscillation [11–13]. In an ecological landscape, dispersal or migration-driven spatial synchrony is a most likely event [14–18] as usually seen in dynamical networks, in general, when many agents or oscillatory units interact via diffusion [19]. Examples of spatial synchrony are abundant in population dynamics [18]. In a synchronous state, species in all patches of a metapopulation fluctuate in a common rhythm; then if one goes extinct, all others are likely to follow the same fate. Synchrony may thus deteriorate the chances of survivability in a situation of an imminent crisis [10, 20–22]. Dispersal driven population stability is another expected and well-known possibility in ecological patches. Such diffusion induced stabilization of oscillation by breaking a synchrony is an established phenomenon [23–28] in dynamical networks as well when a homogeneous steady state (HSS) or inhomogeneous steady states (IHSS) may emerge. Species may develop more persistence or less chances of extinction [29] when populations stop oscillating and stabilized to a constant size. This fact may be explained from the experience of dynamical system studies that a stable steady state as an analog of population stability is robust to external perturbation. Besides synchrony and population stability, many long-lived transient complex patterns, spiral waves, chaos may emerge [30] in a spatially extended ecosystem; stable complex spatial patterns such as spots, stripes, and holes are also seen in natural vegetations [31]. In dynamical networks, partial synchrony such as clustered states [32–34] and chimera patterns [35–37] are well-known transient or stable patterns. This encourages theoretical studies by the ecological community to search for such complex patterns in a metapopulation, if they exists at all, which may be undertaken as possible strategies to enhance survivability of species from the edge of extinction through a recolonization process. We treat here a migration-driven ecological network model as a dynamical network and use the known theoretical techniques to explore various possible collective states using the globally connected network structure and a special type of migration process as explained below.
We focus on clustered states and chimera states in our investigation. Existence of clustered states and chimera states are not reported so far in experiments in ecology, to the best of our knowledge. However, chimera states were first observed in a network of non-locally coupled phase oscillators in 2002 [35, 36], but later reported in networks of limit cycle systems [38, 39], and then, most surprisingly, in networks of globally coupled oscillators [40–42]. Synchrony usually emerges in both amplitude and phase of all identical oscillators in a network above a critical coupling when all the oscillators develop a common rhythm. In chimera states, the synchronous population of identical oscillators splits into two subgroups above a critical coupling when one subgroup is synchronized completely while the other subgroup remains asynchronous. It was an unexpected behavior for a homogeneous network and more surprising in a globally coupled network whose all-to-all connectivity structure is symmetric. Such a symmetry-breaking partial synchrony was difficult to explain in the beginning. The reason behind the emergence of such a coexisting pattern of synchronous and asynchronous subpopulations in a network is more or less understood very recently [33, 34]. Most importantly, such incongruous pattern really exists and found in nature [43] that makes an expectation of such complex patterns in dispersal-driven ecological network too. Besides chimera patterns, clustered patterns may also emerge. In clustered states, the whole ensemble of oscillators splits into subgroups of oscillators [32–34], but in contrast to chimera states, each subgroup is now synchronous. However, there exists no synchrony between the subgroups. Moreover, the number of oscillators in each subgroup may not be identical. Usually species in ecological systems survive mostly in steady states; the population may also oscillate and survive in a non-equilibrium state although chances of extinction prevails. Quite a few theoretical studies were reported on 2-clustered death and multiclustered death states [46] and chimera states [44, 45, 47] and also spiral chimera states [48] in ecological networks using a variety of coupling, non-local, distance dependent power-law coupling and a purely diffusive coupling. For non-local coupling [44], an emergence of chimeralike states was seen where a synchronous or coherent population splits into one coherent subpopulation in oscillatory states and another subpopulation in coexisting steady states and oscillatory states. For the distance dependent power-law connectivity between the patches [45], amplitude chimera (AC) states were reported. The amplitudes of the oscillating incoherent subpopulation did not show any amplitude variation, but showed a phase lag in oscillation of population between the incoherent patches. Both the studies used the RM prey-predator interaction model [49] to represent the local dynamics of each connected patch. Alternatively, we explore chimera states using a globally coupled network structure where dynamics of each ecological patch is represented by the RM model, but with additional effect of habitat complexity. We use the weighted mean-field diffusion as a migration process to define the links between the patches. Such a interactive diffusion process was first introduced [50, 51] for quorum sensing of genetic oscillators and also used [52] for dynamical networks, in general. Recently, the weighted mean-field diffusion was interpreted [46, 53] as a very relevant migration process that explains nicely the failed or misdirected migration of species in a dispersal-driven metapopulation. Thereby the authors observed HSS, IHSS, and multiclustered-death states in a RM model based ecological network of smaller size. We extend the work in a similar globally coupled network with larger number of patches, when we observe additional complexity in population patterns, namely, 2-cluster, 3-cluster, multiclustered, and amplitude modulated chimera (AMC) states for low to moderate migration rate. We mainly focus in the low to moderate dispersal rates and low strength of mean-field factor when such complexity arises. For large migration, we find HSS, in other words, population stability, as usual. However, a significant region of synchronous oscillatory state also exists between the clustered states and HSS for an intermediate range of dispersal, in parameter space. Furthermore, we introduce an additional effect of habitat complexity in the local dynamics of patches that broadens the region of HSS, in parameter space and, shrinks the region of parameter space for synchrony, especially, for low migration of prey and high migration of predator. We explain the ecological consequence of our observed dynamical properties in the discussion.
2. Globally Coupled Network of Predator-prey Systems With Habitat Complexity
Habitat complexity is ubiquitous and found both in terrestrial and aquatic ecosystem in variable degree. For example, presence of sea grass, salt marshes, coral reefs make marine habitat complex and predator's success is greatly determined by the degree/strength of the physical and structural complexity of habitat. There are plenty of laboratory and field experiments [54–58] which confirm that structural complexity of the habitat has significant influence on predator-prey interaction. The common hypothesis is that habitat complexity reduces predation rates by decreasing encounter rates between predator and prey, thereby enhances persistence of the interacting species. The physical structure of the habitat also reduces the available space for the interacting species and thereby reduces the carrying capacity of the environment [59]. Taking into account the effect of habitat complexity on predation rate and environmental carrying capacity in explicit way, the following model was proposed [59]:
where xi and yi represent, respectively, the prey and predator population densities at time t. Here r is the intrinsic growth rate of prey, K is the environmental carrying capacity, θ(0 < θ < 1) is the conversion efficiency of the predator and d is the food-independent death rate of predator. The parameters α and h represent the prey attack rate and handling time, respectively. The effect of habitat complexity on the carrying capacity is represented by the parameter c1(0 < c1 < 1) and the effect of habitat complexity on predator's functional response is represented by the parameter c2(0 < c2 < 1). We call this model as a modified Rosenzweig-MacArthur (mRM) predator-prey model. The model parameters can be easily rescaled so as to retain the original form of the RM model [49]. In the rescaled model, one will be unable to track the specific effect of the habitat parameters hidden in the rescaled parameters and hence we keep them distinctly visible here. Further explanation and illustration of the model can be seen in Jana and Bairagi [59]. All parameters are assumed positive from the biological viewpoint.
We extend the one patch model to N all-to-all connected network of patches, where the local dynamics of each patch is governed by the mRM model. The network dynamics is represented by
where i = 1, 2, …, N is the patch or node index. All the patches are assumed identical meaning that individual patches have identical intrinsic dynamics as decided by their identical parameters. The weighted mean-field diffusion of species between the patches is considered to control the dispersal-guided diffusion process between the patches. In a metapopulation ecology, the weighted mean-field coupling is justifiable when the dispersal probability of a species from a randomly selected patch is assumed to be a fraction of its mean density. This type of dispersal of species has been interpreted [44, 53] as failed, misdirected migration or a partial death of species during a migration. The mean population densities of prey and predators are defined as and , respectively. The dispersal of both prey and predator between the patches follows a diffusion process governed by their respective mean-field densities with a weight factor q (0 < q < 1) that measures the dispersal fraction of the mean population density. The parameters ϵ1 and ϵ2 represent the dispersal rates of prey and predator population, respectively. We investigate numerically and, to some extent, analytically the emergent collective states of species in the network by varying the dispersal rates (ϵ1, ϵ2) and the weighted mean-field parameter q. There is no spatial identity of the patches in a global coupling since all nodes have equal distance from each other and have equal degree distribution and therefore each node has equal priority, representing a symmetric and homogeneous network. We emphasize on the role of habitat complexity parameters c1,2 and show that habitat complexities make qualitative changes in the characteristic features of collective dynamics.
3. Collective States: Numerical Results
Numerical simulations are initiated with pseudo-randomly generated initial conditions, where all prey and predator densities are uniformly distributed, respectively, on the interval (100, 400) and (20, 50) in all patches. The model parameters of the mRM model are set [59] as r = 2.65, K = 898, h = 0.0437, θ = 0.215, α = 0.045, c1 = 0.01, c2 = 0.1, d = 0.12 so that the dynamics of an isolated patch exhibits relaxation type oscillation as shown in Figure 1A; the oscillation never reaches a zero population. Our choice of model parameters is guided by a notion [11] that slow-fast time scale in variation of prey and predator populations is a necessary condition for sptial synchrony in a metapopulation in the weaker dispersal regime. In a similar study, the RM model was considered earlier [46] in search of synchrony and population stability where the model parameters of an isolated patch were also chosen for relaxation type oscillation.
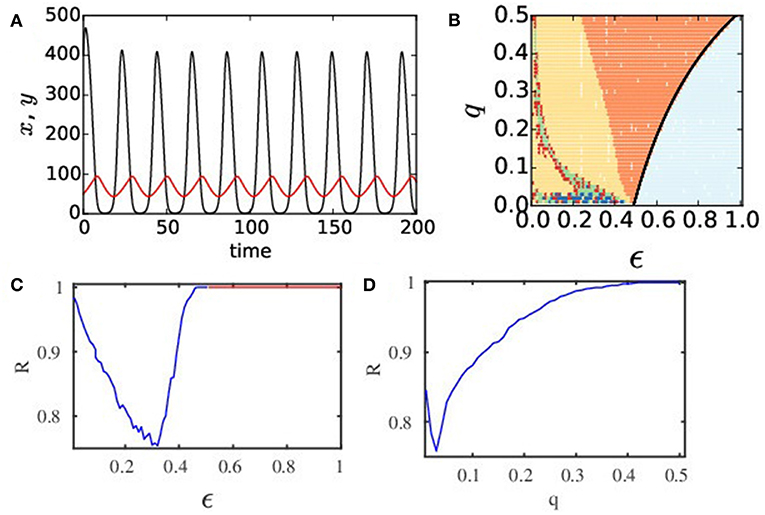
Figure 1. (Color online) (A) Temporal dynamics of an isolated patch. It is governed by the mRM model where black and red lines denote prey and predator populations, respectively. The intrinsic dynamics of an isolated patch is relaxation type (x > 0 and y > 0) for the choice of parameters r = 2.65, K = 898, h = 0.0437, θ = 0.215, α = 0.045, c1 = 0.01, c2 = 0.1, and d = 0.12. (B) Phase diagram in a q − ϵ plane of the ecological network of N = 100 nodes where ϵ1=ϵ2=ϵ. Different colors depict diverse collective states: light blue for HSS, orange for global synchrony (1-cluster), yellow for 2-cluster states; red indicates 3-cluster; green represents higher cluster states; blue for chimera state. (C) R vs. ϵ plot (q = 0.02) shows global synchrony (R = 1, blue line) for 0.45 < ϵ ≤ 0.5, HSS for ϵ > 0.5 (R = 1, red line). For ϵ < 0.45 (R < 1), partial synchronization, clustering, or chimera states are observed. (D) R vs. q plot shows effect of q on synchrony (ϵ = 0.31).
In this present study, a network of N = 100 globally connected patches is considered and migration of both the prey and predators are allowed between the patches. To explore all the possible collective states, several phase diagrams are plotted in the 2-parameter planes using the following quantitative measures to identify various collective states, HSS, synchrony, clusters and chimera states. A steady state in the network is identified by estimating the standard deviations of the predator and prey populations in each patch and averaging them as
Here 〈.〉 denotes time average. A steady state is identified when ΔASD is zero and it has a finite non-zero value in oscillatory states. Number of unique steady states in case of HSS is one.
For global coherence (1-cluster) or synchrony measure, we use the complex Kuramoto order parameter (R) [60] defined by
where , ϕi is the instantaneous phase of the ith patch. ϕi is determined by , where (x*, y*) is the non-zero fixed point of the system (2). When all patches are synchronized, R = 1 and in an incoherent state R = 0, while 0 < R < 1 implies partial synchronization or clustering and even chimera states, which are further classified by other measures as described below.
For a more precise classification of clustered states (when R ≠ 1), we use a clustering index (CI) [61],
where u = 1−Ψ(σ−p), , and Ψ(.) is the Heaviside step function; σ is an arbitrary small number, n(t) is the number of distinct states counted (using a standard numerical routine) at every instant of time t in the time evolution of the network and denotes the average in a long run. The max(n) is the largest possible value of n(t). We calculate the number of cluster states by rounding the value . In clustered states, 0 < R < 1 and CI = 0. In chimera states, however, these measures are given by 0 < CI < 1 and 0 < R < 1.
The chimera state is finally characterized by a local order parameter (Li), which presents an overview about the local degree of incoherency. The local order parameter of the ith oscillator is defined as Bera et al. [62]
where δ is the nearest neighbor on both sides of the ith oscillator (we choose δ = 5) and ϕi is the instantaneous phase of the ith patch. Li ≈ 1 indicates that the ith oscillator belongs to the coherent subgroup of the chimera state, i.e., Li = 1 means maximum ordering or coherency. In contrary, Li ≈ 0 means ith oscillator belongs to the incoherent neighbors. For each oscillatory patch, the local order parameter Li is computed for a long time interval. For a confirmation of the chimera states, we employ a long time mean of phase velocity of each oscillatory patch. For ith oscillator, it is given by Banerjee et al. [63]
where Mi is the number of periods of the ith oscillator in the long time interval Δt. Basically, it gives an impression about the distribution of oscillatory frequency of a group of oscillators. In an AMC state, Ωi is identical for the coherent subgroup of oscillators and scattered for the incoherent subgroup. In AC states, Ωi shows no distribution for both the subgroups.
To get a glimpse of a broader scenario of the collective dynamics of the network, we first approximate a symmetric case with identical dispersal rates (ϵ1 = ϵ2 = ϵ) of both the predator and prey, without losing the essential dynamical features. We consider an approximation of equal weighted mean-field diffusion rates q for both the species. We consider an asymmetry in dispersal rates (ϵ1 ≠ ϵ2), at a later stage. We first draw a phase diagram in a q − ϵ plane in Figure 1B that gives an overview of different collective states denoted by colors. A unique state of complete coherence (1-cluster) is seen (orange) in a large region of parameter space, where populations of both species in all patches oscillate in a common rythm and the population densities in all patches are identical in time. The parameter region of complete coherence (orange) is seen to form a typical arnold-toungue-like structure [64], which has a tip at a very small q value, but the region broadens with increasing dispersal rate ϵ and for increasingly larger q values. This coherent state (1-cluster) represents a globally synchronous state. From the ecological viewpoint, both prey and predator species follow a coherent oscillation in their temporal behavior. In such a coherent state, the network becomes vulnerable to external attack or perturbation. If population in any one of the patches goes extinct at any arbitrary instant of time then all other patches will follow the same trend, and thus enhances the possibility of a global extinction. For larger dispersal ϵ, the coherent region (orange) changes to a globally stable steady state or HSS (light blue region), as shown in the right side of the phase diagram. The transition to HSS occurs via reverse Hopf bifurcation: the analytically drawn Hopf line (black line) closely matches with the numerically drawn line of separation that delineates the HSS region (light blue) from the coherent region (orange). In the HSS region, both species reach a constant density in all the patches; they coexist with non-zero identical population density in each patch and they are safe. In dynamical sense, a stable steady state has the ability to return to its original stable state after a transient time under a perturbation and thus HSS signifies robustness of a population to external attacks. Besides these coherent oscillatory state (synchrony) and the HSS, we find regions of 2-cluster (yellow), 3-cluster (red), and multi-cluster (green) states. A symmetry-breaking line (black circles) delineates the regions of synchrony and 2-cluster states as obtained from numerical simulations of a reduced 2-patch system (see Appendix in Supplementary Material) and it closely fits to the separating line (boundary of orange and yellow regions) as designated by numerical simulations of the full system. In clustered states, all the patches split into coherent subgroups. In a coherent subgroup or a cluster, species oscillate coherently with almost identical population density at any time instant, however, the subgroups remain incoherent between themselves. We notice complex patterns such as chimera states (blue) for low q and a range of ϵ values. The complexity in collective behavior is clearly visible in the lower range of q values, and hence we focus on this range of q values, in the next section. Before that we elaborate the nature of transition to synchrony from an initial state of incoherence. For this, we plot the order parameter R (Figure 1C) against ϵ that decreases first, indicating a decreasing level of coherence with higher clusters and emergence of chimera states. Then R increases for increasing ϵ, indicating a decrease in cluster size, but finally R = 1 when the network transits to synchrony (blue line) at ϵ = 0.45 and it continues until ϵ = 0.5. The HSS (red line) is reached (where R = 1) for ϵ > 0.50. The transition to synchrony is also checked with a variation of q for a fixed dispersal rate ϵ = 0.31 as shown in Figure 1D. It follows a monotonic increase to R = 1, indicating existence of clustered and chimera states before reaching synchrony.
A globally coupled network based on the RM model using the weighted mean-field controlled dispersal was investigated earlier [44, 46], in exhaustive details, numerically as well as analytically, in two coupled patches to establish the evolution of spatial synchrony and population stability, HSS and two regions of transcritical bifurcation, in parameter space. They made an extension to a 16-patch network to present two more emergent IHSS states, 2-clustered death and multiclustered-death states [28, 46]. We reproduce some of the previous results, mainly, synchrony, HSS and two additional transcritical bifurcations (see Appendix in Supplementary Material) for larger values of ϵ1,2, which we do not focus here. Taking earlier experience [46] into consideration, we rather focus our investigations on the lower range of q values and weaker dispersal rates where complex patterns (green, red, blue regions) really evolve as shown in Figure 1B and as detailed in Figures 2A,B. Existence of complex patterns, clustered states, multiclustered states and chimera states, in non-equilibrium states, is absent in the earlier study [46]. In a metapopulation, emergence of such complex oscillatory patterns may play crucial role on the survival probability of species. The main difference in our results lies in the choice of low q and ϵ values.
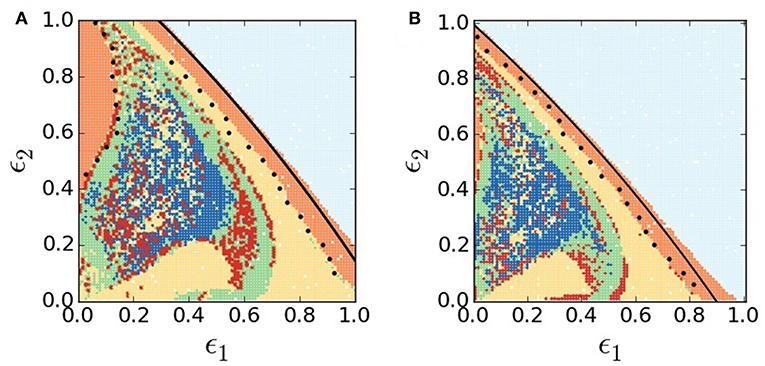
Figure 2. (Color online) Collective dynamical states in ϵ1-ϵ2 parameter plane. (A) Original RM network model (c1 = c2 = 0), (B) modified RM network model (c1 = 0.01, c2 = 0.1). Different colors depict various collective states: HSS (light blue), global synchrony (orange), 2-cluster (yellow), 3-cluster (red dots), higher cluster (green), and chimera states (blue). Black circles on both phase diagrams denote the symmetry-breaking line from synchrony (1-cluster) to 2-cluster state as obtained from numerical simulations of a reduced 2-patch mode. Other system parameters are same for both the models: r = 2.65, K = 898, h = 0.0437, θ = 0.215, α = 0.045, d = 0.12, q = 0.02, and N = 100.
Now we focus on the lower range of q in search of complexity of collective behaviors. Selecting a lower value of q (0.02), as an example, and varying both the dispersal rates ϵ1,2, two separate phase diagrams (Figure 2) are drawn in the ϵ1 − ϵ2 plane using the quantitative measures defined above. Figure 2A presents collective dynamical scenarios of the network of predatory-prey interactions represented by the original RM model; a comparative picture of the collective states in the network represented by the mRM patches is presented in Figure 2B. In both the cases, we obtain regions of HSS (light blue), spatial synchrony (orange) and 2-cluster (yellow), multiclustered (green) and chimera patterns (blue) by numerically simulating the full system of N = 100 patches. We attempt an analytical stability analysis of the full system to derive the separating boundaries of different complex patterns in the phase diagrams. So far we are unable to do the stability analysis of the full system (N = 100), however, we are able to reduce the network to a 2-dimensional 1-patch system at HSS and then do the stability analysis of equilibrium points of the reduced system. Thereby we draw (see Appendix in Supplementary Material) the Hopf bifurcation lines (black lines) in Figures 2A,B that almost match the border of HSS and synchrony as obtained from simulation of the full system. Similarly, we check the separating line of synchrony and 2-cluster states, in parameter space, by reducing the full system to a 2-cluster system (see Appendix in Supplementary Material). We numerically simulate the 4-dimensional reduced system to put a demarcation boundary between synchrony and 2-cluster state (black circles), which shows an almost matching with the separating line obtained from a simulation of the full system. Using the reduced system, we depict a similar demarcation boundary of synchrony (orange region) and 2-cluster state by putting a border of black circles at the top left of Figure 2A.
Now we draw an attention to significant changes in our results by the addition of habitat complexity. Figures 2A,B apparently look similar since both the plots show large regions of HSS (light blue) and regions of synchrony (orange) and 2-cluster (yellow) states. A closer inspection, however, reveals noticeable qualitative changes in collective dynamics in presence of habitat complexity. Figure 2B clearly shows a larger area of HSS in the ϵ1−ϵ2 parameter plane compared to Figure 2A. Changes in other regions of clustered states (yellow, red dots, green) and chimera states (blue) are also noticed. In the HSS region, both prey and predator population densities become stable at a non-zero steady state in all patches, as confirmed by their temporal dynamics in Figure 3A, although isolated patches were in oscillatory states. This represents a globally stable steady state (cf. R = 1, red line in Figure 1C). The weighted mean-field-controlled dispersal of species plays an important role in the emergence of this HSS state. The non-zero fixed point explains its ecological relevance as a coexistence of both prey and predator populations with non-zero constant densities. This leads to a better survivability condition of both the species in HSS since it is a robust state against external or environmental perturbations. Obviously, the presence of habitat complexity enhances persistence of species by increasing the region of HSS in parameter space and thereby supports the experimental results [54–58]. In the lower range of dispersal rates, all patches are driven out of the HSS state and enter into an oscillatory state (orange color), yet they maintain a coherent state. A transition from the HSS state (light blue) to the globally synchronous oscillatory state (orange) is seen immediately below the HSS region via Hopf bifurcation in Figure 2. Both the prey and predators start oscillating in a globally synchronous state (orange), where all patches oscillate in one common rhythm, as illustrated in the temporal dynamics of the patches in Figure 3B. The oscillation in all the N = 100 patches show a single period limit cycle. As mentioned above, extinction probability is higher in case of coherent oscillatory populations as population may go extinct due to additional environmental perturbation when population density is at the nadir of a cycle [5, 6, 20]. If population in one patch goes extinct for some external perturbations, it will be followed by the populations of all other patches in the network, causing global extinction of the species. In this sense, synchrony is always a curse for ecological systems. A reasonably large region of globally synchronous state also exists in the lower range of prey dispersal rate and larger predator movement as seen (top left) in Figure 2A. This synchronous state is almost vanished in the same parameter region in Figure 2B. The presence of habitat complexity thus incurs another qualitative change and thereby improves the survivability condition by breaking the synchrony and inducing multi-clustered states (green) and chimera states (blue) in this region of the ϵ1 − ϵ2 parameter plane.
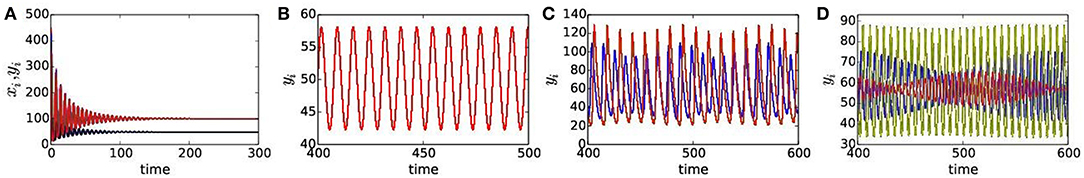
Figure 3. (Color online) Temporal dynamics of prey and predator in presence of habitat complexity for different dispersal rates: (A) HSS for ϵ1 = 0.71, ϵ2 = 0.63, (B) synchronous state for ϵ1 = 0.66, ϵ2 = 0.3, (C) 2-cluster states for ϵ1 = 0.3, ϵ2 = 0.11, and (D) 3-cluster states for ϵ1 = 0.4 ϵ2 = 0.44. Other parameters are chosen as per in Figure 2B for the mRM based network.
For weaker dispersal rates, below the synchronous state (orange), regions of 2-cluster states (yellow), 3-clustered (scattered red dots), multi-clustered (green) states and chimera states (blue) are seen in both the phase diagrams in Figure 2. For further illustration of collective states, we select dispersal parameters from different colored regions of the phase diagram Figure 2B, representing the mRM based network, and present their respective temporal dynamics, snapshots, spatio-temporal dynamics and also plots of local order parameter Li and mean phase velocity Ωi. The temporal dynamics of both predator and prey populations in all patches are plotted in Figures 3C,D for 2-cluster and 3-cluster states, respectively, which are quasiperiodic in nature in both the states. Snapshots of predator population in all patches (indicated by node indices) are plotted in Figures 4A,C,E, showing 1-cluster (synchrony), 2-cluster and 3-cluster states, respectively, for different choices of (ϵ1, ϵ2). One coherent group (1-cluster) splits into 2- and 3-coherent subgroups of unequal number of patches (node indices); each subgroup have identical population density (yi level), in the snapshot, but there exist different levels of densities for different subgroups. Corresponding spatio-temporal plots presented in Figures 4B,D,F also confirm the collective states of 1-cluster, 2-cluster, and 3-cluster, respectively. Clearly, the subgroups in each 2-, 3-cluster states have no coherence.
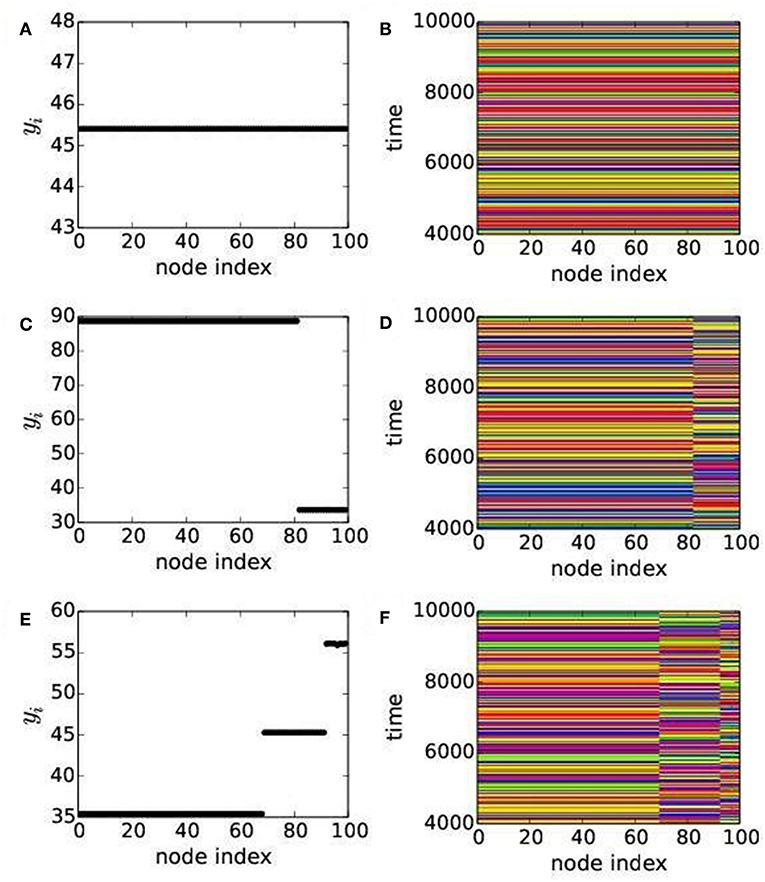
Figure 4. (Color online) Collective dynamics of predators in all N(=100) patches. Left and right panels show, respectively, snapshots and spatio-temporal asymptotic dynamics of predators in 100 patches. (A,B) show snapshot and spatio-temporal of 1-cluster state for ϵ1 = 0.66, ϵ2 = 0.3. (C,D) represent snapshot and spatio-temporal of 2-cluster states for ϵ1 = 0.3, ϵ2 =0.11. (E,F) represent snapshot and spatio-temporal of 3-cluster states for ϵ1 = 0.4, ϵ2 = 0.44. System parameters are as chosen in Figure 2B with q = 0.02 for the mRM based network.
Multi-clustered states (green color) and chimera states (blue color) are present in smaller islands, but clearly noticeable in parameter space as shown in Figure 2 for both the cases. A spatio-temporal plot of yi population in all the patches in Figure 5A shows chimera pattern with two subgroups: one coherently oscillating and another oscillating incoherently. The spatio-temporal plot of the local order parameter Li (node index) presented in Figure 5C is in agreement with Figure 5A. This chimera pattern is further confirmed by a snapshot in Figure 5B that shows coherence in predator densities yi in all the patches, while a smaller subgroup of patches show random distribution. The mean phase velocity is plotted in Figure 5D that shows a distribution for the incoherent patches in the same subgroup while they are identical for the coherent patches. This identifies the chimera states as amplitude mediated, i.e., as a case of AMC. The temporal dynamics of all the coherent and incoherent patches are presented in Figures 5E,F, respectively. The coherent patches show identical oscillation, while oscillation in the incoherent patches have varying amplitude, but both are of quasiperiodic nature. We have checked the quasiperiodicity using a Poincáre plot, which we do not present here.
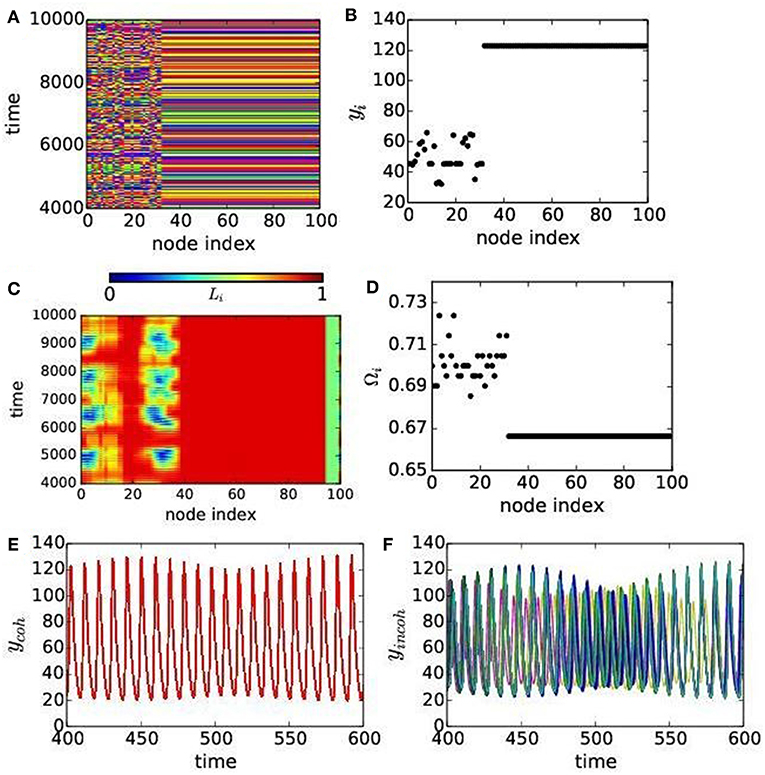
Figure 5. (Color online) Chimera states for the dispersal rates ϵ1 = 0.29, ϵ2 = 0.22. (A) Spatio-temporal plots and (B) snap shot of predator population. (C) Local order parameter Li and (D) mean phase velocity Ωi. (E) Temporal dynamics of coherent patches and (F) the same for incoherent patches. Other parameters are as chosen in Figure 2B for the mRM network.
4. Discussion
A globally connected network structure is considered here as an approximate model for studies of metapopulation dynamics in ecological networks [14, 65]. Although a number of complex natural processes is involved in ecological systems, a deterministic model approach, as proposed here, can still be used to extract reliable information on the complexity of population dynamics [65]. Here we assume that all the patches in the network have all-to-all connectivity by the process of dispersal of species and the predator-prey interaction in each patch is governed by the mRM model, where the local dynamics exhibits stable limit cycle oscillation in isolation. Both the prey and predator species have freedom to migrate within the patches [11–13] and the migration of both species depends upon its average or mean population density. The diffusion or the migration process between the patches is controlled by the weighted mean-field density of each species [50, 53, 66]. Such a weighted mean-field guided diffusion process was initiated in quorum sensing of synthetic genetic oscillators [50, 51] and later on, it has been applied to other generic dynamical models to realize HSS in coupled oscillatory systems [52, 67]. We used the weighted mean-field diffusion process to describe a dispersal-driven metapopulation since it is more realistic in a perspective of partial loss of population during migration of species as suggested earlier [46, 53], however, extended their results [46] in a search of complex patterns.
A basic question in ecological network study is—how such a diffusion process of dispersal of species can influence the collective dynamics of the network and if it can originate complex spatio-temporal patterns? Another important question is how does complexity in collective spatio-temporal pattern help an ecological landscape and most importantly, if it can, at all, improve the survivability and persistence of species when such complex collective states may emerge? To address the questions, we first plotted a two parameter phase diagram in the dispersal rate and weighted mean-field parameter plane under an approximation of identical dispersal rates of both species. The phase diagram gave an overview of the collective dynamics of the ecological network as shown by different colors under varying weighted mean-field diffusion and dispersal rate. A spatial synchrony prevailed in a large region of the parameter space along with a significantly large region of 2-cluster and HSS. However, we observed smaller regions of complex collective patterns such as 2-cluster, 3-cluster, multi-cluster, and chimera states in the lower range of weighted mean-field diffusion constant. To have a closer look on the complex dynamics for lower values of the weighted mean-field diffusion constant, another phase diagram was plotted with respect to the dispersal rates of prey and predator species for a low value of weighted mean-field constant. It showed prominent regions of complex patterns in a parameter plane of dispersal rates: 2-cluster, 3-cluster, multi-clustered, and chimera states in the region of low weighted mean-field constant. Existence of complex collective patterns were identified using several quantitative measures, namely, Kuramoto order parameter, clustering index, local order parameter and mean phase velocity. Spatio-temporal plots, snapshots of predator, and prey population dynamics of all patches gave us confirmation of our claims of the variety of collective states, especially, information about clustered states and chimera states. A transition from synchronous oscillatory state to HSS occurred via reverse Hopf bifurcation for higher dispersal rates as confirmed by a stability analysis of the reduced system at HSS (Appendix in Supplementary Material). A representative example of emergent complex patterns for a low q value is presented here, however, it has been found true for a range of q values.
Another important question that we tried to address is the role of habitat complexity on the emergence of complex patterns. For a comparative understanding of the collective dynamics in presence and absence of habitat complexity, a phase diagram in the same parameter plane of dispersal rates was added using the ecological network where each node was represented by the original RM model without having habitat complexity parameter. The region of HSS had been enlarged significantly, in parameter space, by the addition of habitat complexity in our proposed mRM model, indicating an increased parameter region of dispersal rates that provided an improved condition of persistence. Furthermore, in the absence of habitat complexity, a region of synchrony that existed for lower rates of dispersal of prey and higher dispersal of predator, disseminated into larger varieties of complex patterns in presence of habitat complexity. By decreasing the parameter space for spatial synchrony, species in an ecological landscape were allowed to a large variety of dispersal possibilities that may reduce the risk of extinction.
Habitat complexity has no specific role in the origin of complex patterns. In fact, we showed in a comparative study that complex patterns originate for both cases: in absence and presence of habitat complexity. Complexity in collective states may be attributed to the choice of low q and ϵ values. Finally, we mention that all the complex patterns emerge, in non-equilibrium states, in our globally coupled ecological network. How complex oscillatory patterns help improving survivability or persistence of species is a future question of investigation to address.
Author Contributions
SS formulated the problem, did the simulations and wrote the manuscript. SD and NB worked on rewriting and improving the manuscript.
Conflict of Interest Statement
The authors declare that the research was conducted in the absence of any commercial or financial relationships that could be construed as a potential conflict of interest.
Acknowledgments
SS, NB, and SD acknowledge support by the DST-SERB (India), Grant No. EMR/2016/001078. SD also acknowledges support by the University Grants Commission (India) under Emeritus Fellow scheme. The authors are thankful to the editor and reviewers for their useful suggestions and comments. Authors acknowledge valuable discussions with Dibakar Ghosh, Indian Statistical Institute, Kolkata.
Supplementary Material
The Supplementary Material for this article can be found online at: https://www.frontiersin.org/articles/10.3389/fams.2019.00015/full#supplementary-material
References
1. Earn DJ, Levin SA, Rohani P. Coherence and conservation. Science. (2000) 290:1360–4. doi: 10.1126/science.290.5495.1360
2. Jansen VAA. The dynamics of two diffusively coupled predator-prey populations. Theor Popul Biol. (2001) 59:119–31. doi: 10.1006/tpbi.2000.1506
3. Hudgens BR, Haddad NM. Predicting which species will benefit from corridors in fragmented landscapes from population growth models. Am Nat. (2003) 161:808–20. doi: 10.1086/374343
4. Roy M, Holt RD, Barfield M. Temporal autocorrelation can enhance the persistence and abundance of metapopulations comprised of coupled sinks. Am Nat. (2005) 166:246–61. doi: 10.1086/431286
5. Holland MD, Hastings A. Strong effect of dispersal network structure on ecological dynamics. Nature. (2008) 456:792. doi: 10.1038/nature07395
6. Gupta A, Banerjee T, Dutta PS. Increased persistence via asynchrony in oscillating ecological populations with long-range interaction. Phys Rev E. (2017) 96:042202. doi: 10.1103/PhysRevE.96.042202
7. Heino M, Kaitala V, Ranta E, Lindstrom J. Synchronous dynamics and rates of extinction in spatially structured populations. Proc R Soc Lond B Biol Sci. (1997) 264:481–6. doi: 10.1098/rspb.1997.0069
8. Johst K, Brandl R, Eber S. Metapopulation persistence in dynamic landscapes: the role of dispersal distance. Oikos. (2002) 98:263–70. doi: 10.1034/j.1600-0706.2002.980208.x
9. Levins R. Extinction. In: Miura RM, editor. Some Mathematical Questions in Biology: Lectures on Mathematics in the Life Sciences. Providence, RI: American Mathematical Society (1970). p. 75–108.
10. Fahrig L. Effects of habitat fragmentation on biodiversity. Annu Rev Ecol Evol Syst. (2003) 34:487–515. doi: 10.1146/annurev.ecolsys.34.011802.132419
11. Goldwyn EE, Hastings A. When can dispersal synchronize populations? Theor Popul Biol. (2008) 73:395–402. doi: 10.1016/j.tpb.2007.11.012
12. Goldwyn EE, Hastings A. Small heterogeneity has large effects on synchronization of ecological oscillators. Bull Math Biol. (2009) 71:130–44. doi: 10.1007/s11538-008-9355-9
13. Goldwyn EE, Hastings A. The roles of the Moran effect and dispersal in synchronizing oscillating populations. J Theor Biol. (2011) 289:237–46. doi: 10.1016/j.jtbi.2011.08.033
14. Blasius B, Huppert A, Stone L. Complex dynamics and phase synchronization in spatially extended ecological systems. Nature. (1999) 399:354. doi: 10.1038/20676
15. Pajunen VI, Pajunen I. Long-term dynamics in rock pool daphnia metapopulations. Ecography. (2003) 26:731–8. doi: 10.1111/j.0906-7590.2003.03542.x
16. Roy M, Harding K, Holt RD. Generalizing levins metapopulation model in explicit space: models of intermediate complexity. J Theor Biol. (2008) 255:152–61. doi: 10.1016/j.jtbi.2008.07.022
17. Wall E, Guichard F, Humphries AR. Synchronization in ecological systems by weak dispersal coupling with time delay. Theor Ecol. (2013) 6:405–18. doi: 10.1007/s12080-013-0176-6
18. Liebhold A, Koenig WD, Bjornstad ON. Spatial synchrony in population dynamics. Annu Rev Ecol Evol Syst. (2004) 35:467–90. doi: 10.1146/annurev.ecolsys.34.011802.132516
19. Strogatz S. Sync: How Order Emerges From Chaos in the Universe, Nature, and Daily Life. New York, NY: Hyperion (2003).
20. Holyoak M, Lawler SP. Persistence of an extinction-prone predator-prey interaction through metapopulation dynamics. Ecology. (1996) 77:1867–79. doi: 10.2307/2265790
21. Ranta E, Kaitala V, Lundberg P. The spatial dimension in population fluctuations. Science. (1997) 278:1621–3. doi: 10.1126/science.278.5343.1621
23. Saxena G, Prasad A, Ramaswamy R. Amplitude Death: the emergence of stationarity in coupled nonlinear systems. Phys Rep. (2012) 521:205–30. doi: 10.1016/j.physrep.2012.09.003
24. Koseska A, Volkov E, Kurths J. Oscillation quenching mechanisms: amplitude vs. oscillation death. Phys Rep. (2013) 531:173–200. doi: 10.1016/j.physrep.2013.06.001
25. Hens CR, Olusola OI, Pal P, Dana SK. Oscillation death in diffusively coupled oscillators by local repulsive link. Phys Rev E. (2013) 88:034902. doi: 10.1103/PhysRevE.88.034902
26. Hens CR, Pal P, Bhowmick SK, Roy PK, Sen A, Dana SK. Diverse routes of transition from amplitude to oscillation death in coupled oscillators under additional repulsive links. Phys Rev E. (2014) 89:032901. doi: 10.1103/PhysRevE.89.032901
27. Nandan M, Hens CR, Pal P, Dana SK. Transition from amplitude to oscillation death in a network of oscillators. Chaos. (2014) 24:043103. doi: 10.1063/1.4897446
28. Mishra A, Saha S, Roy PK, Kapitaniak T, Dana SK. Multicluster oscillation death and chimeralike states in globally coupled Josephson Junctions. Chaos. (2017) 27:023110. doi: 10.1063/1.4976147
29. Steiner CF, Stockwell RD, Kalaimani V, Aqel Z. Population synchrony and stability in environmentally forced metacommunities. Oikos. (2013) 122:1195. doi: 10.1111/j.1600-0706.2012.20936.x
30. Drake JA, Staelens P, Wieczynski D. Encyclopedia of Theoretical Ecology. Hastings A, Gross L, editors. Berkeley, CA: University of California Press (2012). p. 60–3.
31. Hardenberg JV, Meron E, Shachak M, Zarmi Y. Diversity of vegetation patterns and desertification. Phys Rev Lett. (2001) 87:198101. doi: 10.1103/PhysRevLett.87.198101
32. Jalan S, Amritkar RE. Self-organized and driven phase synchronization in coupled maps. Phys Rev Lett. (2003) 90:014101. doi: 10.1103/PhysRevLett.90.014101
33. Pecora LM, Sorrentino F, Hagerstrom AM, Murphy TE, Roy R. Cluster synchronization and isolated desynchronization in complex networks with symmetries. Nat Commun. (2014) 5:4079. doi: 10.1038/ncomms5079
34. Sorrentino F, Pecora LM, Hagerstrom AM, Murphy TE, Roy R. Complete characterization of the stability of cluster synchronization in complex dynamical networks. Sci Adv. (2016) 2:e1501737 doi: 10.1126/sciadv.1501737
35. Kuramoto Y, Battogtokh D. Coexistence of coherence and incoherence in nonlocally coupled phase oscillators. Nonlinear Phenom Complex Syst. (2002) 5:380.
36. Abrams DM, Strogatz SH. Chimera states for coupled oscillators. Phys Rev Lett. (2004) 93:174102. doi: 10.1103/PhysRevLett.93.174102
37. Sethia GC, Sen A, Atay FM. Clustered chimera states in delay-coupled oscillator systems. Phys Rev Lett. (2008) 100:144102. doi: 10.1103/PhysRevLett.100.144102
38. Omelchenko I, Maistrenko YL, Hövel P, Schöll E. Loss of coherence in dynamical networks: spatial chaos and chimera states. Phys Rev Lett. (2011) 106:234102. doi: 10.1103/PhysRevLett.106.234102
39. Sethia GC, Sen A, Johnston GL. Amplitude-mediated chimera states. Phys Rev E. (2013) 88:042917. doi: 10.1103/PhysRevE.88.042917
40. Sethia GC, Sen A. Chimera states: the existence criteria revisited. Phys Rev Lett. (2014) 112:144101. doi: 10.1103/PhysRevLett.112.144101
41. Yeldesbay A, Pikovsky A, Rosenblum M. Chimeralike states in an ensemble of globally coupled oscillators. Phys Rev Lett. (2014) 112:144103. doi: 10.1103/PhysRevLett.112.144103
42. Mishra A, Hens CR, Bose M, Roy PK, Dana SK. Chimeralike states in a network of oscillators under attractive and repulsive global coupling. Phys Rev E. (2015) 92:062920. doi: 10.1103/PhysRevE.92.062920
43. Panaggio M, Abrams DM. Chimera states: Coexistence of coherence and incoherence in networks of coupled oscillators. Nonlinearity. (2015) 28:R67–87. doi: 10.1088/0951-7715/28/3/R67
44. Dutta PS, Banerjee T. Spatial coexistence of synchronized oscillation and death: a chimeralike state. Phys Rev E. (2015) 92:042919. doi: 10.1103/PhysRevE.92.042919
45. Banerjee T, Dutta PS, Zakharova A, Schöll E. Chimera patterns induced by distance-dependent power-law coupling in ecological networks. Phys Rev E. (2016) 94:032206. doi: 10.1103/PhysRevE.94.032206
46. Arumugam R, Dutta PS, Banerjee T. Dispersal-induced synchrony, temporal stability, and clustering in a mean-field coupled Rosenzweig-MacArthur model. Chaos. (2015) 25:103121. doi: 10.1063/1.4933300
47. Hizanidis J, Panagakou E, Panagakou E, Omelchenko I, Provata A, Scöll E, et al. Chimera states in population dynamics: networks with fragmented and hierarchical connectivities. Phys Rev E. (2015) 92:012915. doi: 10.1103/PhysRevE.92.012915
48. Kundu S, Majhi S, Muruganandam P, Ghosh D Diffusion induced spiral wave chimeras in ecological system. Eur Phys J Spec Top. (2018) 227:983–93. doi: 10.1140/epjst/e2018-800011-1
49. Rosenzweig ML, MacArthur RH. Graphical representation and stability conditions of predator-prey interactions. Am Nat. (1963) 97:209–23. doi: 10.1086/282272
50. Ullner E, Zaikin A, Volkov EI, García-Ojalvo J. Multistability and clustering in a population of synthetic genetic oscillators via phase-repulsive cell-to-cell communication. Phys Rev Lett. (2007) 99:148103. doi: 10.1103/PhysRevLett.99.148103
51. Hellen EH, Dana SK, Zhurov B, Volkov E. Electronic implementation of a repressilator with quorum sensing feedback. PLoS ONE. (2013) 8:e62997. doi: 10.1371/journal.pone.0062997
52. Sharma A, Shrimali MD, Dana SK. Phase-flip transition in nonlinear oscillators coupled by dynamic environment. Chaos. (2012) 22:023147. doi: 10.1063/1.4729459
53. Banerjee T, Dutta PS, Gupta A. Mean-field dispersion-induced spatial synchrony, oscillation and amplitude death, and temporal stability in an ecological model. Phys Rev E. (2015) 91:052919. doi: 10.1103/PhysRevE.91.052919
54. Johnson WD. Predation, habitat complexity and variation in density dependent mortality of temperate reef fishes. Ecology. (2006) 87:1179–188. doi: 10.1890/0012-9658(2006)87[1179:PHCAVI]2.0.CO;2
55. Manatunge J, Asaeda T, Priyadarshana T. The influence of structural complexity on fish-zooplankton interactions: a study using artificial submerged macrophytes. Environ Biol Fish. (2000) 58:425–38. doi: 10.1023/A:1007691425268
56. Savino JF, Stein RA. Behavior of fish predators and their prey: habitat choice between open water and dense vegetation. Environ Biol Fish. (1989) 24:287–93. doi: 10.1007/BF00001402
57. August PV. The role of habitat complexity and heterogeneity in structuring tropical mammal communities. Ecology. (1983) 64:1495–507. doi: 10.2307/1937504
58. Crowder LB, Cooper WE. Habitat structural complexity and the interaction between bluegills and their prey. Ecology. (1982) 63:1802–13. doi: 10.2307/1940122
59. Jana D, Bairagi N. Habitat complexity, dispersal and metapopulations: macroscopic study of a predator-prey system. Ecol Complex. (2014) 17:131–9. doi: 10.1016/j.ecocom.2013.11.006
60. Kuramoto Y. Chemical Oscillations, Waves, and Turbulence. Berlin; Heidelberg: Springer-Verlag (2012). p. 19. doi: 10.1007/978-3-642-69689-3
61. Mishra A, Saha S, Hens CR, Roy PK, Bose M, Louodop P, et al. Coherent libration to coherent rotational dynamics via chimeralike states and clustering in a Josephson junction array. Phys Rev E. (2017) 95:010201(R). doi: 10.1103/PhysRevE.95.010201
62. Bera BK, Ghosh D, Banerjee T. Imperfect traveling chimera states induced by local synaptic gradient coupling. Phys Rev E. (2016) 94:012215. doi: 10.1103/PhysRevE.94.012215
63. Banerjee T, Biswas D, Ghosh D, Schöll E, Zakharova A. Networks of coupled oscillators: From phase to amplitude chimeras. Chaos. (2018) 28:113124. doi: 10.1063/1.5054181
64. Pikovsky A, Osipov GV, Rosenblum M, Zaks M, Kurths J. Attractor-repeller collision and eyelet intermittency at the transition to phase synchronization. Phys Rev Lett.(1997) 79:47. doi: 10.1103/PhysRevLett.79.47
65. McCredie May GM. Stability and Complexity in Model Ecosystems, Vol. 6. Princeton, NJ: University Press (2001).
66. Garcia-Ojalvo J, Elowitz MB, Strogatz SH. Modeling a synthetic multicellular clock: repressilators coupled by quorum sensing. Proc Natl Acad Sci USA. (2004) 101:10955. doi: 10.1073/pnas.0307095101
67. Sharma A, Shrimali MD. Amplitude death with mean-field diffusion. Phys Rev E. (2012) 85:057204. doi: 10.1103/PhysRevE.85.057204
Keywords: ecological network, habitat complexity, weighted mean-field diffusion, homogeneous steady states, synchrony, clustering, amplitude mediated chimera
Citation: Saha S, Bairagi N and Dana SK (2019) Chimera States in Ecological Network Under Weighted Mean-Field Dispersal of Species. Front. Appl. Math. Stat. 5:15. doi: 10.3389/fams.2019.00015
Received: 07 September 2018; Accepted: 05 March 2019;
Published: 27 March 2019.
Edited by:
Eckehard Schöll, Technische Universität Berlin, GermanyReviewed by:
Tanmoy Banerjee, University of Burdwan, IndiaKonstantin Blyuss, University of Sussex, United Kingdom
Bernd Blasius, University of Oldenburg, Germany
Copyright © 2019 Saha, Bairagi and Dana. This is an open-access article distributed under the terms of the Creative Commons Attribution License (CC BY). The use, distribution or reproduction in other forums is permitted, provided the original author(s) and the copyright owner(s) are credited and that the original publication in this journal is cited, in accordance with accepted academic practice. No use, distribution or reproduction is permitted which does not comply with these terms.
*Correspondence: Syamal Kumar Dana, c3lhbWFsZGFuYUBnbWFpbC5jb20=