 Ercan Özen
 Metin Tetik
- University of Uşak, School of Applied Sciences, Uşak, Turkey
The aim of this study is to determine whether the stock indices of some developed and developing countries react similarly to the price movements in the Dow Jones Industrial Average (DJIA). In this study, the impact of DJIA on other indices during the 2008 global financial crisis, was explored by using the Vector Error Correction Model. The data used was analyzed in two periods: (1) the expansionary period; and (2) the contractionary period of the FED's policies. The results of the analysis indicate that the developed and emerging stock markets react differently to the DJIA. The results include important findings for decisions by financial investors and policy makers.
Introduction
Globalization is a current phenomenon which has advanced drastically as seen by the increasing world trade and capital flows. Developing countries need more funds to continue their development. Significant economic and political developments in the United States (US), the world's largest economy, are changing the direction of money flows and adversely affecting emerging economies [1].
According to Liu [2], the factors affecting the interaction between countries include, information capacity, financial integration, economic integration, and similarity in industrial. Liu [2] stated that the mechanism of interdependence of developed markets and that of developing markets are heterogeneous: (i) information capacity and industrial structure similarity have significant impact on the correlations of a developed market with other markets; (ii) economic integration drives the correlations of a developing market with other markets; (iii) financial integration is important for interdependence among developed markets and that among developing markets, but not for that between developed and developing markets. A study by Didier et al. [3] argues that movement between equity markets was driven largely by financial linkages rather than trade.
International financial integration consists of internationalization, securitization, and liberalization processes. According to Kearney and Lucey [1], there are three definitions on international financial markets integration. They examine them in two categories; direct and indirect measures. Direct measures are based on the rates of return of assets with a similar degree of risk and the law of one price. While the first of the indirect measures brings to mind the concept of international capital market integrity, the second depends on the extent to which domestic investments are financed by other world resources rather than domestic resources.
Increased integration between markets causes an event in a particular market to have a greater impact on other markets. A bad event affecting one market has a negative effect on other markets through the contagion effect. The financial contagion effect model is based on the instability of a country's financial market or the crisis, which can initiate a crisis that cannot be explained by macro-economic fundamentals in another market [4]. On the other hand, the De-coupling and Re-coupling hypothesis, which emerged in the crisis period, assumes that the developments in the US economy will not be followed by other countries because of different business cycles and will converge to their own values [5]. The fact that developing countries have more shares in world trade leads to the rapid growth of these countries. Thus, in spite of world trends, some developing economies are called “decoupling” to remain independent from other economies [6].
Asset pricing models are frequently used to measure the relationship between stock prices and macro-economic factors. These models are Capital Assets Pricing Model (CAPM), Factor Models and Arbitrage Pricing Model (AFM).
According to CAPM, since investors have homogeneous expectations, they make evaluations in the same return-risk diagram. In this diagram, effective boundary and risk-free assets are evaluated together ([7], p. 200). The risk-free asset is the interest on treasury bills and government bonds for domestic investments. Considering international portfolios, US interest rates can be considered as a risk-free interest rate. CAPM is described as in below;
Where is expected asset return, rf is risk free asset, is market return and βi is beta.
The rise in US interest rates leads to an increase in the risk-free rate of return. Increasing the risk-free interest rate causes investors to expect more returns than other investments at the same risk level. Unless this is achieved in other markets, investor funds will be withdrawn from other markets and invested in US markets. At the same time, the increase in US interest rates gives the investor the opportunity to arbitrage. Therefore, funds in emerging markets are directed toward the US and developed markets. The return of funds to developed markets increases the returns in this market, while emerging market returns decrease. As a result, the correlation between developed and developing markets decreases.
Arbitrage Pricing Theory is based on the law of one price. In other words, the basis of the model is the idea that the same good cannot be sold or arbitraged at two different prices ([8], p. 537). The Arbitrage Pricing Theory is based on a linear model and assumes that the return on an investment is based on multiple factors. In general, it asserts that the price of an asset is based on macro-economic factors or market indices ([7], p. 257). In the model, the risk-return relationship with linear (k) factor is as follows;
where, Rit is return on the asset of i and i = 1,2,3,…,n, E(Ri) is expected return on the asset of i, δj is common factors affecting returns on all assets and j = 1,2,3,….,k, bij is sensitivity of the asset of i to the common factor j, εit is i non-systematic risk of the asset of i.
When these models were examined, it was noted that APM was developed as an alternative to CAPM, which considers a single risk factor. In addition, the fact that AFM assumptions are more compatible with real life and that more than one macro-economic factor may affect the return on assets has made APM generally superior to CAPM.
There are numerous macro-economic factors that affect prices in stock exchanges. According to Arbitrage Pricing Theory (APT) developed by Ross [9], stock returns are explained by multiple risk factors. This theory can be used to calculate both individual stock returns and index returns. The validity of APT has been proven in numerous studies.
Market interest rates, M2 money supply, inflation rate, rate of exports meeting imports, capacity utilization rates and gold prices are effective in determining share prices [10, 11]. Moreover, local and foreign economic policies affect stock markets [11]. Important factors affecting stock returns in the global economy include interest rates, exchange rates and stock exchange indices of other countries (Dow Jones, etc.). Among these, international interest rates are an important variable that determines the direction of capital movements and has an impact especially on emerging stock exchanges.
The 2008 global financial crisis (GFC), which began in the US, has produced significant devastating effects on world economies and stock markets. The Federal Reserve System (Fed) has taken the decision to give billions of dollars in the form of liquidity to resolve the crisis. Thus, economies, especially those in the US, have entered into a recovery period. As a result, emerging markets have also benefited thanks to an abundance of liquidity in the markets. In addition to recovering US markets, the abundance of liquidity has also positively affected other countries' markets. Bekaert and Harvey [12] stated that foreign portfolio flows bring big changes in the functioning of developing markets and their financial markets.
After a recovery period in the US, the FED, which aims to control inflation, has decided to gradually terminate the expanding policy. It was then that liquidity was withdrawn from emerging markets. This has caused negative effects on the developing markets. Investigation of the relations between the markets in both periods is important for portfolio diversification and management of international portfolio investments. In the period after the US crisis was overcome, the FED stopped monetary expansion and started increase interest rates, and this led to the outflow of funds from developing countries. The increase in the FED interest rate led to a relative increase in returns in the US markets compared to the emerging markets.
In case of FED policies, according to the Single Price Law, international funds are expected to move from emerging markets to US markets. Due to rising interest rates in the US, capital outflows from developing countries increases the funding needs of these countries and affects economic activities negatively. Due to these negative expectations, risk premium of developing countries is also increasing. Due to increased risk premium, money outflow in developing countries also increases.
The stock exchange is one of the most important indicators that reflect the economic situation of a country. The Dow Jones Industrial Average Index (DJIA) is also one of the biggest indexes in the US and the world's stock markets. Therefore, the DJIA affects the other stock market indices of the world. The research objectives of this study is to determine whether the indices of some developed countries (UK, Germany and France) and BRICS-T countries (Brazil, Russia, India, China, South Africa, and Turkey) react similarly to the DJIA. Investigating DJIA impacts separately for developed and emerging markets is particularly likely to affect the decisions of international portfolio investors.
The Literature review, Aim and method of the study, findings, conclusion and limitations of the study follow the introduction part of the study.
Literature
The literature shows that there is a strong correlation between stock markets in the US and other developed countries [13]. There are some studies that examine the relations between US stock markets and other stock markets for different time gaps related with the GFC [13–15]. On the other hand, it was noted that the correlation between stock markets increased in times of crisis [15–20].
Olbryś and Majewska [13] found that the correlation between USA-S&P500 and France-CAC, and UK-FTSE and Germany-DAX markets increased during the 2008 crisis period compared to the pre-crisis period. Wang [14], examined the integration of interdependencies among six major East Asian stock exchanges, while also considering their interactions with the US before and during the 2007–2009 global financial crisis. The results reveal that the GFC has strengthened the linkages among stock markets in East Asia. But, after the GFC, regional factors matter more in East Asia. So, these stock markets are less responsive to the shocks in the US after the crisis. Meric et al. [15] show that during the GFC, integration has increased between the US stock market and the European and Australian developed stock markets and that the U.S. stock returns led European and Australian stock returns with a high level of statistical significance. Shabri Abd Majid and Hj Kassim [16], note in their study that emerging stock markets in Indonesia and Malaysia tend to show a greater degree of integration or increased co-movements with US stock market during the a crisis period. However, in the early stages of GFC (from January 2007 to the summer of 2008), it shows that emerging markets are isolated and differentiated from developments in the US [21].
Boubaker et al. [17] show the number of co-integrating links increase during the turbulent period when compared to the tranquil period (pre-crisis) for five out of five developed markets and two out of five stock markets, providing evidence that these markets were hit by the subprime shock in the US. Also, it was noted that almost all correlations between US markets and the other markets rose in a time of crisis. Besides, impulse and response tests say that the effect of the US market becomes more important in a time of crisis rather than in pre-crisis time. Maghyereh et al. [20] observed that MENA equity markets moderately correlated to pre-GFC US market and the structure of the relationship increased during the GFC. So, the integration level between the markets during the GFC has risen. The authors stated that the relationship between the markets after the GFC came back to normal. Zhang and Li [19] found clear evidence that because of the eruption of the 2008 financial crisis, the US close-to-close market returns have impacted the Chinese close-to-open next day market returns. And correlation between the two markets is time-varying. So, after the GFC diversification benefits have lessened. Turk et al. [5] found that during the GFC period, 27 European countries were subject to a contagion effect due to integration with the United States and there was no decoupling. The study of Yarovaya and Lau [22] provides supporting evidence of the decoupling hypothesis. The results of this study indicate that the Chinese stock market is the most attractive option for UK investors.
We divided the study in terms of the FED's expansionary period and the FED's contractionary period. As far as we could search, we couldn't find any study that examines the reactions of stock markets to the US stock market according to different Fed policy periods. We want to see whether developed and developing stock market show similar reaction to the DJIA before and after a FED's policy change. So, the originality of this study is to see reactions of developed and developing equity markets to US market in expansionary and contractionary periods during and after the GFC.
When the literature is examined, we cannot find any studies investigating the effects of the FED's expansionary and contractionary policy change. Therefore, it is not possible to compare the study findings with other studies for the contractionary period.
Aim and Method
The purpose of this study is to determine whether or not some developed stock markets (Germany-DAX, France-CAC, and England-FTSE), are reacting similarly to the price fluctuations in the DJIA like stock markets in BRICS countries (China-Shanghai, India-Sensex, Russia-Micex, South Africa-South Africa, and Brazil-Bovespa) and Turkish stock market index (Bist) (BRICS-T).
There are also several reasons why it is important to consider BRICS-T in the study. These emerging countries showed a higher growth rate compared to developed countries, increasing their share in the world product and capital flows. These countries were less influenced by the GFC, and these BRICS-T countries demonstrated a lesser degree of the recession as developed countries. Therefore, these markets became more attractive for investors.
The data was obtained from the historical data link by marking the country and index selected for research from https://www.investing.com/indices link of “investing.com1.” The data is public and accessible to all2.
The impact of the DJIA price movements on other indexes during the 2008 GFC was explored using the Vector Error Correction Model (VECM). The data consisted of the daily closing prices of the indexes and analyzed by separating the two periods. VECM was used to investigate the short term dynamics of DJIA and all other series, which were found to move together in the long run. These periods are separated as to the FED's policy stance. The first period is between August 17, 2007 and May 22, 2013 (FED's expansionary period) and the second period is between 23 May 2013 and 29 September 2017 (FED's contractionary period). The second period started when the FED announced on May 22, 2013 that it would reduce the purchase of bonds by $ 85 billion per month.
The Indexes used in analysis included; DJIA, Shanghai, Sensex, Micex, Bist, South Africa, DAX, CAC, FTSE, and Bovespa. These indexes are shown in Figure 1, with periods of monetary expansion and monetary contraction. In addition, descriptive statistics of the series for both periods are given in the A-Tables 1, 2.
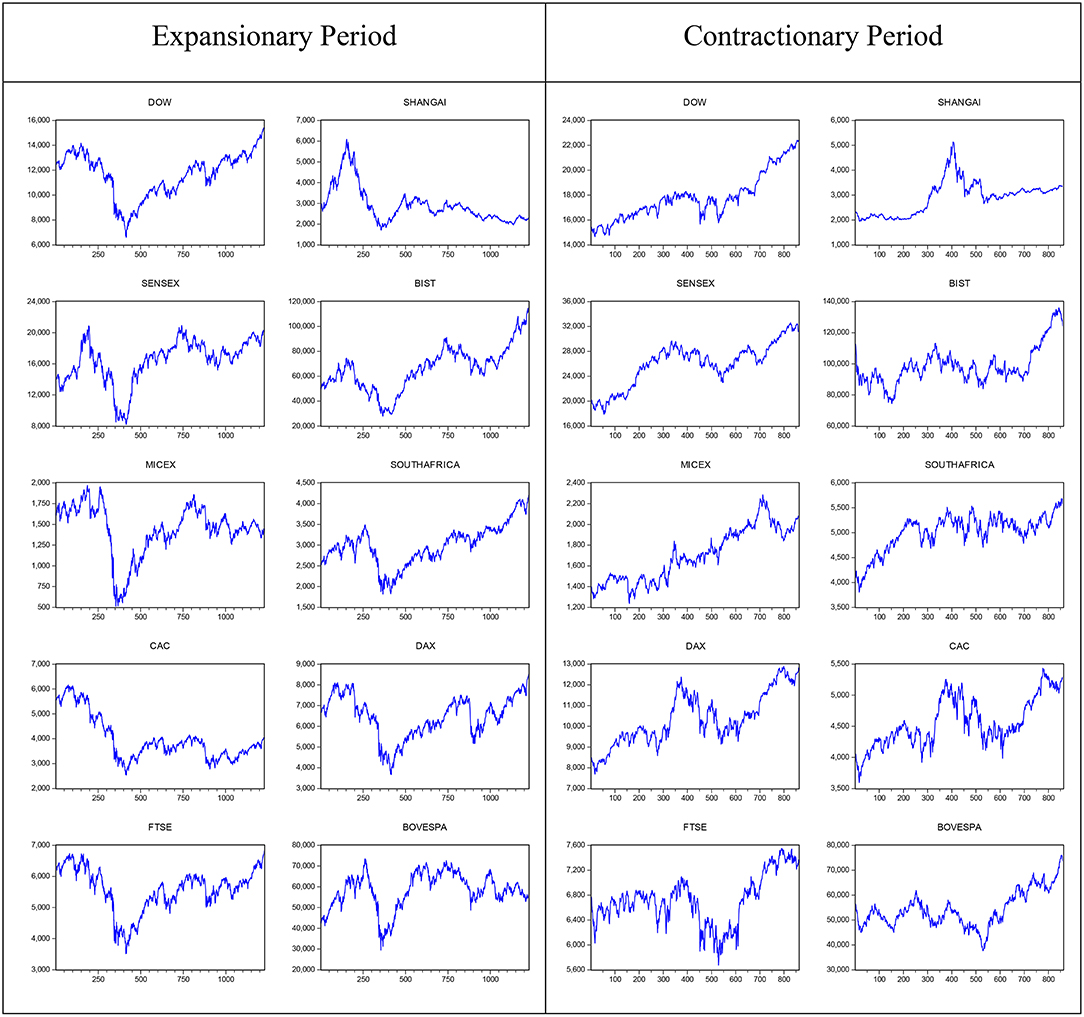
Figure 1. DJIA and other indexes.
Findings
Firstly, the authors confirmed whether the series were stationary at the logarithmic level. Following this, separate regression equations were established between the DJIA return and the other index returns. Table 1 shows Augmented Dickey Fuller (ADF) test results for both periods at the logarithmic level of all indexes.
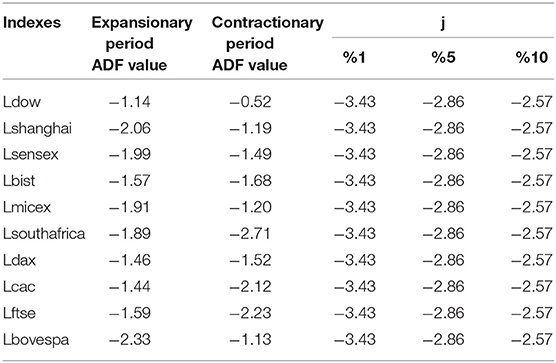
Table 1. Stationarity tests of indexes by periods.
According to the ADF test results in Table 1, it was determined that the logarithms of all variables were not stationary at the 1% significance level. According to the Augmented Engle-Granger approach, co-integration regressions of each index on the DJIA are estimated as in A-Table 3. The results of the ADF test on the residuals obtained are shown in A-Table 4. As a result of these findings, it was determined that all the series were separately co-integrated with the DJIA. The co-integration regression also shows that there is a long-term relationship between the index series at the logarithmic level. Estimates of the error correction model between the DJIA () and the other indices () at the logarithmic level are shown in Table 2 below3.
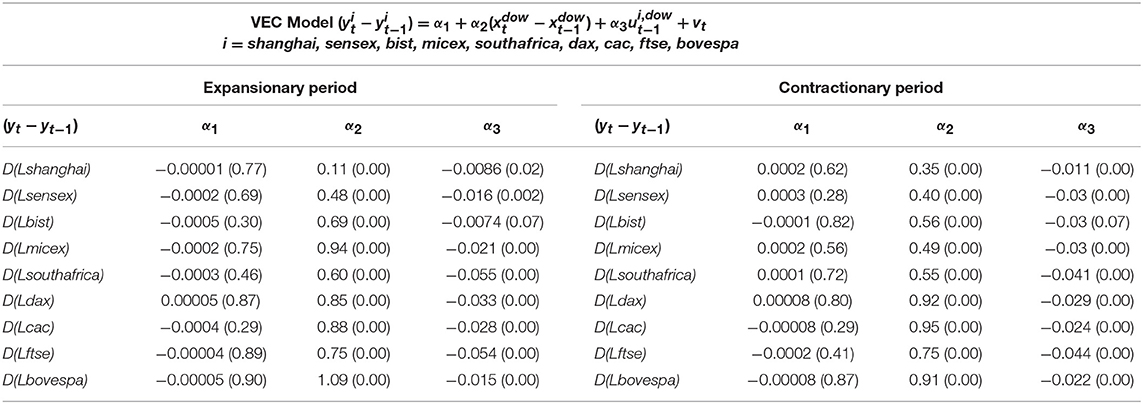
Table 2. Vector error correction model (VECM).
Looking at the error correction models, in the first line of the financial expansion and contraction periods in Table 2, the short-term changes on the DJIA return (DLdow) have the same short-term effects on the Shanghai stock exchange. If we look at emerging markets, we see that for the first time in the period of monetary expansion, the brief cyclical changes on the DJIA return (DLdow) have a significant positive effect of about 0.11 units on the Shanghai return (DLshanghai). In the period of monetary contraction, this effect increases by about 0.35 percent. On the Sensex index return (DLsensex), there is a significant positive effect of 0.48 units in the monetary expansion period, while in the monetary contraction period, this effect drops to about 0.40 units. In another emerging market, the Turkish Stock Market index return (DLbist), had a significant positive effect of 0.69 units in the monetary expansion period, while in the monetary tightening period, this effect fell to about 0.56. The impacts of the short-term changes on the (DLdow), led to a positive effect on the Russian (DLmicex), South Africa (DLsouthafrica), and Brazil (DLbovespa) stock index with units being ~0.94, 0.60, and 1.09, respectively. This effect fell by 0.49, 0.55, and 0.91, respectively, in the monetary contraction period. In the period of monetary expansion, in the light of this information, the short-term changes in the (DLdow) have the greatest impact on Bovespa and Micex indexes. In the period of the monetary contraction, the short-term fluctuations in the (DLdow) have the greatest effect on the Bovespa index. In addition, the only index showing an increase in the degree of influence from the DJIA during the period of monetary contraction is the Shanghai Index. The Micex index is the index that gives the DJIA the strongest response during the expansion period. However, this index has seen the greatest decline in response during the contraction period.
Looking at stock exchanges in developed countries, it can be noted that during the monetary expansion period, short-term changes in (DLdow) have a significant positive effect on DAX return(DLdax), CAC index return (DLcac), and FTSE return (DLftse) of ~0.85, 0.88, and 0.75 units, respectively. In the monetary contraction period, this effect is ~0.92, 0.95, and 0.75 units, respectively. This means that the response of developed country indices to the DJIA in the short term increased during the period of monetary contraction, when compared to the monetary expansion period.
The impact of the short-term changes in the DJIA on the emerging markets is in contrast to the effect on the developed markets. In the period of monetary contraction, the impact of the changes in the DJIA on emerging market indexes decreased when compared to the expansion period. In both periods, the stock exchange index, which had the least response in return for the short-term changes on the DJIA return, is the Chinese stock exchange. In terms of return increase, the stock market which was most affected, was the Bovespa index during the expansion period.
Conclusion
In this study we compared the reactions of developed and developing equity markets to the US equity market during two FED policy periods during and after the GFC. The FED's policy change took place in May 2013. Vector Error Correction Model was used in the analysis. While developed equity market data includes UK, Germany and France, developing equity market data includes Brazil, Russia, India, China, South Africa, and Turkey.
According to the findings of the study, the response of the emerging markets (during the period of monetary expansion) to the DJIA is higher than that of the developed markets. However, when enlargement policies ended, there was a change in relation to other markets with the DJIA. Accordingly, in the second period, the response of the emerging markets (except Shanghai) to the return changes on the DJIA decreased. This finding is consistent with that of Meric et al. [15], Wang [14], Zhang and Li [19], Maghyereh et al. [20], Boubaker et al. [17], and Olbryś and Majewska [13]. However, according to our findings, the response of developed markets to changes in returns on the DJIA has increased in the second period compared to the first period. And this result is very striking. The reason for this remarkable result can be attributed to the fact that capital inflows were directed toward developed markets in the second FED policy period.
According to the findings of the study, negative decoupling was observed between developing markets and developed countries due to reverse capital flows during the FED's contractionary policy period. The flow of funds to developed countries led to an increase in market returns and a decrease in emerging market returns.
According to CAPM, FED interest rate increases caused the funds to flow into developed markets and the correlation between DJIA and developed markets increased. On the other hand, the correlation coefficient between DJIA and emerging stock exchanges decreased.
However, during the period of monetary expansion, the relationship between Shanghai-China and DJIA was very low. This result is consistent with Wang's [14] findings. Wang [14] noted that after the GFC, regional factors mattered more in East Asia. So, these stock markets are less responsive to the shocks in the US after the crisis. This finding shows that the Shanghai-China index is decoupling from DJIA during the FED expansion period.
The finding for Shanghai-China demonstrates the validity of the Decoupling and re-coupling hypothesis. As can be seen in the literature, it can be said that this is due to China's local and regional business cycle. The strong relationship between Bovespa—Brazil and US markets can be explained by the fact that the markets are under similar regional effects.
The literature findings show that almost all equity markets in the GFC period have increased correlation with the US market, and the integration between the markets was weakened after the GFC. In this respect, the findings of our study are consistent with the literature. However, since working periods are different, we cannot compare the effects of FED policy changes with other studies.
Therefore, we can conclude that there are portfolio diversification opportunities, especially investing in developed and developing equity markets after a FED policy change. These findings provide useful information for portfolio managers, investors and policy makers alike.
Limitations and Further Researches
In this study, the responses of developed and developing country stock markets to DJIA's price movements, depending on the FED policies implemented in the 2008 Crisis and the post-crisis period, were investigated. In order to simplify the analysis, the main stock indices were selected from developed stock exchanges (England, Germany, and France). Brazil, Russia, India, China, South Africa, and Turkey have been selected among many developing countries. In this case, BRICS countries and Turkey are the developing countries. Not all developing countries may have the same response to DJIA, but not all developing countries may show the same response to DJIA, as well. On the other hand, there is more than one stock market and index in the analyzed countries. Other indices are not included in the study. The use of different indices may also affect the analysis results.
In future researches, capital movements (Direct Capital Investments and Foreign Portfolio Investments) and different variables may be included in the data set. Thus, it can be determined whether the developed and developing markets react more to DJIA or to international capital movements. On the other hand, analysis will reveal which variable reacts first to the markets. These results will enable investors to know what indicator will be used in decision-making.
Data Availability Statement
Publicly available datasets were analyzed in this study. This data can be found here: the 1-DJIA 30 index (www.investing.com/indices/us-30-historical-data) and the 2-BIST 30 index (www.investing.com/indices/ise-30-historical-data).
Author's Note
Abstract version of this paper was presented at IAC-MEBM Conference, 16-17 March 2018, Budapest, Hungary.
Author Contributions
EÖ has prepared data, introduction, and theoretical explanations. MT applied econometrics methods.
Conflict of Interest
The authors declare that the research was conducted in the absence of any commercial or financial relationships that could be construed as a potential conflict of interest.
The handling editor declared a past co-authorship with one of the authors EÖ.
Acknowledgments
The authors of this Paper would like to thank the reviewers for their valuable comments and effort to improve the manuscript.
Supplementary Material
The Supplementary Material for this article can be found online at: https://www.frontiersin.org/articles/10.3389/fams.2019.00049/full#supplementary-material
Footnotes
1. ^Investing.com, Historical Data, https://www.investing.com/indices/ (accessed 03.01.2018).
2. ^For example, for DJIA: https://www.investing.com/indices/us-30-historical-data and for BIST 30 “https://www.investing.com/indices/ise-30-historical-data” link is used and data is accessed directly.
3. ^The D symbol indicates that the first difference is obtained.
References
1. Kearney C, Lucey BM. International equity market integration: theory, evidence and implications. Int Rev Finan Anal. (2004) 13:571–83. doi: 10.1016/j.irfa.2004.02.013
2. Liu L. International stock market interdependence: are developing markets the same as developed markets? J Int Finan Mark Instit Money. (2013) 26:226–38. doi: 10.1016/j.intfin.2013.06.003
3. Didier T, Love I, Martínez Pería MS. What explains co-movement in stock market returns during the 2007–2008 crisis? Int J Finan Econ. (2012) 17:182–202. doi: 10.1002/ijfe.442
4. Delice G. Financial crises: a theoretical and historical perspective (in Turkish), Erciyes university. J Faculty Econ Administr Sci. (2003) 20:57–81.
5. Turk A, Ak R, Bingul BA. Decoupling and re-coupling hypothesis during EU financial crises. J Eur Theor Appl Stud. (2017) 5:11–24.
6. Fidrmuc J, Korhonen I. The impact of the global financial crisis on business cycles in Asian emerging economies. J Asian Econ. (2010) 21:293–303. doi: 10.1016/j.asieco.2009.07.007
7. Karan MB. Investment Analysis and Portfolio Management (in Turkish). 4th ed. Ankara: Gazi Publishing House (2013).
8. Korkmaz T, Ceylan A. Capital Market and Securities Analysis (in Turkish). 7th ed. Bursa: Publishing House (2015).
9. Ross SA. The arbitrage theory of capital asset pricing. J Econ Theor. (1976) 13:341–60. doi: 10.1016/0022-0531(76)90046-6
10. Yeşildag E. The analysis of effect of macroeconomic factors on the index returns in istanbul stock exchange by means of arbitrage pricing model (in Turkish). J Süleyman Demirel Univer Instit Soc Sci. (2016) 51–76.
11. Muradoglu G, Taskin F, Bigan I. Causality between stock returns and macroeconomic variables in emerging markets. Russian East Eur Finan Trade. (2000) 36:33–53.
12. Bekaert G, Harvey CR. Capital flows and the behavior of emerging market equity returns. In: NBER Working Paper Series (No. w6669). National Bureau of Economic Research (1998). Available online at: https://www.nber.org/papers/w6669.pdf (accessed September 24, 2019).
13. Olbryś J, Majewska E. Increasing cross-market correlations during the 2007-2009 global financial crisis: contagion or integration effects? Argumenta Oeconomica. (2017) 2:263–77. doi: 10.15611/aoe.2017.2.11
14. Wang L. Who moves East Asian stock markets? The role of the 2007–2009 global financial crisis. J Int Finan Mark Instit Money. (2014) 28:182–203. doi: 10.1016/j.intfin.2013.11.003
15. Meric G, Lentz C, Smeltz W, Meric I. International evidence on market linkages after the 2008 stock market crash. Int J Bus Finan Res. (2012) 6:45–57.
16. Shabri Abd Majid M, Hj Kassim S. Impact of the 2007 US financial crisis on the emerging equity markets. Int J Emerg Mark. (2009) 4:341–57. doi: 10.1108/17468800910991241
17. Boubaker S, Jouini J, Lahiani A. Financial contagion between the US and selected developed and emerging countries: the case of the subprime crisis. Q Rev Econ Finan. (2016) 61:14–28. doi: 10.1016/j.qref.2015.11.001
18. Luchtenberg KF, Vu QV. The 2008 financial crisis: stock market contagion and its determinants. Res Int Bus Finan. (2015) 33:178–203. doi: 10.1016/j.ribaf.2014.09.007
19. Zhang B, Li XM. Has there been any change in the co-movement between the Chinese and US stock markets? Int Rev Econ Finan. (2014) 29:525–36. doi: 10.1016/j.iref.2013.08.001
20. Maghyereh AI, Awartani B, Al Hilu K. Dynamic transmissions between the US and equity markets in the MENA countries: new evidence from pre-and post-global financial crisis. Q Rev Econ Finan. (2015) 56:123–38. doi: 10.1016/j.qref.2014.08.005
21. Dooley M, Hutchison M. Transmission of the US subprime crisis to emerging markets: evidence on the decoupling-recoupling hypothesis. J Int Money and Finan. (2009) 28:1331–49. doi: 10.1016/j.jimonfin.2009.08.004
Keywords: stock markets, market reaction, Dow Jones, financial crisis, FED, developing markets, developed markets, ECM
Citation: Özen E and Tetik M (2019) Did Developed and Developing Stock Markets React Similarly to Dow Jones During 2008 Crisis? Front. Appl. Math. Stat. 5:49. doi: 10.3389/fams.2019.00049
Received: 21 August 2019; Accepted: 17 September 2019;
Published: 04 October 2019.
Edited by:
Simon Grima, University of Malta, MaltaReviewed by:
Gratiela Noja, West University of Timisoara, RomaniaRamona Rupeika-Apoga, University of Latvia, Latvia
Copyright © 2019 Özen and Tetik. This is an open-access article distributed under the terms of the Creative Commons Attribution License (CC BY). The use, distribution or reproduction in other forums is permitted, provided the original author(s) and the copyright owner(s) are credited and that the original publication in this journal is cited, in accordance with accepted academic practice. No use, distribution or reproduction is permitted which does not comply with these terms.
*Correspondence: Ercan Özen, ZXJjYW4ub3plbkB1c2FrLmVkdS50cg==; ZW96ZW50ckBob3RtYWlsLmNvbQ==