- 1Department of Ophthalmology, Yangpu Hospital, Tongji University School of Medicine, Shanghai, China
- 2Department of Cardiology, Jiangsu Province Hospital, Medical School of Southeast University, Nanjing, China
- 3Yangpu Daqiao Community Health Service Center, Shanghai, China
- 4Institute of Plant Physiology and Ecology, Shanghai Institutes for Biological Sciences, Shanghai, China
Purpose: We used ultraperformance liquid chromatography coupled with quadrupole/time-of-flight tandem mass spectrometry (UPLC-Q/TOF-MS/MS) to analyze the metabolic profile of reflex tears obtained from patients with dry eye disorders.
Methods: We performed a cross-sectional study involving 113 subjects: 85 patients diagnosed with dry eye syndrome (dry eye group) and 28 healthy volunteers (control group). Reflex tears (20–30 μl) were collected from the tear meniscus of both eyes of each subject using a Schirmer I test strip. MS data were acquired with a standard workflow by UPLC-Q/TOF-MS/MS. Metabolites were quantitatively analyzed and matched with entries in the Metlin, Massbank, and HMDB databases. Least absolute shrinkage and selection operator (LASSO) regression was conducted to detect important metabolites. Multiple logistic regression was used to identify the significant metabolic biomarker candidates for dry eye syndrome. Open database sources, including the Kyoto Encyclopedia of Genes and Genomes and MetaboAnalyst, were used to identify metabolic pathways.
Results: After the LASSO regression and multiple logistic regression analysis, 4 of 20 metabolic biomarker candidates were significantly correlated with Ocular Surface Disease Index score, 42 of 57 with fluorescein breakup time, and 26 of 57 with fluorescein staining. By focusing on the overlap of these three sets, 48 of 51 metabolites contributed to the incidence of dry eye and there were obvious changes in different age groups. Metabolic pathway analysis revealed that the main pathways were glucose metabolism, amino acid metabolism, and glutathione metabolism.
Conclusion: Dry eye syndrome induces changes in the metabolic profile of tears, and the trend differs with age. This evidence reveals the relationship between changes in metabolites, symptoms of dry eye syndrome, and age.
Introduction
Dry eye disease (DED) is one of the most common ocular surface diseases, with a prevalence of 20–50%, and is becoming a significant global health problem (Najafi et al., 2013; Stapleton et al., 2017). The Tear Film and Ocular Surface Dry Eye Workshop II (TFOS DEWS II) in 2017 provided a new definition: “Dry eye is a multifactorial disease of the ocular surface characterized by a loss of homeostasis of the tear film, and accompanied by ocular symptoms, in which tear film instability and hyperosmolarity, ocular surface inflammation and damage, and neurosensory abnormalities play etiological roles (Wolffsohn et al., 2017).” DED has a marked negative impact on the physical (Stapleton et al., 2017) and psychosomatic (Asiedu et al., 2018; Jonas et al., 2018) well-being of patients and exerts a substantial economic impact (Yu et al., 2011).
Despite its prevalence and impact, there is no “gold standard” diagnostic test for DED (Williamson et al., 2014; Valim et al., 2015). According to a report from the 2017 TFOS DEWS II, a diagnostic test battery for DED, including the screening 5-Item Dry Eye Questionnaire (DEQ-5) and Ocular Surface Disease Index (OSDI), confirms that a patient may have DED and triggers the diagnostic testing of non-invasive breakup time, osmolarity, and ocular surface staining with fluorescein and lissamine green (Wolffsohn et al., 2017). The DEQ-5 and OSDI questionnaires are used by patients to self-assess the symptoms, frequency, and severity of dry eye. Although the questionnaire score can roughly distinguish between dry eyes and non-dry eyes, a study conducted by Liu et al. (2019) showed that the perception of dry eye symptoms is not obvious due to lower corneal sensitivity. It is also affected by subjectivity, level of education, living environment, etc. Usually, the measurement of the tear film breakup time is the most frequent test of tear film stability in clinical practice. The measurement of non-invasive breakup time depends on the inspection equipment. Hence, the easy-to-operate fluorescein breakup time (FBUT) is most commonly used; however, it is affected by fluorescein, temperature, humidity, air circulation, etc. While osmolarity is considered the most relevant factor to the severity of dry eye, it is rarely used in outpatient clinics due to the high requirement for consumables and their instability. Ocular surface staining is a late feature of dry eye syndrome and a marker for the clinical diagnosis of severe dry eye syndrome, which has no significant value for the diagnosis of early dry eye. In summary, the above diagnostic methods are characterized by limitations for the diagnosis of dry eye. Therefore, the development of a diagnostic method with precise, stable, sensitive, specific, and convenient operation is urgently warranted.
Metabolomics is defined as the simultaneous qualitative and quantitative analysis of the metabolic response of living systems to pathophysiological stimuli or genetic modification. The main analytical techniques adopted in a global metabolomic analysis are nuclear magnetic resonance spectroscopy and mass spectrometry (MS) (Zhang et al., 2015). MS is usually combined with different separation techniques, such as liquid chromatography (LC) (Khamis et al., 2019), gas chromatography (Beale et al., 2018), and capillary electrophoresis (Ramautar et al., 2019), to enhance sensitivity. In the last 10 years, many studies have investigated the metabolite composition of the cornea, lens, and vitreous humor (Young and Wallace, 2009). Metabolomics has been used in clinical and animal studies of several eye diseases, including diabetic retinopathy (Chen et al., 2016), age-related macular degeneration (Brantley et al., 2012), glaucoma (Aribindi et al., 2013), keratoconus (Karamichos et al., 2015), and dry eye (Galbis-Estrada et al., 2014). With advances in technology, untargeted LC-MS metabolomic analysis of tear fluid in ocular diseases could be further conducted. Thus, investigations for the discovery of biomarker candidates for ocular diseases from tear fluid may also be useful for an accurate clinical diagnosis.
In the present study, we investigated alterations in the metabolic profile of tear fluid obtained from a clinical cohort of 113 subjects to detect metabolite aberrations in tears. Subsequently, all metabolites were separated by association with the clinical signs [OSDI, FBUT, corneal fluorescein staining (FL)] to identify the metabolites in tears that are pathologically relevant to DED. In addition, we constructed a more accurate metabolite model to assist us in the effective diagnosis of DED.
Subjects and Methods
Subjects and Groups
According to the diagnostic criteria and exclusion criteria for dry eye proposed in TFOS DEWS II, and considering the operability of the outpatient clinic, we used the following inclusion criterion: OSDI ≥ 13 or DEQ-5 ≥ 6. More strictly, FBUT < 10 s and ocular surface staining (+) were met. However, any of the following conditions were excluded: history of eye medication within 1 month; active inflammation of the eye or use of contact lens within 3 months; eye trauma or surgical history within 6 months; combined with hyperthyroidism, rheumatism, dry syndrome, and other diseases affecting tear secretion; presence of life-threatening primary diseases; or participation in other clinical trials. A total of 113 subjects were included in the final population. Tear samples (the tears of both eyes were treated as one sample) were divided into two groups: 28 and 85 samples were included in the control group (CG) and dry eye group (DEG), respectively. All subjects provided written informed consent. The study complied with the tenets of the Declaration of Helsinki for the protection of human subjects in medical research. Supplementary Table S1 lists the inclusion and exclusion criteria.
Sample Collection
Firstly, each subject completed a form that included informed consent, basic information, past history, surgical history, medication history, family history, the OSDI questionnaire, and the DEQ-5 questionnaire. The OSDI questionnaire was used to assess the effects of ocular symptoms, visual function, and environmental factors in dry eye syndrome; a score ≥13 was considered meaningful. DEQ-5 was used to assess the duration of dry eye symptoms; a score ≥6 was considered meaningful. After completion of the questionnaire, each subject underwent systematic ophthalmologic examinations, including the Schirmer I test (SIT), tear meniscus height, FBUT, FL, corneal sensitivity, and meibomian gland function. After the SIT, both strips were placed in a single cryotube as one sample and stored in a −80°C refrigerator.
Preparation of Tear Samples and Metabolomic Study
The SIT strip containing tears was removed from the −80°C refrigerator and immediately dissolved in 1 ml of 80% methanol. After ultrasonication, the supernatant was centrifuged (at 4,000 rpm), dried in a vacuum concentrator, and reconstituted with 10 μl of high-performance LC double-distilled water. One microliter of the sample was used for ultraperformance liquid chromatography coupled with quadrupole/time-of-flight mass spectrometry analysis. Liquid-chromatographic separation of processed tears was performed on a 100 × 2.1-mm Zorbax Eclipse Plus 1.8-μm C18 column using a 1290 infinity system, while MS was performed on a 6545 Quadrupole-Time of Flight system (all devices from Agilent Technologies, Santa Clara, CA, United States). Samples were randomly assigned to analyses. During analysis of each sample sequence, one quality control sample was run after every 20 injections. The gradient program of elution was: 1% B at 0–1 min, 15% B at 3 min, 70% B at 5 min, 85% at 9 min, 100% at 10–12 min, and subsequently return to the initial conditions with 2 min for equilibration. The sample volume injected was 2 μl, and the flow rate was 0.4 ml/min. The MS parameters were set as follows: fragmental voltage 135 V, nebulizer gas 35 psig, capillary voltage 4,000 V, drying gas 300°C flow 6 l/min, sheath gas 340°C flow 11 l/min. The data were collected with both centroid and profile stored in autoMSMS scan mode between a mass range MS of 100–3,200 m/z and MS/MS 30–3,200 m/z using the high-resolution mode (4 GHz). Reference masses at m/z 112.05087 and 922.009798 were introduced for online accurate mass calibration.
Data Processing and Identification of Metabolites
The acquired MS data (.d) were exported to mzdata format using the MassHunter Workstation software (version B.07.00; Agilent Technologies). The program XCMS was applied for data pretreatment procedures, such as peak discrimination, filtering, and alignment. After peak alignment of the data in the time domain and automatic integration and extraction of the peak intensities, a list of the intensities of all the peaks detected was generated using the retention time and the mass-to-ratio data pairs as the parameters for each ion. MS/MS spectra of the selected putative identifications were retrieved and matched with entries in the Metlin, Massbank, and HMDB databases. Open database sources, including the Kyoto Encyclopedia of Genes and Genomes and MetaboAnalyst, were used to identify metabolic pathways.
Statistical Analyses
Results are expressed as the mean ± standard deviation for continuous variables and as the number (percent) for categorical variables. Prior to the analysis, all metabolites were normalized to follow a normal distribution. Statistical analyses were performed using R 3.2.4. Firstly, unconditional logistic regression was performed to detect the association among metabolites and the four dry eye indexes (DEQ-5, OSDI, FBUT, and FL). Secondly, least absolute shrinkage and selection operator (LASSO) regression was conducted to detect important metabolites. Thirdly, the significant metabolic biomarker candidates were further confirmed by multiple logistic regression, with adjustment for covariates [i.e., age, sex, and hemoglobin A1c (HbA1c) levels]. Fourthly, the union set of metabolites associated with dry eye indexes was moved to the detection process of influence to dry eye. Two-sided P < 0.05 denoted statistically significant differences, and the P-values for each metabolite in all comparisons were corrected by false discovery rate correction. Finally, the expression of metabolites were converted into Log2(x + 1) values to normalize non-normal distributions. The normalized data were compared by unpaired Student’s T-test analysis.
Results
Demographic Data and Ocular Surface Parameters
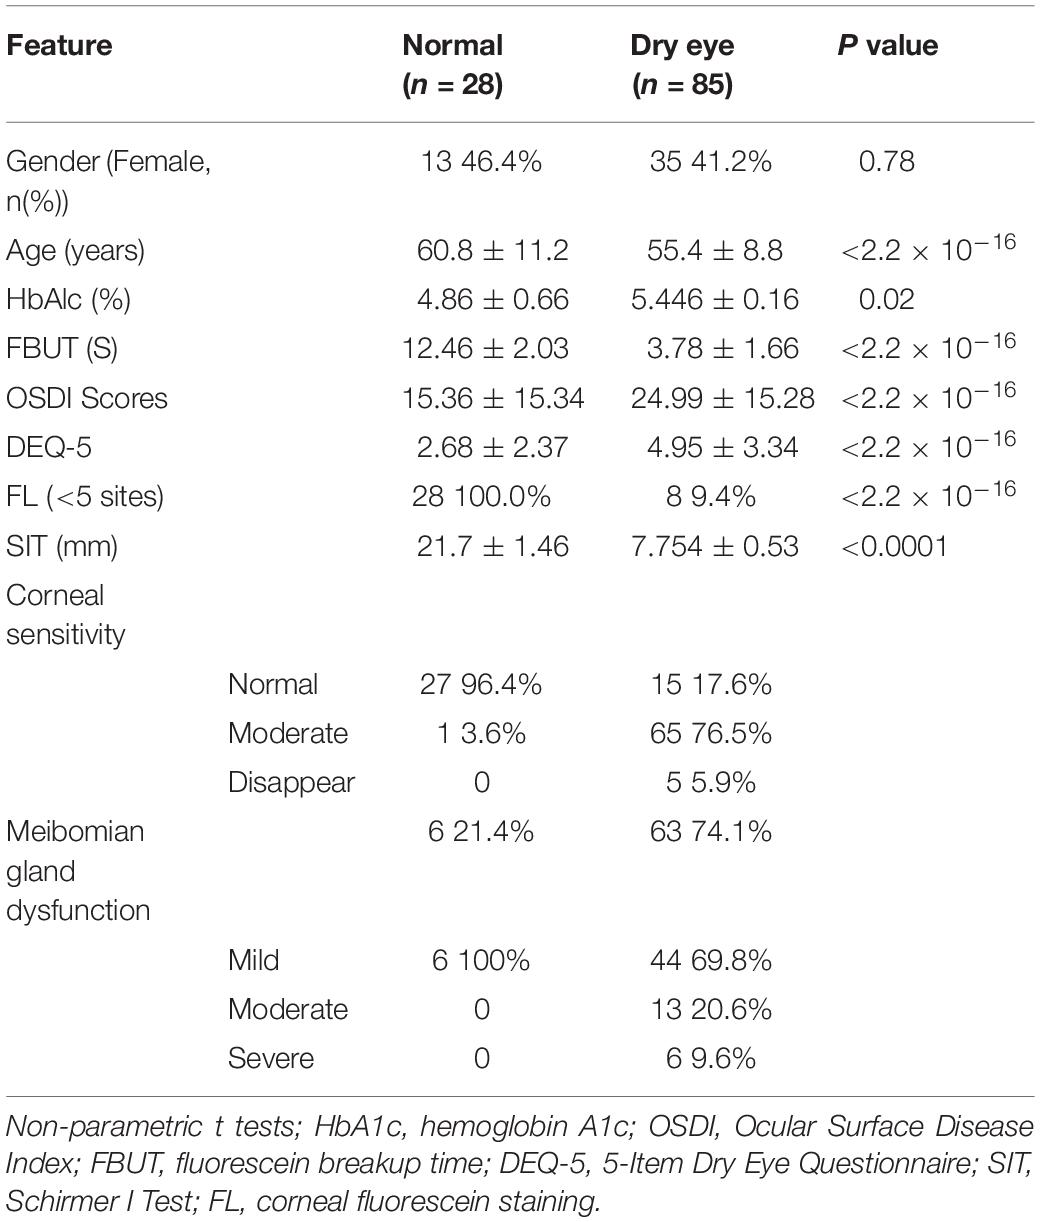
A total of 113 subjects were enrolled in this study, with 85 patients in the DEG and 28 volunteers in the CG. The demographic data and results of ocular surface parameters are shown in Table 1. Briefly, there were 46.4% females in the CG and 41.2% in the DEG. The mean ages of subjects in the CG and DEG, with an unbalanced distribution, were 60.8 ± 11.2 and 55.4 ± 8.8 years, respectively (P < 0.0001). The mean levels of HbA1c in the CG and DEG were 4.86% ± 0.66% and 5.446% ± 0.16%, respectively. The results of the comparison showed that the OSDI and DEQ-5 scores of patients in the DEG were higher than those recorded in the CG (P < 0.0001 and P < 0.0001, respectively). The patients in the DEG showed lower FBUT values and SIT scores compared with those in the normal group (P < 0.0001 and P < 0.0001, respectively), strongly suggesting that tear film stability was altered in DEG patients. Additionally, the patients in the DEG showed lower corneal sensitivity and severe corneal injury compared with the subjects in the CG (P < 0.0001).
Association Among Metabolites and Dry Eye Indexes
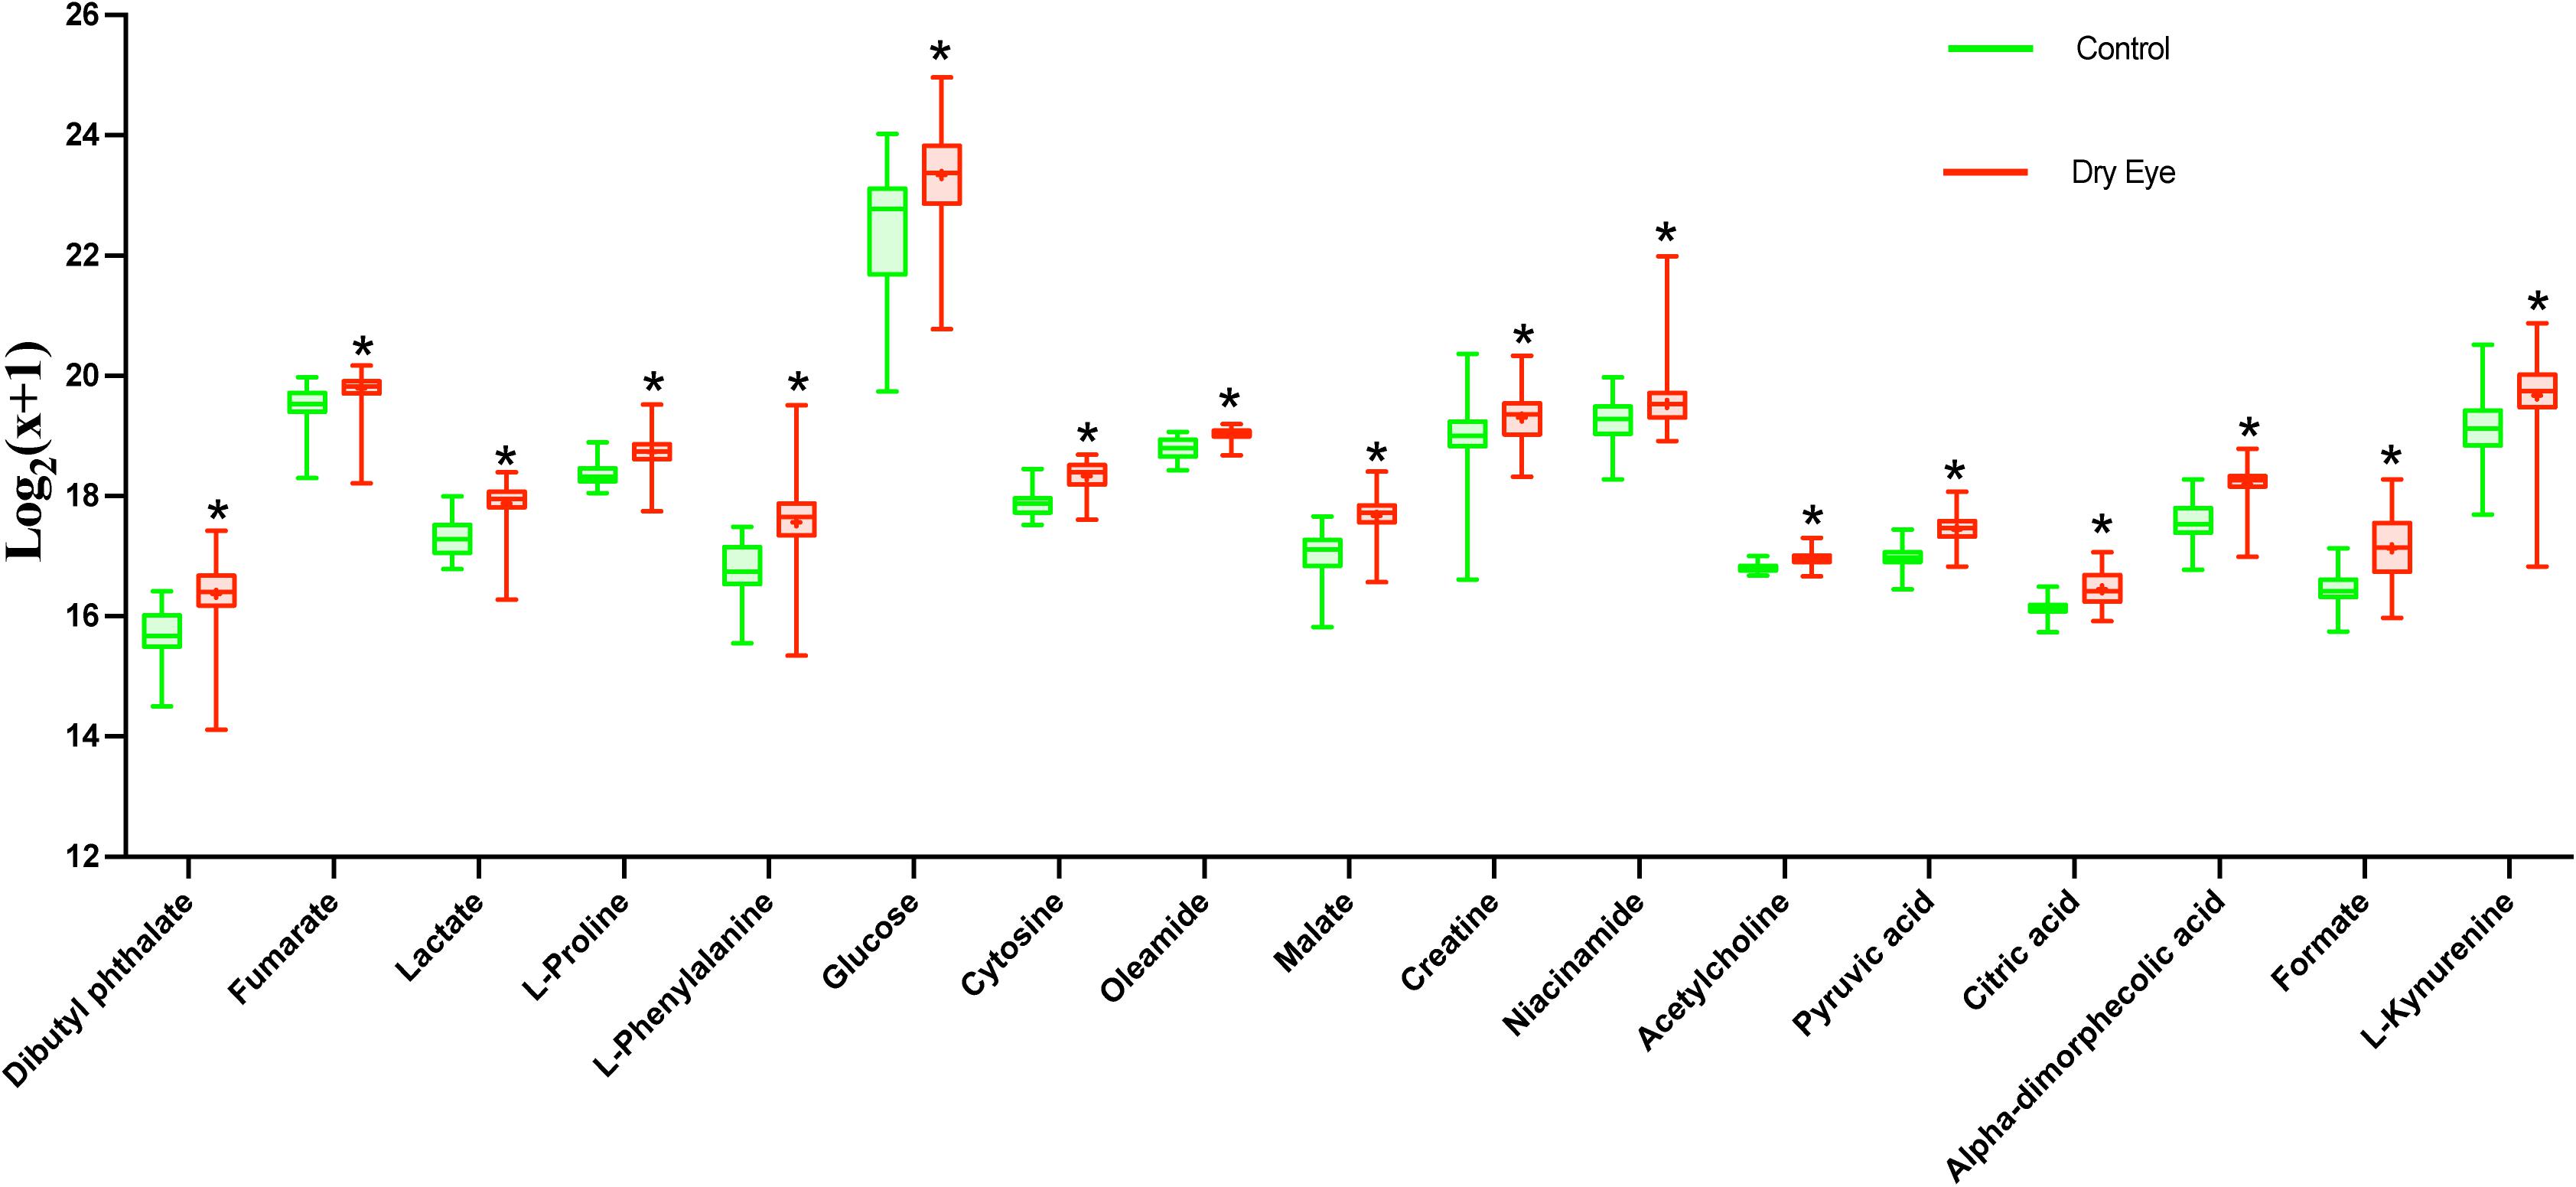
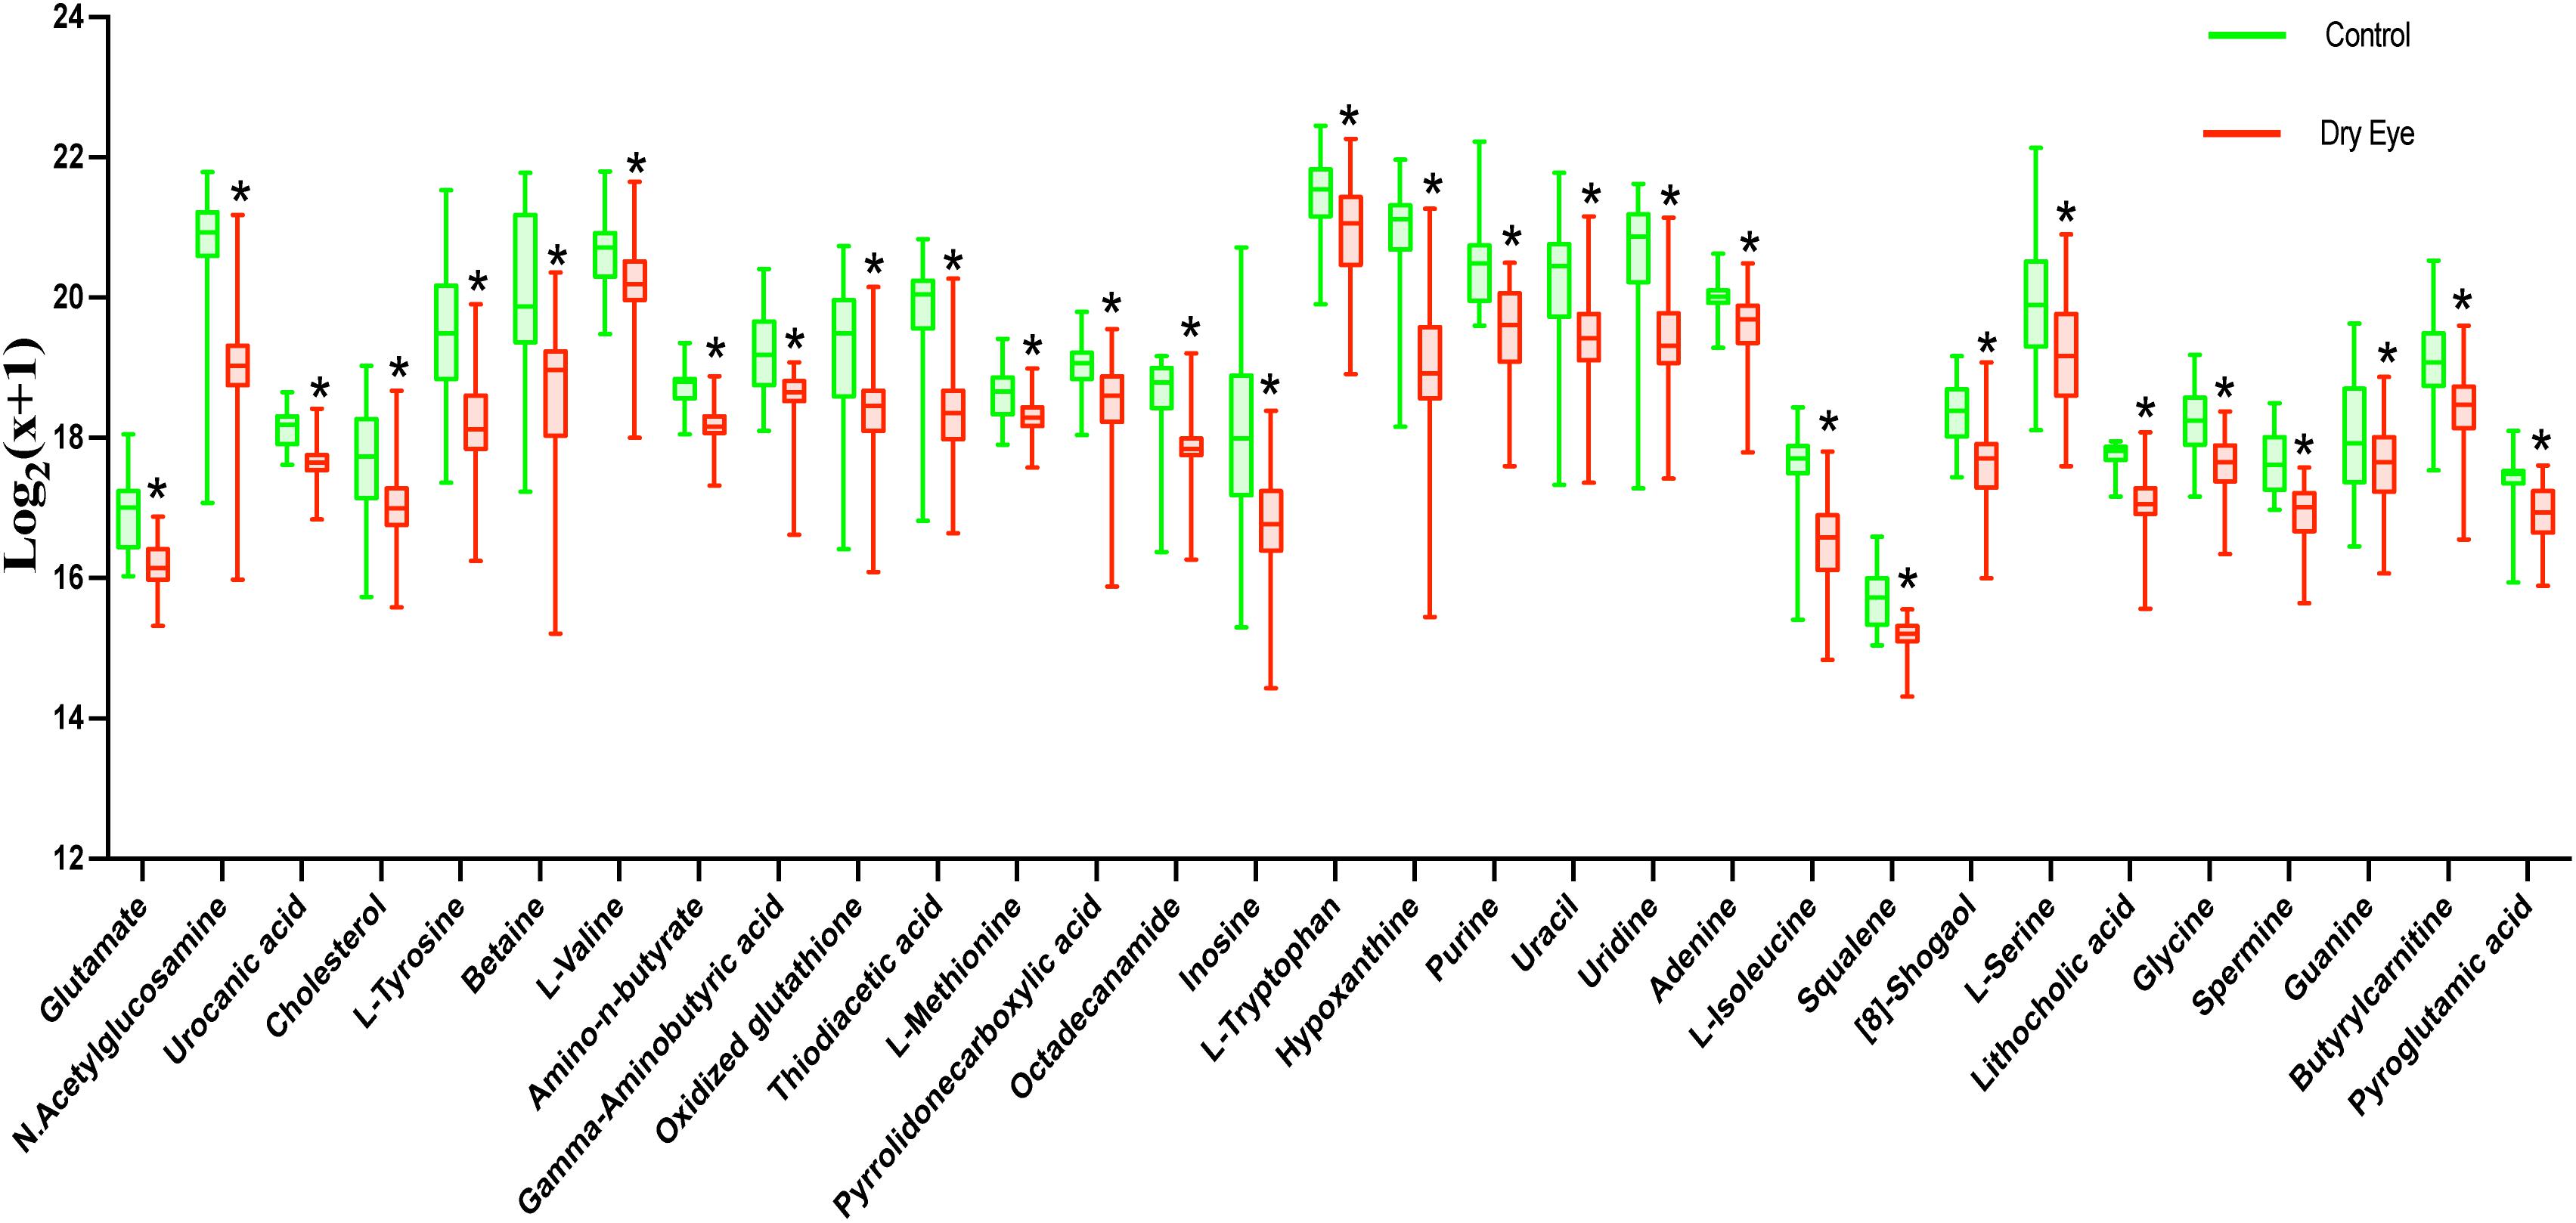
The relationship among metabolites and dry eye indexes is demonstrated in Supplementary Table S2. The results showed that 37, 991, and 598 metabolic features exerted potential effects on the OSDI, FBUT, and FL, respectively. However, none of the metabolites were significantly associated with the DEQ-5 score, which was lower than the meaningful value in both groups. The LASSO regressions accurately identified the important metabolic biomarker candidates. As shown in Figures 1A–C, 20, 57, and 57 metabolic features were retained for FBUT, OSDI, and FL, respectively. After adjusting for age, sex, and HbA1c levels, 4 of 20 metabolic features remained significant for OSDI, 42 of 57 for FBUT, and 26 of 57 for FL (Tables 2–4). There is a potential mechanism by which metabolic features are related to OSDI, FBUT, or FL and may contribute to DED. Therefore, the biomarker candidate union set was further modified to confirm the relationship with DED. As shown in Table 5, 48 of 51 metabolic features contributed to the incidence of DED. Figures 2, 3 show the 17 increasing and 31 decreasing metabolites by fold change.
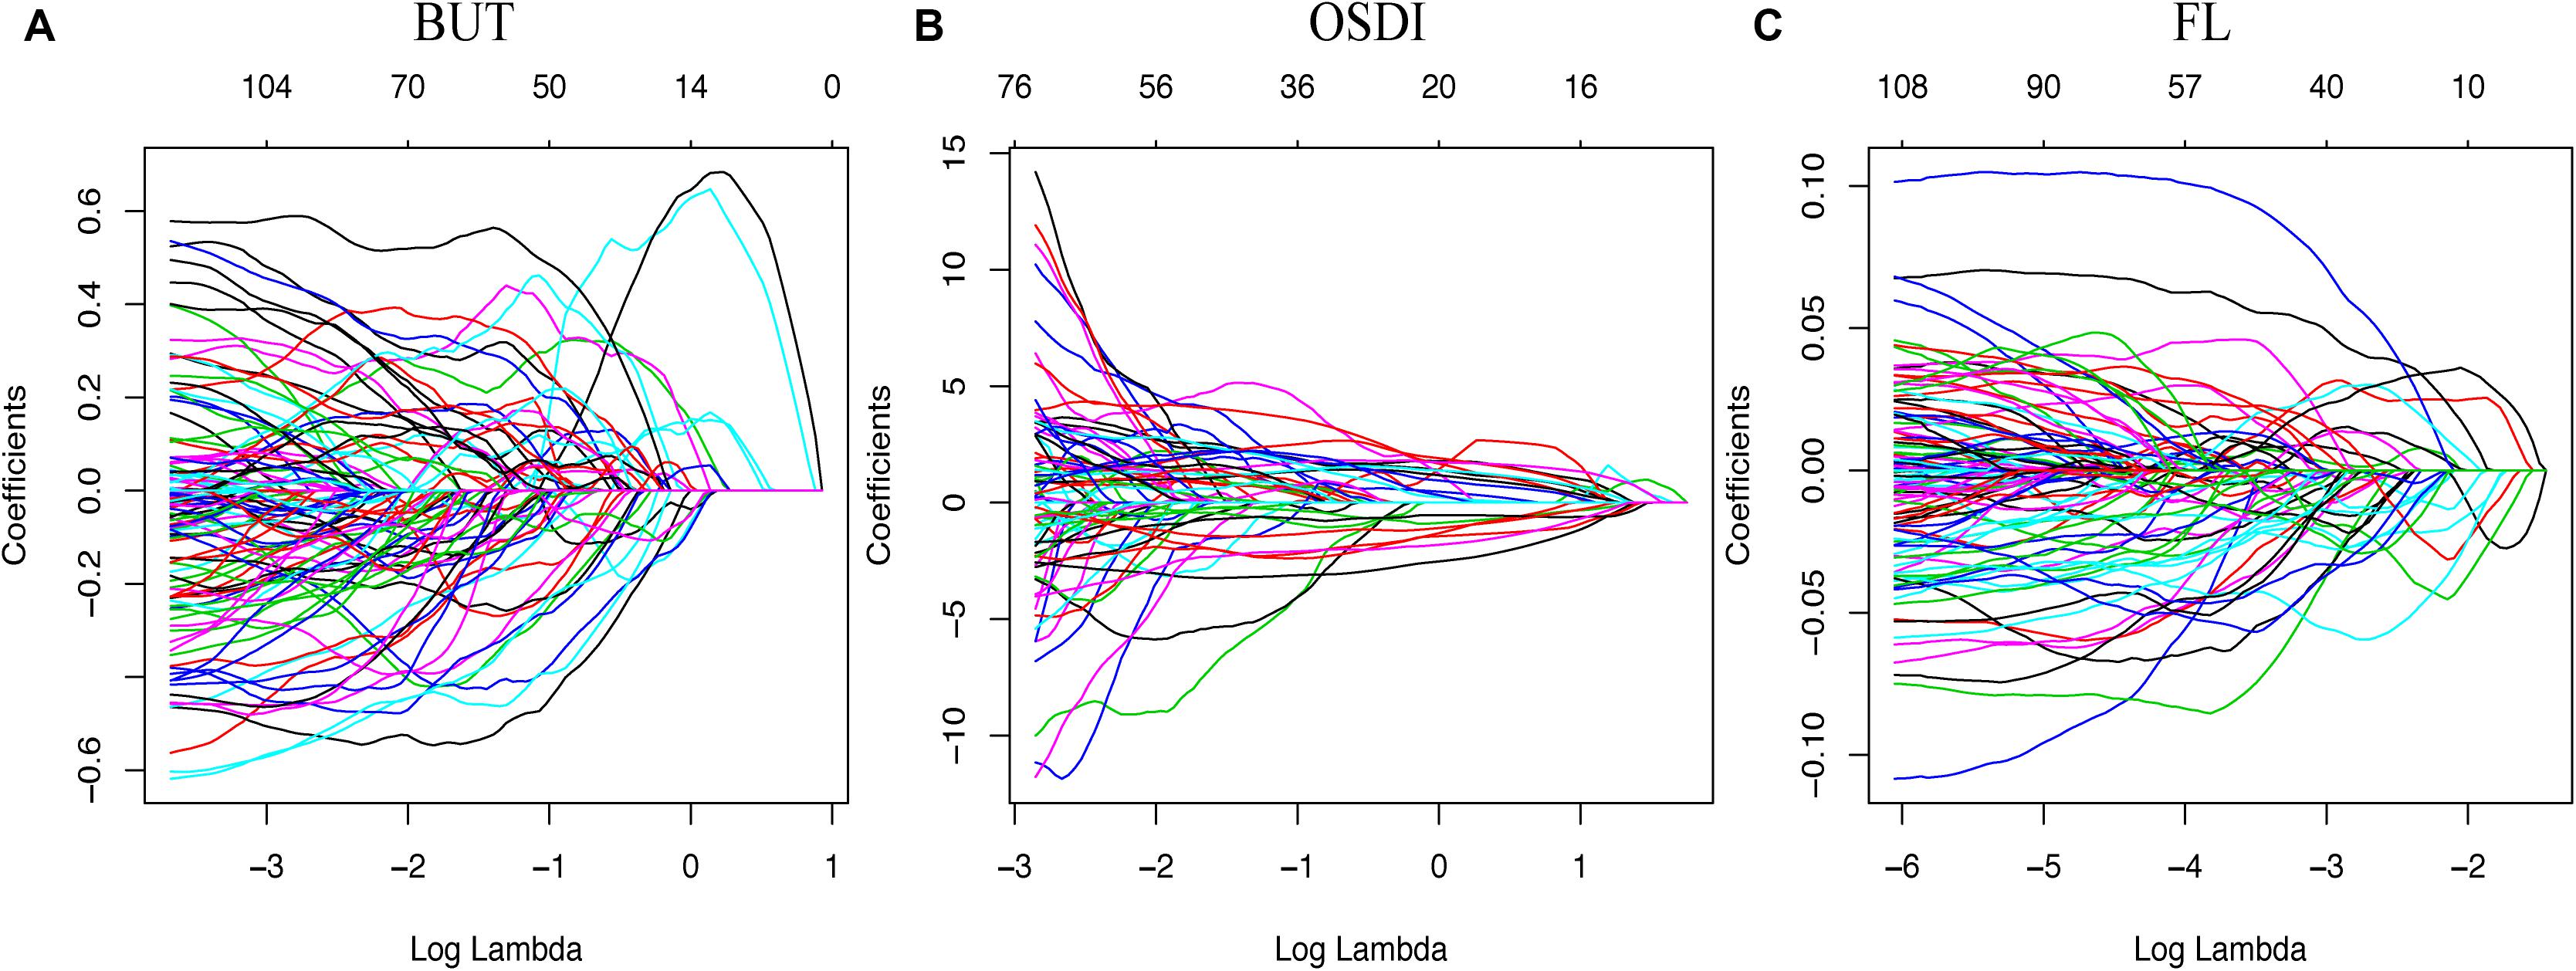
Figure 1. Model for least absolute shrinkage and selection operator (LASSO). Color lines represent the metabolites potentially associated with dry eye. The x-axis represents the alpha (cutoff), and the y-axis represents the shrink effect value.
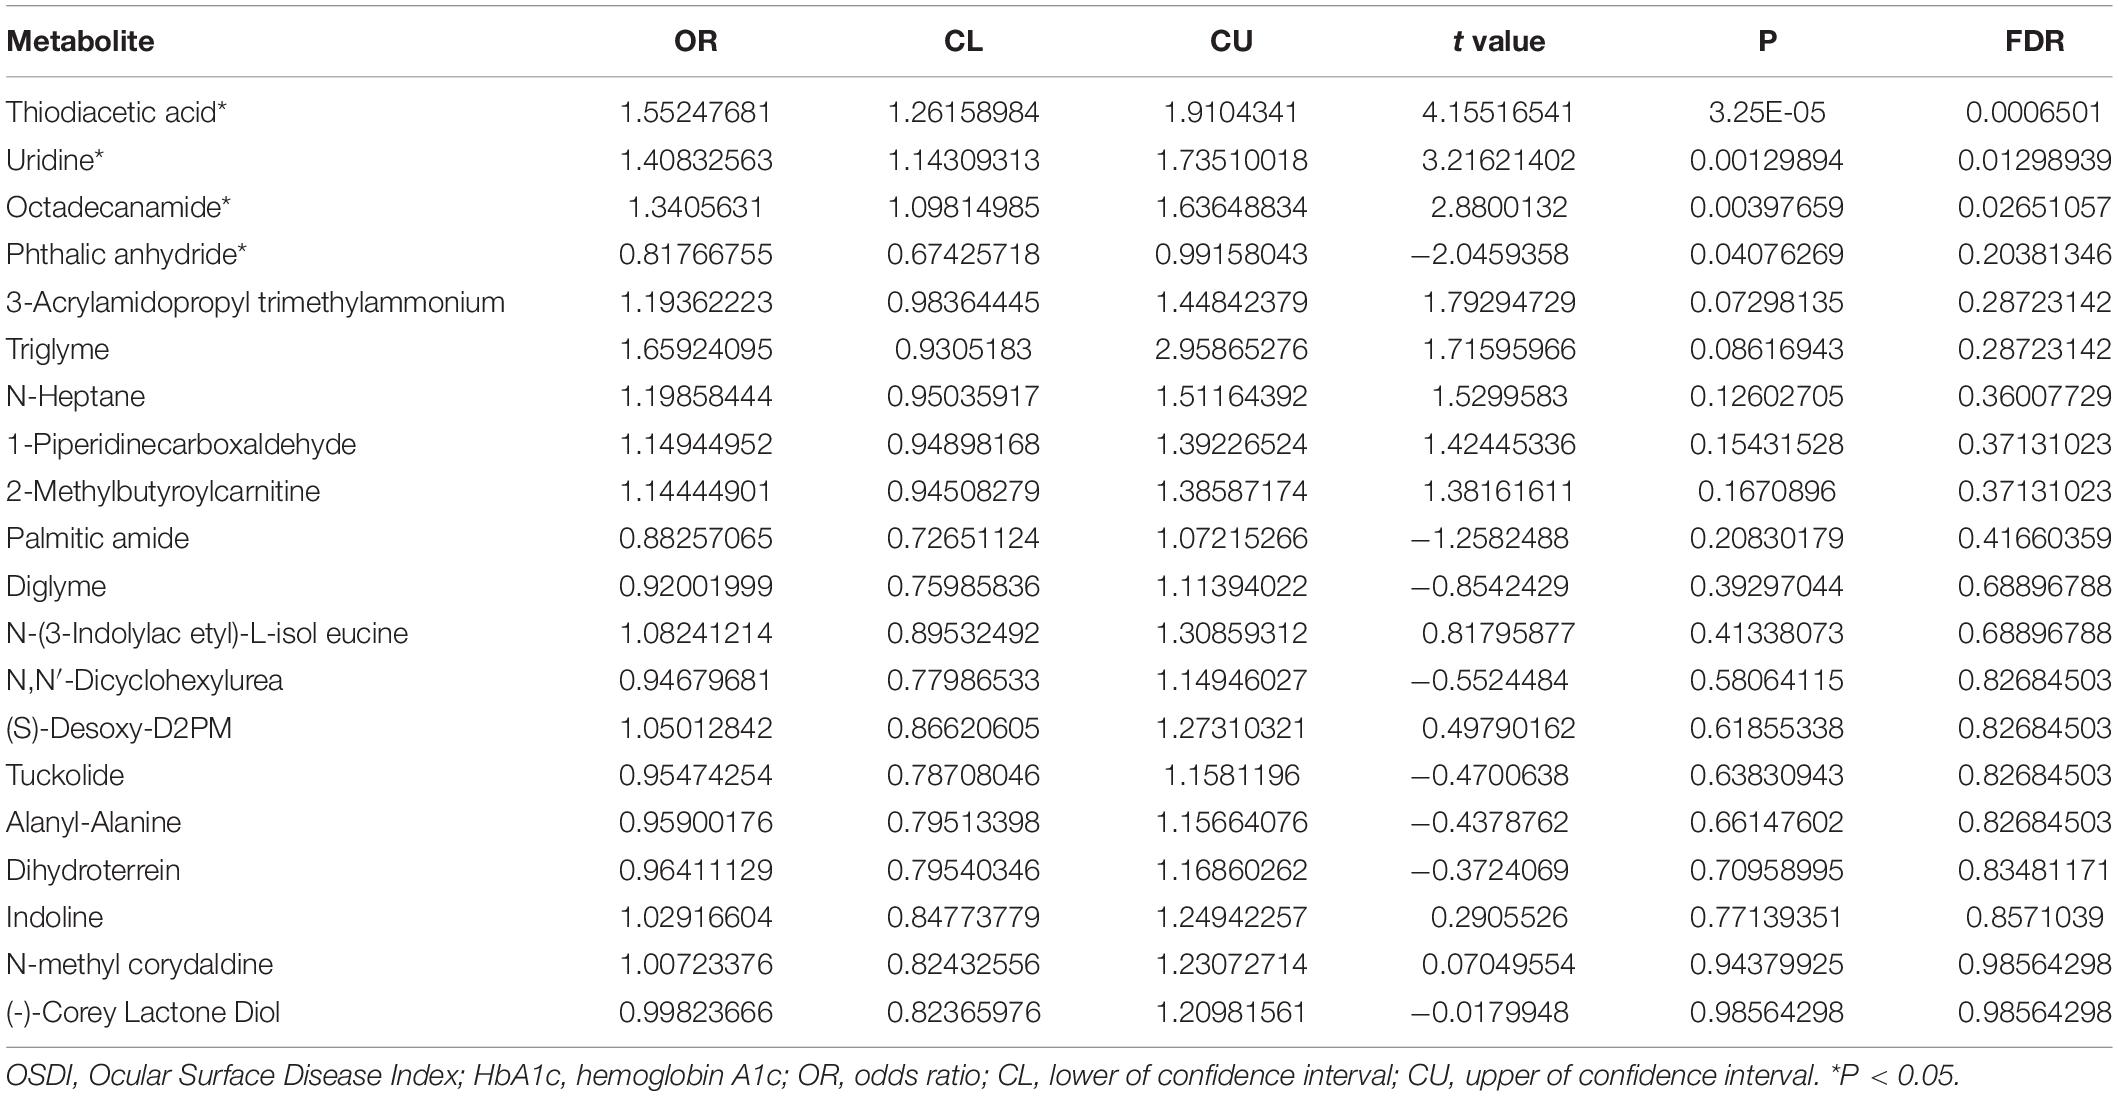
Table 2. The 4 most significant metabolites associated with OSDI among 20 significant metabolites adjusted for age, sex, and HbA1c levels.
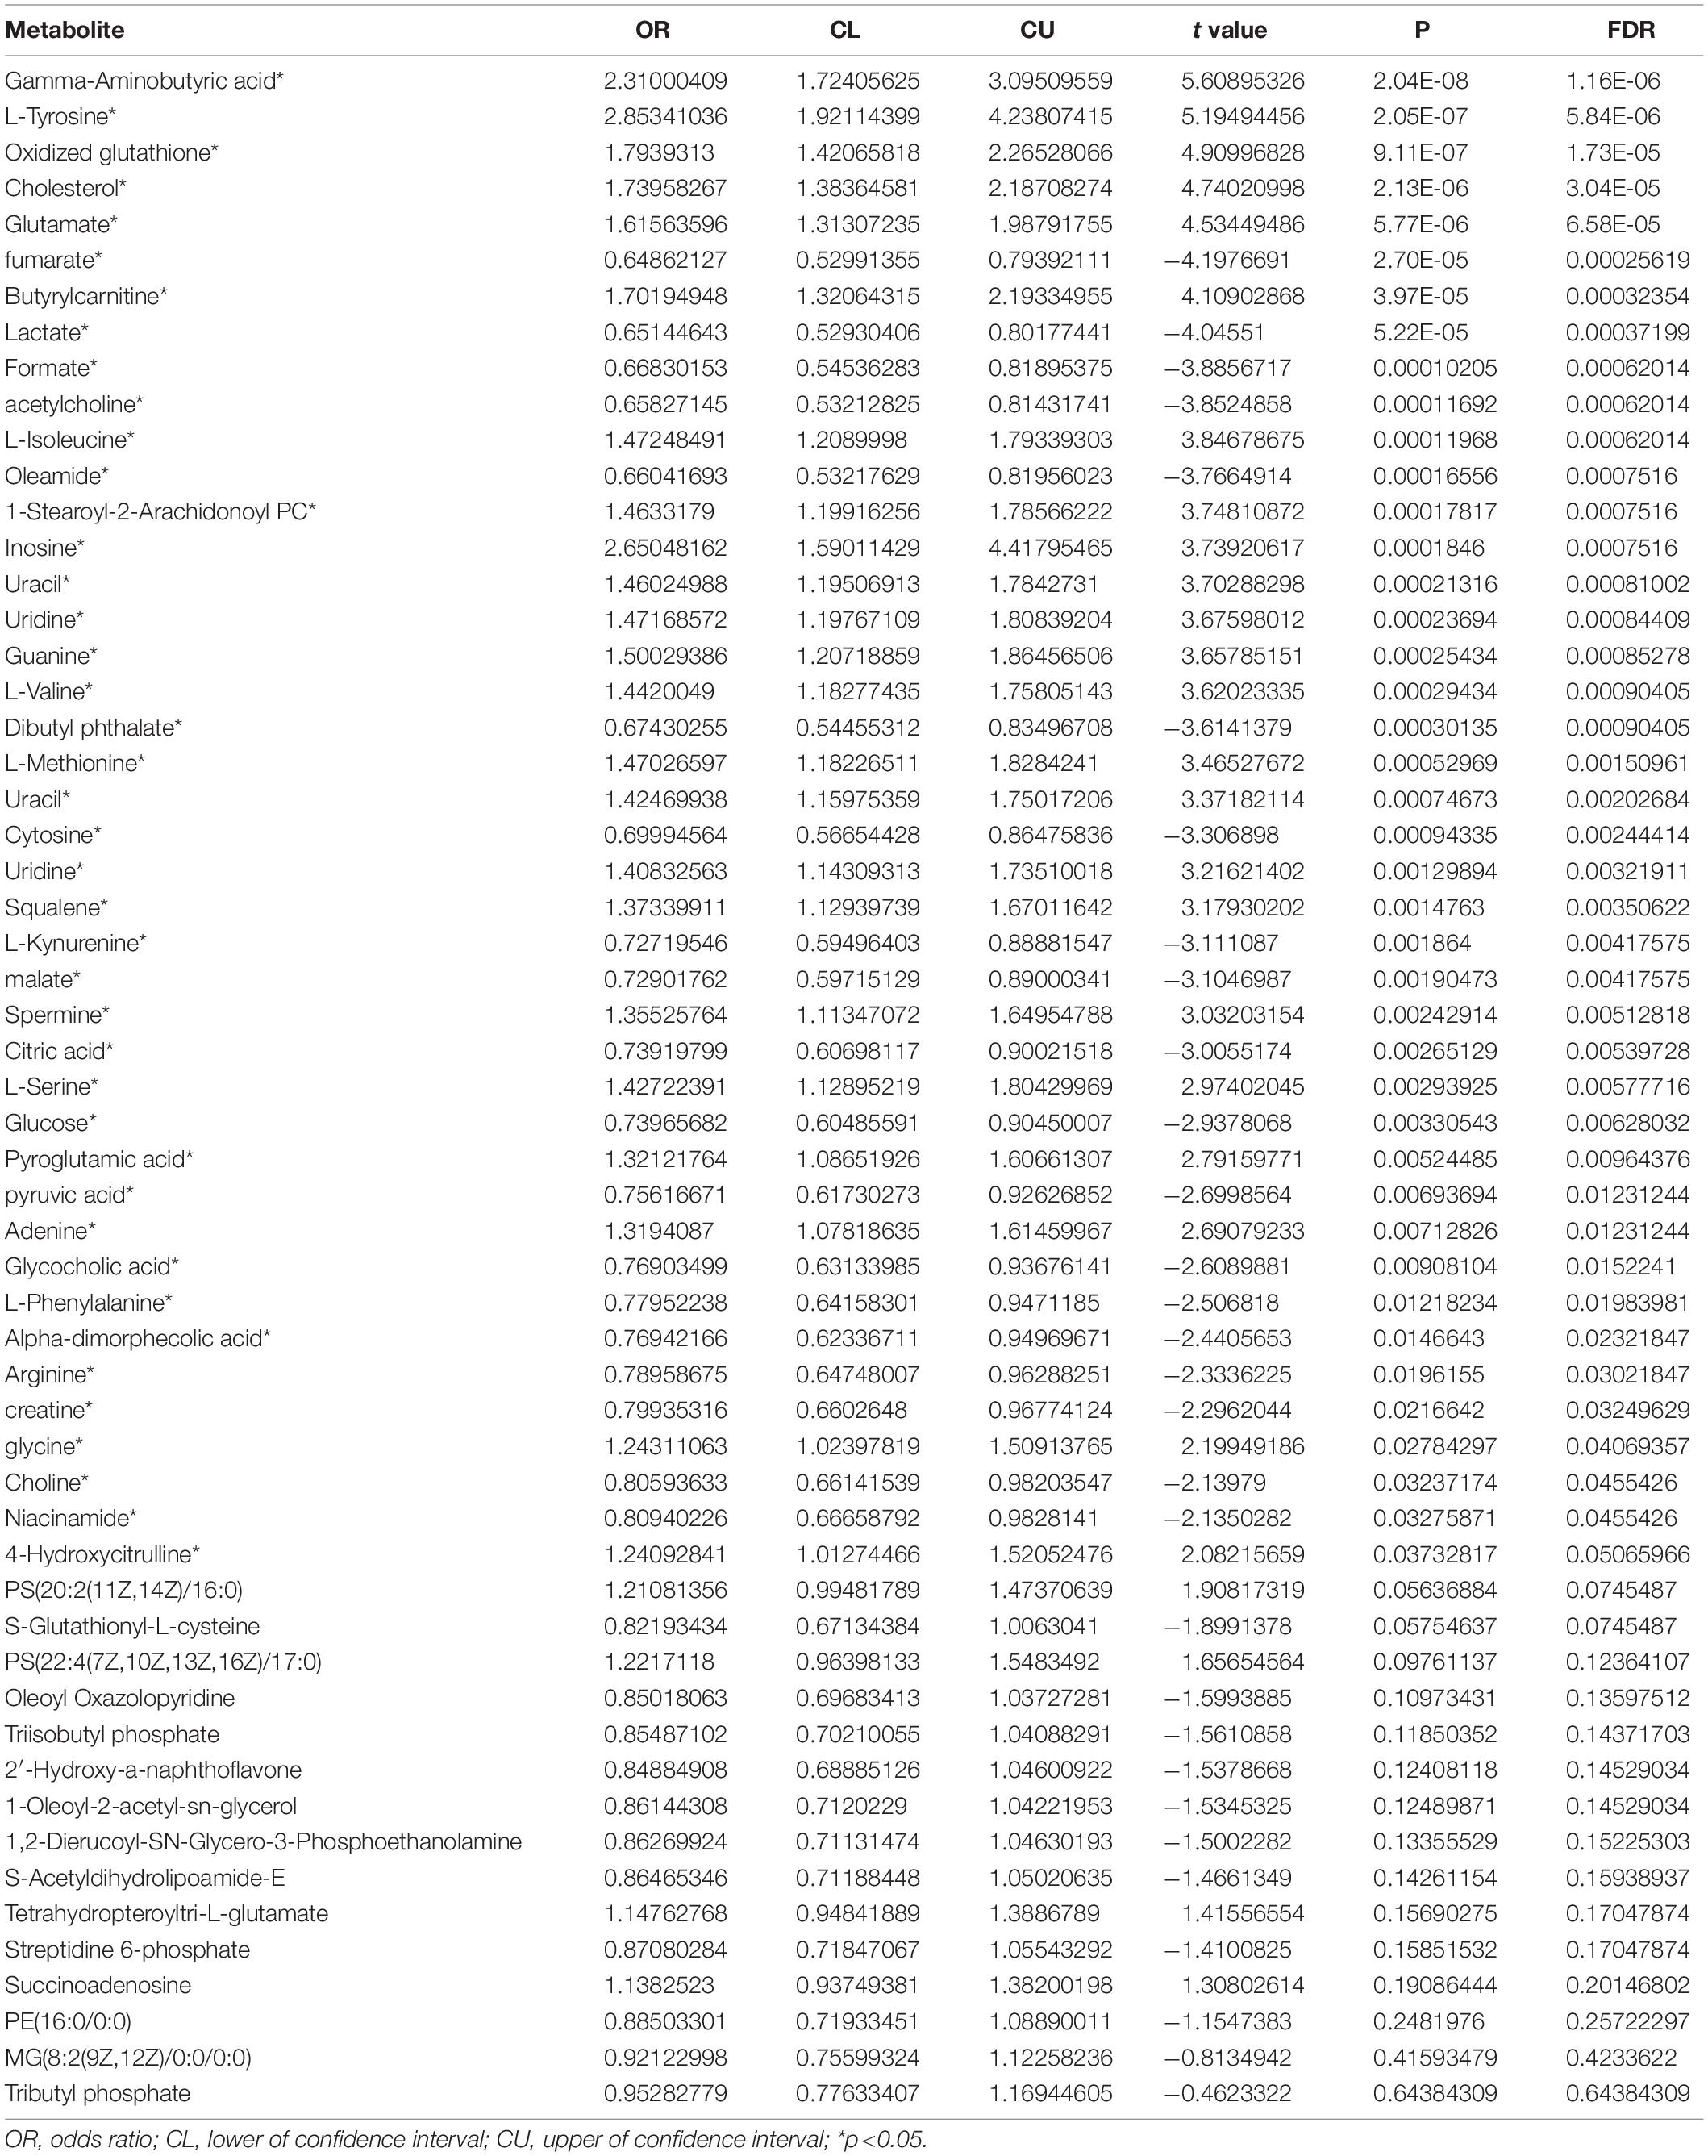
Table 3. The 42 most significant metabolites associated with FBUT out of 57 significant metabolites adjusted of age, sex, and HbA1c level.
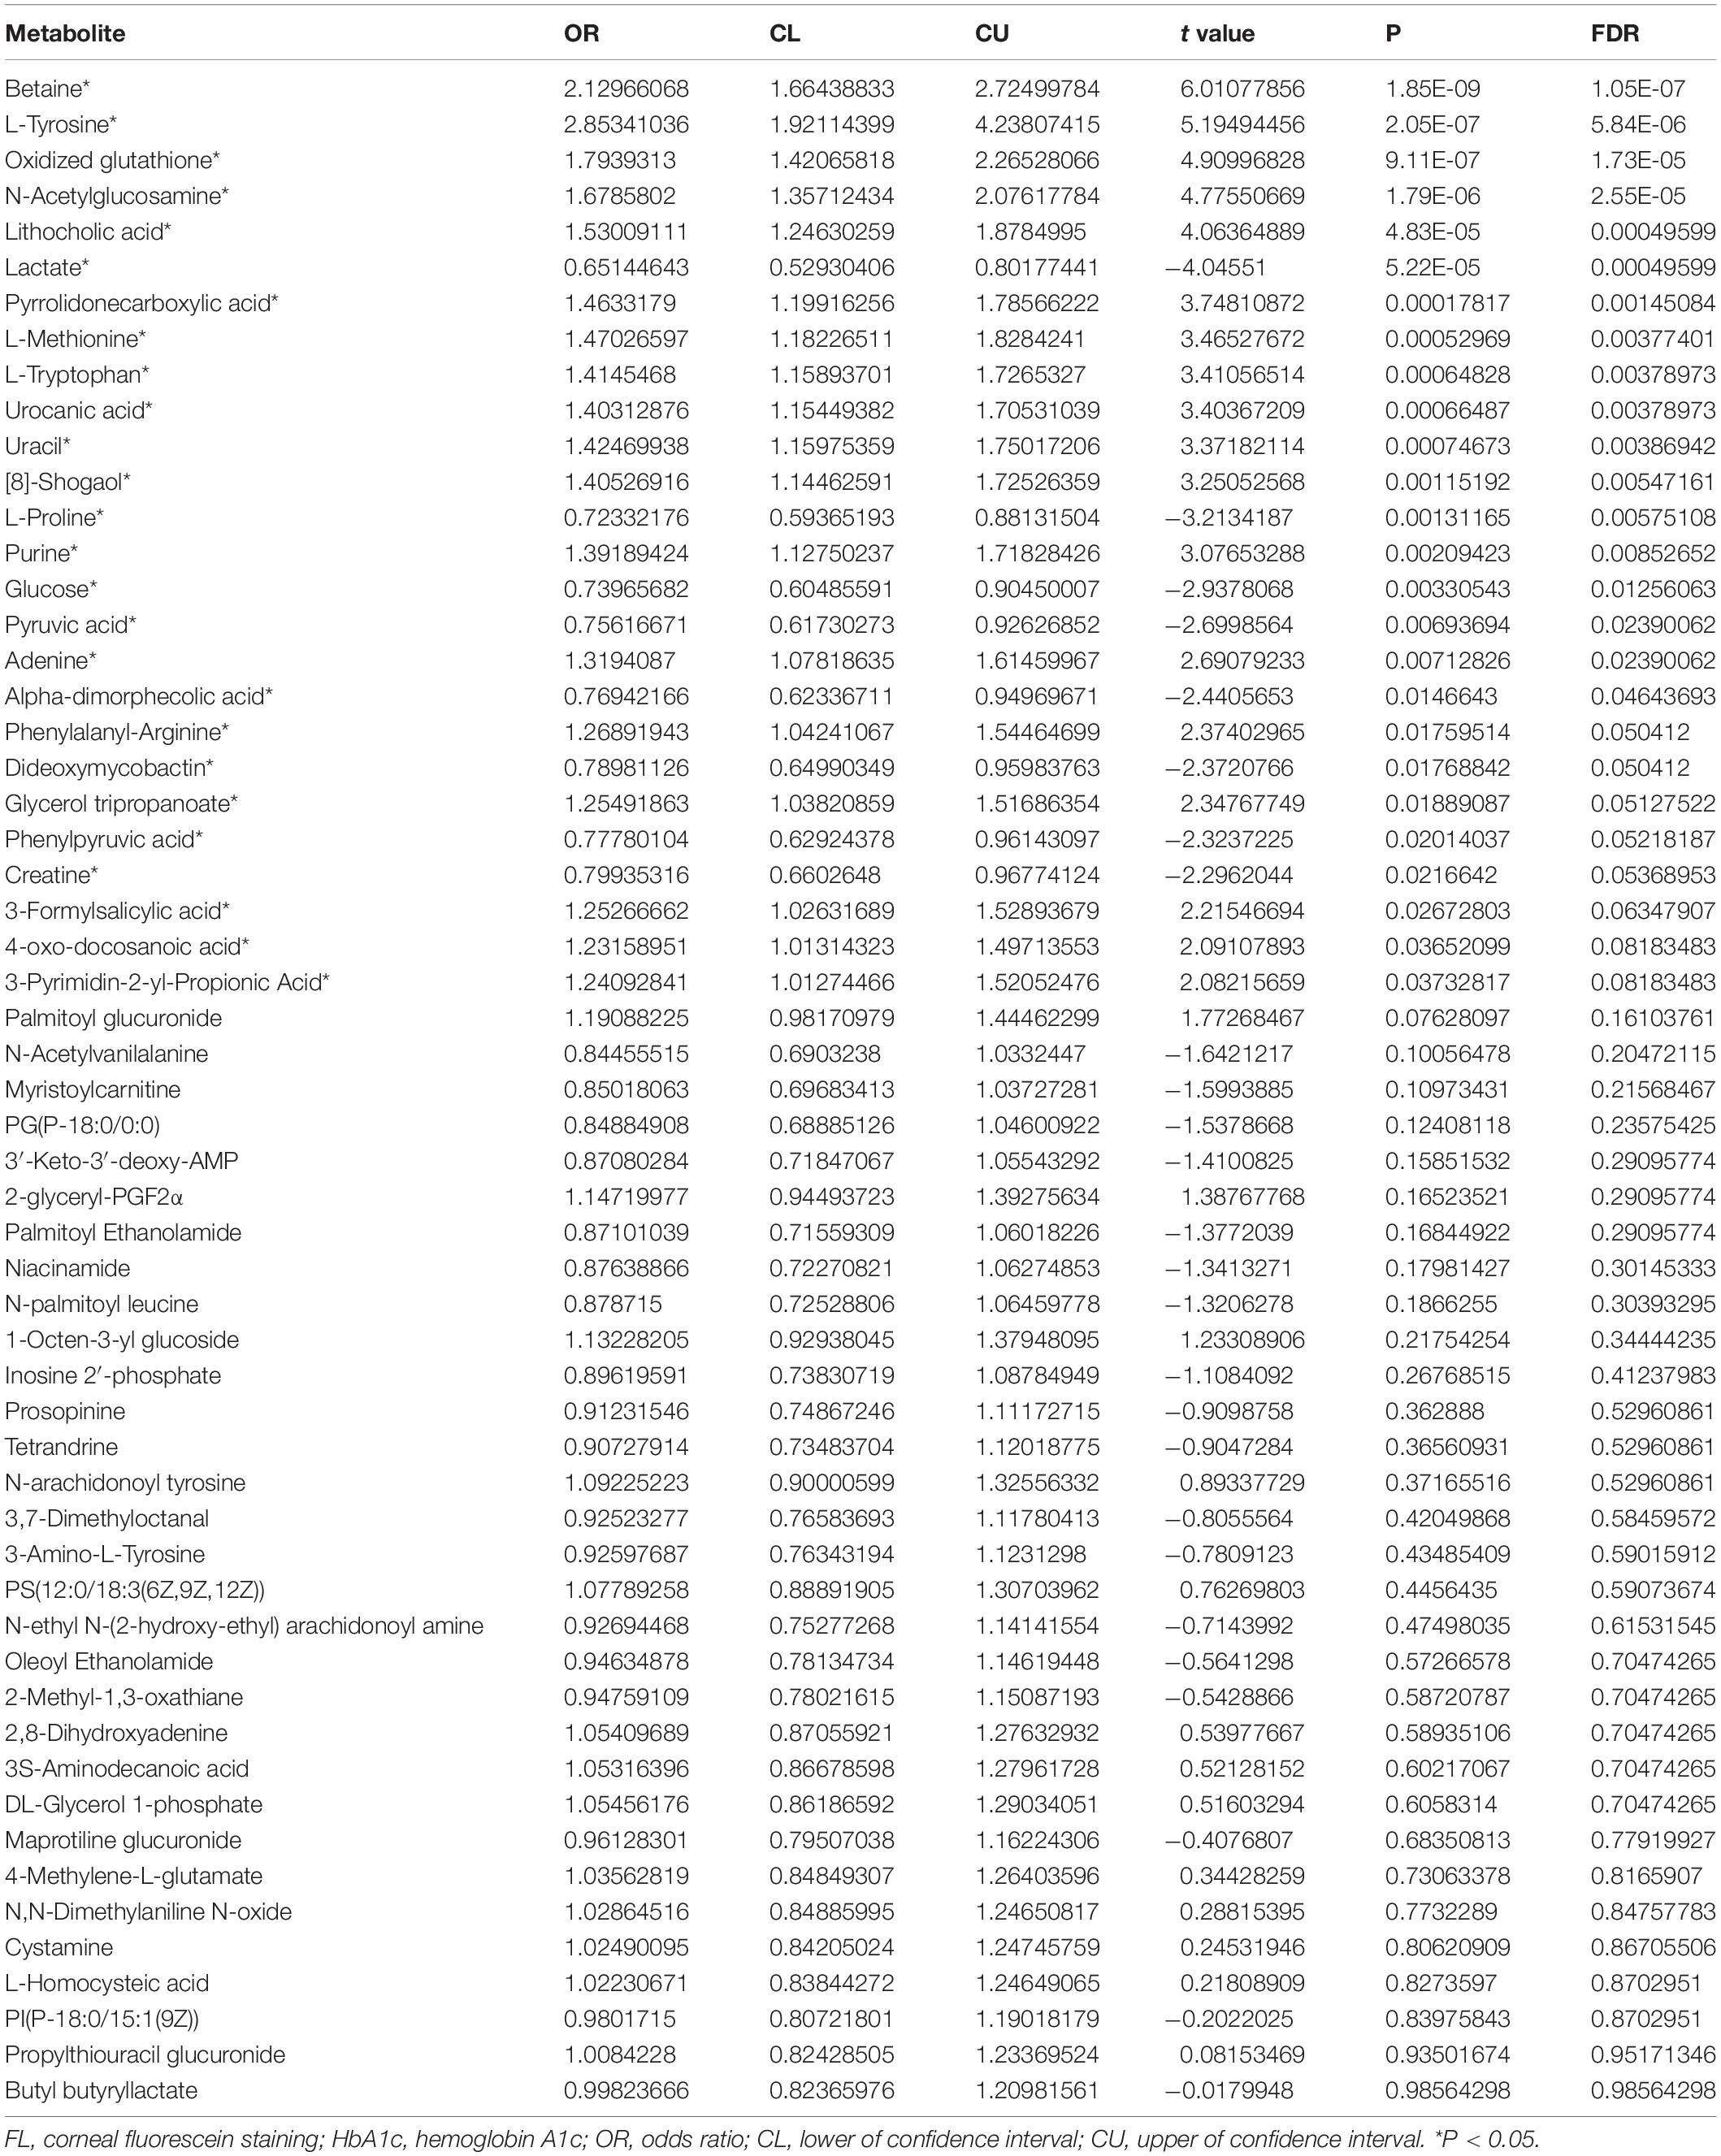
Table 4. The 26 most significant metabolites associated with FL among 57 significant metabolites adjusted for age, sex, and HbA1c levels.
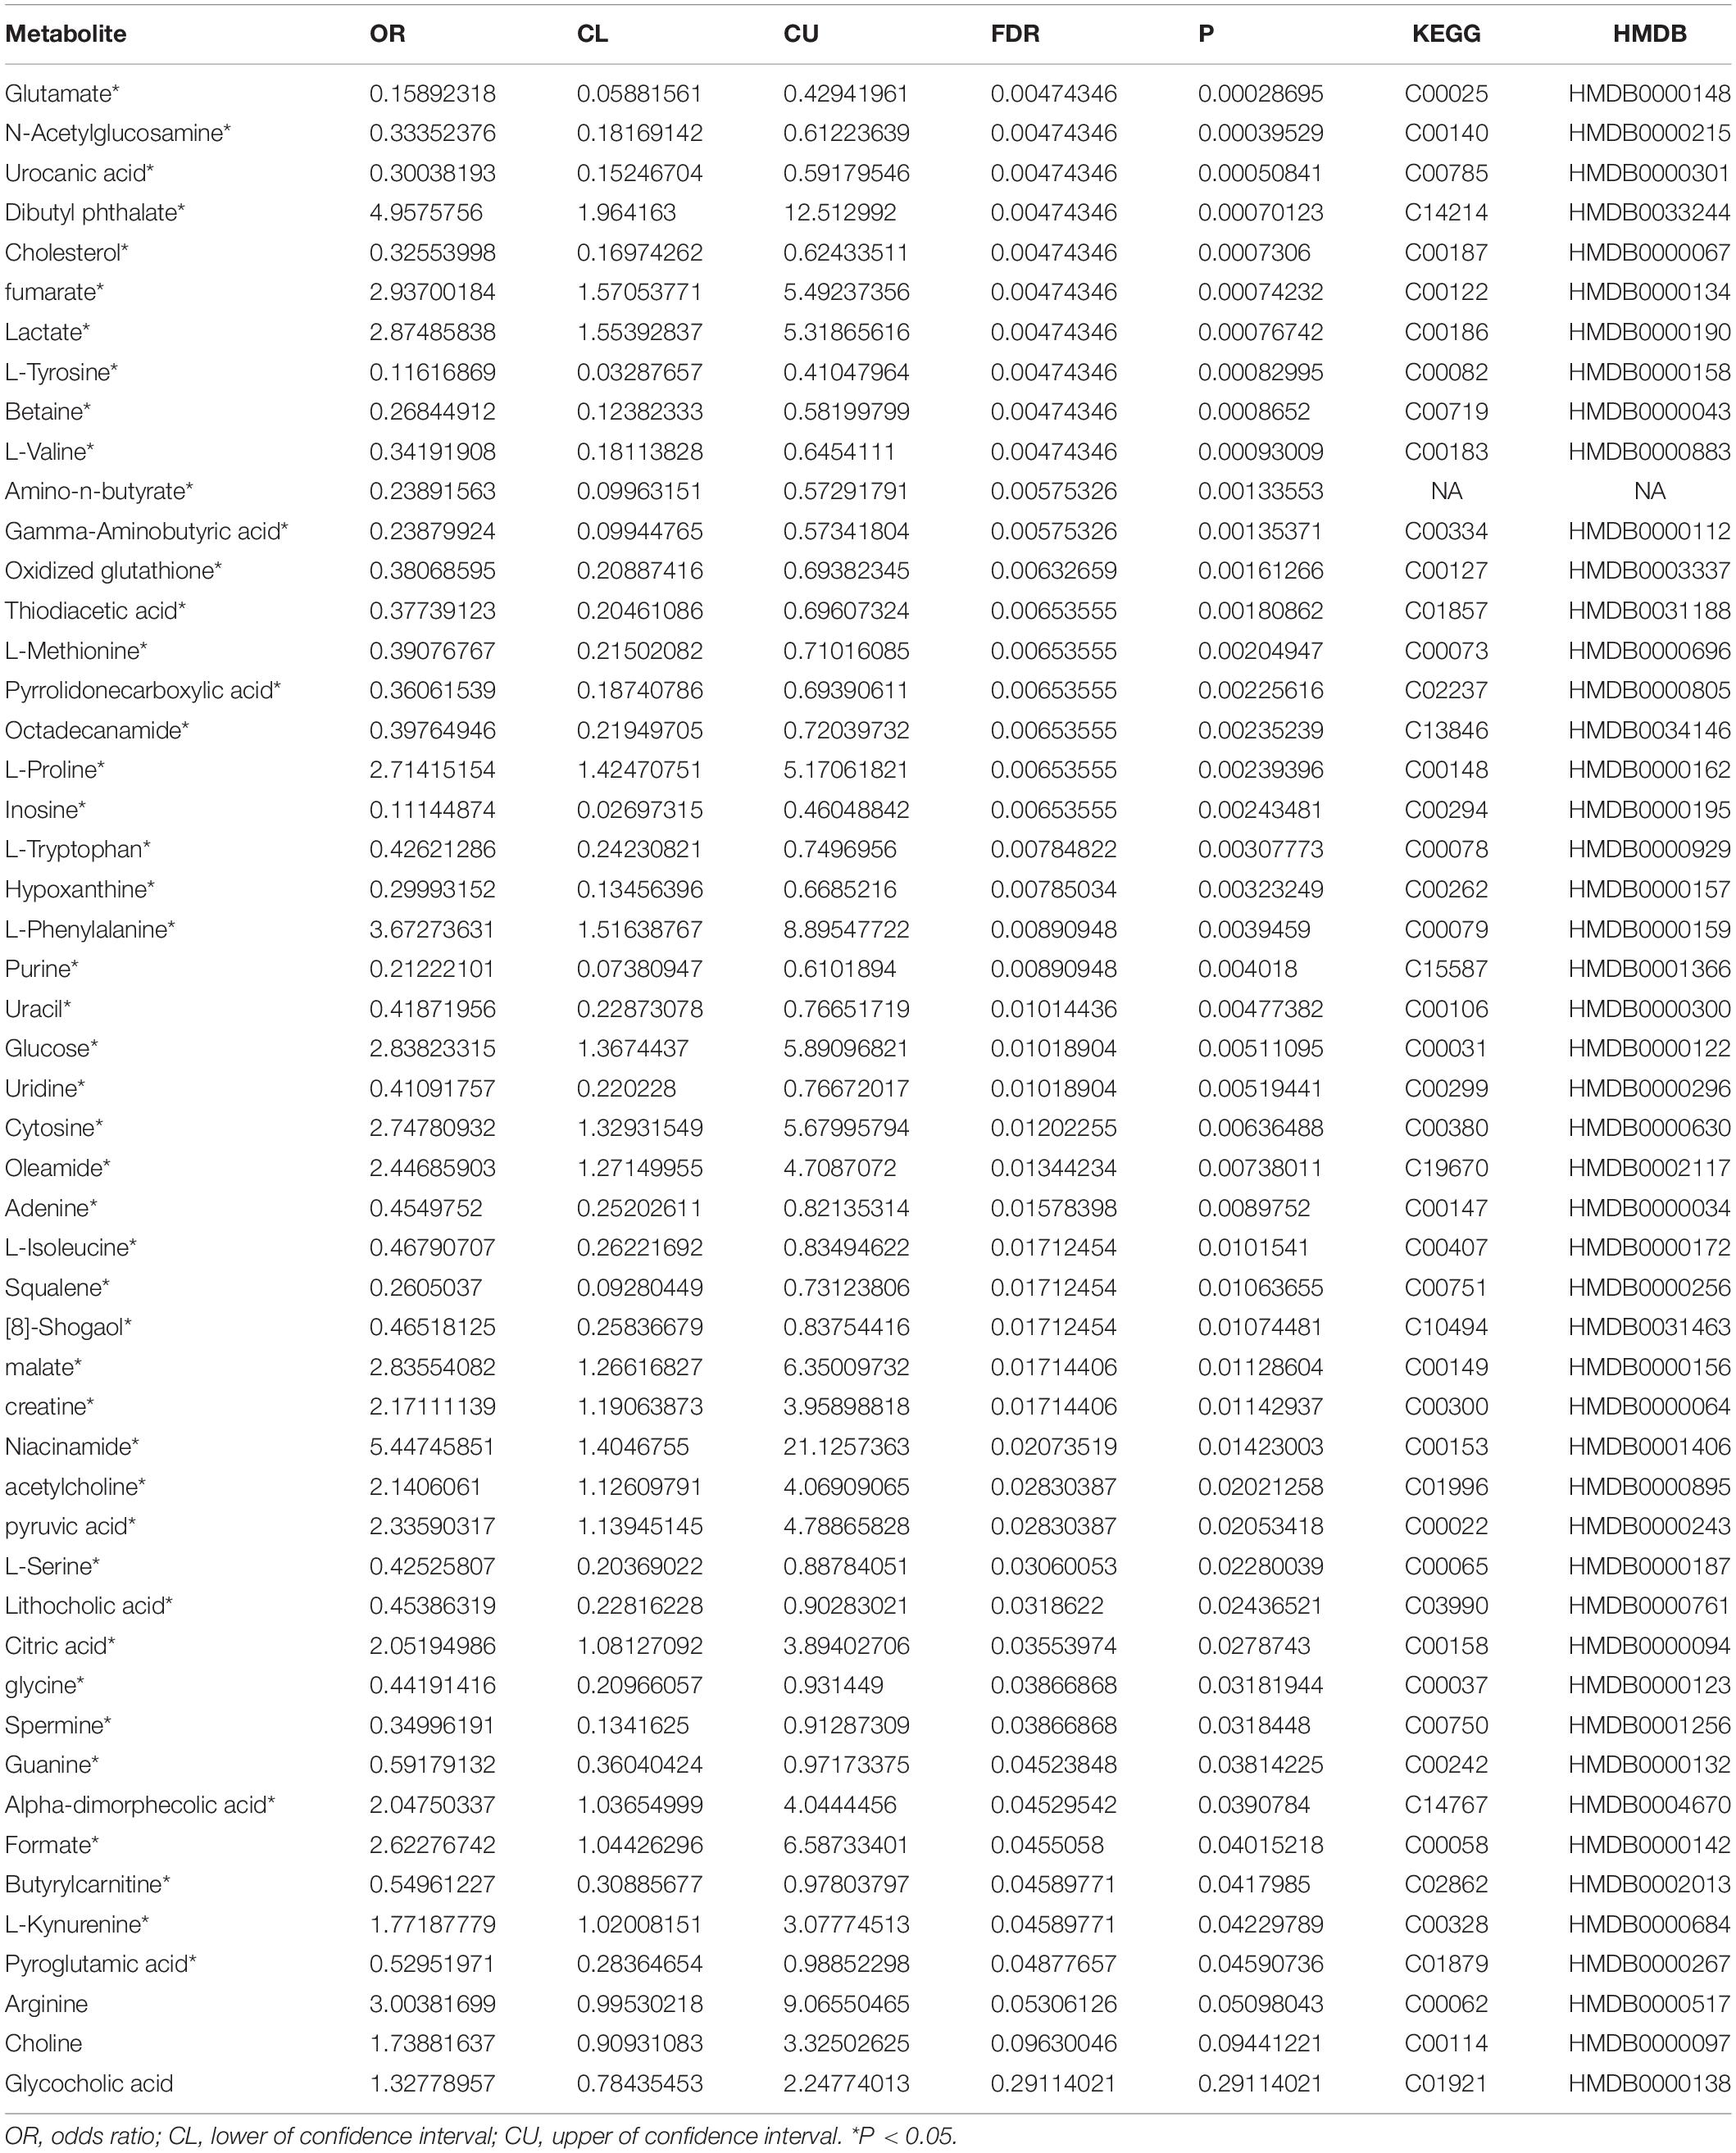
Table 5. The 48 most significant metabolites among 51 metabolites which contributed to the incidence of dry eye.
Trends of Metabolites Related to Dry Eye in Different Age Groups
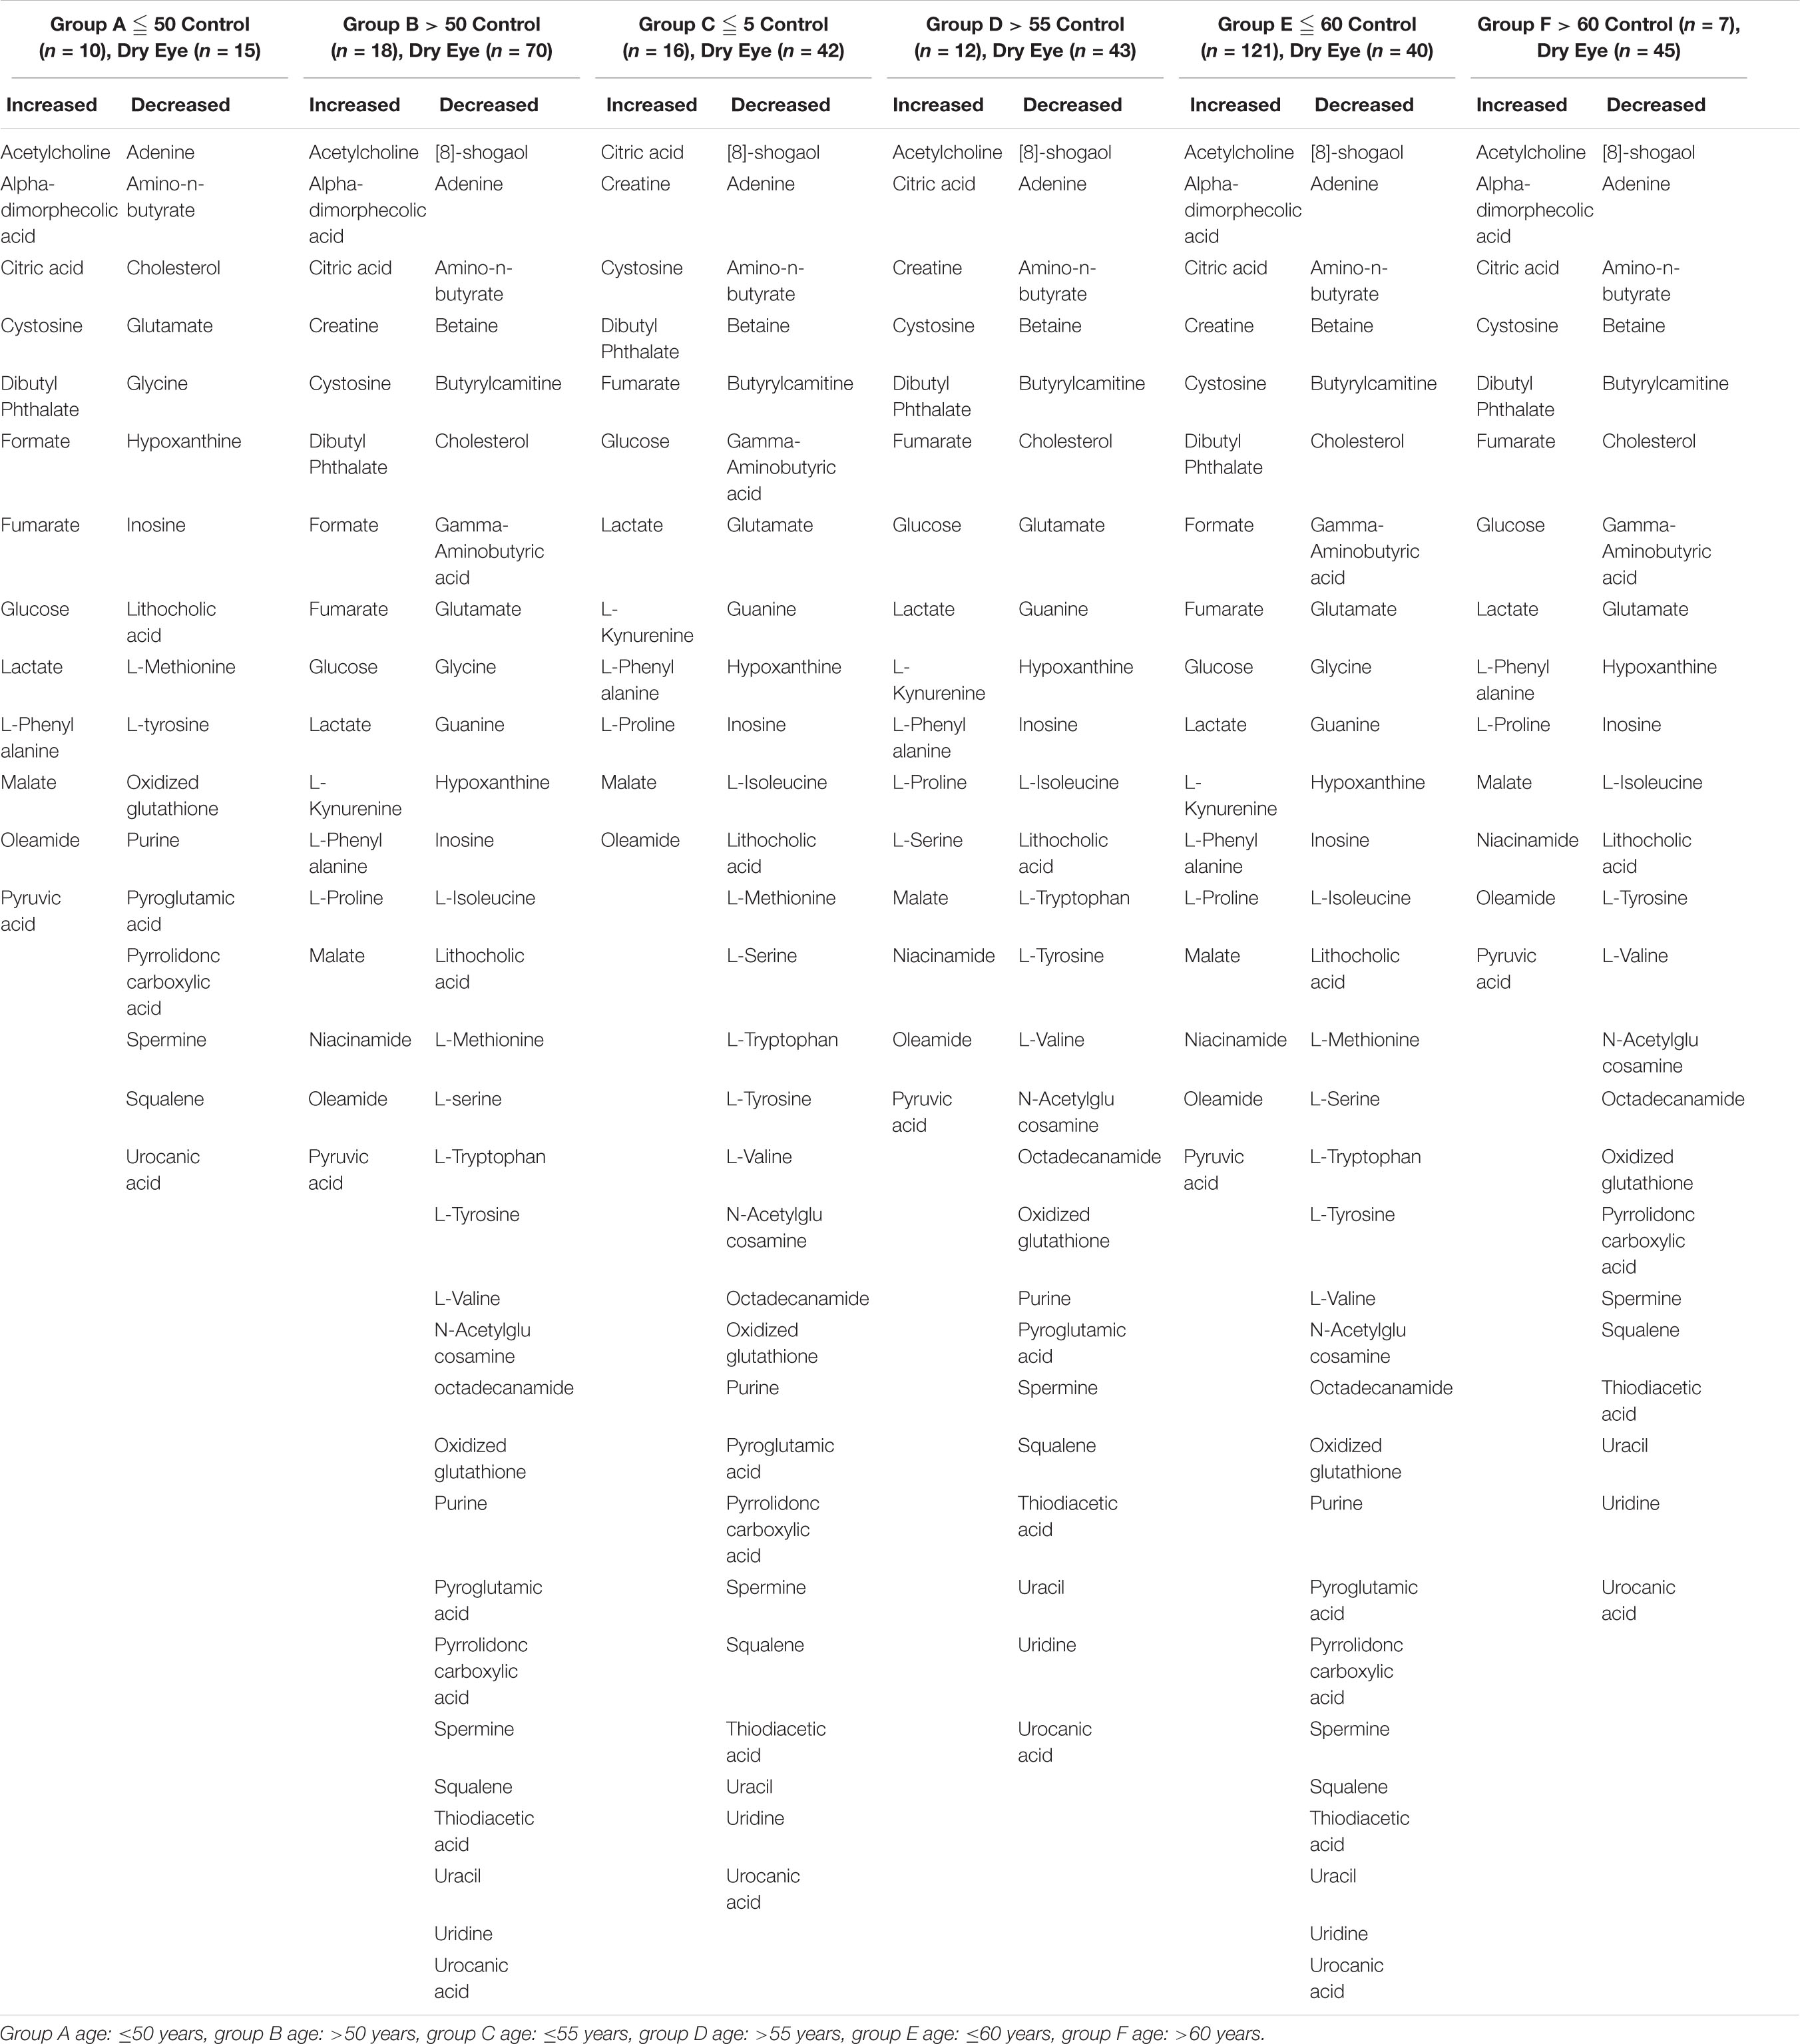
We analyzed the relationship between metabolites and age. All subjects were grouped into two groups with the age nodes of 50 years (group A ≤ 50, group B > 50), 55 years (group C ≤ 55, group D > 55), and 60 years (group E ≤ 60, group F > 60). The increasing and decreasing metabolites are shown in Table 6. In group A, 18 of 48 metabolites did not show significance, and the remaining 30 metabolites showed the same trend in groups A and B. The 18 metabolites were subjected to enrichment and pathway analyses. Supplementary Figures S1A–C present the perturbed pathways. The 18 metabolites were related to the aminoacyl-tRNA biosynthesis, glycine, serine, and threonine metabolism, arginine and proline metabolism, valine, leucine, and isoleucine biosynthesis, pantothenate, and Coenzyme A biosynthesis. Comparison of groups C and D revealed that three metabolites (i.e., alpha-dimorphecolic acid, formate, and glycine), which were significant between the CG and DEG, did not show significance in each group. Of note, 39 metabolites showed the same trend in each group. Interestingly, acetylcholine, niacinamide, and pyruvic acid increased only in group D. The only decreasing metabolite in group C was cholesterol, while gamma-aminobutyric acid and L-methionine decreased in group D. In addition, an opposite trend was observed between groups C and D for L-serine. Enrichment and pathway analyses on the six metabolites are shown in Figures 4A–C. The data showed that the perturbed pathways and glutamate, glycine and serine, pyruvaldehyde, degradation, glucose–alanine cycle, and alanine metabolism were related. In the comparison of groups E and F, 10 of 48 metabolites did not show significance in group F, and the remaining 38 metabolites showed the same trend in each group. Enrichment and pathway analyses of the 10 metabolites showed that aminoacyl-tRNA biosynthesis, glycine, serine and threonine metabolism, glyoxylate and dicarboxylate metabolism, tryptophan metabolism, cysteine and methionine metabolism, and glutathione metabolism were involved (Supplementary Figures S2A–C).
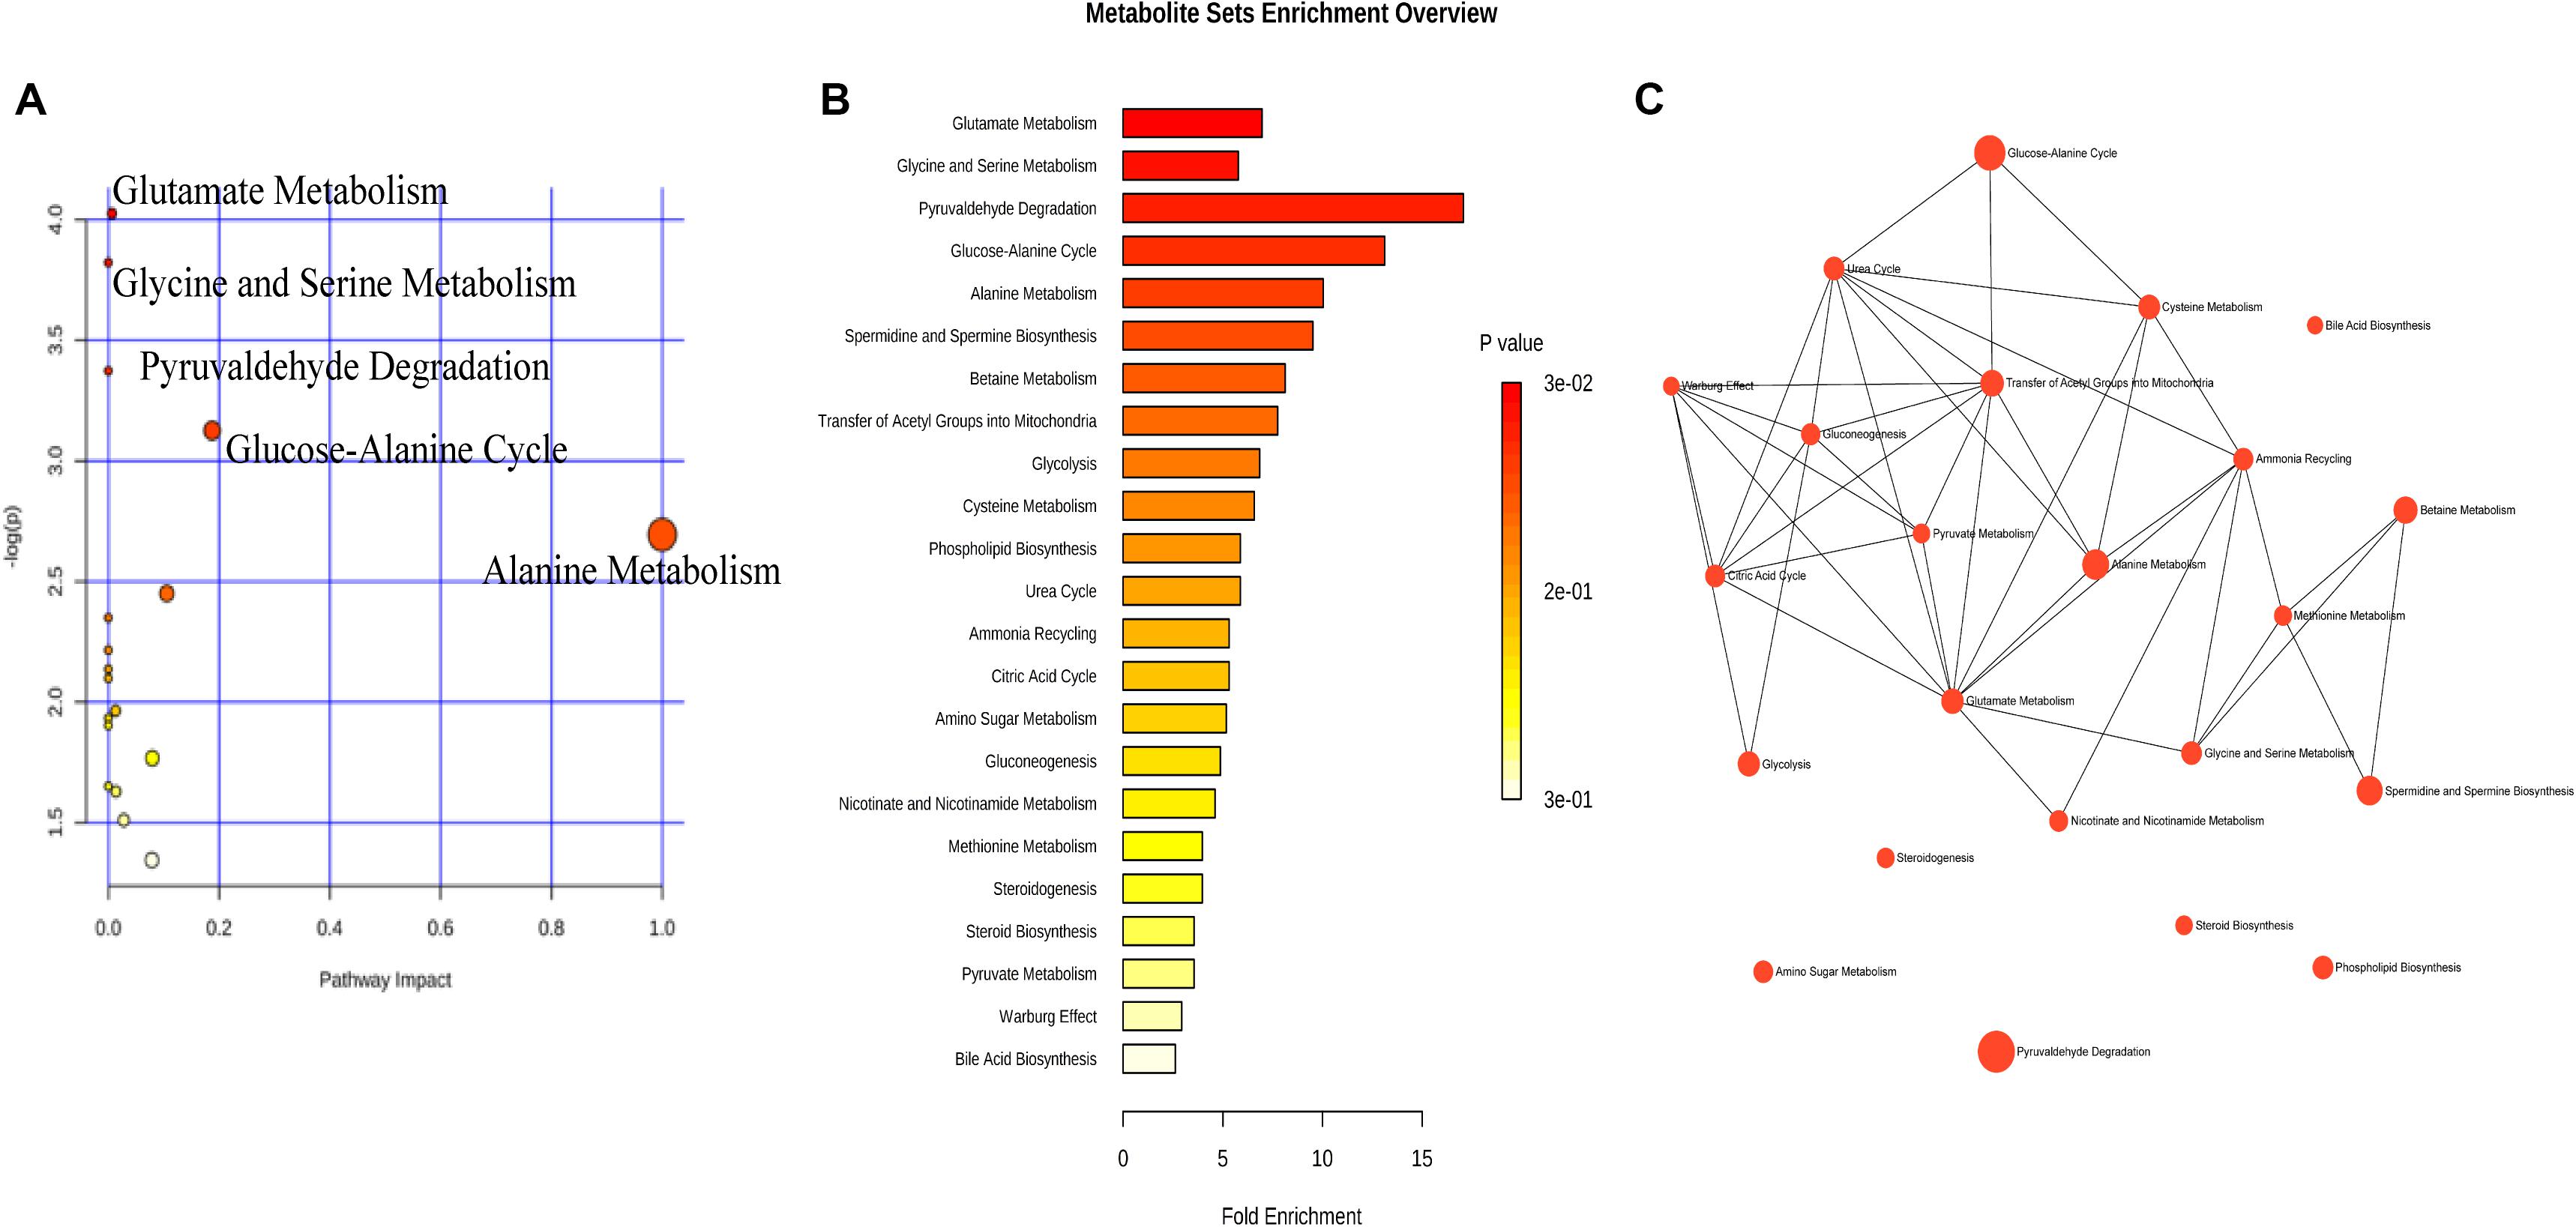
Figure 4. The metabolic pathways involved in dry eye disease at different ages. Six metabolites were subjected to analysis with Metaboanalyst to generate a topology map (A), enrichment analysis network and table for the pathway-associated metabolite sets (B,C).
Metabolic Pathways Involved in Dry Eye Disease
For the interpretation of differences in metabolites that may be involved in the pathophysiological mechanism of DED, 17 increasing and 31 decreasing metabolites were subjected to enrichment and pathway analyses. Figures 5A–C, 6A–C present the perturbed pathways. In the DEG versus the CG, the increasing metabolites were related to the citrate cycle, nicotinate and nicotinamide, butanoate, arginine-proline, pyruvate, glycolysis or gluconeogenesis, glyoxylate-dicarboxylate, and phenylalanine; the decreasing metabolites were related to glutathione, glycine-serine-threonine, nitrogen, d-glutamine and d-glutamate, and alanine-aspartate-glutamate. Furthermore, we comprehensively analyzed the metabolites that have been associated with DED. As shown in Figure 7, malate, fumarate, niacinamide, L-lactic acid, pyruvic acid, D-glucose, L-proline, citric acid, L-kynurenine, and L-phenylalanine were significantly elevated along with their metabolic pathways. In contrast, spermine, oxidized glutathione, pyroglutamic acid, urocanic acid, L-valine, L-tyrosine, L-methionine, L-isoleucine, glycine, guanine, adenine, inosine, and uridine were decreased as a result of the inhibition of metabolic pathways. In addition, metabolic enzymes that may be involved in the changes in metabolites are shown in Figures 5D, 6D.
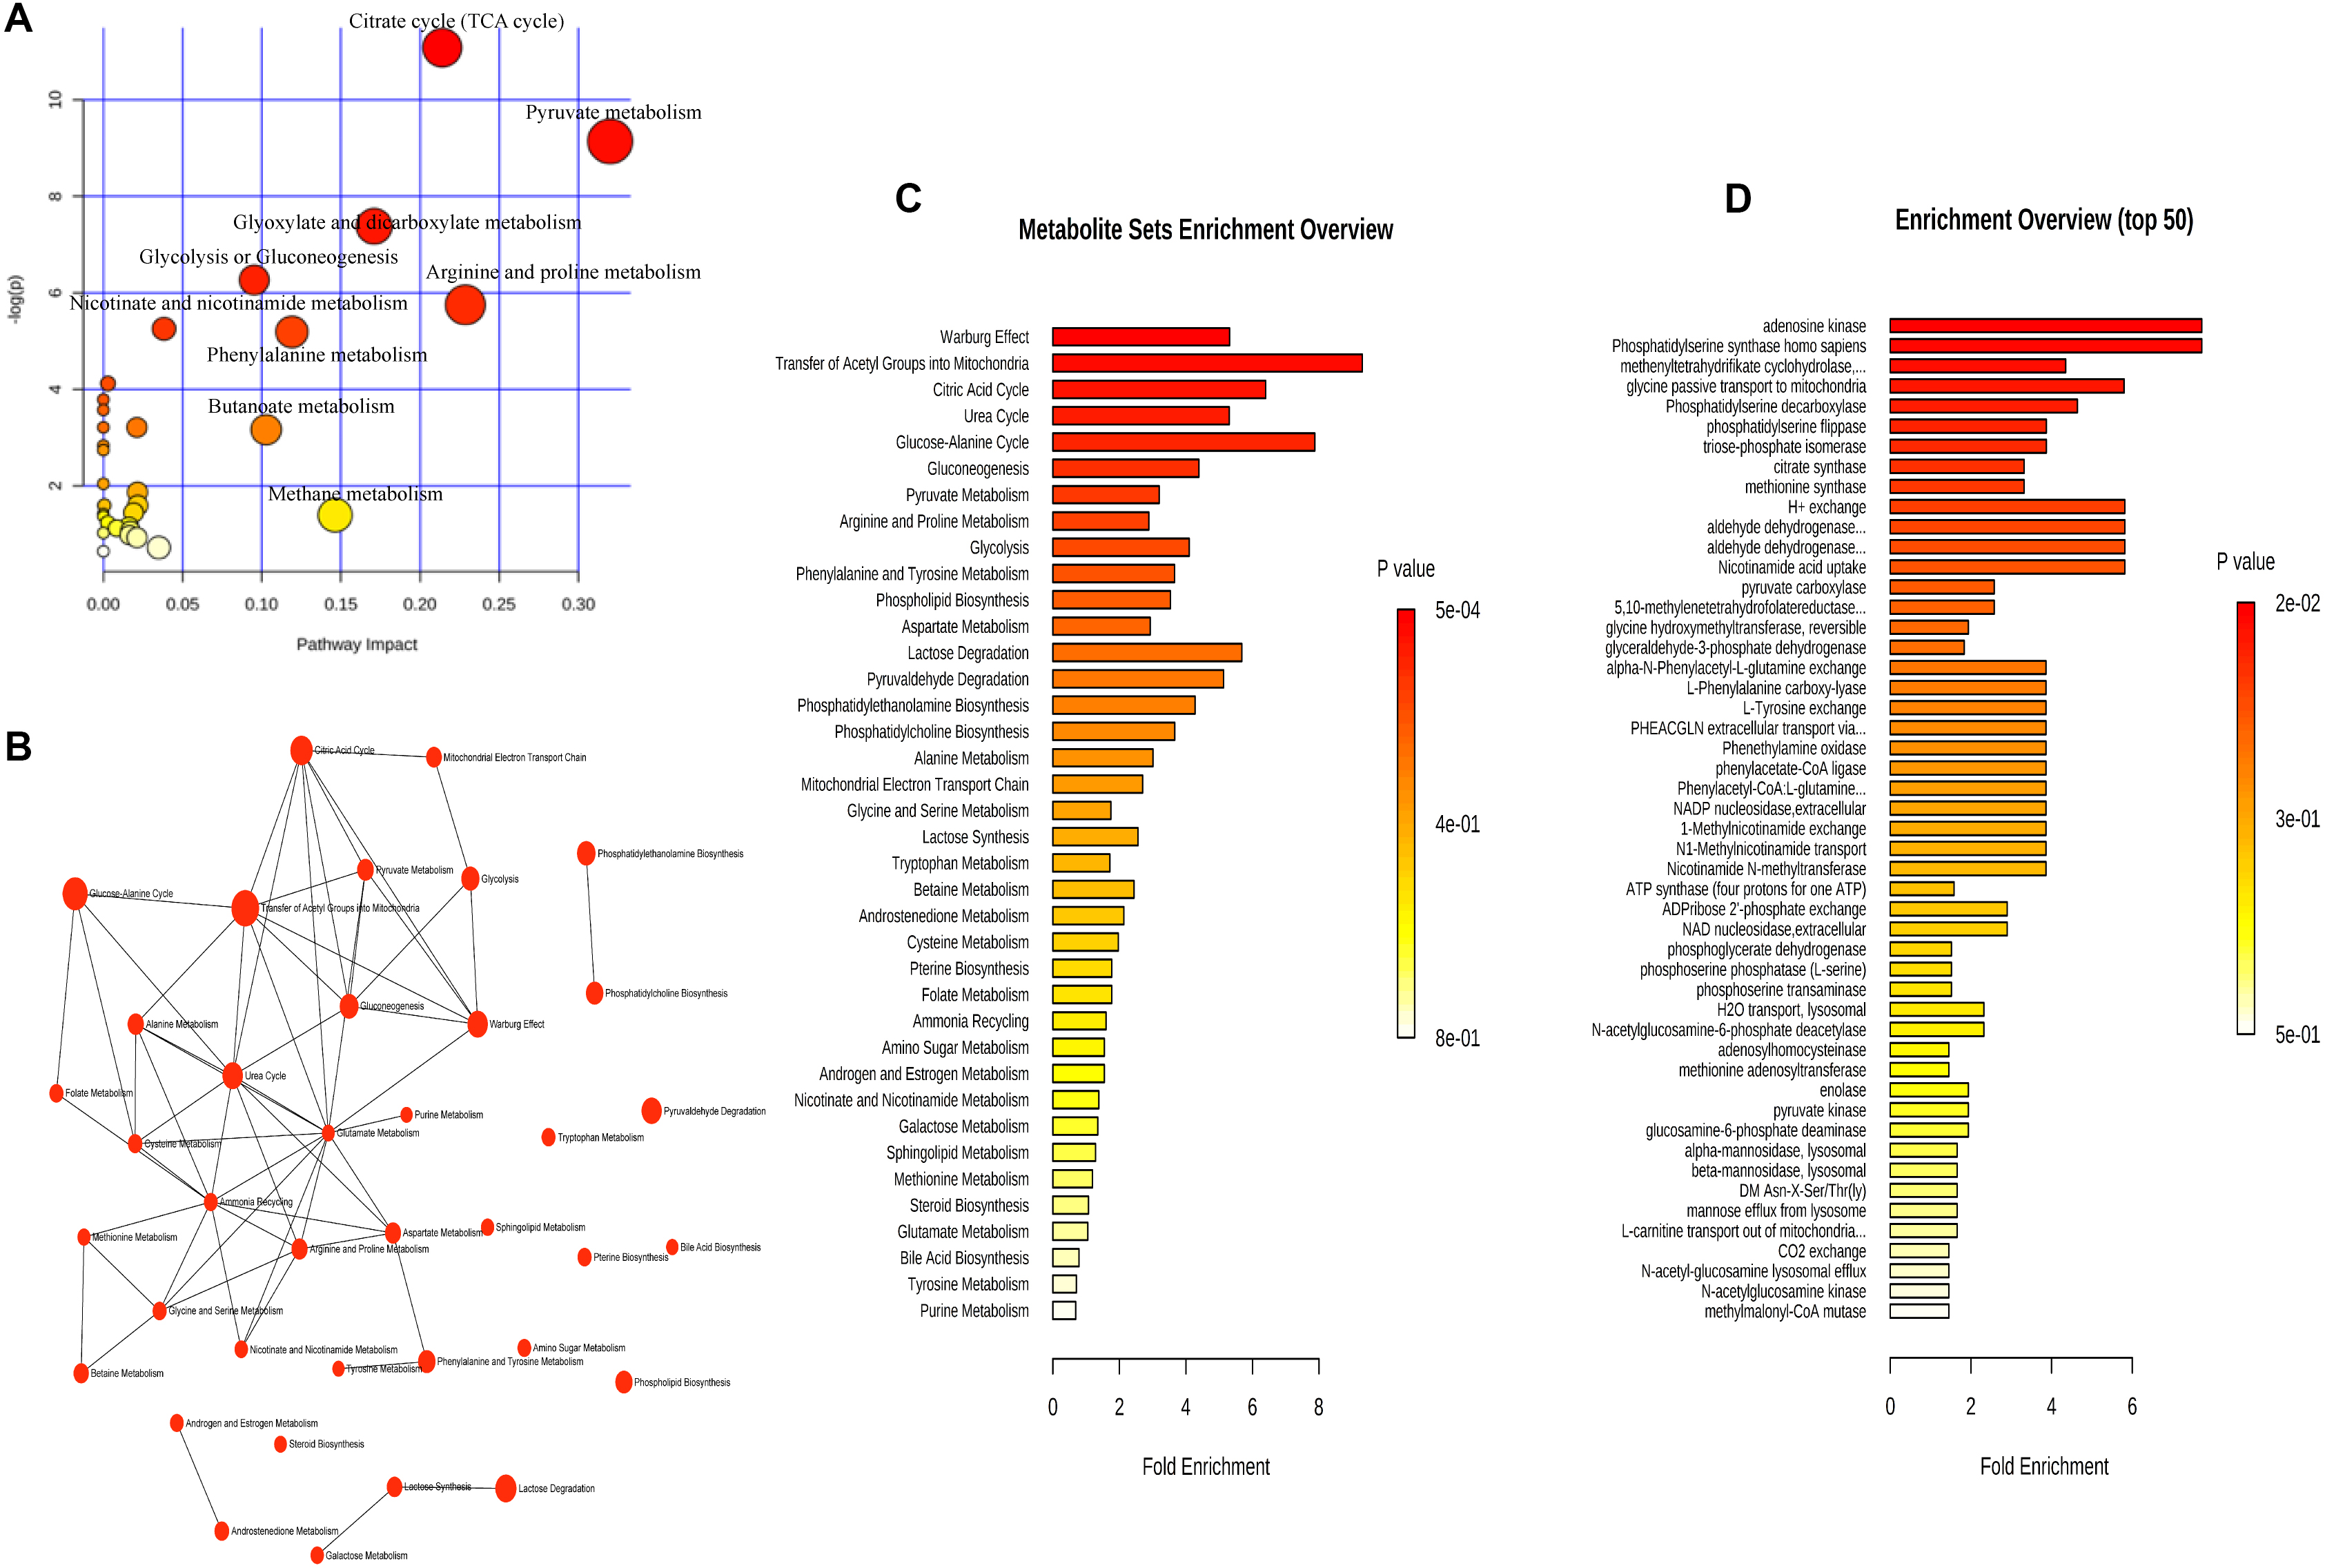
Figure 5. The increasing metabolic pathways involved in dry eye disease. The 17 increasing metabolites were subjected to analysis with Metaboanalyst (http://www.metaboanalyst.ca) to generate a topology map (A), enrichment analysis network and table for the pathway-associated metabolite sets (B,C), and enrichment analysis table for the predicted metabolite enzyme sets (D).
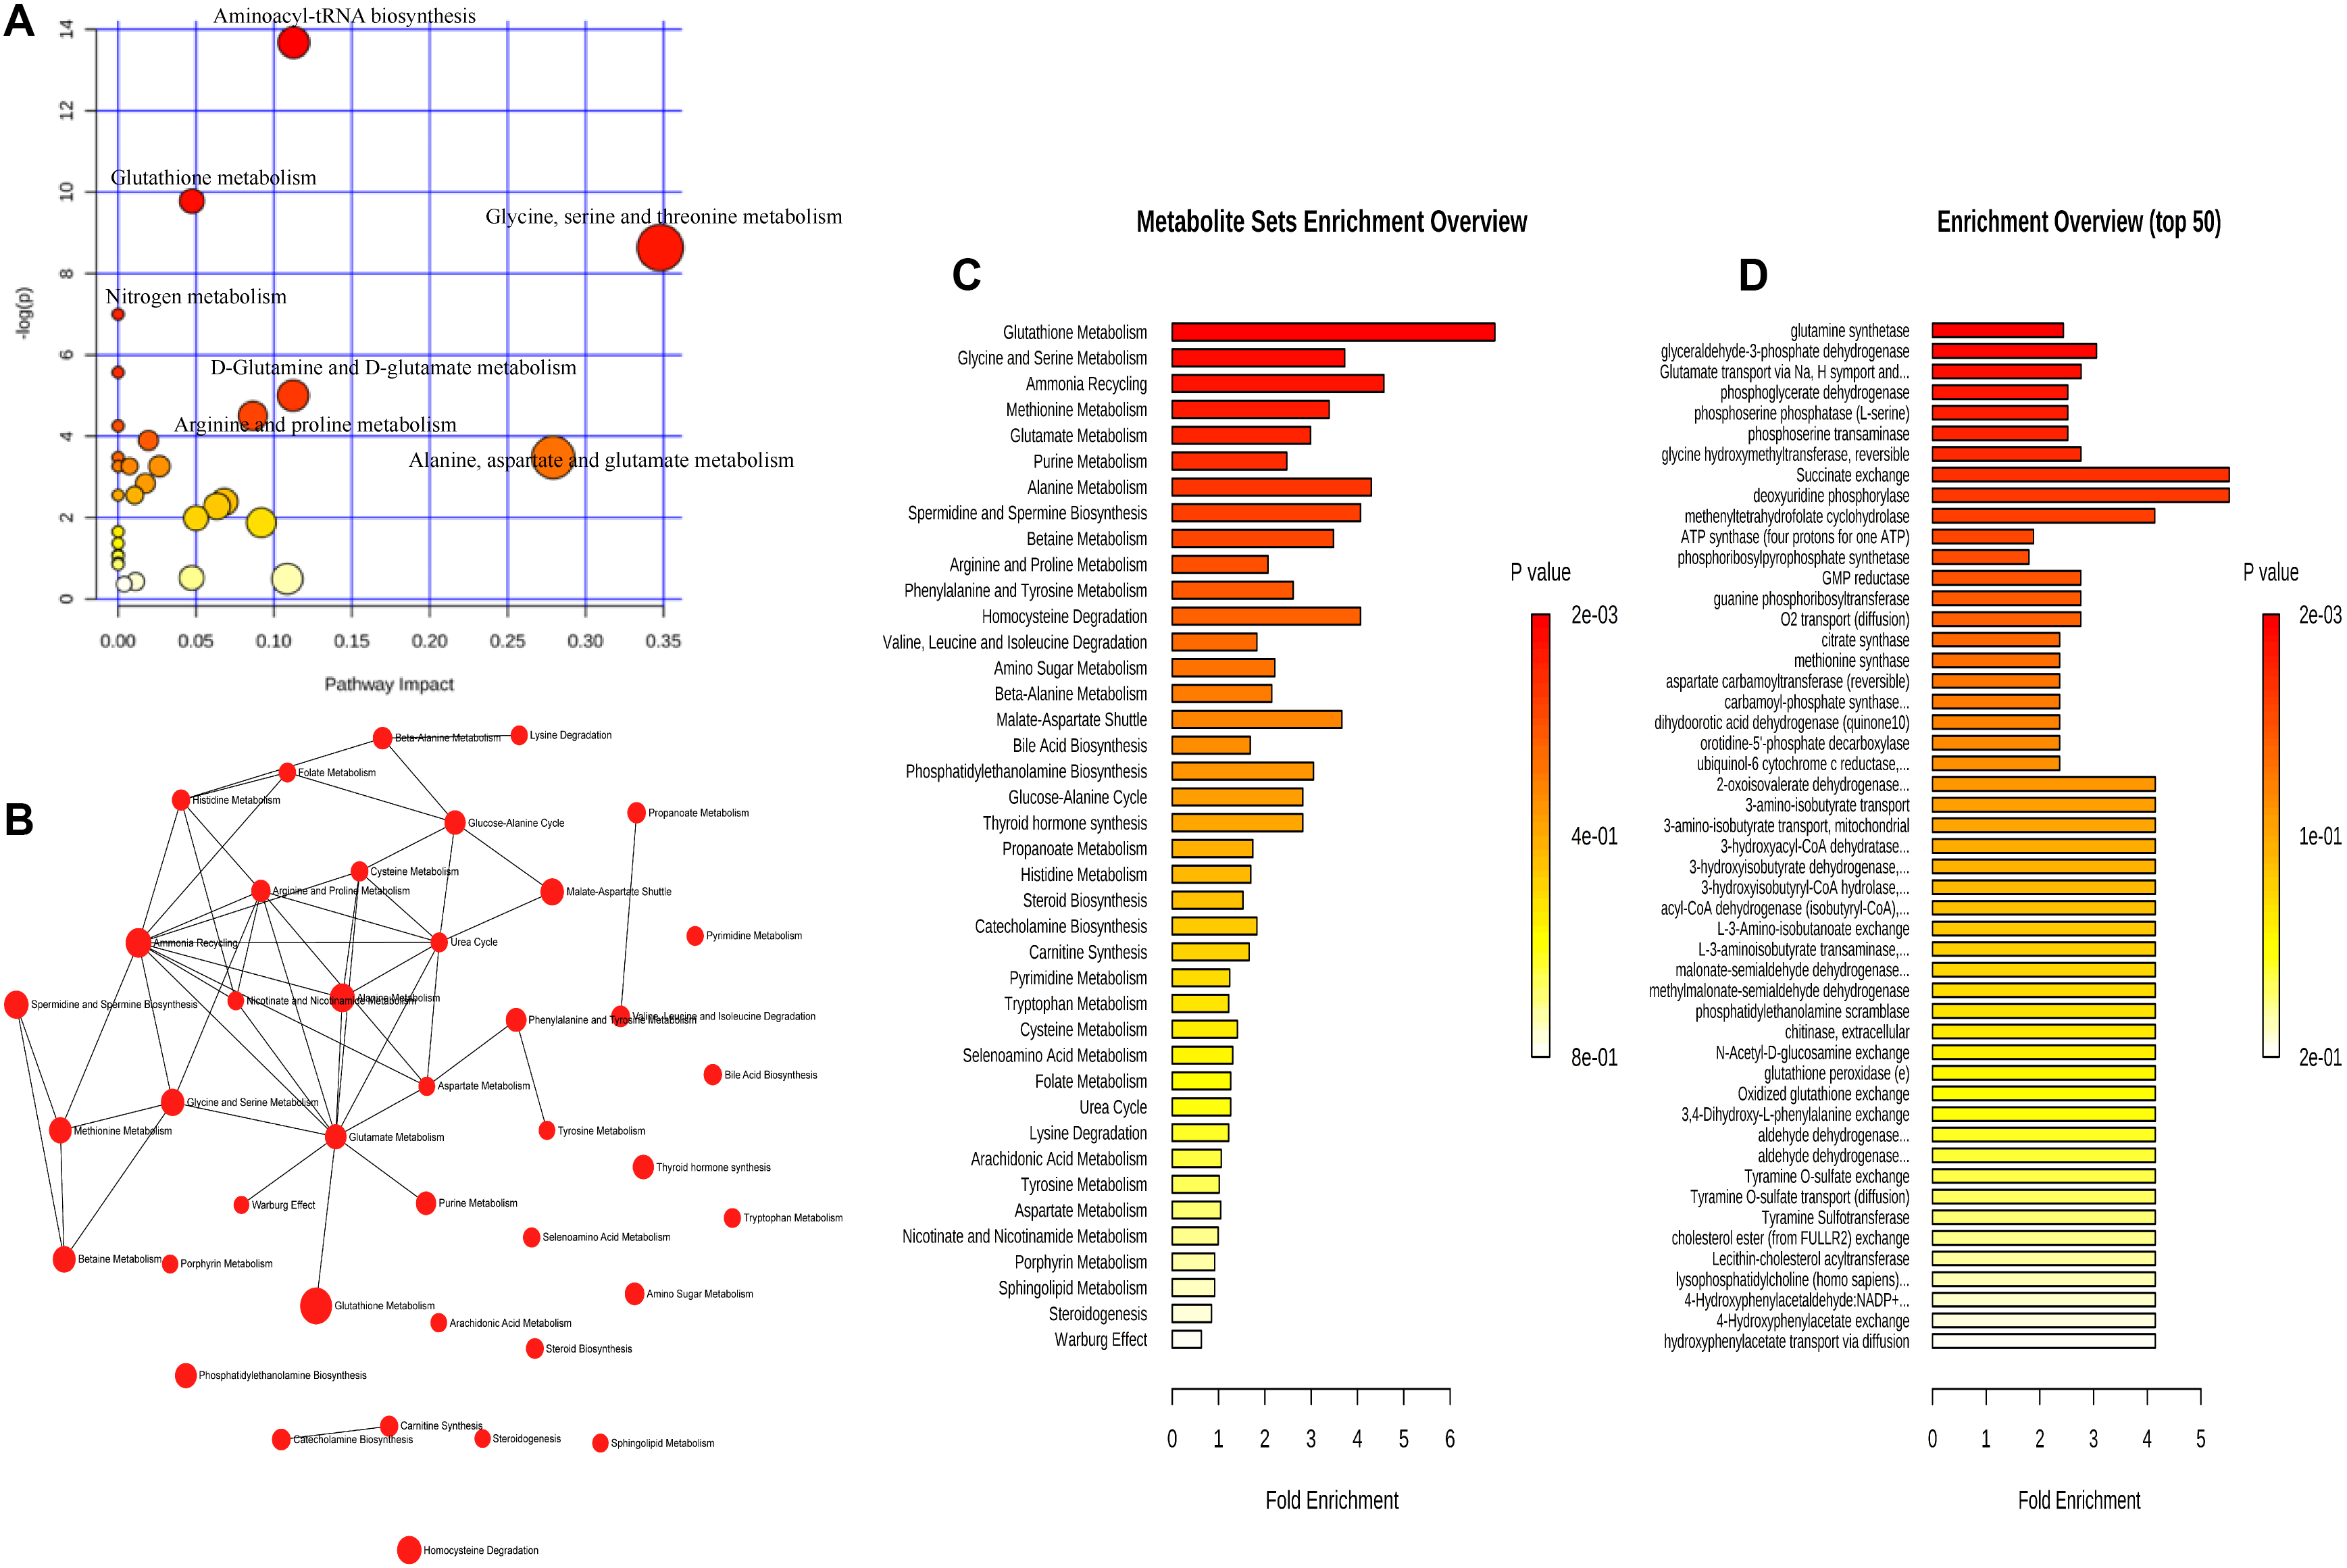
Figure 6. The decreasing metabolic pathways involved in dry eye disease. The 31 decreasing metabolites were subjected to analysis with Metaboanalyst to generate a topology map (A), enrichment analysis network and table for the pathway-associated metabolite sets (B,C), and enrichment analysis table for the predicted metabolite enzyme sets (D).
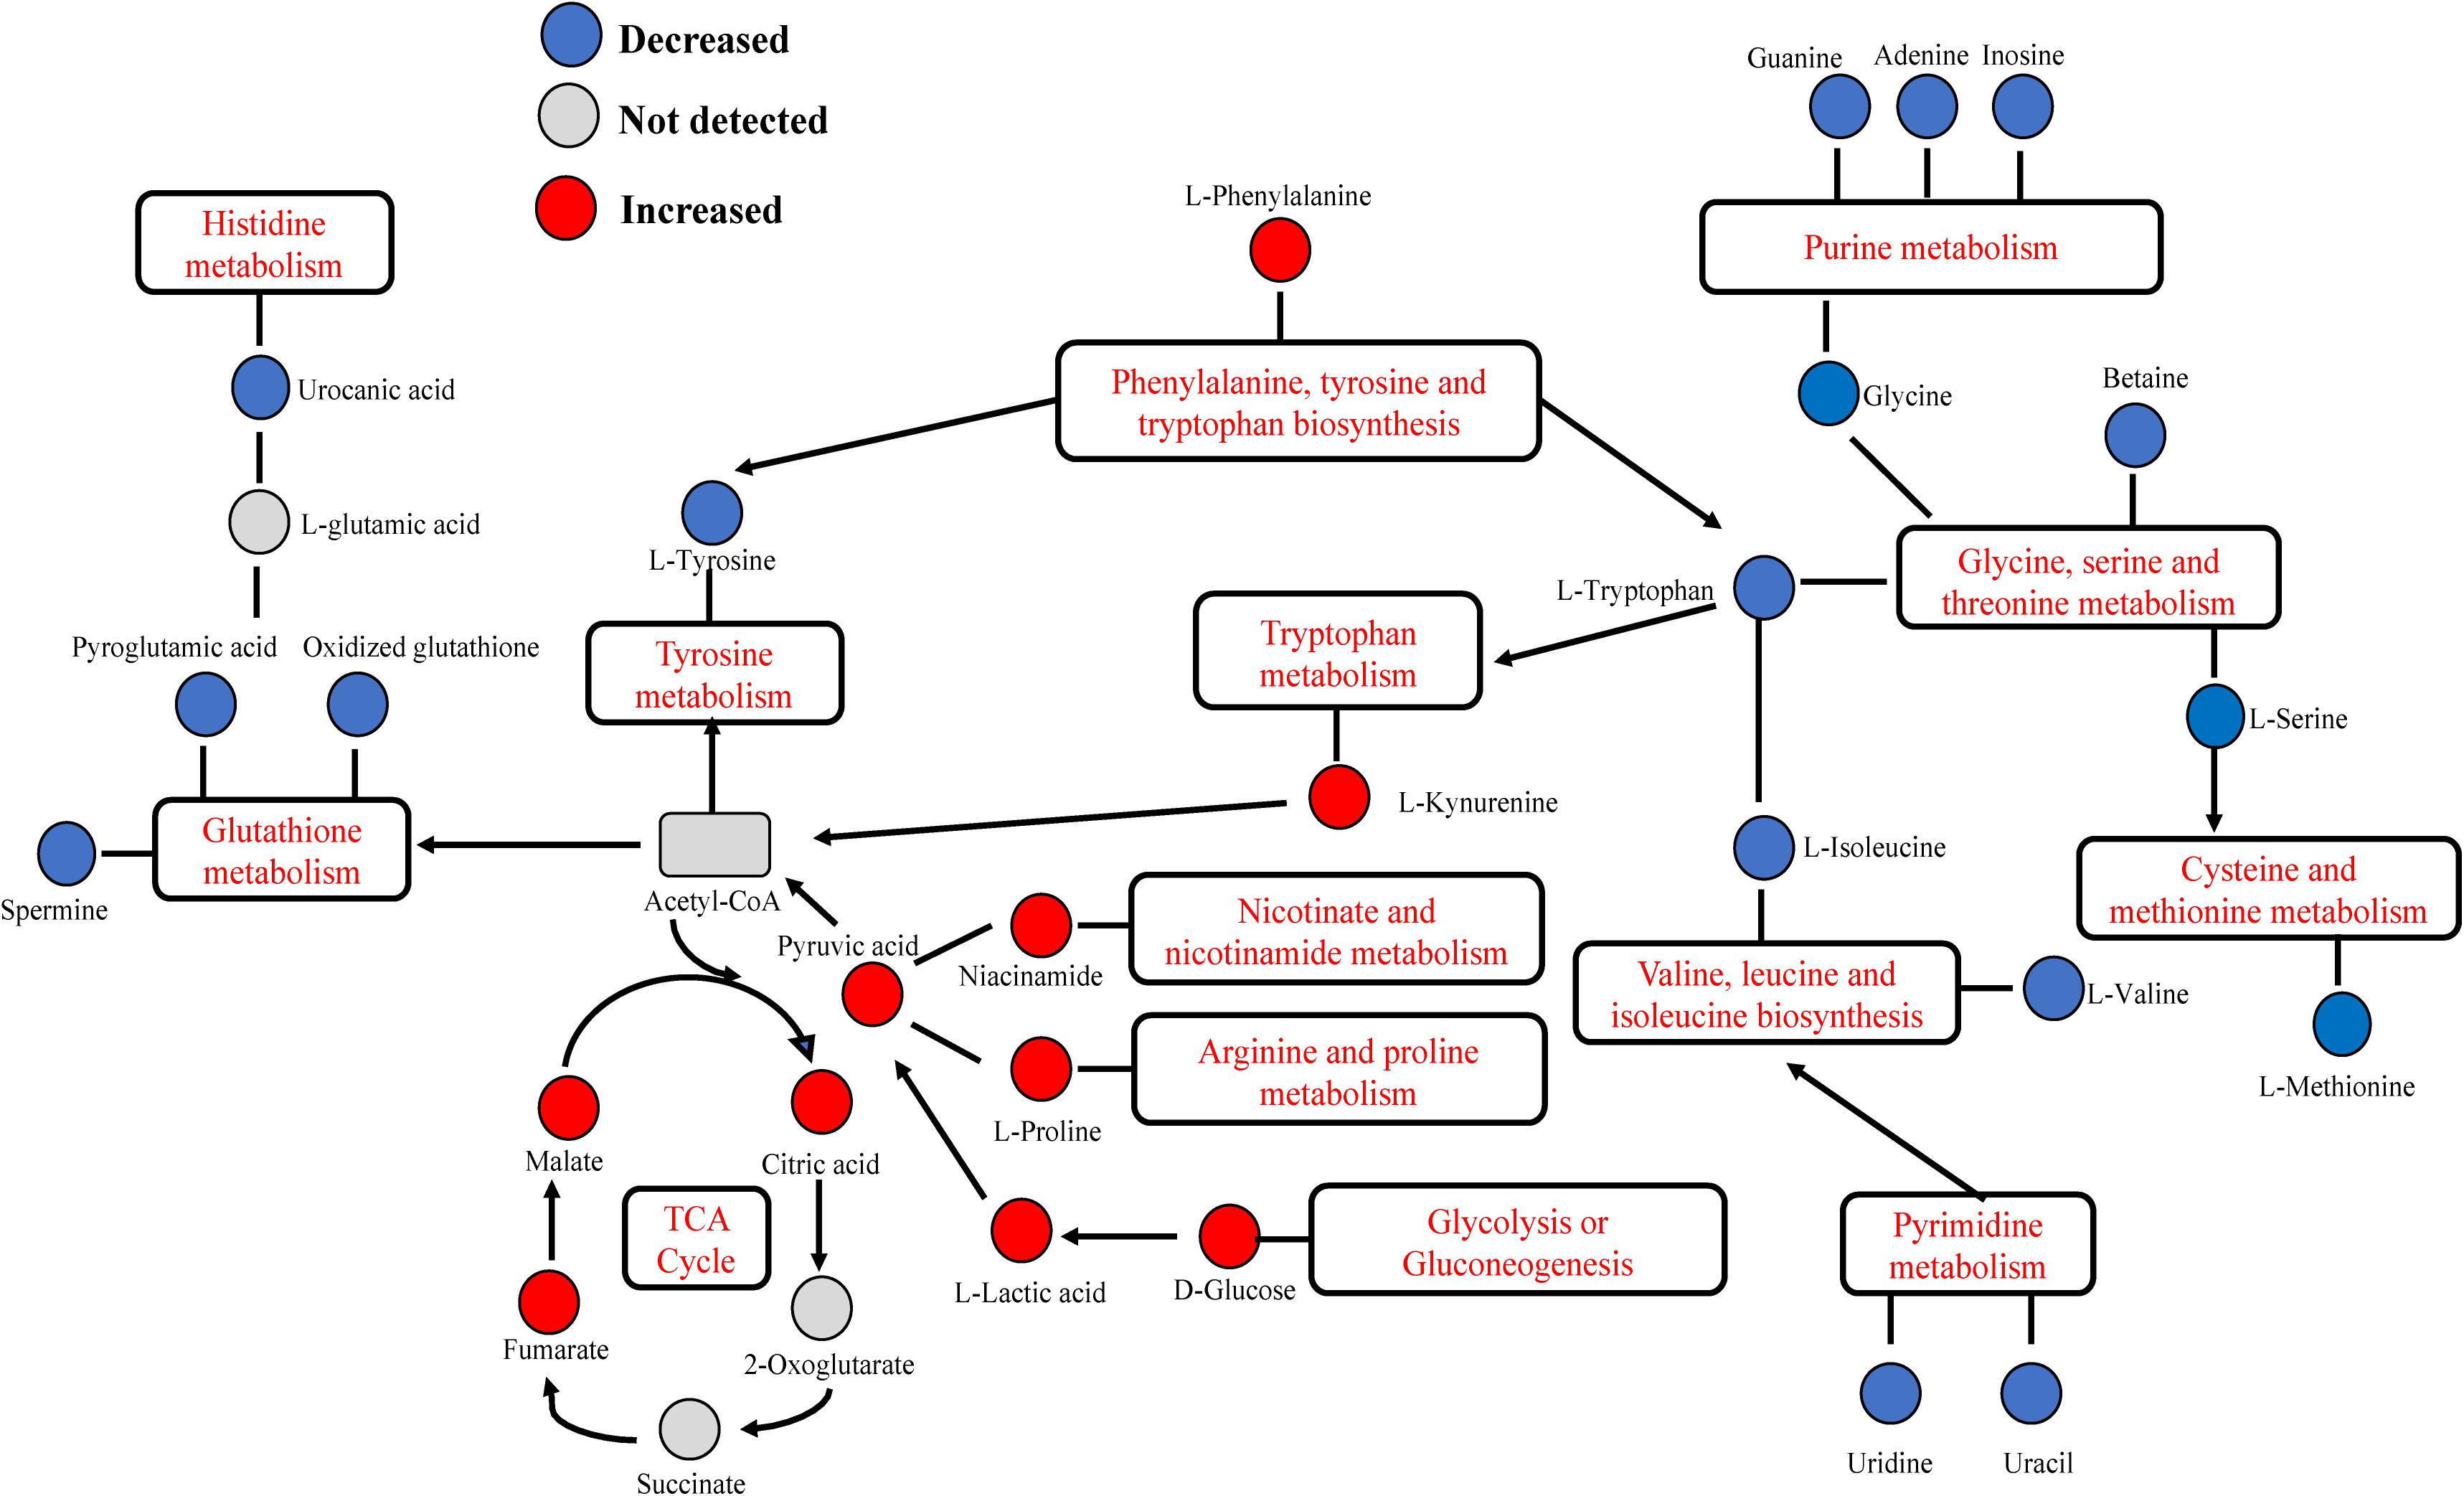
Figure 7. Dry eye disease-related altered metabolic pathway network of the significantly regulated metabolites. Several metabolic pathways of amino acids were activated: tryptophan, arginine-proline, and cysteine-methionine metabolism. Notably, phenylalanine-tyrosine-tryptophan biosynthesis, glycine-serine-threonine metabolism, and valine-leucine-isoleucine biosynthesis were decreased. The increased levels of malate, citric acid, fumarate, and lactic acid indicated significant elevation of the tricarboxylic acid (TCA) cycle and glycolysis or gluconeogenesis. Metabolites of adenine, guanine, and inosine were significantly inhibited, suggesting decreased purine metabolism. Histidine and glutathione metabolism was inhibited, indicated by a decrease in urocanic acid, pyroglutamic acid, oxidized glutathione, and spermine. Pyrimidine metabolism was inhibited as indicated by the levels of uridine and uracil.
Discussion
Dry eye disease is an ocular surface disorder in which the tear film is unstable due to multiple factors (Craig et al., 2017). Studying changes in the chemical composition of tears is the most direct approach to exploring the mechanism of dry eye development. In an early study conducted by Srinivasan et al. (2012) using the protein quantification method, statistically significant differences in the protein ratios were detected between the normal and dry eye groups. Lam et al. (2014) underscored the pathological relevance of structure-specific alterations in tear lipid components, particularly wax esters, to the pathogenesis of DED. In recent years, an increasing number of research studies have been devoted to identifying differential biomarker candidates. Perumal et al. (2016) compared tears between aqueous-deficient, evaporative dry eye patients and healthy subjects, showing that 13 major proteins were differentially expressed. A similar study performed by Huang et al. (2018) ascertained the differential expression profiles of 18 proteins (P < 0.05) with a fast proteomic method based on LC-quadrupole-orbitrap-MS analysis.
The global-omics platform has been widely used in the study of the tear proteome and lipidome (Lam et al., 2014). However, the analysis of tear metabolites is limited to the analysis of targeted compound classes, and the number of identified metabolites is also markedly lower than that of other biomolecules identified in tears. This observation may be attributed to challenges in instrument sensitivity, as the typical sample volume of tears is only 5–10 μl. Galbis-Estrada et al. (2014) suggested for the first time that the severity of dry eye exerts a significant effect on tear metabolism, suggesting that the tear metabolome may be utilized to identify biomarker candidates and surrogate endpoints for DED. In this study, we improved the utilization of tears by optimizing the collection of samples and using high-resolution MS. Previous research directly compared the statistically significant increase or decrease of chemicals between tears of patients with DED and healthy subjects (Galbis-Estrada et al., 2015). We used the LASSO algorithm, which refers to the variable selection method (minimizing the log partial to the sum of the absolute values of the parameters being bounded by a constant) to identify the significant metabolites associated with DED.
By focusing on the union of the sets of metabolites that were correlated with the OSDI, FBUT, and FL, we confirmed 48 significantly different metabolites between the DEG and CG. As previously reported, the major metabolites were amino acids, carbohydrates, and lipids (Butovich, 2008; Chen et al., 2011; Nakatsukasa et al., 2011; Rantamaki et al., 2011; Zhou and Beuerman, 2012). Firstly, increased levels of glucose (Taormina et al., 2007), lactate (Rucker et al., 2003), and creatine (Zhou and Beuerman, 2012) have been reported in patients with dry eye, suggesting that these patients may be in a state of high energy metabolism. However, glutathione, cholesterol, and N-acetylglucosamine were noticeably decreased in the DEG versus the CG. In addition, previous proteomics studies in patients with dry eye reported that the lower expression of lactoferrin, lipocalin, and lipophilin AC-1 (Baca et al., 2007) may render these patients more susceptible to infections because of the increased oxidative stress and reduced antimicrobial proteins (Saijyothi et al., 2012). Moreover, the levels of kynurenine increased as a result of the catabolism of tryptophan, which is involved in the inflammatory mechanisms of Sjögren’s syndrome with dry eye (de Oliveira et al., 2018).
Various adenine and uracil nucleotides have been shown to improve corneal barrier function and increase both tear fluid secretion and corneal epithelial resistance (Fujihara et al., 2001). Kim and Kang (2013) reported that pyrimidine nucleoside uridine exerts a protective effect on cultured human corneal epithelial cells in an animal model of dry eye and in patients. Our results showed that decreased levels of adenine, uridine, pyrimidine, and uracil may contribute to lower corneal sensitivity.
Ding and Sullivan (2012) clearly demonstrated that aging is a risk factor for dry eye, and the mechanism of age-related increase in the incidence of DED has also been elucidated. Interestingly, when we grouped all patients according to different age nodes, various changes were observed. The analysis revealed that the basal secretion of human tears decreased with the increase of age; we found that acetylcholine in tears was significantly increased in group D and can activate the muscarinic receptor to cause reflex secretion of tears (Mauduit et al., 1993), which may be a kind of negative feedback regulation. Wang et al. (2018) found that nicotinamide and pyruvate accumulated to higher levels in old mice, and cholesterol was significantly lower in the aged cornea, while 1-methylNAA may be a hallmark for the aging eye. Notably, 1-methylNAA is produced by N-methyltransferase, transferring methyl groups from S-adenosylmethionine to nicotinamide (Wang et al., 2018), which is consistent with the high expression of nicotinamide and pyruvic acid, and the low expression of cholesterol in group D. In addition, taurine is one of the most abundant amino acids in the retina (Lei et al., 2011), cornea, and lens. The levels of taurine in the rat cornea and lens decrease with age (Yanshole et al., 2014), and the main pathway of taurine biosynthesis is methionine and cysteine. Hence, we infer that the reduction in L-methionine may be related to taurine metabolism. Gao et al. (2018) revealed that serine is involved in lipid metabolism and thus affects mitochondrial metabolism. Dry eye is also closely related to lipid metabolism; however, the mechanism of change in the levels of serine remains unclear. It is well established that gamma-aminobutyric acid is an important inhibitory neurotransmitter in the central nervous system and plays an important role in tissue development and biological signal communication; however, its mechanism of action in the ocular surface remains unknown. Regarding the three metabolites not exhibiting any trend, we found that their P-values prior to grouping were close to 0.05. Therefore, we hypothesized that the test effect may be influenced by the change in sample size after grouping. In addition, 18 of 48 metabolites in group A, seven of 48 in group C, five of 48 in group D, and 10 of 48 in group F did not show significance, indicating that the expression of metabolites related to dry eye changed with age. Based on the number of metabolites which did not show significance in each group, we can infer that the metabolites related to the dry eye significantly increase from the age of 50 years. This is consistent with the findings of the TFOS DEWS II Epidemiology Report (Stapleton et al., 2017). Moreover, the number of meaningful metabolites related to dry eye was greater between the age of 50 and 60 years, which indirectly reflected the relationship between the symptoms of dry eye and age. At the age of 50–60 years, when the patients experience the most obvious symptoms of dry eye, and with increasing age, the sensitivity appears to be decreasing. This effect may be related to weakened corneal perception. The metabolic pathways associated with differential metabolites in different groups are partly different, which may be related to different endocrine levels at each age. However, the mechanism involved in this process is unclear.
A number of reports have been published in recent years on the components of tears. However, differences in the collection method, the instrument for the detection of metabolites, and the technique used for the metabolomic analysis contribute to the discrepancies observed between the reports. Our study had several limitations. Firstly, there was a significant difference in age between the CG and the DEG; however, the appropriate statistical procedure was performed to adjust for age. Secondly, our study did not analyze the different metabolites in the dry eye subgroups. Precise statistical analyses were essential to guarantee the consistency of our data.
In summary, metabolomics can be used to extract molecular information from human tears. This information can be useful for the accurate diagnosis of DED, prediction of prognosis, and development of personalized therapies. Our data demonstrated the different metabolomic profiles between individuals with and without dry eye and between different age groups. Furthermore, they partly illustrate the relationship between changes in metabolites, symptoms in dry eye, and age.
Biosecurity Statement
All experimental procedures described in this article adhered to biosecurity and institutional safety standards.
Data Availability Statement
The raw data supporting the conclusions of this article will be made available by the authors, without undue reservation, to any qualified researcher.
Ethics Statement
This study was performed in accordance with the principles of the Declaration of Helsinki, and the study protocol was reviewed and approved by the Ethics Committee of Yangpu District Central Hospital. Informed consent was provided by all subjects enrolled in this study.
Author Contributions
YC designed the work, performed the data analysis, and prepared the manuscript. CY and YJ performed the experiments and wrote the manuscript. YZ and YL analyzed and interpreted the data. All authors discussed the results and read and approved the final version of the manuscript for publication.
Funding
This study was supported by the Youth Project of Shanghai Municipal Commission of Health (grant number 20194Y0238), the Scientific Research Foundation of Shanghai Municipal Commission of Health and Family Planning (grant number 201840336), the Natural Science Foundation of Shanghai (grant number 17ZR1427100), the National Natural Science Foundation of China (grant number 81300771), and The Project of Key Disciplines of Medicine in Yangpu District of Shanghai (grant number YP19ZA01).
Conflict of Interest
The authors declare that the research was conducted in the absence of any commercial or financial relationships that could be construed as a potential conflict of interest.
Supplementary Material
The Supplementary Material for this article can be found online at: https://www.frontiersin.org/articles/10.3389/fcell.2020.00344/full#supplementary-material
FIGURE S1 | The metabolic pathways involved in dry eye disease at different ages. Eighteen metabolites were subjected to analysis with Metaboanalyst to generate a topology map (A), enrichment analysis network and table for the pathway-associated metabolite sets (B,C).
FIGURE S2 | The metabolic pathways involved in dry eye disease at different ages. Ten metabolites were subjected to analysis with Metaboanalyst to generate a topology map (A), enrichment analysis network and table for the pathway-associated metabolite sets (B,C).
TABLE S1 | Inclusion and exclusion criteria.
TABLE S2 | The relationship between metabolites and dry eye indexes. OSDI, Ocular Surface Disease Index; FBUT, fluorescein breakup time; DEQ-5, 5-Item Dry Eye Questionnaire; FL, corneal fluorescein staining; OR, odds ratio; CL, lower of confidence interval; CU, upper of confidence interval.
References
Aribindi, K., Guerra, Y., Piqueras Mdel, C., Banta, J. T., Lee, R. K., and Bhattacharya, S. K. (2013). Cholesterol and glycosphingolipids of human trabecular meshwork and aqueous humor: comparative profiles from control and glaucomatous donors. Curr. Eye. Res 38, 1017–1026. doi: 10.3109/02713683.2013.803123
Asiedu, K., Dzasimatu, S. K., and Kyei, S. (2018). Impact of dry eye on psychosomatic symptoms and quality of life in a healthy youthful clinical sample. Eye Contact Lens 44, (Suppl. 2), S404–S409. doi: 10.1097/ICL.0000000000000550
Baca, J. T., Finegold, D. N., and Asher, S. A. (2007). Tear glucose analysis for the noninvasive detection and monitoring of diabetes mellitus. Ocul. Surf. 5, 280–293.
Beale, D. J., Pinu, F. R., Kouremenos, K. A., Poojary, M. M., Narayana, V. K., Boughton, B. A., et al. (2018). Review of recent developments in GC-MS approaches to metabolomics-based research. Metabolomics 14:152. doi: 10.1007/s11306-018-1449-1442
Brantley, M. A. Jr., Osborn, M. P., Sanders, B. J., Rezaei, K. A., Lu, P., et al. (2012). Plasma biomarkers of oxidative stress and genetic variants in age-related macular degeneration. Am. J. Ophthalmol. 153:460-467.e1. doi: 10.1016/j.ajo.2011.08.033
Butovich, I. A. (2008). On the lipid composition of human meibum and tears: comparative analysis of nonpolar lipids. Invest. Ophthalmol. Vis. Sci. 49, 3779–3789. doi: 10.1167/iovs.08-1889
Chen, L., Cheng, C. Y., Choi, H., Ikram, M. K., Sabanayagam, C., Tan, G. S., et al. (2016). Plasma metabonomic profiling of diabetic retinopathy. Diabetes Metab. Res. Rev. 65, 1099–1108. doi: 10.2337/db15-0661
Chen, L., Zhou, L., Chan, E. C., Neo, J., and Beuerman, R. W. (2011). Characterization of the human tear metabolome by LC-MS/MS. J. Proteome Res. 10, 4876–4882. doi: 10.1021/pr2004874
Craig, J. P., Nichols, K. K., Akpek, E. K., Caffery, B., Dua, H. S., Joo, C. K., et al. (2017). TFOS DEWS II definition and classification report. Ocul. Surf. 15, 276–283. doi: 10.1016/j.jtos.2017.05.008
de Oliveira, F. R., Fantucci, M. Z., Adriano, L., Valim, V., Cunha, T. M., Louzada-Junior, P., et al. (2018). Neurological and inflammatory manifestations in sjogren’s syndrome: the role of the kynurenine metabolic pathway. Int. J. Mol. Sci. 19:3953. doi: 10.3390/ijms19123953
Ding, J., and Sullivan, D. A. (2012). Aging and dry eye disease. Exp. Gerontol. 47, 483–490. doi: 10.1016/j.exger.2012.03.020
Fujihara, T., Murakami, T., Fujita, H., Nakamura, M., and Nakata, K. (2001). Improvement of corneal barrier function by the P2Y(2) agonist INS365 in a rat dry eye model. Invest. Ophthalmol. Vis. Sci. 42, 96–100.
Galbis-Estrada, C., Martinez-Castillo, S., Morales, J. M., Vivar-Llopis, B., Monleon, D., Diaz-Llopis, M., et al. (2014). Differential effects of dry eye disorders on metabolomic profile by 1H nuclear magnetic resonance spectroscopy. Biomed. Res. Int. 2014:542549. doi: 10.1155/2014/542549
Galbis-Estrada, C., Pinazo-Duran, M. D., Martinez-Castillo, S., Morales, J. M., Monleon, D., and Zanon-Moreno, V. (2015). A metabolomic approach to dry eye disorders. The role of oral supplements with antioxidants and omega 3 fatty acids. Mol. Vis. 21, 555–567.
Gao, X., Lee, K., Reid, M. A., Sanderson, S. M., Qiu, C., Li, S., et al. (2018). Serine availability influences mitochondrial dynamics and function through lipid metabolism. Cell Rep. 22, 3507–3520. doi: 10.1016/j.celrep.2018.03.017
Huang, Z., Du, C. X., and Pan, X. D. (2018). The use of in-strip digestion for fast proteomic analysis on tear fluid from dry eye patients. PLoS One 13:e0200702. doi: 10.1371/journal.pone.0200702
Jonas, J. B., Wei, W. B., Xu, L., Rietschel, M., Streit, F., and Wang, Y. X. (2018). Self-rated depression and eye diseases: The Beijing Eye Study. PLoS One 13:e0202132. doi: 10.1371/journal.pone.0202132
Karamichos, D., Zieske, J. D., Sejersen, H., Sarker-Nag, A., Asara, J. M., and Hjortdal, J. (2015). Tear metabolite changes in keratoconus. Exp. Eye Res. 132, 1–8. doi: 10.1016/j.exer.2015.01.007
Khamis, M. M., Adamko, D. J., and El-Aneed, A. (2019). Strategies and challenges in method development and validation for the absolute quantification of endogenous biomarker metabolites using liquid chromatography-tandem mass spectrometry. Mass Spectrom Rev. doi: 10.1002/mas.21607 [Epub ahead of print].
Kim, E., and Kang, W. (2013). Pharmacokinetics of uridine following ocular, oral and intravenous administration in rabbits. Biomol. Ther. 21, 170–172. doi: 10.4062/biomolther.2012.103
Lam, S. M., Tong, L., Reux, B., Duan, X., Petznick, A., Yong, S. S., et al. (2014). Lipidomic analysis of human tear fluid reveals structure-specific lipid alterations in dry eye syndrome. J. Lipid Res. 55, 299–306. doi: 10.1194/jlr.P041780
Lei, Y., Garrahan, N., Hermann, B., Fautsch, M. P., Johnson, D. H., Hernandez, M. R., et al. (2011). Transretinal degeneration in ageing human retina: a multiphoton microscopy analysis. Br. J. Ophthalmol. 95, 727–730. doi: 10.1136/bjo.2010.180869
Liu, R., Ma, B., Gao, Y., Ma, B., Liu, Y., and Qi, H. (2019). Tear inflammatory cytokines analysis and clinical correlations in diabetes and nondiabetes with dry eye. Am. J. Ophthalmol. 200, 10–15. doi: 10.1016/j.ajo.2018.12.001
Mauduit, P., Jammes, H., and Rossignol, B. (1993). M3 muscarinic acetylcholine receptor coupling to PLC in rat exorbital lacrimal acinar cells. Am. J. Physiol. 264(6 Pt 1), C1550–C1560. doi: 10.1152/ajpcell.1993.264.6.C1550
Najafi, L., Malek, M., Valojerdi, A. E., Aghili, R., Khamseh, M. E., Fallah, A. E., et al. (2013). Dry eye and its correlation to diabetes microvascular complications in people with type 2 diabetes mellitus. J. Diabetes Complicat. 27, 459–462. doi: 10.1016/j.jdiacomp.2013.04.006
Nakatsukasa, M., Sotozono, C., Shimbo, K., Ono, N., Miyano, H., Okano, A., et al. (2011). Amino Acid profiles in human tear fluids analyzed by high-performance liquid chromatography and electrospray ionization tandem mass spectrometry. Am. J. Ophthalmol. 151:799-808.e1. doi: 10.1016/j.ajo.2010.11.003
Perumal, N., Funke, S., Pfeiffer, N., and Grus, F. H. (2016). Proteomics analysis of human tears from aqueous-deficient and evaporative dry eye patients. Sci. Rep. 6:29629. doi: 10.1038/srep29629
Ramautar, R., Somsen, G. W., and de Jong, G. J. (2019). CE-MS for metabolomics: developments and applications in the period 2016-2018. Electrophoresis 40, 165–179. doi: 10.1002/elps.201800323
Rantamaki, A. H., Seppanen-Laakso, T., Oresic, M., Jauhiainen, M., and Holopainen, J. M. (2011). Human tear fluid lipidome: from composition to function. PLoS One 6:e19553. doi: 10.1371/journal.pone.0019553
Rucker, J. C., Biousse, V., Mao, H., Sandbach, J., Constantinidis, I., and Newman, N. J. (2003). Detection of lactate in the human vitreous body using proton magnetic resonance spectroscopy. Arch. Ophthalmol. 121, 909–911. doi: 10.1001/archopht.121.6.909
Saijyothi, A. V., Fowjana, J., Madhumathi, S., Rajeshwari, M., Thennarasu, M., Prema, P., et al. (2012). Tear fluid small molecular antioxidants profiling shows lowered glutathione in keratoconus. Exp. Eye Res. 103, 41–46. doi: 10.1016/j.exer.2012.07.010
Srinivasan, S., Thangavelu, M., Zhang, L., Green, K. B., and Nichols, K. K. (2012). iTRAQ quantitative proteomics in the analysis of tears in dry eye patients. Invest. Ophthalmol. Vis. Sci. 53, 5052–5059. doi: 10.1167/iovs.11-9022
Stapleton, F., Alves, M., Bunya, V. Y., Jalbert, I., Lekhanont, K., Malet, F., et al. (2017). TFOS DEWS II Epidemiology Report. Ocul. Surf. 15, 334–365. doi: 10.1016/j.jtos.2017.05.003
Taormina, C. R., Baca, J. T., Asher, S. A., Grabowski, J. J., and Finegold, D. N. (2007). Analysis of tear glucose concentration with electrospray ionization mass spectrometry. J. Am. Soc. Mass Spectrom. 18, 332–336. doi: 10.1016/j.jasms.2006.10.002
Valim, V., Trevisani, V. F., de Sousa, J. M., Vilela, V. S., et al. (2015). Current approach to dry eye Disease. Clin. Rev. Allergy Immunol. 49, 288–297. doi: 10.1007/s12016-014-8438-8437
Wang, Y., Grenell, A., Zhong, F., Yam, M., Hauer, A., Gregor, E., et al. (2018). Metabolic signature of the aging eye in mice. Neurobiol. Aging 71, 223–233. doi: 10.1016/j.neurobiolaging.2018.07.024
Williamson, J. F., Huynh, K., Weaver, M. A., and Davis, R. M. (2014). Perceptions of dry eye disease management in current clinical practice. Eye Contact Lens. 40, 111–115. doi: 10.1097/ICL.0000000000000020
Wolffsohn, J. S., Arita, R., Chalmers, R., Djalilian, A., Dogru, M., Dumbleton, K., et al. (2017). TFOS DEWS II Diagnostic Methodology report. Ocul. Surf. 15, 539–574. doi: 10.1016/j.jtos.2017.05.001
Yanshole, V. V., Snytnikova, O. A., Kiryutin, A. S., Yanshole, L. V., Sagdeev, R. Z., and Tsentalovich, Y. P. (2014). Metabolomics of the rat lens: a combined LC-MS and NMR study. Exp. Eye Res. 125, 71–78. doi: 10.1016/j.exer.2014.05.016
Young, S. P., and Wallace, G. R. (2009). Metabolomic analysis of human disease and its application to the eye. J. Ocul. Biol. Dis. Inform. 2, 235–242. doi: 10.1007/s12177-009-9038-9032
Yu, J., Asche, C. V., and Fairchild, C. J. (2011). The economic burden of dry eye disease in the United States: a decision tree analysis. Cornea 30, 379–387. doi: 10.1097/ICO.0b013e3181f7f363
Zhang, A., Sun, H., Yan, G., Wang, P., and Wang, X. (2015). Metabolomics for Biomarker Discovery: moving to the Clinic. Biomed. Res. Int. 2015:354671. doi: 10.1155/2015/354671
Keywords: metabolomic, dry eye disease, least absolute shrinkage and selection operator (LASSO) regression, tear profile, glucose metabolism, Glutathione metabolism, amino acid metabolism
Citation: Jiang Y, Yang C, Zheng Y, Liu Y and Chen Y (2020) A Set of Global Metabolomic Biomarker Candidates to Predict the Risk of Dry Eye Disease. Front. Cell Dev. Biol. 8:344. doi: 10.3389/fcell.2020.00344
Received: 18 January 2020; Accepted: 20 April 2020;
Published: 08 June 2020.
Edited by:
Venkaiah Betapudi, United States Department of Homeland Security, United StatesReviewed by:
Santosh Panjikar, Australian Synchrotron, AustraliaMichal Jan Markuszewski, Medical University of Gdańsk, Poland
Qiulun Lu, Nanjing Medical University, China
Copyright © 2020 Jiang, Yang, Zheng, Liu and Chen. This is an open-access article distributed under the terms of the Creative Commons Attribution License (CC BY). The use, distribution or reproduction in other forums is permitted, provided the original author(s) and the copyright owner(s) are credited and that the original publication in this journal is cited, in accordance with accepted academic practice. No use, distribution or reproduction is permitted which does not comply with these terms.
*Correspondence: Yihui Chen, MTMwMDA4OUB0b25namkuZWR1LmNu
†These authors have contributed equally to this work
 Yaping Jiang
 Chuanxi Yang
 Yuxiang Zheng3
 Yining Liu
 Yihui Chen