 Xiaoming Zhai
 Kevin C. Haudek
 Christopher Wilson3
- 1Department of Mathematics, Science, and Social Studies Education, University of Georgia, Athens, GA, United States
- 2CREATE for STEM Institute, Michigan State University, East Lansing, MI, United States
- 3BSCS Science Learning, Colorado Springs, CO, United States
Estimating and monitoring the construct-irrelevant variance (CIV) is of significant importance to validity, especially for constructed response assessments with rich contextualized information. To examine CIV in contextualized constructed response assessments, we developed a framework including a model accounting for CIV and a measurement that could differentiate the CIV. Specifically, the model includes CIV due to three factors: the variability of assessment item scenarios, judging severity, and rater scoring sensitivity to the scenarios in tasks. We proposed using the many-facet Rasch measurement (MFRM) to examine the CIV because this measurement model can compare different CIV factors on a shared scale. To demonstrate how to apply this framework, we applied the framework to a video-based science teacher pedagogical content knowledge (PCK) assessment, including two tasks, each with three scenarios. Results for task I, which assessed teachers’ analysis of student thinking, indicate that the CIV due to the variability of the scenarios was substantial, while the CIV due to judging severity and rater scoring sensitivity of the scenarios in teacher responses was not. For task II, which assessed teachers’ analysis of responsive teaching, results showed that the CIV due to the three proposed factors was all substantial. We discuss the conceptual and methodological contributions, and how the results inform item development.
Introduction
Construct-irrelevant variance (CIV, also called error variance) is regarded as an important threat to validity, especially for constructed response assessments with rich contextualized information (Zaichkowsky, 1985; Haladyna and Downing, 2004; Geisinger et al., 2013). For example, Alonzo and Kim (Zehner 2016) asked teachers to watch scenario-based teaching clips which provide rich information and then asked them to provide constructed responses to questions. Contextualized constructed-response items are deemed to be more authentic than multiple-choice items and, consequently, examinees might be more likely to perform in a way that reflects their competency in a given scenario (Peter, 2009; Peter et al., 2009; Rodger et al., 2009). However, “contextual features that engage and motivate one [examinee] and facilitate his or her effective task performances may alienate and confuse another [examinee] and bias or distort task performance” (Messick, 1989, p. 19). That is, the rich contexts or scenarios within the items might elicit examinees’ performance which does not entirely reflect the construct of interest (COI), thus compromising the interpretation and use of the test scores. Besides the impact on examinees, literature has suggested that, due to the involvement of complex contexts in the testing tasks, scorers might also be confounded by such irrelevant information when rating examinees’ constructed responses (Marentette et al., 2012; Zhai and Pellegrino, in press). This is because when the responses are more diverse, human coders might not be able to differentiate if this variability is caused by the COI or an irrelevant construct, which may cause systematic bias in a rater’s scores (Lane, 2013). In all, estimating and monitoring the CIV in contextualized constructed response assessments is vital in securing a robust validity of the assessment.
Prior research on the CIV has mainly employed a linear regression model or product-moment correlation to evaluate the CIV (for example see Haladyna and Downing, 2004). However, in constructed response assessment, the scores are usually generated based on categorical or ordinal, rather than interval, measurement, so that these two previous approaches might not be applicable. Cronbach et al. (1972) suggested generalizability theory, or G-Theory to monitor the CIV (i.e., error variance). G-Theory employs analysis of variance (ANOVA) to examine the CIV due to the rater, context, etc. and can also determine how these factors contribute to CIV (Shavelson et al., 1989; Clauser, 1999; Clauser et al., 2006). However, as Linacre (1996) stated, G-theory could examine the CIV but could not adjust examinees’ raw score for the error variance. Moreover, there are limited studies that focus on examining the CIV due to the scenarios in contextualized items. The CIV involved in contextualized performance assessment has not been specified in a given area such as teaching performance in literature. Thus, there are both conceptual and methodological gaps in investigating CIV.
This study intends to fill these gaps. First, we develop a model to conceptualize three types of CIV in assessments employing contextualized constructed response items. This model centers on assessment task scenarios, which might impact both examinee and rater performance, resulting in different types of CIV. Second, we employ the many-facet Rasch measurement (MFRM), which was first developed by Linacre (1989) to examine and compare the CIV of the constructed response scores. We choose the Rasch model because it can transfer categorical data into continuous measures, therefore the CIV drawn from different sources is comparable. Another advantage of the Rasch model is that the examinee ability measures calibrated by the MFRM have already been adjusted for the locations of the CIV facets on the continuum that represents the latent variable (Engelhard and Wind, 2017). Prior studies have employed MFRM to examine error variance due to rater severity and the assessment task (e.g., Engelhard, 1994; Myford and Wolfe, 2003), but few studies have applied it to examine CIV specifically due to the scenario of the assessment item. To demonstrate the usefulness of this model and approach, we apply the model in examining CIV in a video-based assessment for testing in-service science teacher pedagogical content knowledge (PCK) in two areas: Analysis of student thinking and analysis of responsive teaching. In this example, we employ a designed approach by controlling the COI but varying the item scenarios so that we can examine the CIV due to the variability of scenario, judging severity, and rater scoring sensitivity of the scenarios. Finally, we discuss the generalization of the model to contextualized assessments, the methodology, and how to use the findings to revise the assessments. This study answers this research question: How can CIV be examined when using contextualized constructed response assessments?
Modeling the Construct-Irrelevant Variance in Contextualized Constructed Response Assessment
In their seminal article, Construct Validity in Psychological Test, Cronbach and Meehl (1955) introduced an innovative concept termed construct validity created by the APA Committee on Test Standards. They introduced the construct as the latent trait or attribute of examinees that a test is intended to assess (e.g., teachers’ PCK), which should be reflected in test performance. Haladyna et al. (2004) suggest that the identification of a construct is the basis of designing a test and validating a measure. Thus, from the perspective of validity, both the interpretive and validity arguments should address the construct that is usually predefined before item development (Messick, 1989; Kane, 1992). The construct is usually regarded as the test of interest and ideally should primarily account for the variance of examinee’s performance in a test. However, unlike the variance caused by the COI, the CIV is unintended and can lead to issues in score interpretation (Messick, 1984). Lord and Novick (1968) defined the CIV as a source of systematic error of scores and suggested that CIV might threaten the validity, such as that due to psychological or situational factors. In their definition, Lord and Novick suggested that the CIV might indicate a systematic increase or decrease the assessment score for the examinees. Following Lord and Novick (1968), the Standards (AERA & NCME, 2014) further extended this concept by stating that any bias that results in systematic higher or lower scores is CIV.
Given the broad definition of CIV, many sources might cause CIV, such as test preparation, test development and administration, scoring, examinee preferences, and cheating (Gallagher et al., 2002; Haladyna and Downing, 2004). In this study, we focus on aspects that are most likely to be directly impacted by the involvement of contextual scenarios in a constructed response assessment. Therefore, some general aspects, such as test preparation, administration, and cheating, which are not unique to contextualized constructed response assessments, are not included in the model for the current study. Because of this, we primarily consider sources from two aspects that might account for the CIV in this contextualized assessment: examinees and raters who might cause CIV due to the variability of assessment task scenarios.
Many prior studies (Haladyna, 1992; Boaler, 1994; Ferrara et al., 1997; Klassen, 2006; Zhai et al., 2019b) have shown that by involving scenarios in assessment items, respondents’ performance on the test will be impacted. Typically, items with rich scenarios elicit respondents’ thinking and understanding because they are aligned to a real-life situation. This effect positively serves the interpretation and use of scores by creating a recognizable context for the respondents. However, in some cases, rich scenarios draw negative effects, thus leading to CIV. For example, Boaler (1994) found that boys might perform better than girls in math tests involving gender-biased scenarios (e.g., football), which is a reasonable source of systematic bias or a CIV. Another example in an international test focusing on physics is that, test developers typically use specific objects, such as refrigerators, to develop the scenario. However, a group of students in developing countries without the experience of using or seeing refrigerators in real life might struggle with understanding that scenario and applying their knowledge in problem-solving. In these cases, the scenarios may elicit systematic bias and are a source of the CIV. Many similar examples to illustrate possible sources of CIV could be cited (e.g., Heritage et al., 2009), but what we are interested in is the common effect of these issues on examinees’ scores. In this study, we specify this impact as an item difficulty variation (i.e., CIV) due to the scenario involvement and variability. That is, the item difficulty varies once the scenarios change, which is not expected otherwise. This CIV might reflect systematic bias on certain groups of respondents or even the entire sample at varying degrees.
Given that we focused on constructed response assessment, judging severity is considered as another major source of the CIV (Ebel and Frisbie, 1986; Engelhard, 1992; Zhu et al., 1998; Goodwin, 2016; Ooi and Engelhard, 2019). Theoretically, it is unreasonable to assume that each rater would interpret the rubrics in the same manner when scoring, because each rater may have a different understanding of the assessment or use different interpretations of examinee responses or have different cognitive abilities to interpret complex responses (Wind, 2020). In this sense, the judging severity might result in systematic bias on examinee scores. Unlike the scenario variation, judging severity is a personal characteristic of the raters and is not typically specified within the item scenarios.
The involvement of scenarios in contextualized assessment results in an interaction between the scenario and the raters’ judgment, which leads to another type of CIV. Due to the variability of the scenarios, the examinee responses or performance might vary, for example, to be more complex or to be simpler. This may significantly impact the raters’ interpretation of the responses constrained to their knowledge, understanding of the responses, and cognitive ability (Crooks et al., 1996). We consider this systematic bias due to the scenario variability as a third source for CIV. Since this CIV is associated with both the scenario and the rater, we note it as rater scoring sensitivity of scenarios to be distinctive from judging severity. Ideally, raters should be more sensitive to the COI, while less sensitive to the CIV, and thus their assigned scores could better reflect the intended use of the scores. However, this might not always be the case in practice, thus, an investigation is necessary.
Drawing upon the potential sources of CIV described above, we propose the following model to account for the major CIV for contextualized constructed response assessment,
where,
Applying the Many-Facet Rasch Measurement
Rasch modeling has many advantages as opposed to classical testing measurement models. One of the most important advantages is that Rasch modeling can transfer categorical data into continuous measures, such as examinee ability or item difficulty (Engelhard and Wind, 2017). More importantly, it positions all the measures in a shared logit scale so that the parameters are comparable. A traditional Rasch model has two facets: examinee ability and item difficulty. These two facets do not include any external variance, such as judging severity. Therefore, if exterior factors impact the scoring, the data would not meet the requirement of the model, and thus less likely to predict examinee ability. Linacre (1989) extended the Rasch model by including more facets in the model, such as judging severity or tasks used in the test into the traditional two-facet Rasch model, so that the multi-facet model can exclude the external variance when calibrating examinee ability measures. In their prior study, Chi et al. (2019) applied this approach to investigate disciplinary context effect on student scientific inquiry competence. Zhai and Li (2021) applied this approach to validate how fundamental ideas in science could help improve the validity of assessment practices using multiple-choice items. In our study, in order to analyze categorical data from a constructed response assessment and examine the sources of external variances, we employed Linacre’s MFRM. Using the MFRM, we can compare the CIV from different sources within a shared logit scale.
A four-facet (i.e., examinee ability, item difficulty, judger severity, and the sensitivity of judges to the specific scenario) Rasch measurement model is proposed as,
where,
To better understand if the parameters within a facet are homogenous for the samples or not, we need separation measures to estimate the equality of the parameters. For example, we must evaluate whether the judging severity across the raters are significantly different from each other. This outcome will help us decide if the variance in a facet is substantial. In this study, we defined three parameters: Separation reliability, the variance of the parameter estimated, and the Chi-square for parameter equality. The Chi-square test will accompany the separation reliability to test for significance. For the separation reliability,
where s is the variance of the parameter estimates,
and the Chi-squared value is,
where,
Empirical Study and Methods
Context
The dataset used in this study comes from a larger research project that is developing and validating a measure of science teachers’ PCK, the professional knowledge of teachers that bridges science content knowledge, and how to effectively teach the content in classrooms (Shulman, 1986). For this study, we developed a design approach incorporating two video-based constructed response testing tasks tapping 1) analysis of student thinking (i.e., Task I) and 2) analysis of responsive teaching (i.e., Task II). Each task was assessed in three different scenarios present in the video clips. Using Zhai et al. (2019a) visualized framework for MFRM, scores generated for each examinee are presented in Figure 1. We are interested in examining the CIV involved in the assessment in order to inform future item development and revision.
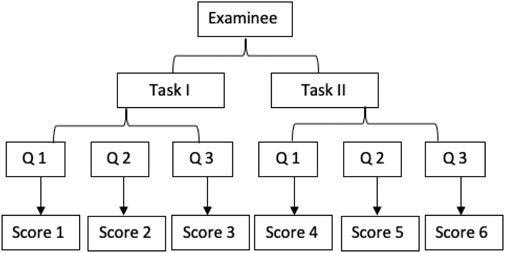
FIGURE 1. Score structure of the research design.
Teacher PCK is a significant predictor of both high-quality classroom practice and student achievement in science (Keller et al., 2017). Consequently, PCK is a common outcome in many studies of professional development and teacher education interventions and is therefore an important construct to measure (Chan and Yung, 2015; Gelfuso, 2017; Grammatikopouloset al., 2019). Most measures of PCK situate their approach in the assertion that, since PCK is the professional knowledge of teachers, it is visible in the professional work of teachers, which involves planning, teaching, and reflecting (Wilson et al., 2019). Planning measures ask teachers to write about the topics they are going to teach, what their lessons will involve, and to describe reasons for those instructional decisions; teaching measures use teachers’ classroom practice as evidence of their PCK, and reflecting measures occur following instruction, and involve teachers discussing their reasons for instructional moves. In this study, we asked teachers to analyze video clips of other teachers’ teaching and scored their constructed responses to infer their PCK.
Sample
The sample analyzed here comes from a national sample of 187 science teachers in the United States teaching grades 3 through 10, with 12.3% teaching grades 3–5, 49.3% teaching grades 6–8, and 38.5% teaching grades 9–12. These teachers had a range of 1–50 years of teaching experience, with an average of 16 years of experience and 77.5% of the sample self-identified as female. In order to obtain a sample that included teachers with more advanced science PCK, we focused our recruitment on teachers that had recently experienced high-quality science professional development or were presidential awardees in the area of science or were certified to teach science by the National Education Association.
Instrument
The instrument in this study uses a teacher’s analysis of another teacher’s classroom teaching video as evidence of their PCK. These video clips were identified from full-length science lessons recorded in elementary school classrooms in the United States. The initial video selection process was intended to target video clips that were most likely to elicit the sub-constructs of interest. Four experts with comprehensive knowledge of the sub-constructs of interest and content knowledge in elementary science viewed the pool of videos and then came together to agree on the most appropriate video clips. Eventually, the group of experts selected 11 video clips according to the content analysis and piloted the video clips with 192 science teachers to test the extent to which each of the eleven videos elicits the sub-constructs. Eventually, we chose three videos (S1, S2, and S3) to be used as the instrument in this project. These videos included a fourth-grade classroom learning about air resistance (video scenario 1), a fifth-grade classroom learning about condensation on the outside of soda can (video scenario 2), and a fifth-grade classroom learning about distillation (video scenario 3) (the content of the video clips is presented in Supplementary Table S1, Zhai et al., 2020).
Each of the three video clips had a different teaching context (e.g., teaching the evaporation of water), which we refer to as the scenario for our study. For each clip, teachers first read a short summary of the classroom context and then watch a 3–5-min video clip of another teachers’ classroom instruction. The video clips were chosen to reveal two specific dimensions of PCK, which we refer to as student thinking (i.e., Task I) and responsive teaching (i.e., Task II). After viewing the classroom video clip, teachers were asked to write about the teaching and learning visible in the video and provide analytic comments. The instrument targeted teacher knowledge of student thinking and responsive teaching through two prompts. The first prompt asks, “What do you notice about the student ideas related to the science content in this video?” The second prompt asks, “What do you notice about how the teacher responds to student ideas related to the science content in this video?” This latter question targeted whether the respondents could identify how the teacher in the video connected what the students were thinking to how the teachers in the video responded to that thinking.
Rubrics and Scoring
A rubric was developed that targeted the student thinking and responsive teaching elements. To receive a positive score for 1) student thinking, the respondent needed to first reference student thinking and then connect that thinking to domain-specific scientific vocabulary. To receive a positive score for 2) responsive teaching, the respondent needed first make an observation about how the teacher responded to the student thinking about the science idea and then discuss a purpose for that teacher response (for example responses and codes refer to Supplementary Table S1). Three experts (i.e., Tony, Emer, and Lacie) with knowledge in elementary science teaching, PCK, and scoring experience were recruited for this scoring. After completing a training process, each of the three raters was randomly assigned to more than half of the data set, with each item scored by two raters. Inter-rater reliability was calculated between every two raters for each task: Task I: kte = 0.869, ktl = 0.882, kel = 0.878.; Task II kte = 0.520, ktl = 0.428, kel = 0.496. Task II has a lower interrater agreement than task I, which suggests that task II might be more challenging for raters to score and reach an agreement than task I. This might be due to those responding teachers have multiple alternative options to suggest how to respond to student thinking, which made the responsive teaching more complex for raters to agree on assigned scores. Discrepancies between raters were resolved by discussion among the raters.
Data Collection
Data collection occurred through the Qualtrics survey platform. After completing a consent form and responding to inclusion criteria questions (current teaching status and grade level), teachers were randomly assigned to video order. Then, teachers viewed three video clips and responded to the two prompts after each video. At the end of the survey, teachers responded to a series of demographic questions. The entire task took around 30–40 min to complete.
Analysis
Since the two tasks are associated with the COI, we applied the MFRM approach to the two tasks, respectively. We identified three facets and an interaction in the many-facet Rasch model: examinee (i.e., teachers), scenario, judging severity, and the interaction between rater and the scenario (to reflect the CIV due to rater scoring sensitivity to the scenario). We used Conquest 2.0 (Wu et al., 2007) to analyze the data.
Results
To investigate our research question, we first examine the statistics of the measurement model fit and then present data for the CIV for each of the two tasks.
Statistics of the Measurement Model
To confirm that the item response model fit the observed scores, we first examined the outfit MNSQ and infit MNSQ for the scores assigned by each rater on each scenario for the two tasks. MNSQ is suggested by Rasch (1960) as the outfit and infit values to control the applicability of the fit between the observed values and the expected values in the model. Both measures are calibrated based on the sum of standardized residuals and the degrees of freedom, while the outfit MNSQ is also weighted by the number of observations and is more sensitive to extreme responses. In contrast, the infit MNSQ is more sensitive to responses when the item difficulty is comparable to the person’s ability. The value of 1 for both measures indicates a perfect fit of the observed data and the model, while Linacre (2002) suggests that a range from 0.5 to 1.5 is productive for measurement. In our case, all the observed measures of both outfit and infit MNSQ lie in the productive range for both assessment tasks. However, two outfit MNSQ values of task I and two outfit MNSQ values for task II are located outside the 95% confidence interval, which may suggest they are less productive for the construction of the measure (see Table 1).
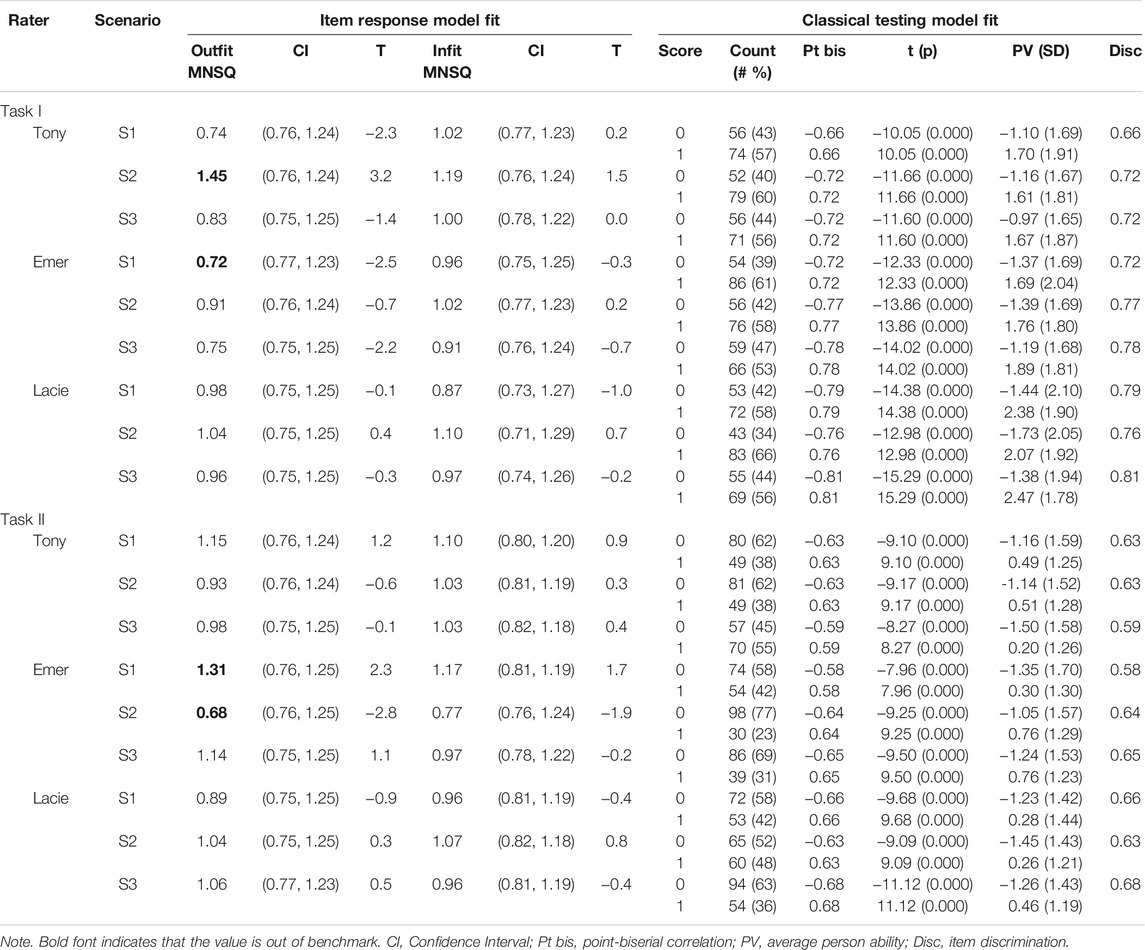
TABLE 1. Statistics of the measurement model Task I (Student Thinking) and Task II (Responsive Teaching).
We also examined classical testing model statistics by checking the combination of three raters and three item scenarios, which will further evaluate the fit of the items. Each of the combinations is regarded as one separate generalized item with a dichotomous rating. Thus, each teachers’ ability measure is calculated based on the scores of nine generalized items for each task. Our findings did not show extreme teacher responses, and the percent of teachers’ responses of both 0 and 1 are mainly and reasonably located in the range of 30–70%. The point-biserial correlation, calibrated between the categories of responses and the teachers’ total score, consistently increases with the category scores, as is desired (see Table 1). The teacher average ability (PV) measure and the standard deviation (SD) for each response category of the generalized items are calculated, and the measure confirms that teachers with higher average ability are better awarded for all 18 items. The discrimination measure, which is the product-moment correlation between the raw score on this item and the total raw score of all the items for a person, has a fairly good value, with a mean = 0.69, SD = 0.071 for both tasks.
Construct-Irrelevant Variance for the PCK Assessments
Task I Student Thinking
We plotted the measures of the MFRM for the student thinking task on a Wright map (see Figure 2). The Wright map includes four panels: the far-left panel represents the teachers’ ability, the second panel represents the scenario (or item difficulty), the third panel represents the judging severity, and the last panel (i.e., far right) represents the interaction of the scenario and the rater. All the measures for these panels share a scale (at far left, from -6 to 7 logits) so that all the values across panels are comparable. The allocation of the numbers or characters within each bin indicates the value for each of the measures. In the many-facet Rasch model, the average value for each of the facet, except the examinee facet, is set to be zero so that the examinee ability measures could be calculated uniquely. In our case, the sign of x (note: each x represents 1.4 teachers) in the teacher panel represents teachers’ posterior ability measure, which ranges from −4.8 to 7 (with a variance of 4.807), and the teachers are normally distributed on this scale, M = 0.645, SD = 2.192. In the following sections, we introduce the right three panels which represent the CIV on the Wright map, in detail. The variance and the separation measures are calculated respectively for a better understanding of the CIV in this task and their significance (see Table 2).
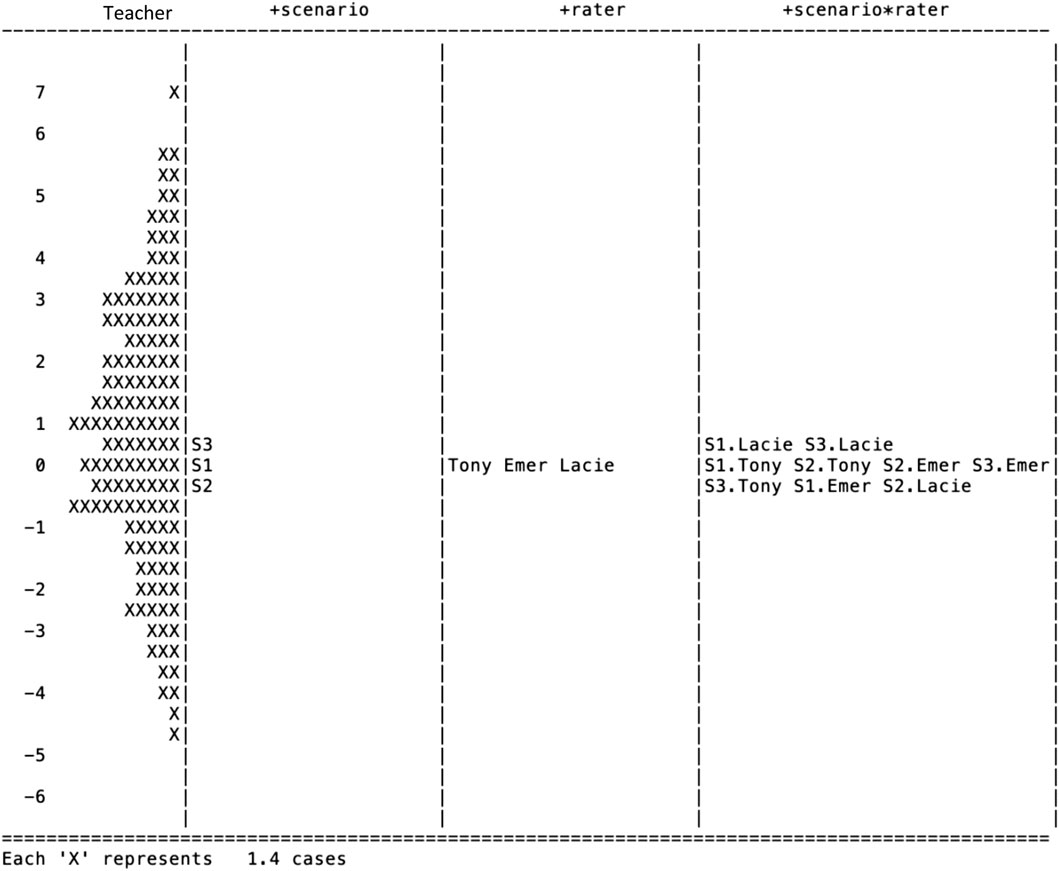
FIGURE 2. Wright map of the Student Thinking (task I).
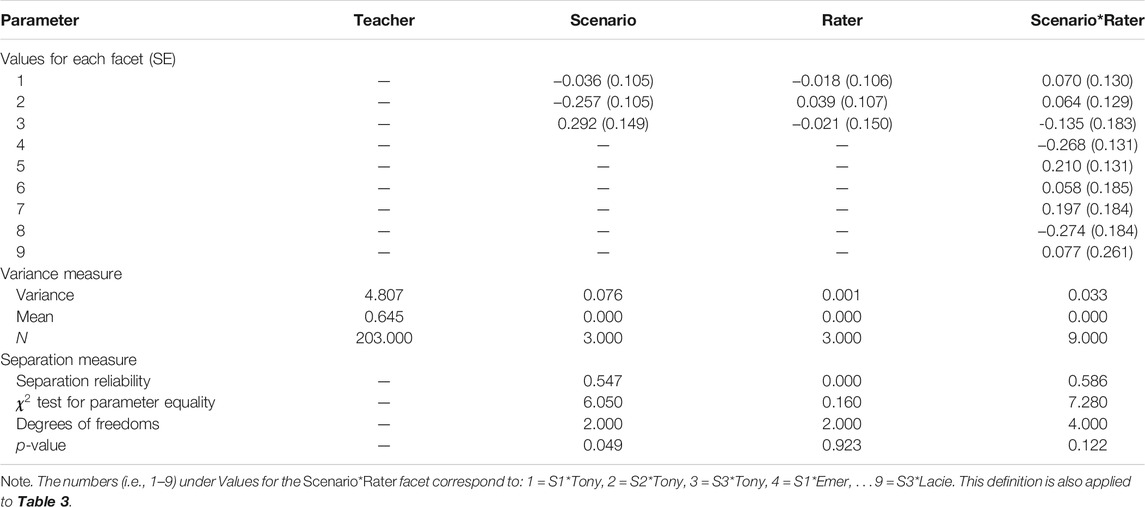
TABLE 2. Variance and separation measure of the four facets for Task I.
Variance of Difficulty Due to Scenarios
On the scenario panel of the Wright map (Figure 2), the corresponding values of the position of the labels for 1, 2, and 3 represent the difficulty of the item (student thinking) within the video scenario of S1, S2, and S3, respectively. The higher of the values, such as S3, indicates the item with this scenario is more challenging for teachers than the items with the other scenarios. Since the variability of the difficulty comes from the varied scenarios involved in the tasks which results in a portion of the CIV, it is necessary to examine and monitor the variability of the difficulty measures due to the scenarios. For task I, we found the variance is 0.076.
To understand the substance of the variance measure, we further calculated a set of separation measures including the separation reliability and the Chi-square test of parameter equality. Separation reliability indicates the extent to which the item parameters are separated from each other (Wright & Stone, 1979). In a given facet, like the Scenario facet, this index indicates to what extent the item difficulty is different due to the scenarios. A value close to 1 indicates that the parameters are entirely separated, or the elements of the group are heterogeneous, while a value close to 0 indicates less separation in the parameters, or the elements of the group are homogeneous. In the Scenario facet of task I, the separation reliability is fairly substantial, 0.547. Since the separation reliability rises with increasing sample sizes, a Chi-square test of equality is performed. In the Scenario facet, the Chi-square test indicates that the difficulty values of the item with the three scenarios are significantly different,
Variance of Judging Severity
In the third panel of the Wright map (Figure 2), the raters Tony, Emer, and Lacie are ploted, and the values on the logit scale corresponding to the location of their names indicate their judging severity. A higher value of judging severity indicates that the corresponding rater is more severe when assigning scores to teacher responses. For task I, the three raters had almost equal judging severity since each was positioned similarly on the vertical scale. Variance across the three raters is only 0.001, equalling only 1.3% of the variance due to the diversity of the scenarios. The separation reliability, 0.000, suggests homogeneity of judging severity across the three raters. Finally, the Chi-square test confirmed the homogeneity,
Variance of Rater Scoring Sensitivity Toward Scenarios
The rater scoring sensitivity toward the scenarios is indicated in the fourth panel in the Wright map (Figure 2). Each combination of the raters and the scenarios is represented by a two-part code, resulting in values for the three scenarios and the three raters. The first part of the code, as in S1.Lacie, represents the scenario (i.e., S1) and the second part (i.e., Lacie) represents the rater (i.e., Rater Lacie). A higher position of the code, which is represented by the location on the Wright map, indicates that the rater tends to assign lower scores to teachers for the given scenario. From Table 2, we observed the variability of the rater sensitivity, and the actual variance calibrated based on the nine measures is 0.033, which is equal to 43% of the variance due to the scenario. The separation reliability is 0.586. However, the Chi-square of parameter equality suggests that the difference in rater sensitivity is not significant,
Task II Responsive Teaching
The measures of the many-facet Rasch model for task II are plotted in Figure 3. The means of the three facets (i.e., the difficulty of scenario, judging severity, and rater sensitivity) are set as 0 respectively as we did for task I. The left-most panel indicates that the teacher ability ranges from -4.6 to 2.8 (with a variance of 1.441), which is significantly more centred than that on task I (i.e., −4.8–7.0, with a variance of 4.807). A paired-samples t-test was conducted to compare teacher ability measures on task I and task II. Results indicate a significant difference in the ability on task I (M = 0.645, SD = 2.192) and on task II (M = −0.606, SD = 1.200); t (202) = 8.262, p = 0.000, Cohen’s d = 0.578. These results suggest that there are significantly different challenges between the two tasks for teachers. Since the two tasks shared the same video-clip scenarios, the same teachers replied to the items in the same fashion, and the same raters were employed to rate teachers’ response, we suspect that the differences of teachers’ ability measures reflect that the construct underlying task II is significantly more challenging for teachers than task I. Next, we present the CIV for assessing Responsive Teaching in task II. Please note the meaning of the labels in Figure 3 is identical to those in Figure 2.
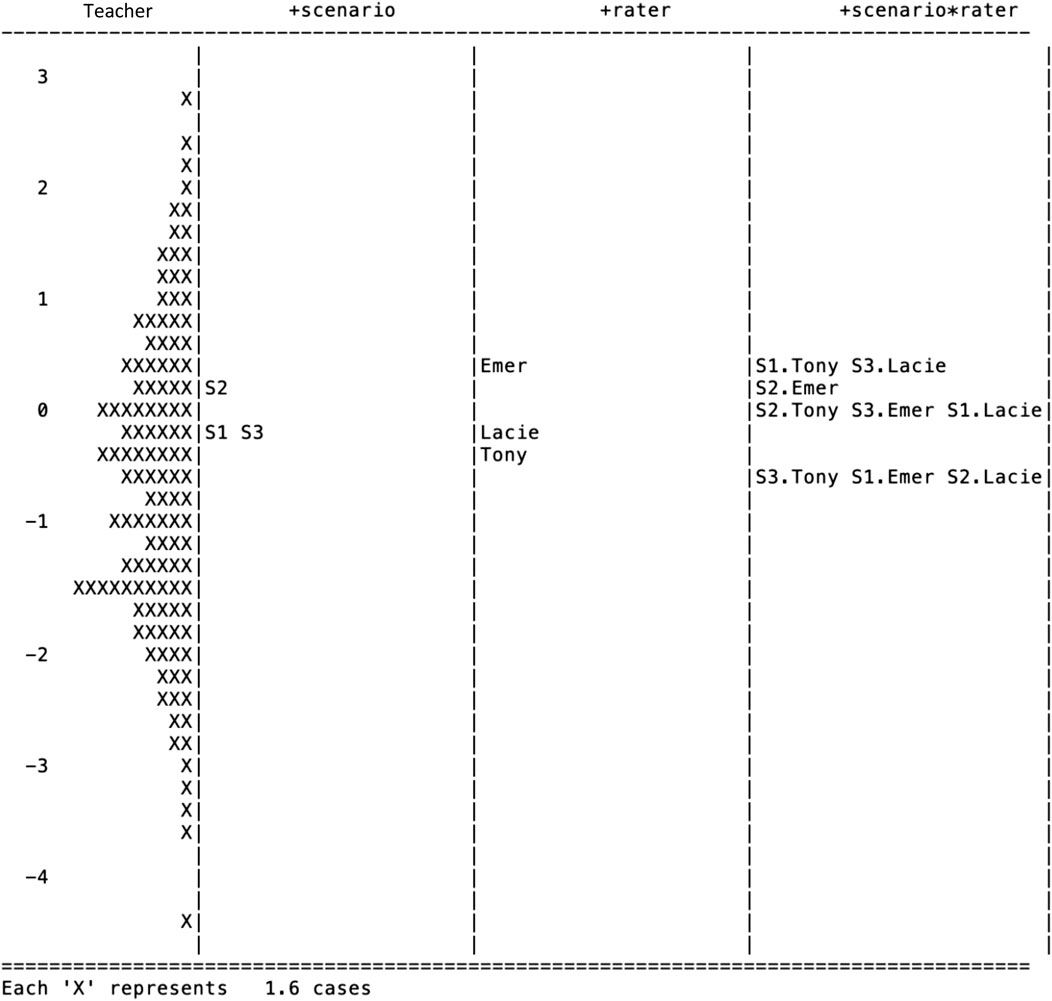
FIGURE 3. Wright map of the Responsive Teaching (task II).
Variance of the Difficulty Measure Across the Three Scenarios
The variance of difficulty due to scenarios is 0.034 for task II (Table 3). In comparison to task I, in which scenario S3 is most challenging, the S2 scenario in task II (M = 0.212, SE = 0.088) is most challenging for teachers, and S1 (M = -0.113, SE = 0.087) is least challenging. To examine the homogeneity of the scenario facet, we calibrated the separation reliability, which is fairly high, 0.854. Chi-square test for parameter equality confirms that the difficulty measures associated with the three scenarios are significantly different for task II,
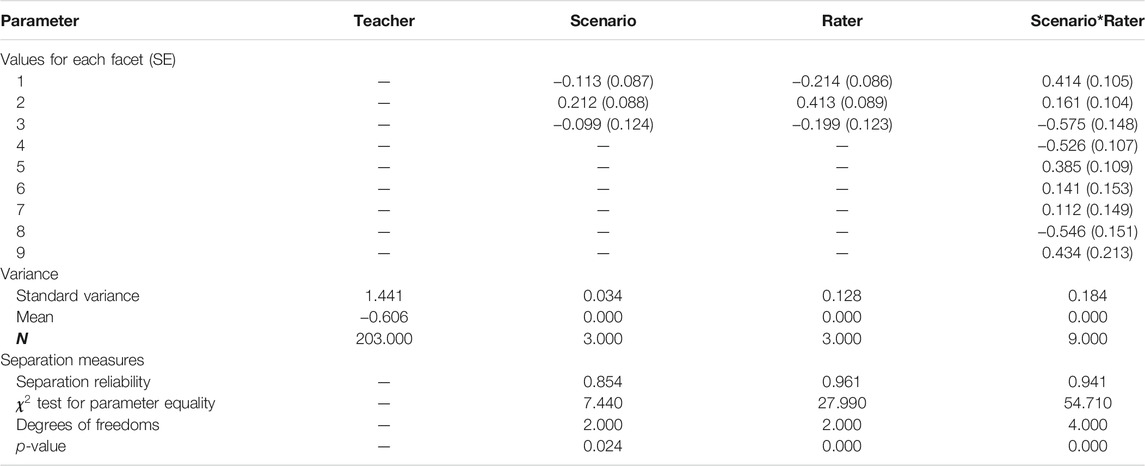
TABLE 3. Variance and separation measure of the four facets for Task II.
Variance of Judging Severity
The variance of the judging severity for task II is 0.128, which is almost four times of that due to the scenarios. Also, the variance of judging severity is different from that of task I, where the judging severity is minor (0.001). This substantial change of variance due to judging severity between tasks is because that the COI of the two tasks is different, which may require different cognitive activities for raters to score the teacher responses. We suspect the changes in the cognitive level might be accounted for the variability of judging severity. The separation reliability is extremely high, 0.961, which suggests a heterogeneity of judging severity. It seems that rater Emer held the most severe standards (M = 0.413, SE = 0.089) when scoring teachers’ responses, while rater Tony is least severe (M = -0.214, SE = 0.086). The Chi-square test for parameter equality further suggests that the difference of judging severity across the three raters is significant,
Variance of Rater Scoring Sensitivity Toward Scenarios
The CIV (0.184) due to the rater scoring sensitivity is almost six times as that due to the scenario. The separation reliability is also extremely high at 0.941. The Chi-square test for parameter equality supports this heterogeneity of rater sensitivity of the scenarios,
Discussion
A prerequisite of validity is that the scores assigned to examinees represent the underlying COI. Without meeting this criterion, the interpretation and use of these scores would be problematic. However, it can be difficult to ensure that this criterion is met due to multiple complicating factors, especially for constructed response assessments with a performance-based measure that involves rich contexts (Lane and Iwatani, 2015). Concerning the increasing use of constructed response assessments due to the call for performance-based measures in science education (NRC, 2012), it is essential to develop a model to identify and measure the factors that may lead to CIV being involved in these assessments. To address this need, this study developed a model to conceptualize the CIV for contextualized constructed response assessment and proposed an MFRM approach to examine the CIV. We also suggest a design approach to control the COI and vary the scenarios when developing constructed response assessments, as demonstrated in the empirical study, to investigate the CIV due to different sources. By using the MFRM approach, the outcome (i.e., measure of examinee ability) should be more reliable because the identified CIV are subsequently excluded from the variance of the examinee ability. Therefore, this study makes conceptual, methodological, and practical contributions to the field.
The model we developed includes three sources that might contribute to CIV in contextualized constructed response assessment: the variability of scenarios, judging severity, and rater sensitivity of the scenarios. To be noted, the CIV can be feasibly examined only through the design approach, such as we demonstrated in this study. Otherwise, it is difficult to separate and examine the CIV from different sources. Though the primary goals of this study are to develop such a model, provide a methodology to examine the CIV, and empirically validate the model, we argue that this model could be extended to examining CIV in future studies in other contexts and with different sources of CIV. First, the facets could be specified with regard to specific characteristics of the assessment task and/or scoring process, and the model could be modified to examine how these characteristics contribute to CIV. Taking the scenario facet as an example, it might be that the setting or the sources of the context contribute to CIV more significantly than others (Ruiz-Primo and Li, 2015). By deliberately identifying these key characteristics and including them in a study design for controlling the COI, we could extend the model to better understand the setting or sources of context impacting the CIV. Second, the model could be generalized to other facets of interest to better understand general characteristics inherent within the item (e.g., length of the item stem or format), the potential bias from the rater (e.g., rater’s experience), and the interaction between the rater characteristics and the item characteristics, among other potential facets.
This study employed the MFRM to examine the CIV, in order to produce more reliable examinee ability measures. By using the MFRM, we could compare the CIV due to different factors on a shared logit scale so that the contribution of each aspect is comparable. Also, the CIV due to components within each facet is quantified and comparable. MFRM has been employed in prior studies to examine CIV due to the variability of raters or tasks (e.g., Engelhard, 1996; Myford and Wolfe, 2003), yet none of the prior studies conceptualized and examined the CIV due to scenarios. The design approach is valuable in examining CIV in accompany with the MFRM approach, which, to our knowledge, has seldom been employed in prior studies. Both the MFRM and the design approach make a unique contribution for researchers to examine CIV due to sources such as scenarios. To be noted, MFRM is equally as useful as the G-Theory that was proposed by Cronbach et al. (1972) to examine and monitor the error variance. However, the G-Theory cannot adjust examinees’ raw score for CIV, while the MFRM could. This is because, as argued by Linacre (1996), the MFRM has already excluded the CIV (e.g., due to the judging severity or task variability) when calibrating examinee ability measures. In addition, the MFRM is flexible so that it remains applicable to situations when the model is modified, for example, in the above-mentioned cases for testing specified characteristics. Also, the MFRM could potentially still be applicable to examine other characteristics of the assessment, even when the model of CIV is changed.
The results of this study have implications for assessment developers to create and refine the contexts of science assessments. Without a comprehensive understanding of the effect of contexts, assessment developers may have difficulty appropriately equivalizing item contexts (Heritage et al., 2009). Resulting differences in item contexts may either positively engage participants in authentic assessment, and thus enhance the relationship between test scores and the COI, or might negatively distract participants from being focused on the question and thus increase the CIV in the test. Our approach has the potential to inform teachers to better understand what role the item context plays in assessments. For example, in our study, we found the scenarios provided within video clips is a source that significantly contributes to the CIV. This information reminds the assessment developers to control the variability of the scenarios when assessing teacher PCK. Otherwise, for example, it will be hard to implement contextualized assessments if different assessment scenarios yield scores favoring different conclusions. Given the significant impact of the scenario on the scores, assessment developers also should reflect on which characteristics of the scenarios are necessary in the assessment in order to assess PCK.
Also, results from task II indicate that the raters are sensitive to the scenario, while results from task I suggest that the raters are not. The results inform item developers to re-examine the rubrics and the examinee responses to recognize whether specific information from the scenario may bias the raters’ decision. Many prior studies (e.g., Bejar, 2012; Crisp, 2012) have suggested a rater’s cognitive process might be impacted by multiple factors, yet few studies indicate how the scenarios provided within an assessment impact a rater’s cognition and performance. In the area of teacher education, few studies have examined CIV due to assessment scenarios, which should be addressed in future studies.
This study does have some limitations. First, as a methodological study and as part of a larger project, we did not deeply examine the specific features of the scenario inherent in the videos and other rater characteristics, other than the severity and their sensitivity to the scenarios. Instead, we intend to provide a framework to conceptualize and examine the CIV. In addition, we did not investigate the mechanism of how the CIV identified in this study was produced in the empirical findings. These interesting questions will be explored in future studies.
Conclusion
Compelling assessments in science education have become demanding given the complex constructs targeted and that assessments increasingly include constructed responses and performance-based measures (NRC, 2012). This study seconds the point that researchers must explicitly identify the COI and the potential sources for CIV and use measurement models to examine the COI. Following this line of research, we specifically focus on the context involved in a constructed response assessment, as well as how this context may result in CIV. The three factors we proposed, the variability of assessment item scenarios, judging severity, and rater scoring sensitivity to the scenarios, are critical for validity and should be taken into consideration when using contextualized constructed response assessments, such as the PCK measure in this study. We propose to use MFRM to examine the CIV and COI, which not only measures the CIV but also excludes CIV from COI. This study also proposes a design approach to controlling for COI, which could be applied in examining CIV for other complex assessments in science education (Beyer and Davis, 2009; Zhang et al., 2011; Shermis, 2015; Lottridge et al., 2018).
Data Availability Statement
The raw data supporting the conclusion of this article will be made available by the authors, without undue reservation.
Author Contributions
XZ charges of the conceptualization, methodology, data analysis, and writing of the manuscript. KH solicits funding, charges data collection, and has edited the manuscript. CW solicits funding, charges data collection and coding, and has edited the manuscript. MS charges data collection and coding and writes part of the methods section.
Funding
This material is based upon work supported by the National Science Foundation under Grant No. DGE 1438739 and Grant No. DGE 1437173. The first author is partially funded by National Science Foundation 2101104. Any opinions, findings, and conclusions or recommendations expressed in this material are those of the author(s) and do not necessarily reflect the views of the National Science Foundation.
Conflict of Interest
The authors declare that the research was conducted in the absence of any commercial or financial relationships that could be construed as a potential conflict of interest.
Publisher’s Note
All claims expressed in this article are solely those of the authors and do not necessarily represent those of their affiliated organizations, or those of the publisher, the editors and the reviewers. Any product that may be evaluated in this article, or claim that may be made by its manufacturer, is not guaranteed or endorsed by the publisher.
Supplementary Material
The Supplementary Material for this article can be found online at: https://www.frontiersin.org/articles/10.3389/feduc.2021.751283/full#supplementary-material
References
Bejar, I. I. (2012). Rater Cognition: Implications for Validity. Educ. Meas. Issues Pract. 31 (3), 2–9. doi:10.1111/j.1745-3992.2012.00238.x
Beyer, C., and Davis, E. A. (2009). Supporting Preservice Elementary Teachers' Critique and Adaptation of Science Lesson Plans Using Educative Curriculum Materials. J. Sci. Teach. Educ. 20 (6), 517–536. doi:10.1007/s10972-009-9148-5
Boaler, J. (1994). When Do Girls Prefer Football to Fashion? an Analysis of Female Underachievement in Relation to 'realistic' Mathematic Contexts. Br. Educ. Res. J. 20 (5), 551–564. doi:10.1080/0141192940200504
Chan, K. K. H., and Yung, B. H. W. (2015). On-Site Pedagogical Content Knowledge Development. Int. J. Sci. Educ. 37 (8), 1246–1278. doi:10.1080/09500693.2015.1033777
Chi, S., Wang, Z., and Liu, X. (2019). Investigating Disciplinary Context Effect on Student Scientific Inquiry Competence. Int. J. Sci. Educ. 41 (18), 2736–2764. doi:10.1080/09500693.2019.1697837
Clauser, B. E., Clyman, S. G., and Swanson, D. B. (1999). Components of Rater Error in a Complex Performance Assessment. J. Educ. Meas. 36, 29–45. doi:10.1111/j.1745-3984.1999.tb00544.x
Clauser, B. E., Harik, P., and Margolis, M. J. (2006). A Multivariate Generalizability Analysis of Data from a Performance Assessment of Physicians' Clinical Skills. J. Educ. Meas. 43, 173–191. doi:10.1111/j.1745-3984.2006.00012.x
Crisp, V. (2012). An Investigation of Rater Cognition in the Assessment of Projects. Educ. Meas. Issues Pract. 31 (3), 10–20. doi:10.1111/j.1745-3992.2012.00239.x
Cronbach, L. J., Gleser, G. C., Nanda, H., and Rajaratnum, N. (1972). The Dependability of Behavioral Measures: Theory of Generalizability for Scores and Profiles. New York, NY: John Wiley.
Cronbach, L. J., and Meehl, P. E. (1955). Construct Validity in Psychological Tests. Psychol. Bull. 52 (4), 281–302. doi:10.1037/h0040957
Crooks, T. J., Kane, M. T., and Cohen, A. S. (1996). Threats to the Valid Use of Assessments. Assess. Educ. Principles, Pol. Pract. 3 (3), 265–286. doi:10.1080/0969594960030302
Ebel, R., and Frisbie, D. (1986). Essentials of Educational Measurment. 4 ed. Englewood Cliffs, NJ: Prentice-Hall.
Engelhard, G., and Wind, S. (2017). Invariant Measurement with Raters and Rating Scales: Rasch Models for Rater-Mediated Assessments. New York, NY: Routledge.
Engelhard, G. (1996). Evaluating Rater Accuracy in Performance Assessments. J. Educ. Meas. 33, 56–70. doi:10.1111/j.1745-3984.1996.tb00479.x
Engelhard, G. (1994). Examining Rater Errors in the Assessment of Written Composition with a many-faceted Rasch Model. J. Educ. Meas. 31, 93–112. doi:10.1111/j.1745-3984.1994.tb00436.x
Engelhard Jr., G. (1992). The Measurement of Writing Ability with a many-faceted Rasch Model. Appl. Meas. Educ. 5 (3), 171–191. doi:10.1207/s15324818ame0503_1
Ferrara, S., Huynh, H., and Baghi, H. (1997). Contextual Characteristics of Locally Dependent Open-Ended Item Clusters in a Large-Scale Performance. Appl. Meas. Educ. 10 (2), 123–144. doi:10.1207/s15324818ame1002_2
Gallagher, A., Bennett, R. E., Cahalan, C., and Rock, D. A. (2002). Validity and Fairness in Technology- Based Assessment: Detecting Construct- Irrelevant Variance in an Open-Ended, Computerized Mathematics Task. Educ. Assess. 8 (1), 27–41. doi:10.1207/s15326977ea0801_02
Geisinger, K. F., Bracken, B. A., Carlson, J. F., Hansen, J. I. C., Kuncel, N. R., Reise, S. P., et al. (2013). APA Handbook of Testing and Assessment in Psychology in Testing and Assessment in Clinical and Counseling Psychology (American Psychological Association), Vol. 2, ix–605.
Gelfuso, A. (2017). Facilitating the Development of Preservice Teachers' Pedagogical Content Knowledge of Literacy and Agentic Identities: Examining a Teacher Educator's Intentional Language Choices during Video-Mediated Reflection. Teach. Teach. Educ. 66, 33–46. doi:10.1016/j.tate.2017.03.012
Goodwin, S. (2016). A Many-Facet Rasch Analysis Comparing Essay Rater Behavior on an Academic English reading/writing Test Used for Two Purposes. Assessing Writing 30, 21–31. doi:10.1016/j.asw.2016.07.004
Grammatikopoulos, V., Gregoriadis, A., and Linardakis, M. (2019). Discrete Choice Modeling in Education: An Innovative Method to Assess Teaching Practices. Educ. Meas. Issues Pract. 38 (3), 46–54. doi:10.1111/emip.12255
Haladyna, T. M. (1992). Context‐dependent Item Sets. Educ. Meas. Issues Pract. 11 (1), 21–25. doi:10.1111/j.1745-3992.1992.tb00223.x
Haladyna, T. M., and Downing, S. M. (2004). Construct‐irrelevant Variance in High‐stakes Testing. Educ. Meas. Issues Pract. 23 (1), 17–27. doi:10.1111/j.1745-3992.2004.tb00149.x
Heritage, M., Kim, J., Vendlinski, T., and Herman, J. (2009). From Evidence to Action: A Seamless Process in Formative Assessment. Educ. Meas. Issues Pract. 28 (3), 24–31. doi:10.1111/j.1745-3992.2009.00151.x
Kane, M. T. (1992). An Argument-Based Approach to Validity. Psychol. Bull. 112 (3), 527–535. doi:10.1037/0033-2909.112.3.527
Keller, M. M., Neumann, K., and Fischer, H. E. (2017). The Impact of Physics Teachers' Pedagogical Content Knowledge and Motivation on Students' Achievement and Interest. J. Res. Sci. Teach. 54 (5), 586–614. doi:10.1002/tea.21378
Klassen, S. (2006). Contextual Assessment in Science Education: Background, Issues, and Policy. Sci. Ed. 90 (5), 820–851. doi:10.1002/sce.20150
Lane, S., and Iwatani, E. (2015). “Design of Performance Assessments in Education,” in Handbook of Test Development. Editors S. Lane, M. R. Raymond, and T. M. Haladyna (New York, NY: Routledge), 290–309.
Lane, S. (2013). “Performance Assessment in Education,” in APA Handbook of Testing and Assessment in Psychology. Test Theory and Testing and Assessment in Industrial and Organizational Psychology. Editor K. F. Geisinger (Washington, D.C.: American Psychological Association), Vol. 1, 329–339. doi:10.1037/14047-020
Linacre, J. M. (1996). “Generalizability Theory and Many-Facet Rasch Measurement,” in Objective Measurement: Theory into Practice. Editors G. Engelhard, and M. Wilson (Norwood, NJ: Ablex), Vol. 3, 85–98.
Linacre, J. (2002). What Do Infit and Outfit, Mean-Square and Standardized Mean. Rasch Meas. Trans. 16 (2), 878.
Lord, F. M., and Novick, M. R. (1968). Statistical Theories of Mental Test Scores. Reading, MA: Addison-Wesley.
Lottridge, S., Wood, S., and Shaw, D. (2018). The Effectiveness of Machine Score-Ability Ratings in Predicting Automated Scoring Performance. Appl. Meas. Educ. 31 (3), 215–232. doi:10.1080/08957347.2018.1464452
Marentette, B. J., Meyers, L. S., Hurtz, G. M., and Kuang, D. C. (2012). Order Effects on Situational Judgment Test Items: A Case of Construct-Irrelevant Difficulty. Int. J. Select Assess. 20 (3), 319–332. doi:10.1111/j.1468-2389.2012.00603.x
Messick, S. (1984). The Psychology of Educational Measurement. J. Educ. Meas. 21, 215–237. doi:10.1111/j.1745-3984.1984.tb01030.x
Messick, S. (1989). “Validity,” in Educational Measurement. Editor R. L. Linn 3rd ed. (NewYork: American Councilon Education and Macmillan), 13–103.
Myford, C. M., and Wolfe, E. W. (2003). Detecting and Measuring Rater Effects Using many-facet Rasch Measurement: Part I. J. Appl. Meas. 4 (4), 386–422.
National Research Council (2012). A Framework for K-12 Science Education: Practices, Crosscutting Concepts, and Core Ideas. Washington, DC: National Academies Press.
Ooi, P. S., and Engelhard, G. (2019). Examining Rater Judgements in Music Performance Assessment Using Many-Facets Rasch Rating Scale Measurement Model. J. Appl. Meas. 20 (1), 79–99.
Pellegrino, J. W., Wilson, M. R., Koenig, J. A., and Beatty, A. S. (2014). Developing Assessments for the Next Generation Science Standards. Washington, DC: The National Academies Press.
Peter, F. (2009). Real World Contexts in PISA Science: Implications for Context-Based Science Education. J. Res. Sci. Teach. 46 (8), 884–896. doi:10.1002/tea.20334
Peter, N., Silke, R., Katrin, S., Stefan, R., and Claus, C. (2009). Performance and Levels of Contextualization in a Selection of OECD Countries in PISA 2006. J. Res. Sci. Teach. 46 (8), 897–908. doi:10.1002/tea.20338
Rash, G. (1960). Probabilistic Models for Some Intelligence and Attainment Tests. Copenhagen: Danish Institute for Educational Research.
Rodger, B., Peter, F., and Robert, L. (2009). Scientific Literacy and Contexts in PISA 2006 Science. J. Res. Sci. Teach. 46 (8), 862–864. doi:10.1002/tea.20332
Ruiz-Primo, M. A., and Li, M. (2015). The Relationship between Item Context Characteristics and Student Performance: The Case of the 2006 and 2009 PISA Science Items. Teach. Coll. Rec. 117 (1), n1.
Shavelson, R. J., Webb, N. M., and Rowley, G. L. (1989). Generalizability Theory. Am. Psychol. 44 (6), 922–932. doi:10.1037/0003-066x.44.6.922
Shermis, M. D. (2015). Contrasting State-Of-The-Art in the Machine Scoring of Short-form Constructed Responses. Educ. Assess. 20 (1), 46–65. doi:10.1080/10627197.2015.997617
Wilson, C. D., Borowski, A., van Driel, J., Hume, A., Cooper, R., and Borowski, A. (2019). “Perspectives on the Future of PCK Research in Science Education and beyond,” in Repositioning Pedagogical Content Knowledge in Teachers’ Knowledge of Teaching Science (Singapore: Springer). doi:10.1007/978-981-13-5898-2_13
Wind, S. A. (2020). Exploring the Impact of Rater Effects on Person Fit in Rater‐mediated Assessments. Educ. Meas. Issues Pract. 56 (3), 582–609. doi:10.1111/emip.12354
Wu, M. L., Adams, R., Wilson, M., and Haldane, S. (2007). ACER Conquest Version 2.0. Camberwell. Victoria, Australia: ACER Press, Australian Council for Educational Research.
Zaichkowsky, J. L. (1985). Measuring the Involvement Construct. J. Consum Res. 12 (3), 341–352. doi:10.1086/208520
Zehner, F., Sälzer, C., and Goldhammer, F. (2016). Automatic Coding of Short Text Responses via Clustering in Educational Assessment. Educ. Psychol. Meas. 76 (2), 280–303. doi:10.1177/0013164415590022
Zhai, X., Haudek, K. C., Stuhlsatz, M. A., and Wilson, C. (2020). Evaluation of Construct-Irrelevant Variance Yielded by Machine and Human Scoring of a Science Teacher PCK Constructed Response Assessment. Stud. Educ. Eval. 67, 1–12. doi:10.1016/j.stueduc.2020.100916
Zhai, X., and Li, M. (2021). Validating a Partial-Credit Scoring Approach for Multiple-Choice Science Items: An Application of Fundamental Ideas in Science. Int. J. Sci. Educ. 43 (10), 1640–1666. doi:10.1080/09500693.2021.1923856
Zhai, X., and Pellegrino, J. W. (in press). “Large-Scale Assessment in Science Education,” in Handbook of Research in Science Education. Editor N. G. Lederman Vol. 3.
Zhai, X., Ruiz-Primo, M. A., Li, M., Dong, D., Kanopka, K., Hernandez, P., et al. (2019a). “Using Many-Facet Rasch Model to Examine Student Performance on Contextualized Science Assessment,” in Annual Conference of the American Educational Research Association, Toronto, Canada.
Zhai, X., Ruiz-Primo, M. A., Li, M., Kanopka, K., Hernandez, P., Dong, D., et al. (2019b). “Students’ involvement in contextualized science assessment,” in Annual Conference of the National Association of Research in Science Teaching, Baltimore, MD.
Zhang, M., Lundeberg, M., Koehler, M. J., and Eberhardt, J. (2011). Understanding Affordances and Challenges of Three Types of Video for Teacher Professional Development. Teach. Teach. Educ. 27 (2), 454–462. doi:10.1016/j.tate.2010.09.015
Keywords: construct-irrelevant variance (CIV), contextualized assessment, science, pedagogical content knowledge (PCK), many-facet Rasch measurement, student thinking, responsive teaching
Citation: Zhai X, Haudek K, Wilson C and Stuhlsatz M (2021) A Framework of Construct-Irrelevant Variance for Contextualized Constructed Response Assessment. Front. Educ. 6:751283. doi: 10.3389/feduc.2021.751283
Received: 31 July 2021; Accepted: 24 September 2021;
Published: 12 October 2021.
Edited by:
Christopher Charles Deneen, The University of Melbourne, AustraliaReviewed by:
Jessica To, Nanyang Technological University, SingaporeHui Yong Tay, Nanyang Technological University, Singapore
Copyright © 2021 Zhai, Haudek, Wilson and Stuhlsatz. This is an open-access article distributed under the terms of the Creative Commons Attribution License (CC BY). The use, distribution or reproduction in other forums is permitted, provided the original author(s) and the copyright owner(s) are credited and that the original publication in this journal is cited, in accordance with accepted academic practice. No use, distribution or reproduction is permitted which does not comply with these terms.
*Correspondence: Xiaoming Zhai, eGlhb21pbmcuemhhaUB1Z2EuZWR1