 Björn Boman1,2*
- 1Stockholm University, Stockholm, Sweden
- 2Department of Education, Faculty of Social Sciences, Stockholm University, Stockholm, Sweden
This study set out to analyze Swedish 15-year-olds’ PISA performance in 2015 and to lesser extent 2018 by using a combination of individual data (2015) and aggregated cross-country data for 2015 and 2018, inclusive of 31 OECD countries. At the within-country and individual level, native Swedish students who took the PISA test in 2015 outperformed first- and second-generation migrants. Moreover, the latent socioeconomic variable “number of books at home” was associated with higher PISA math achievement. Ambition was positively associated with PISA math scores, wheres worry was negatively associated with PISA math. At the cross-country level, GDP per capita was associated with higher PISA scores but ethnic homogeneity was not. IQ scores, PIAAC scores for teachers, and teacher salaries were also moderately correlated with PISA math achievement. This indicates that a country with high cognitive ability levels, as well as cognitively competent and well-paid teachers are likely to perform better in large-scale international assessments such as PISA.
Introduction
When analyzing academic performance among Swedish pupils at lower-secondary and elementary level, there are typically four standardized procedures to evaluate them: grades, national tests, international tests, and specific tests constructed by researchers (Holmlund et al., 2019; Björklund et al., 2010). Recent research (Boman, 2021a; Boman, 2021b) shows that socioeconomic and sociodemographic variables are substantially associated with grades and national test results at the aggregated school level. Earlier studies such as Myrberg and Rosén (2009), who used structural equation modeling to analyze data from Progress in Reading Literacy Study (PIRLS), inclusive of Swedish students, have found associations between socioeconomic variables and reading achievement.
However, there is a dearth of studies on Swedish students’ Programme for International Student Assessment (PISA) performance, especially more recent surveys (i.e., 2015 and 2018), which is carried though in association with the Organization for Economic Co-operation and Development (OECD). An exception is the book Northern Lights on TIMSS and PISA (see Reimer et al., 2018), but this work does only focus on PISA 2015 from the perspective of all Nordic countries. Thus, it lacks larger cross-national data sets with more participating countries, as well as analyses on 2018. Moreover, it has less emphasis on mathematics achievement compared to science achievement and focuses mostly on socioeconomic indicators and science achievement–science interest indicators. This is because in the 2015 PISA assessment, science was the main subject whereas mathematics was the main subject in 2012. While this relationship makes sense, there is no reason to only focus on the main subject because of the high intercorrelations between the achievement scores in mathematics, reading and science (e.g., r = 0.772 to 0.888 in PISA 2015). In the current study, mathematical literacy will be highlighted because of the importance of mathematics for future educational trajectories, earnings and societal development (e.g., Rindermann, 2018) but the author admits that this selection is nevertheless somewhat arbitrary.
Therefore, in accordance with methodological suggestions underlined by Gustafsson (2007; 2008), as well as Jerrim et al. (2018) and to lesser extent Guglielmi and Brekke (2017), the following article examines Swedish students’ PISA performance in 2015 and 2018. The unique feature is the combination of one cross-sectional data set with Swedish students (n = 5458 in 2015) with two cross-national data sets for 31 countries in 2015 and 2018. This increases both the internal and external validity, as well as the reliability of such a research endeavor.
Theoretical Background
The Contemporary Swedish Education Context
The Swedish national curriculum has been revised several times. The last major revision for the entire school system was launched in 2011 (Lgr 11), with a partial revision in 2018. Sweden offers 9 years of mandatory elementary school education, in which “Årskurs 7–9” can be translated into lower-secondary school education. Students in Grade 8 and Grade 9 are eligible to take the PISA test if they are 15 years old. Furthermore, the education system consists of 3 years of non-mandatory upper-secondary school, and three to 5 years of higher education (Skolverket, 2018). In recent years, social inequality and increased migrant participation have been discussed as two factors that are pertinent for educational achievement as measured by for example the PISA tests (e.g., Skolverket, 2016b).
Sweden’s PISA Performance
PISA is a triennial international survey designated to examine and assess education systems around the world in three main subjects: mathematics, science, and reading. Only 15-year-olds participate in PISA. In each cycle, one of these three subjects constitutes the main subject which is given somewhat greater analytical attention compared to the others. In addition, later PISA studies (2012 onwards) have included problem solving and financial literacy.
Sweden’s PISA results were rather strong in 2000 and 2003, but have decreased since 2006 and up until 2015. Sweden’s results in the PISA 2012 survey mathematics, reading and science were rather weak (482) but the 2015 (overall average score 495.66) and 2018 (overall average score 502.30) surveys signified substantial improvements. For instance, the results in 2015 were roughly equal to 2009 whereas the 2018 survey indicated results there were similar to the 2006 counterpart (Skolverket, 2016a; OECD, 2019b).
PISA 2015
In 2015, 72 countries and urban regions participated. In this round, many countries used a computer-based assessment technique instead of paper-and-pencil-based tests (OECD, 2017, p. 24). Most participants had about 5000 participants in this survey. In 2015, the exclusion rate of Swedish students was 9% at the student level but only 1% at the school level (Skolverket, 2016a, p. 13). Japan had the highest overall average score among OECD countries, followed by Estonia, Canada, Finland and South Korea (OECD, 2018a).
PISA 2018
In PISA 2018, 79 countries or urban regions participated. The OECD average scores are typically set at 500 with 100 as a standard deviation (e.g., Jerrim, 2015) but in PISA 2018 the average for all three tests was 488.5 (OECD, 2019a). As said above, the PISA sample sizes do typically consist of approximately 5000 individuals but countries like for example Australia (14,273), B-J-S-Z (12,058), Brazil (10,691), UK (13,808), and United Arab Emirates (19,277) had considerably larger sizes. Iceland had only 3,294 and Macao 3,775 students, which reflect their small populations (OECD, 2019c, pp. 362–363). In this survey, Japan, South Korea, and Estonia had the highest results among the OECD countries (OECD, 2019a).
Literature Review
Five strands of literature will be briefly highlighted below: research on the factors associated with academic achievement at lower secondary level in Sweden, research on Sweden’s PISA performance, literature related to the nexus between PISA achievement and migrant participation, literature on factors associated with PISA performance at the cross-country level, and critical studies on PISA’s methodology. Some studies overlap, such as migration background and socioeconomic status (SES) linked with PISA performance.
Many studies related to Swedish students at Grade 8 and Grade 9 point to substantial relationships between parents’ socioeconomic status and academic achievement, whether such are based on international data like PIRLS, municipality data, or individual date on grades or national tests results are used (e.g., Myrberg and Rosén, 2009; Gustafsson and Yang Hansen, 2018; Boman, 2021a; Boman, 2021b). For example, Gustafsson and Yang Hansen (2018) examined changes in the impact of family education on student educational achievement in Sweden, from 1988 to 2014, and found that correlations increased by 0.04 units between the early 1990s and 2014, partly due to immigration. Boman (2021a) found that the SES among the working population in Swedish municipalities was correlated with school results (aggregated grades) in Grade 9 in 2019. In addition, natives outperformed non-natives and municipalities with a larger share of certified teachers were positively correlated with higher grades. More or less positive SES–academic achievement correlations have been found in both the US (Sirin, 2005), other developed countries (Tan, 2015), and developing countries (Kim et al., 2019).
In relation to teacher effects, there is a rich literature from scholars in the United States which indicates that teachers’ competence (e.g., certification, experience and so forth) has at least a moderate relationship with academic performance (e.g., Hanushek et al., 1996). In Sweden, studies are lacking but Holmlund et al. (2019) stress that the entirety of national and international evidence suggests that teachers’ competence do have a positive relationship with academic performance at the secondary levels. However, findings from correlational and regression analyses might be spurious due to that certified teachers may be more frequent in at least some low-performing schools and municipalities in Sweden (Holmlund et al., 2019). Boman (2021a; 2021b) found positive relationships between teacher certification rates and grades in all subjects at the aggregated municipality level in Sweden. In Boman (2021a), these relationships were more pronounced when high-performing municipalities were compared with low-performing counterparts. However, as both Homlund et al. (2019) and Myrberg and Rosén (2009) underline, family-related factors such as parents’ SES and IQ seem to explain most of the variance in relation to various measures of school achievement. School factors account for only a few percentages of the variability in grades (Holmlund et al., 2019). However, in regard to PISA, Hanushek et al. (2019) make a rather strong case for the impact of highly skilled teachers on students’ PISA performance. The authors underline:
All empirical strategies consistently indicate a robust positive relationship between teacher cognitive skills and student performance. In the OLS estimation with the full set of controls, we find that a one standard deviation (SD) increase in teacher cognitive skills is associated with 0.10–0.15 SD higher student performance. To put these estimates into perspective, they imply that roughly one quarter of gaps in mean student performance across our 31 countries would be closed if each of these countries were to raise the median cognitive skills of teachers to the level of Finnish teachers (the most skilled teachers by the PIAAC measures) (Hanushek et al., 2019).
As Wiklund (2018) observes, Sweden’s teachers are often blamed for the poor results in general and among low-SES segments such as second-generation and newly arrived migrants in particular. However, it is far from certain that more qualified or competence teachers – those that would for instance be congruent with how Finland’s teacher pool was constituted around 2011/2012 – do have much of an impact since Swedish teachers’ PIAAC scores are not much after their Finnish counterparts and substantially above the OECD average (Hanushek et al., 2019). PIAAC stands for Programme for the International Assessment of Adult Competencies and might be described as PISA for adults and teachers, typically based on smaller but representative samples, who take tests in numeracy and literacy (Gustafsson, 2016).
Sweden has experienced high rates of inflows of low-skilled migrants the 1990s onwards (Sanandaji, 2020; Ekberg, 1999). Economists such as Sanandaji (2020) and migration scholars like Vogiazides and Mondani (2019) have claimed that the socioeconomic and sociocultural integration of migrants in Sweden has largely failed, especially in the city of Malmö, leading to an increased fiscal burden, high unemployment rates and crime rates, as well as lower school results (Sanandaji, 2020; see also Skolverket, 2009; Skolverket, 2016b). In different European countries, natives do typically outperform immigrant students. Azzaloni et al. (2012) found that in Italy and Spain achievement differences in the PISA 2009 survey were associated with family background and socioeconomic status. In Italy, the effect of academic tracking was also substantial while immigrants from Latin America in Spain had an advantage in PISA reading due to their ability in Spanish. However, socioeconomic, institutional, and linguistic factors cannot fully explain the variance in both models (Azzaloni et al., 2012). Similar results were found for first- and second-generation immigrants in Switzerland when analysing data from the PISA 2000 wave. However, larger family sizes for first-generation immigrants, typically from Albania, had a negative relationship with PISA performance (Meunier, 2011).
Research on PISA achievement at the cross-national level indicates that cognitive abilities and PIAAC scores are highly correlated with PISA performance (e.g., Gustafsson, 2016; Rindermann, 2018; Hanushek et al., 2019). Swedish teachers had high average scores in literacy and numeracy (Hanushek et al., 2019), although substantially lower than Finland and Japan. Raw IQ scores in Sweden are similar to the British mean which is used as a standardized value and is set at 100 (Sonnander and Ramund, 2003).
Moreover, Cheung (2017) has found a significant relationship between resilience and mathematic literacy in the PISA 2012 survey, which implies that substantial shares of socioeconomically disadvantaged East Asian students perform better than home-advantaged students both in these countries and relative to other PISA participants. Specifically, ‘The effect sizes are that an increase of one standard deviation in mathematics self-efficacy is able to decrease the chance that an ESCS advantaged student will be academically slackening by approximately 50–75%’ (Cheung, 2017).
However, these patterns might be inapplicable to culturally distant countries like Sweden. Nonetheless, non-cognitive abilities might be included in for example multiple regression analyses as they are similar to personality traits like conscientiousness and emotional stability, which are associated with higher academic achievement and has a generic if not universal character (e.g., Poropat, 2009).
At this point, a plethora of critical academic works has accentuated the shortcomings of the OECD-related global competition (e.g., Prais, 2004; Sung, 2011; Imsen et al., 2017). Furthermore, PISA scores are, according to some researchers, not a good indicator of educational quality (Jerrim, 2015; Sjøberg, 2015). Moreover, the PISA test constitutes a costly procedure in which the benefits are by no means clear (Sjøberg, 2015). Furthermore, educational policy borrowing can be quite problematic (Steiner-Khamsi, 2014; Steiner-Khamsi, 2014; So, 2014; Sung, 2011; Takayama, 2008; Waldow et al., 2014). It is also questionable if the surveys are comparable over time due to the substantial inclusion/exclusion of different test items (Rutkowski and Rutkowski, 2016). Hence, when using PISA data, a balanced, critical yet grateful stance might be appropriate to take. If the OECD has done something positive it is to provide researchers, politicians, practitioners and laymen with more data pertinent for intranational and cross-national comparisons (Steiner-Khamsi, 2014; Sjøberg, 2015; Hanushek et al., 2019). The current article takes such a balanced approach which implies the usefulness of PISA data. Overall it contributes to the literature on Swedish students’ PISA performance and in such a way that it focuses on two waves at the cross-national level and in one assessment at the individual level.
The following research questions are addressed in the present study: What factors are associated with high achievement in PISA 2015 and 2018 among Swedish students? Are these patterns similar at the cross-country level? What other factors at the cross-country level are associated with differences in PISA math achievement?
Socioeconomic Status and Migration
The current theoretical framework is largely related to the earlier research on the nexus between cognitive ability, non-cognitive abilities, SES, and migration and PISA achievement, and is also closely aligned with the method and data. These perspectives and factors were discussed in the literature review section and more precisely below.
Socioeconomic status is associated with academic achievement (Sirin, 2005; Tan, 2015), inclusive of Sweden (Gustafsson and Yang Hansen, 2018). However, educational results in Sweden are typically also affected by both migration, geographical location, and school factors such as teacher competence or certification (Skolverket, 2009; Gustafsson and Yang Hansen, 2018; Holmlund et al., 2019; Björklund et al., 2010). In addition, migration is also linked to PISA achievement because migrants perform lower in the Swedish context (e.g., OECD, 2019a). Thus, the included variables reflect earlier research on academic performance of Swedish lower-secondary students.
Cognitive Abilities Among Students and Teachers
The current article builds on earlier PISA-related research frameworks like Rindermann (2018) and Hanushek et al. (2019) with some revisions relevant for the Swedish context. For instance, the input/output model in the economics of education literature – in which a lot of school factors and SES indicators are accounted for in multiple regression analyses – does not include students’ cognitive ability (IQ) as an independent variable which might substantially explain the outcome variable PISA achievement. In that regard, the works of for example Rindermann (2007), Rindermann (2018) and Lynn and Vanhanen (2012) add an important factor (NIQ, national IQ) which seems highly correlated with PISA achievement. These earlier studies are also consistent with recent research on the PISA–IQ relationship (Flores-Mendoza et al., 2021). As Flores-Mendoza et al. (2021) underline, the IQ–academic achievement correlations at the individual level might be lower compared to the counterparts at the aggregated cross-country level. Nevertheless, these are substantial at the individual level (Rindermann, 2018; Flores-Mendoza et al., 2021; Colom and Flores-Mendoza, 2007; Deary et al., 2007).
The theoretical decision to have PISA scores as the dependent variable and a not mere proxy for IQ scores (see the Method section below) is related to the assumption that the PISA scores are likely influenced by school knowledge (Rindermann, 2018), educational quality (e.g., teacher competence) and educational quantity (Rindermann, 2018), as well as non-cognitive abilities like perseverance (Borghans et al., 2016). IQ tests are also directly influenced by non-cognitive abilities like conscientiousness in test-taking situations but to lesser extent than scholastic tests, which are both directly and indirectly affected by school knowledge and relevant non-cognitive abilities (Borghans et al., 2016; Rindermann, 2018).
Method and Data
Analytical Strategy
In concordance with methodological suggestions underlined by Gustafsson (2007; 2008), as well as Jerrim et al. (2018), and to lesser extent Guglielmi and Brekke (2017), the current article focuses on both individual student data from Sweden from the 2015 PISA wave and aggregated data at the cross-national level for both 2015 and 2018. According to Gustafsson (2007; 2008), it is only meaningful to compare results from at least two different PISA waves at the aggregated level for the identification of trends in the outcome variables (and perhaps also some of the predictor variables as regards their relative statistical relationship with the dependent variables, such as the nexus between number of books at home and reading, science or mathematics achievement). This is because it is not the same students who take the tests in each wave. Gustafsson (2007, p. 40) stresses the limitations of using individual students’ data to compare differences over time, “This problem, whatever label is used, seems inescapable in studies with a cross-sectional design, at least when the analysis is done at the individual level.” Moreover, he underlines, “Correlation and regression analysis of difference scores can be applied in a meaningful manner, however, only when there are two waves of measurement.” (p. 61). Thus, by using two comparable waves with aggregated country level data, these methodological problems are alleviated. On the other hand, Guglielmi and Brekke (2017) underscore that the use of aggregated data can lead to the ecological fallacy (i.e., misleading inferences when information about individuals are based on aggregated data). Thus, the current article used both individual data and aggregated data to use the strengths of both types of data. Another option would be to use multilevel data analysis, which includes individual, classroom, school and national levels of analysis (e.g., Huang et al., 2019). However, when having this approach, the independent variables are still fixated and closed within each data set, whereas cross-country correlational and regression analyses may include variables that are external (e.g., GDP per capita, PIAAC, class size) in relation to the PISA data sets at the individual level.
Jerrim et al. (2018) accentuate that the 2015 and 2018 PISA waves are largely compatible because both are predominantly based on computer-based assessments whereas earlier waves were either entirely based on pencil-based assessments or a mix of both. Guglielmi and Brekke (2017) emphasize that when studying academic achievement within and between groups (e.g., high performing East Asian and American schoolchildren) it is important to include both individual data from the ILSAs (International Large-Scale Assessments, e.g., PISA) in order to avoid the ecological fallacy (i.e., the confounding of individual and macro levels), use multivariate analyses, and follow at least a certain group of students longitudinally to obtain a clearer understanding of causal mechanisms. Thus, the current article constitutes a synthesis between these three methodological perspectives (Gustafsson, 2007; Jerrim et al., 2018; Guglielmi and Brekke, 2017). This study does also share some similarities with Burhan et al. (2017). However, that study used PISA scores as a proxy for national cognitive abilities and focused more on human capital factors among both developed and developing countries (Burhan et al., 2017), whereas the current article focuses on school achievement among 31 OECD countries and does not equate national cognitive abilities and PISA scores.
As Myrberg and Rosén (2009) highlight, the differentiation between independent and dependent variables within a structure equation modeling (SEM) framework does only exist on a hypothetical level. Nevertheless, a path diagram for the assumed relationships was created (see Figures 1, 2 below), and the correlations between these independent variables were tested by confirmatory factor analysis (CFA), as suggested by Loehlin (2004, pp. 152–155). These relationships are illustrated in Tables 1–3.
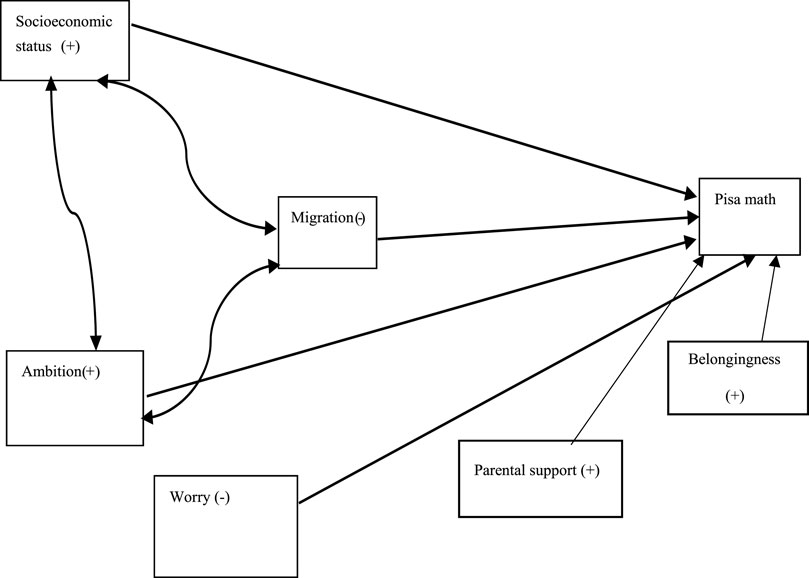
FIGURE 1. The possible interrelationships between parents’ and students’ socioeconomic status, migration, and students’ non-cognitive math abilities and their effects on PISA mathematics (2015). Straight one-headed arrows indicate direct and linear relationships. Curved and two-headed arrows indicate intercorrelations.
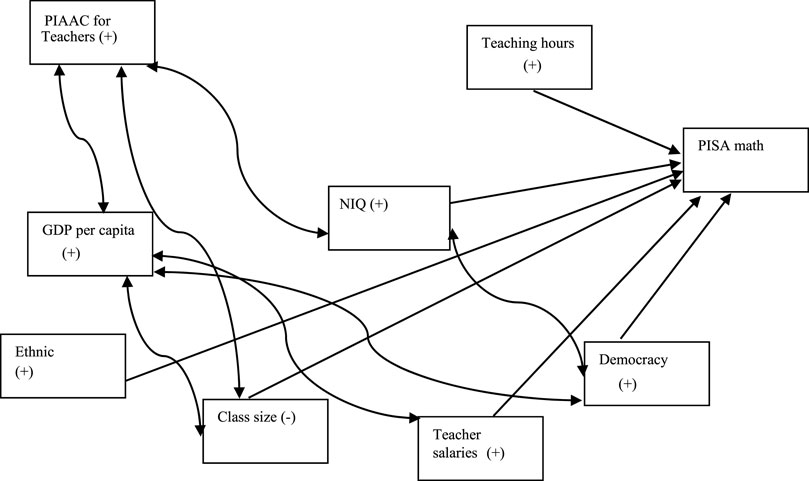
FIGURE 2. illustrates the assumed relationships in a path diagram, while Table 1 shows the intercorrelation matrix for the six most statistically significant independent variables and items. GDP per capita, ethnic heterogeneity, NIQ, PIAAC scores for teachers, teacher salaries, annual number of teaching hours, class size, democracy, and their effects on PISA mathematics (2015, 2018). Curved and two-headed arrows signify intercorrelations, while straight and one-headed arrows signify assumed causal relationships. + signifies positive direct effects, whereas – indicates negative direct effects.
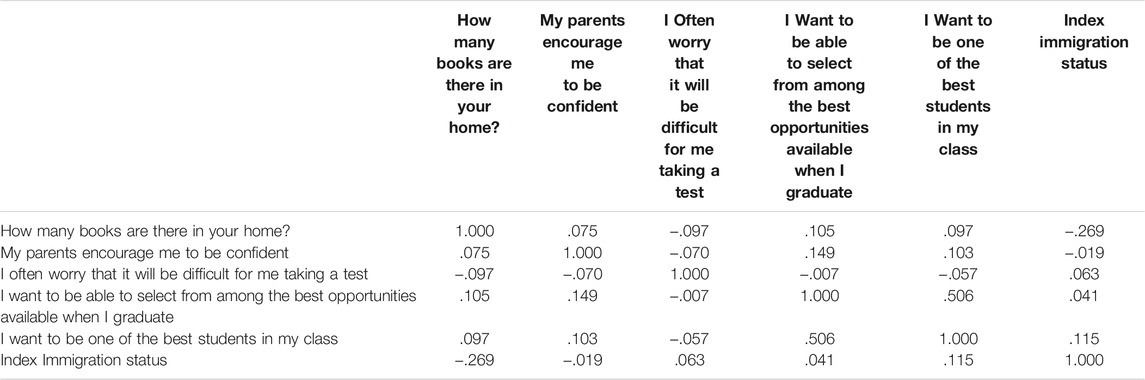
TABLE 1. Swedish students’ PISA 2015 performance: correlation matrix.
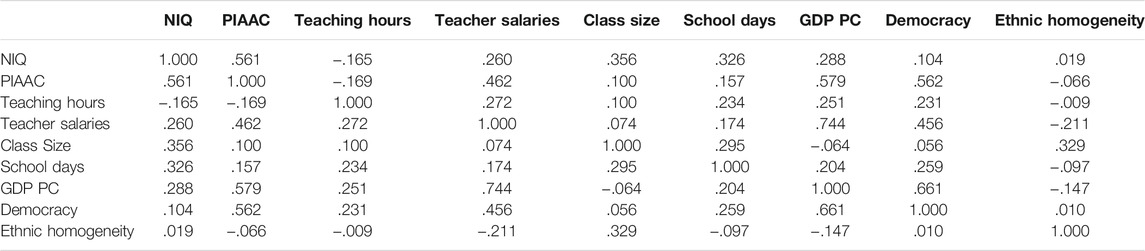
TABLE 2. PISA achievement (2015) at the cross-country level: correlation matrix.
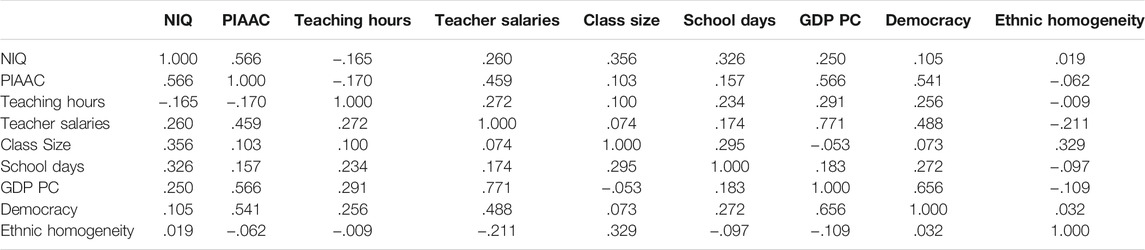
TABLE 3. PISA achievement (2018) at the cross-country level: correlation matrix.
Specifically, parents’ and hence students’ socioeconomic status constitutes a latent variable which is measured by the observed variable number of books at home. The latent variable students’ non-cognitive abilities are measured by the observed variables ambition, belongingness, and worry. However, native status is observed directly by the native/migrant categorization described below.
Moreover, both Pearson correlations and linear multiple regressions were used for both the individual data (Swedish students in PISA 2015) and aggregated cross-country data. Note that if the direct relationships assumed in Figures 1, 2 would be estimated these are derived from the standardized beta coefficients in the multiple regression models. However, in the current article only the main text and tables provide information about correlation coefficients.
Dependent Variables
At the within-country level for Sweden, PISA mathematics was used at the outcome variable. Because of the high intercorrelation between the three PISA scores (e.g., Rindermann, 2018), a single achievement measure was sufficient. At the cross-country, level, the average aggregated PISA mathematics score was used for 31 countries that matched those included in Hanushek et al. (2019). In the current study, the author used one plausible value (see OECD, 2009, for recommendations), specifically Plausible value 1 for mathematics. This might be regarded as a limitation of the study.
Independent Variables
Socioeconomic Status/GDP per Capita
Indicators of SES at the individual level was used, specifically number of books at home. More books at home indicate a higher level of SES (Reimer et al., 2018, p. 35). In the PISA data set, this variable is coded as BOOKS. Because parents appear to play a pivotal role for their children’s academic achievement (e.g., Falk et al., 2021), variables that only in part cover socioeconomic background but nonetheless reflect the possible influence of parents were included, specifically SUPPORT1-4 (e.g., 1 = My parents support me). All these were measured on a Likert scale. While there is an ongoing debate about the reliability and relevance of these measures (Reimer et al., 2018, pp. 35–37) they are nonetheless the most useful SES indicators within the PISA data set.
At the aggregated cross-country level, GDP per capita data for the years 2014 and 2018 (IMF) were used as a socioeconomic indicator. Because it is expected to be highly intercorrelated with average income at the national level only GDP per capita was considered in this respect.
Migration/Ethnic Heterogeneity
In accordance with earlier research on the link between migrant participation and academic performance in Sweden, the association between migration and PISA achievement (e.g., Skolverket, 2016a; Manhica, Berg, Almquist et al., 2018; Holmlund et al., 2019; Vogiazides and Mondani, 2019; Sanandaji, 2020; Boman, 2021a) was examined.
In PISA 2015 for Sweden, the main variable was nominal (natives and non-natives, the latter here coded as IMMIG and within that category 1 = Natives, 2 = Second-generation, 3 = First-generation). The immigration index, which consists of nine values on a nominal scale (including a few empty answers), was recoded into dummy variables, so that 1 = natives, and 0 = immigrants of first- and second-generation type.
At the cross-country level, ethnic homogeneity/heterogeneity was used as an independent variable which roughly corresponds to the relative migration level and impact across countries. Specifically, the percentage of non-natives within each country was used to signify the degree of ethnic heterogeneity in each country (World Factbook). A positive relationship might be expected, meaning that substantial ethnic homogeneity (e.g., 90%) may be associated with stronger economic development and perhaps also school results (Salter, 2004; Lynn and Becker, 2019). There are some problems associated with ethnic classifications, such as the very definition of a major ethnic group in each country, the potential presence of very similar but still discrete sub-ethnics groups, and perhaps over-simplified or biased classifications. For instance, according to World Factbook, South Korea is classified as an ethnically homogenous country but according to Moon (2015) it is rather 98% in that respect and the shares of people with some form of mixed or foreign background have increased in the last decades and are expected to increase even more in the coming years. Another borderline case is Australia, whose majority group “Australian” consists of people with a British background but does also comprise similar groups such as individuals of English, Irish and Scottish descent (World Factbook). When World Factbook provided incomplete or inaccurate information in that respect, earlier research and Wikipedia sources were used to find more accurate estimates (e.g., see Canada, France).
Students’ and Teachers’ Cognitive Abilities
Within the PISA sets (e.g., Gustafsson, 2016; Rindermann, 2018; Hanushek et al., 2019) there are no data on students’ or teachers’ cognitive skills, unless the actual PISA results are regarded as proxies for students’ cognitive abilities (e.g., Rindermann, 2018). However, earlier research shows that students’ and teachers’ cognitive skills are highly correlated with PISA performance at the cross-national level (Hanushek et al., 2019; Rindermann, 2018). In the present study, data on students’ cognitive abilities were included from Lynn and Becker (2019). This is to provide consistency between the scores. However, the “SAT weightings” that were included in the composed NIQ values in Lynn and Becker (2019) were removed to avoid a confounding effect, meaning that older scores from for example PISA and TIMSS might correlate with recent PISA scores rather than focusing on the specific NIQ–PISA relationships looked upon as two separate variables. Lynn and Becker (2019) used very detailed procedures to calculate their NIQ scores, including all available IQ samples and corrections for sample size and the so-called Flynn effect (i.e., the increase of IQ test scores over time which has been identified in many countries around the world). This resulted in scores that were typically lower than the raw scores from earlier cognitive ability studies. For example, the Swedish IQ is only set at 94.96 after corrections (Lynn and Becker, 2019, p. 149).
Data on teachers’ cognitive skills were retrieved from Hanushek et al. (2019, p. 865). The number of teachers who participated in the PIAAC survey ranged from between 106 in Chile to 834 in Canada. Sweden had 167 participating teachers in the PIAAC survey. Included teacher categories are composed of “preschool teacher,” “secondary school teacher” and “other teacher.” Kindergarten, university and vocational teachers were excluded because PISA students have not been taught by these types of teachers. The mean score was 259 points in numeracy and 268 points in literacy across 31 countries (Hanushek et al., 2019).
School Variables and Other Control Variables
At the cross-national level, additional school variables were added as control variables. It might be the case that some school variables are associated with PISA mathematics achievement. Specifically, teacher salaries, annual instruction time (shortened as teaching hours or TH), class size, and annual instruction days, were retrieved from OECD (2018b). Lower-secondary school teachers’ actual salaries (OECD, 2018b, p. 375) were compared at the 10 years’ experience rate. Number of annual teaching hours were compared in general programmes at lower-secondary level (OECD, 2018b, p. 382). Average class size was calculated as the mean of public and private institutions’ mean values. If class size has a meaningful statistical relationship it is expected to be a negative such, meaning that larger classes are negatively correlated with PISA achievement. The reason why merely 31 countries were included is because these countries have full data on all important independent variables and that they correspond to Hanushek et al. (2019).
In addition, The Economist Intelligence Unit’s data were used to align the 2014 democracy index score for each country with PISA 2015, and the same index was used for 2017 and as such aligned with PISA 2018.
Non-Cognitive Abilities
To examine the relationship between Swedish students’ non-cognitive abilities and PISA performance in mathematics (2015), a set of independent variables from the two PISA sets were included. These do partly overlap personality traits like the Five Factor Model (FFM, which consists of Openness to experience, Conscientiousness, Extraversion/Introversion, Agreeableness, Neuroticism/Emotional stability) but should perhaps rather be looked upon as non-cognitive abilities of more or less importance for school performance, such as ambition, belongingness and worry. Nonetheless, earlier research indicates that conscientiousness and emotional stability are associated with higher academic achievement (e.g., Duckworth et al., 2005; Conard, 2006; Poropat, 2009).
The present study included ambition, belongingness and worry in the first regression analyses. Ambition is associated with conscientiousness whereas belongingness and worry are related to neuroticism (Malone et al., 2012; see also Alverson, 2014; Poropat, 2009) and all have been associated with school achievement to different extents (Poropat, 2009; Alverson, 2014). However, all items were still included in some regression models. Specifically, AMB1 measures “I want top grades,” AMBI2 measures “I want to be able to select from among the best opportunities available when I graduate,” AMBI3 measures “I want to be the best, whatever I do,” AMBI4 measures “I see myself as an ambitious person,” and AMBI5 measures “I want to be one of the best students in my class.” Higher scores, such as 3 and 4, indicate higher ambition (i.e., the individual agrees with the statement), on a Likert-type scale. Some worry measures such as “I often worry about difficult tests” are perhaps more similar to test anxiety than neuroticism (c.f., Cheung, 2017; Poropat, 2009). These ordinal scale variables were re-coded into sum scores.
Correlations and Regression Coefficients
Correlations (Pearson’s r) and multiple linear regressions were used to estimate the relationships between the independent variables and the dependent variables. For the intra-country level (PISA 15), step-wise hierarchical regressions were used to increase the R2 value while still controlling for multicollinearity. The analysis begun with the two independent variables, number of books at home and migration status, followed by ambition indicators. Then all relationships were estimated by linear regressions, which then constituted the measured model in relation to the assumed model (see Loehlin, 2004).
As regards the cross-country level for PISA 2015 and PISA 2018, Pearson correlations were used in the first step to estimate any statistically significant coefficients and then linear multiple regressions were run with those that were statistically significant. All analyses and multicollinearity diagnostics were conducted using SPSS Statistics 26.
Plausible Relationships
From the individual PISA data, a positive relationship between number of books at home (an indicator of SES) and PISA math achievement (2015) was expected. A positive relationship was expected between ambition and mathematics achievement because the number 1 on the 5-point Likert scale signified “strongly disagree” on the statement “I want top grades” whereas four signified “strongly agree.” In accord with Loehlin (2004, p. 2), the simple path diagram assumed that most variables would be intercorrelated rather than causal, which is indicated by the curved one-headed and two-headed arrows. The exception is the straight and one-headed arrows that indicate causal relationships between these and the dependent variable. Causal relationships signify statistical and logical relationships rather than observed causality. For instance, it is illogical to assume that children’s IQ influence their parents’ IQ (Loehlin, 2004). Analogically, it is illogical to assume that PISA math scores influence number of books at home, even though they are measured on the same day in the PISA wave (e.g., see OECD, 2017). These plausible relationships are illustrated in Figure 1.
The initial estimation model at the within-country level can be described as follows:
Here PISA is the PISA mathematics achievement among students s, XMigrantβ is the coefficient of migrants/non-migrants, XBookscβ is the coefficient of number of books at home, Xnon-cognitiveβ is the coefficient of non-cognitive abilities, and ec is an error term.
The estimation model at the cross-country level can be described as follows:
Here PISA is the average aggregated PISA achievement in country c, XNIQcβ is the coefficient of national IQ (NIQ) in country c, XPIAACcβ is the coefficient of teachers PIAAC scores in country c, XGDPCcβ is the coefficient of GDP PC, XDemocracycβ, XEthnic homogeneitycβ and Xschoolcβ are a set of school related control variables as well as other control variables, and ec is an error term.
Multicollinearity Diagnostics
To control for multicollinearity, Collinearity Diagnostics was carried through. The condition index generated by such an analysis implies that values over 30 indicate substantial multicollinearity. In addition, bivariate intercorrelations were conducted to further examine this potential issue. According to Dohoo, Ducrot, Donald and Hurnik (1997), multicollinearity may be present when the intercorrelations are below r = 0.90. Therefore, in the current study, independent variables that had “high” intercorrelations (r = 0.70–1.0) according to many of the threshold values presented by Akoglu (2018), were excluded. For example, teacher salaries and GDP PC were substantially intercorrelated (r = 0.757 in relation to both 2015 and 2018) and therefore not included in the same OLS model.
Results
PISA 2015 for Swedish 15-year-Olds
The regression coefficients, R2 and p-values are presented in Tables 4, 5. Table 4 shows that number of books at homes was positively associated with PISA math scores and that migration status was negatively associated with PISA math scores.
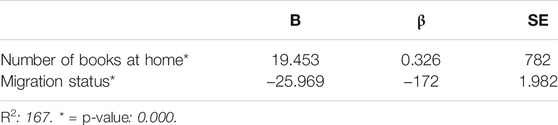
TABLE 4. Regression output PISA 2015 (individual level data).
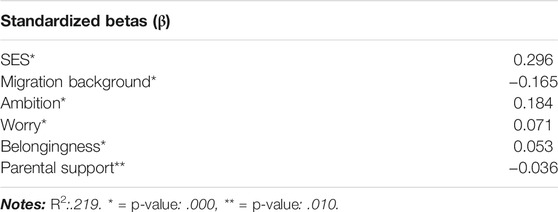
TABLE 5. Regression output PISA 2015 (individual level data)
Cross-National Level Correlations
The correlation between NIQ and PISA math was r = 0.583 (2018) and r = 0.576 (2015). The correlation between PIAAC scores and PISA math was r = 0.594 (2018) and r = 0.696 (2015). The correlation between annual teacher salaries and PISA scores was r = 0.452 (2015) and r = 0.426 (2018). These signify moderate to strong effect sizes in related disciplines such as psychology and political sciences (Akoglu, 2018).
The correlation between annual instruction time and PISA scores was r = -0.193 (2015) and r = -0.267 (2018). The correlation between annual instruction days and PISA scores was r = 0.166 (2015) and r = 0.106 (2018) and thus poor. Class size was insignificantly positively correlated, r = 0.005 (2015) and insignificantly negatively correlated in 2018, r = -0.0.04. However, it should be noted that weak relationships (e.g., class size) at the cross-national level might yet imply advantages at the within country level such as Sweden (e.g., Fredriksson et al., 2013). The same goes for indicators of educational quantity such as annual instruction time (e.g., Andersen et al., 2016).
GDP per capita was positively correlated, r = 0.436, and democracy too (r = 0.194) in relation to PISA 2015. However, the GDP per capita was slightly weaker in relation to PISA 2018 (r = 0.404) and democracy less strongly correlated in relation to this survey (r = 0.100). Ethnic homogeneity had a weak relationship with PISA math 2015 (r = 0.006) and PISA math 2018 (r = -0.060).
Robustness Checks
To test the robustness at the individual student level (i.e., intranational level among Swedish PISA 2015 participants), the independent variables were regressed with a bootstrapped method (1,000 cases). In these analyses reading literacy scores were used instead of math scores, and all independent variables within the frames of the PISA data set (2015) were regressed to see if any other such could reach statistical significance. Moreover, a one-paired sample t-test which tests the significance for natives and immigrant differences in PISA math scores was conducted for the normally distributed data, but as these are typically sensitive to larger sample sizes (e.g., see Thorsen et al., 2021; Myrberg & Rosén, 2009) only was one such significance test was carried through. Moreover, this study is mostly concerned about inferential statistics. Furthermore, intra-class correlations (see Appendix A) for Swedish students and their specific school ID:s were conducted in order to see if there were any nested effects but these correlations were .000. Hence, the Swedish students could be regarded as separate entities.
At the cross-national level, the strongest predictor, PIAAC scores, were tested again but this time only numeracy scores were used as an alternative to the mixed pooled score for both numeracy and literacy (cf., Hanushek et al., 2019). However, this did not change the relationships substantially (i.e., the standardized beta coefficients). Moreover, data on NIQ, GDP per capita, democracy, and ethnic homogeneity were included for both some additional low-performers and high-performers in the PISA league tables (China, Taiwan, Kazakhstan, the Philippines) of the PISA 2018 wave and were tested in both bivariate (Pearson’s r) and OLS models. These results are provided in Supplementary Appendix SA.
Conclusion and Discussion
This study set out to answer three research questions related to what factors are associated with high achievement in PISA 2015 and 2018 among Swedish students, if these patterns are similar at the cross-country level, and what other factors at the cross-country level are associated with differences in PISA math achievement.
At the within-country and individual level, native Swedish students who took the PISA test in 2015 outperformed first- and second-generation migrants. This is similar to school and municipality level studies on Swedish students such as Boman (2021a) who found that non-natives generally performed worse than natives, as well as for example Meunier (2011) in relation to PISA. Moreover, the latent SES “number of books at home” was associated with higher PISA math achievement. It does also confirm similar research on the relationship between SES and PIRLS achievement (Myrberg and Rosén, 2009; see also; Tan, 2015) and SES in relation to PISA science achievement (Reimer et al., 2018). Some of the ambition indicators (e.g., “I want to be one of the best students in my class”) were associated with a higher PISA math score whereas others were not (e.g., “I want to be the best, no matter what I do”). The latter indicator might be tied to a counterproductive level of overconfidence whereas the former is more balanced and appropriate (e.g., see Cheung, 2017 for a discussion). The same pattern was discerned for the belongingness indicators. The picture was also a bit fuzzy as regards the different indicators of parental support, which in part constitutes a proxy of SES.
At the cross-country level, GDP per capita was associated with higher PISA scores. However, ethnic homogeneity was not substantially associated with higher scores. NIQ scores, PIAAC scores and teacher salaries were also moderately correlated with PISA math scores, which corroborates earlier research such as Rindermann (2007; 2018), Hanushek et al. (2019), and Flores-Mendoza et al. (2021). This implies that a country with high cognitive ability level, as well as cognitively competent and well-paid teachers are likely to perform better in large-scale international assessments such as PISA. Thus, to merely add more school days and/or annual instruction time does not seem to be a solution to lower performance levels, ceteris paribus. When students within the same country are compared at the individual level, it is a “comparative advantage” (see Boman, 2020) to be a native and have parents with a level of higher socioeconomic status, as well as well-developed non-cognitive abilities such as a balanced degree of ambition.
This study has several limitations. Because of the cross-sectional design, the evidence is almost entirely correlational. The same goes for the relatively small number of countries included at the cross-national level (N = 31). For example, the inclusion of two high cognitive ability level and high PISA math achievement level countries such as Taiwan and China and two with lower scores on these two measures (Kazakhstan, The Philippines), leads to a higher correlation between NIQ and PISA math (e.g., r = 0.629 in PISA 2018). Similarly, the PISA math–ethnic homogeneity relationship increases to r = 0.215 when these four PISA 2018 participants are included.
Furthermore, despite the efforts made by Lynn and Becker (2019) to weight and adjust scores from various IQ samples many of these appear somewhat unaligned with the PISA data in a temporal sense, as well as with regard to the mean and median ages within those various samples (i.e., many of the samples include both small children and adults). Nonetheless, the combination of individual data at the intranational level as well as aggregated data at the cross-national level can provide a more comprehensive picture of PISA performance among specific countries such as Sweden. Focusing merely on a single level tends to neglect important factors such as SES and migration (at the intranational level) and cognitive ability and teacher variables (at the cross-national level).
Moreover, some may notice the exclusion of gender variables because it is clearly understood that girls outperform boys in PISA reading and science but typically not in mathematics (e.g., Ma, 2008). However, these differences are smaller than the native/immigrant differences, boys are typically stronger in math and the current study is concerned about math achievement, and these differences are difficult to capture in a meaningful way with aggregated cross-country data (at least with the current research design). Hence, the inclusion of gender at the within-country level but the exclusion at the between-country level would likely lead to even more discrepancies between these two levels of analysis.
As is noticeable in several tables in this article, the explained variance in PISA math is greater at the aggregated cross-country level compared to the individual student and within-country level. This might be related to the lack of appropriate non-cognitive ability variables and items and the total exclusion of cognitive ability variables and items within the frames of the student questionnaire and related student tasks. Hence, the inclusion of two brief tests, one non-cognitive test (e.g., Big Five-10, see Rammstedt and John, 2007) and one cognitive (e.g., the Kaufmann Brief Intelligence Test) may explain the variance to a greater extent than which is currently the case. Some personality researchers have stressed that adolescents and older children may have trouble to understand and asses their own personalities (e.g., see Andersen et al., 2020) to the same extent as university students. However, these few Big Five items seem not more difficult to grasp than the PISA items (c.f., Rammstedt and John, 2007, and the PISA 2015 Student Questionnaire). Furthermore, complete cross-national data on all PISA participants and not just OECD countries would lead to more comprehensive and reliable estimates of the cross-national, aggregated effect sizes (e.g., see OECD, 2018b).
Overall, the current article contributes to research on Swedish students’ PISA performance and replicates relationships that are found at the aggregated within-country level in regard to SES, teacher competence, and migration background (e.g., Boman, 2021a) but adds other variables such as cognitive and non-cognitive abilities which likewise are associated with PISA math achievement. Future research may use a similar theoretical and methodological approach but in relation to other countries or later PISA waves with regard to Sweden.
Data Availability Statement
The original contributions presented in the study are included in the article/Supplementary Material, further inquiries can be directed to the corresponding author.
Author Contributions
The author confirms being the sole contributor of this work and has approved it for publication.
Conflict of Interest
The author declares that the research was conducted in the absence of any commercial or financial relationships that could be construed as a potential conflict of interest.
Publisher’s Note
All claims expressed in this article are solely those of the authors and do not necessarily represent those of their affiliated organizations, or those of the publisher, the editors, and the reviewers. Any product that may be evaluated in this article, or claim that may be made by its manufacturer, is not guaranteed or endorsed by the publisher.
Supplementary Material
The Supplementary Material for this article can be found online at: https://www.frontiersin.org/articles/10.3389/feduc.2021.753347/full#supplementary-material
References
Akoglu, H. (2018). User's Guide to Correlation Coefficients. Turk J. Emerg. Med. 18 (3), 91–93. doi:10.1016/j.tjem.2018.08.001
Alverson, J. (2014). A Model of Hopelessness, Belongingness, Engagement, and Academic Achievement. Ph.D. dissertation, Tuscaloosa: University of Alabama.
Andersen, S. C., Calmar, M., Humlum, K., Brink Nandrup, A., Humlum, M. K., and Nandrup, A. B. (2016). Increasing Instruction Time in School Does Increase Learning. Proc. Natl. Acad. Sci. U S A. 113 (27), 7481–7484. doi:10.1073/pnas.1516686113
Andersen, S. C., Gensowski, M., Ludeke, S., John, O., Gensowski, M., Ludeke, S. G., et al. (2020). A Stable Relationship between Personality and Academic Performance from Childhood through Adolescence. An Original Study and Replication in Hundred-Thousand-Person Samples. J. Pers 88 (5), 925–939. doi:10.1111/jopy.12538
Azzaloni, D., Schnell, P., and Palmer, J. R. (2012). Educational Achievement Gaps between Immigrant and Native Students in Two “New” Immigration Countries: Italy and Spain in Comparison. ANNALS Am. Acad. Polit. Soc. Sci. 643 (1), 46–77.
Björklund, A., Fredriksson, P., Gustafsson, J-E., and Öckert, B. (2010). Den Svenska Utbildningspolitikens Arbetsmarknadseffekter. Vad Säger Forskningen. Retrieved from: https://www.ifau.se/globalassets/pdf/se/2010/r1013-den-svenska-utbildningspolitikens-arbetsmarknadseffekter-vad-sager-forskningen.pdf (Accessed January 7, 2022).
Boman, B. (2021a). Regional Differences in Educational Achievement Among Swedish Grade 9 Students. Scand. J. Educ. Res. doi:10.1080/00313831.2021.1897880
Boman, B. (2021b). Parallelization: the fourth leg of cultural globalization theory. Integrative Psychological and Behavioral Science, 55 (2), 354–370.
Boman, B. (2020). What Makes Estonia and Singapore So Good. Globalisation, Societies Edu. 18 (2), 181–193. doi:10.1080/14767724.2019.1701420
Borghans, L., Golsteyn, B., Heckman, J., and Humphries, J. (2016). What Achievement Tests Measure. Proc. Natl. Acad. Sci. United States America 51 (3), 13355–13359.
Burhan, N. A. S., Yunus, M. Md., Tovar, M. E. L., Yunus, M. M., Tovar, M. E. L., Burhan, N. M. G., et al. (2017). Why Are Cognitive Abilities of Children So Different across Countries? the Link between Major Socioeconomic Factors and PISA Test Scores. Personal. Individual Differences 105 (January), 95–106. doi:10.1016/j.paid.2016.09.043
Cheung, K.-C. (2017). The Effects of Resilience in Learning Variables on Mathematical Literacy Performance: A Study of Learning Characteristics of the Academic Resilient and Advantaged Low Achievers in Shanghai, Singapore, Hong Kong, Taiwan and Korea. Edu. Psychol. 37 (6), 965–982.
Colom, R., and Flores-Mendoza, C. E. (2007). Intelligence Predicts Scholastic Achievement Irrespective Of SES Factors: Evidence From Brazil. Intelligence 35 (3), 243–251.
Conard, M. A. (2006). Aptitude Is Not Enough: How Personality and Behavior Predict Academic Performance. J. Res. Personal. 40 (3), 339–346. doi:10.1016/j.jrp.2004.10.003
Deary, I., Strand, S., Smith, P., and Fernandes, C. (2007). Intelligence And Educational Achievement. Intelligence 35 (1), 13–21.
Dohoo, I. R., Ducrot, C., Donald, A., Hurnik, D., Ducrot, C., Fourichon, C., et al. (1997). An Overview of Techniques for Dealing with Large Numbers of Independent Variables in Epidemiologic Studies. Prev. Vet. Med. 29 (3), 221–239. doi:10.1016/s0167-5877(96)01074-4
Duckworth, A. L., Seligman, M., and Seligman, M. E. (2005). Self-discipline Outdoes IQ in Predicting Academic Performance of Adolescents. Psychol. Sci. 16 (1), 939–944. doi:10.1111/j.1467-9280.2005.01641.x
Falk, A., Kosse, F., Kosse, F., Pinger, P., Schildberg-Hörisch, H., Deckers, T., et al. (2021). Socioeconomic Status and Inequalities in Children's IQ and Economic Preferences. J. Polit. Economy 129 (9), 2504–2545. doi:10.1086/714992
Flores-Mendoza, C. A., Gallegos, R., and Reategui-Colareta, M. (2021). General Intelligence andSocioeconomic Status as Strong Predictors of Student Performance in Latin American SchoolsEvidence from PISA Items. Front. Edu.
Fredriksson, P., Öckert, B., Oesterbeek, H., Öckert, B., and Oosterbeek, H. (2013). Long-Term Effects of Class Size *. Q. J. Econ. 128 (1), 249–285. doi:10.1093/qje/qjs048
Guglielmi, S., and Brekke, N. (2017). A Framework for Understanding Cross-National and Cross-Ethnic Gaps in Math and Science Achievement. Comp. Edu. Rev. 61 (1), 176–231. doi:10.1086/689656
Gustafsson, J.-E. (2008). Effects of International Comparative Studies on Educational Quality on the Quality of Educational Research. Eur. Educ. Res. J. 7 (1), 1–17. doi:10.2304/eerj.2008.7.1.1
Gustafsson, J.-E. (2016). Lasting Effects of Quality of Schooling: Evidence from PISA and PIAA Intelligence, 57, 66–72.
Gustafsson, J.-E. (2007). “Understanding Causal Influences on Educational Achievement through Analysis of Differences over Time within Countries,” in Lessons Learned. What International Assessments Tell Us about Math Achievement. Editor T. Loveless (New York: Brookings Institution Press).
Gustafsson, J.-E., and Yang Hansen, K. (2018). Changes in the Impact of Family Education on Student Educational Achievement in Sweden 1988–2014. Scand. J. Educ. Res. 62, 719–736. doi:10.1080/00313831.2017.1306799
Hanushek, E. A., Piopiunik, M., Wiederhold, S., Piopiunik, M., and Wiederhold, S. (2019). The Value of Smarter Teachers. J. Hum. Resour. 54 (4), 857–899. doi:10.3368/jhr.54.4.0317.8619r1
Hanushek, E. A., Rivkin, S. G., Taylor, L. L., Rivkin, S. G., and Taylor, L. L. (1996). Aggregation and the Estimated Effects of School Resources. Rev. Econ. Stat. 78 (4), 611–627. doi:10.2307/2109949
Holmlund, H., Sjögren, A., and Öckert, B. (2019). SOU, Jämlikhet I Möjligheter Och Utfall I Den Svenska Skolan. Bilaga 7 till Långtidsutredningen 2019. Retrieved from https://www.regeringen.se/4adad2/contentassets/23c13d7ae0ef48e4bed43b68917573d3/jamlikhet-imojligheter-och-utfall-i-den-svenska-skolan-sou-201940.pdf (Accessed January 7, 2022).
Huang, J., Tang, Y., He, W., Tang, Y., He, W., Li, Q., et al. (2019). Singapore's School Excellence Model and Student Learning: Evidence from PISA 2012 and TALIS 2013. Asia Pac. J. Edu. 39 (1), 96–112. doi:10.1080/02188791.2019.1575185
IMF GDP Per Capita , Current Prices. Washington. https://www.imf.org/external/datamapper/NGDPDPC@WEO/OEMDC/ADVEC/WEOWORLD (Accessed January 7, 2022).
Jerrim, J., Micklewright, J., Heine, J-H., Salzer, C., Micklewright, J., Heine, J.-H., et al. (2018). PISA 2015: How Big Is the 'mode Effect' and what Has Been Done about it. Oxford Rev. Edu. 44 (4), 476–493. doi:10.1080/03054985.2018.1430025
Jerrim, J. (2015). Why Do East Asian Children Perform So Well in PISA? an Investigation of Western-Born Children of East Asian Descent. Oxford Rev. Edu. 41 (3), 310–333. doi:10.1080/03054985.2015.1028525
Kim, S. w., Cho, H., Kim, L. Y., Cho, H., and Kim, L. Y. (2019). Socioeconomic Status and Academic Outcomes in Developing Countries: a Meta-Analysis. Rev. Educ. Res. 89 (6), 875–916. doi:10.3102/0034654319877155
Loehlin, J. C. (2004). Latent Variable Models. An Introduction to Factor, Path and Structural Analysis. 4th ed. Mahwah: NJ Erlbaum.
Lynn, R., and Becker, D. (2019). The Intelligence of Nations. London, UK: Ulster Institute for Social Research.
Lynn, R., and Vanhanen, T. (2012). Intelligence: A Unifying Construct for the Social Sciences. Ulster: Ulster Institute for Social Research.
Ma, X. (2008). Within‐School Gender Gaps in Reading, Mathematics, and Science Literacy. Comp. Edu. Rev. 52, 437–460. doi:10.1086/588762
Malone, G. P., Pillow, D., Osman, A., Pillow, D. R., and Osman, A. (2012). The General Belongingness Scale (GBS): Assessing Achieved Belongingness. Personal. Individual Differences 52 (3), 311–316. doi:10.1016/j.paid.2011.10.027
Manhica, H., Berg, L., Berg, L., Almquist, Y. B., Rostila, M., Hjern, A., et al. (2018). Labour Market Participation Among Young Refugees in Sweden and the Potential of Education: a National Cohort Study. J. Youth Stud. 22 (4), 533–550. doi:10.1080/13676261.2018.1521952
Meunier, M. (2011). Immigration and Student Achievement: Evidence from Switzerland. Econ. Edu. Rev. 30 (1), 16–38. doi:10.1016/j.econedurev.2010.06.017
Moon, K. H. S. (2015). South Korea’s Demographic Changes and Their Political Impact. East Asia Policy Paper. Washington: Center for East Asia policy studies at Brookings, 6.
Myrberg, E., and Rosén, M. (2009). Direct and Indirect Effects of Parents' Education on reading Achievement Among Third Graders in Sweden. Br. J. Educ. Psychol. 79 (4), 695–711. doi:10.1348/000709909X453031
OECD(2009). PISA Data Analysis Manual. https://www.oecd-ilibrary.org/docserver/9789264056275-en.pdf?expires=1640625956&id=id&accname=ocid195437a&checksum=F578CC594B2011913AFF4F0C3CF3EA97.
OECD (2018b). Education at a Glance. Retrieved from: https://www.oecd-ilibrary.org/docserver/eag-2018-en.pdf?expires=1628000202&id=id&accname=ocid195437a&checksum=FD776E8DA66F3D7AFAD9ACDEF2CE26D3 (Accessed January 7, 2022).
OECD (2018a). PISA 2015 Results in Focus. Retrieved from: https://www.oecd.org/pisa/pisa-2015results-in-focus.pdf (Accessed January 7, 2022).
OECD (2017). PISA 2015 Technical Report. Retrieved from: https://www.oecd.org/pisa/sitedocument/PISA-2015technical-report-final.pdf (Accessed January 7, 2022).
OECD (2019a). PISA 2018 Results. Retrieved from https://www.oecd.org/pisa/Combined_Executive_Summaries_PISA_2018.pdf (Accessed January 7, 2022).
OECD (2019c). PISA 2018. Technical Report, Chapter 4. Sample. https://www.oecd.org/pisa/data/pisa2018technicalreport/PISA2018%20TecReport-Ch-04-SampleDesign.pdf (Accessed January 7, 2022).
OECD (2019b). Results from PISA 2018. Country Note: Sweden. Retrieved from: https://www.oecd.orgd/pisa/publications/PISA2018_CN_SWE.pdf (Accessed January 7, 2022).
Poropat, A. E. (2009). A Meta-Analysis of the Five-Factor Model of Personality and Academic Performance. Psychol. Bull. 135 (2), 322–338. doi:10.1037/a0014996
Prais, S. J. (2004). Cautions on OECD's Recent Educational Survey (PISA): Rejoinder to OECD's Response. Oxford Rev. Edu. 30 (4), 569–573. doi:10.1080/0305498042000303017
Rammstedt, B., and John, O. P. (2007). Measuring Personality in One Minute or Less: A 10-item Short Version of the Big Five Inventory in English and German. J. Res. Personal. 41, 203–212. doi:10.1016/j.jrp.2006.02.001
Reimer, D., Jensen, S. S., and Kjeldsen, C. (2018). Social Inequality in Student Performance in the Nordic Countries. in Northern Lights on TIMSS and PISA 2018 (Copenhagen: TeamNord), 31–60.
Rindermann, H. (2007). The g-factor of International Cognitive Ability Comparisons: The Homogeneity Of Results In PISA, TIMSS, PIRLS, And IQ-Tests Across Nations. Euro. J. Personal. 21 (5), 667–706.
Rindermann, H. (2018). Cognitive Capitalism. Human Capital and the Wellbeing of Nations. Cambridge: Cambridge University Press.
Rutkowski, L., and Rutkowski, D. (2016). A Call for a More Measured Approach to Reporting and Interpreting PISA Results. Educ. Res. 45 (4), 252–257. doi:10.3102/0013189x16649961
Salter, F. (2004). “Ethnic Diversity, Foreign Aid, Economic Growth, Population Policy, Welfare, Inequality, Conflict, and the Costs of Globalism: A Perspective on W. Mater’s and M. McMillan’sFindings,” in Welfare, Ethnicity And Altruism. Editor F. Salter (London: Frank Cass), 148–171.
Sirin, S. (2005). Socioeconomic Status and Academic Achievement: A Meta-Review of Research. Rev. Educ. Res., 75 (3), 417–453.
Sjøberg, S. (2015). PISA and Global Governance – a Critique of the Project, its Uses, and Implications. Eurasia J. Math. Sci. Techn. 11 (1), 111–127.
Skolverket, (2018). Curriculum for the Compulsory School, Preschool Class and School-age Educare. Stockholm.
Skolverket, (2016b). Invandringens Betydelse För Skolresultaten. https://www.skolverket.se/download/18.6bfaca41169863e6a65becf/1553966593126/pdf3604.pdf (Accessed January 7, 2022).
Skolverket, (2016a). PISA 2015. 15-åringars Kunskaper I Naturvetenskap, Läsförståelse Och Matematik. https://www.skolverket.se/getFile?file=3725 (Accessed January 7, 2022).
Skolverket, (2009). Vad Påverkar Resultaten I Svensk Grundskola? Kunskapsöversikt Om Betydelsen Av Olika Faktorer. Stockholm. https://www.skolverket.se/getFile?file=2260.
Sonnander, K., and Ramund, B. (2003). “Sweden,” in Culture and Children’s Intelligence. Cross-Cultural Analysis of the WISC-III. Editors J. Georgas, L. Weiss, van de Vijer, and F. Donald. Saklofske (AmsterdamNetherlands: Academic Press), 149–163.
Steiner-Khamsi, G. (2014). Cross-national Policy Borrowing: Understanding Reception and Translation. Asia Pac. J. Edu. 34 (2), 153–167. doi:10.1080/02188791.2013.875649
Sung, Y. (2011). Cultivating Borrowed Future: The Politics of Neoliberal Loanwords in South Korean Cross-National Policy Borrowing. Comp. Edu. 47 (4), 523–538. doi:10.1080/03050068.2011.555118
Tan, C. Y. (2015). The Contribution of Cultural Capital to Students’ Mathematics Achievement in Medium and High Socioeconomic Gradient Economies. Br. Educ. Res. J. 41 (6), 1050–1067. doi:10.1002/berj.3187
The Economist Intelligence Unit Democracy index, 2014 and 2017. Retrieved from: https://www.sudestada.com.uy/Content/Articles/421a313a-d58f-462e-9b24-2504a37f6b56/Democracy-index-2014.pdfhttps://pages.eiu.com/rs/753-RIQ-438/images/Democracy_Index_2017.pdf.
Thorsen, C., Yang Hansen, K., and Johansson, S. (2021). The Mechanisms of Interest and Perseverance in Predicting Achievement Among Academically Resilient and Non-resilient Students: Evidence from Swedish Longitudinal Data. Br. J. Educ. Psychol.. doi:10.1111/bjep.12431
Vogiazides, L., and Mondani, H. (2019). A Geographical Path to Integration? Exploring the Interplay between Regional Context and Labour Market Integration Among Refugees in Sweden. J. Ethnic Migration Stud. 46 (1), 23–45. doi:10.1080/1369183X.2019.1588717
Waldow, F., Takayama, K., and Sung, Y. (2014). Rethinking the Pattern of External Policy Referencing:Media Discourses over the ‘Asian Tigers’ PISA success in Australia, Germany and South Korea. Comp. Edu. 50 (3), 302–321. doi:10.1080/03050068.2013.860704
Wiklund, M. (2018). The Media Apparatus in the Becoming of Education Policy: Education media Discourse during Two Electoral Periods. J. Crit. Edu. Pol. Stud. 16 (2), 99–134.
World Factbook, . https://www.cia.gov/the-world-factbook/.
Keywords: Sweden, educational achievement, PISA, PIAAC, NIQ
Citation: Boman B (2022) PISA Achievement in Sweden From the Perspective of Both Individual Data and Aggregated Cross-Country Data. Front. Educ. 6:753347. doi: 10.3389/feduc.2021.753347
Received: 04 August 2021; Accepted: 27 December 2021;
Published: 10 February 2022.
Edited by:
Lu Wang, University of Georgia, United StatesReviewed by:
Chetan Sinha, O.P. Jindal Global University, Sonipat, IndiaFotini Polychroni, National and Kapodistrian University of Athens, Greece
Copyright © 2022 Boman. This is an open-access article distributed under the terms of the Creative Commons Attribution License (CC BY). The use, distribution or reproduction in other forums is permitted, provided the original author(s) and the copyright owner(s) are credited and that the original publication in this journal is cited, in accordance with accepted academic practice. No use, distribution or reproduction is permitted which does not comply with these terms.
*Correspondence: Björn Boman, Ympvcm4uYm9tYW5AZWR1LnN1LnNl