 Bruno Montibeller
 Jaak Jaagus
 Ülo Mander
 Evelyn Uuemaa
- Department of Geography, Institute of Ecology and Earth Sciences, University of Tartu, Tartu, Estonia
Shifts in climate driven by anthropogenic land use and land cover change are expected to alter various land–atmosphere interactions. Evapotranspiration (ET) is one of these processes and plays a fundamental role in the hydrologic cycle. Using gridded reanalysis and remote sensing data, we investigated the spatiotemporal trends of precipitation, temperature, and ET for areas in the Baltic countries Lithuania, Latvia and Estonia where the land cover type had not changed from 2000 to 2018. We focused on ET but investigated the spatiotemporal trends for the three variables at monthly, seasonal, and annual time scales during this period to quantify trade-offs among months and seasons. We used the Mann-Kendall test and Sen’s slope to calculate the trends and rate of change for the three variables. Although precipitation showed fewer statistically significant increasing and decreasing trends due to its high variability, temperature showed only increasing trends. The trends were concentrated in late spring (May, +0.14°C annually), summer (June and August, +0.10°C), and early autumn (September, +0.13°C). For unchanged forest and cropland areas, we found no statistically significant ET trends. However, Sen’s slope indicated increasing ET in April, May, June, and September for forest areas and in May and June for cropland. Our results indicate that during the study period, the temperature changes may have lengthened the growing season, which affected the ET patterns of forest and cropland areas. The results also provide important insights into the regional water balance and complement the findings of other studies.
Introduction
Changes in precipitation and temperature regimes differ among the world’s climatic regions. Previous studies have demonstrated changes or high variability in the patterns of two key climate variables, precipitation and temperature, in recent years in a range of climatic regions (Van den Besselaar et al., 2013; Silva Junior et al., 2018; Haghtalab et al., 2019; Krauskopf and Huth, 2020). The impact of these changes, which varies among the climatic regions, is exemplified by an increased number of extreme events, such as heat waves, intense rainfall, or long-term droughts (Sena et al., 2012). In addition, according to the Intergovernmental Panel on Climate Change (IPCC) (Seneviratne et al., 2012), the frequency and magnitude of these extreme events and the climate variability are expected to increase in the future.
Among the factors responsible for the changing climate, anthropogenic land use and land cover (LULC) change is a main factor (Pielke, 2005; Ceccherini et al., 2020; Sy and Quesada, 2020), and is having a stronger impact than was assumed in previous studies (Seneviratne et al., 2012). Depending on the extent and intensity of the LULC change, climate variables can be affected at local, regional, and global scales (Hale et al., 2006; Mahmood et al., 2014; Cao et al., 2015; Chen and Dirmeyer, 2017; Findell et al., 2017). In Eastern India, for instance, 25 to 50% of the overall temperature increase of ∼0.3°C from 1981 to 2010 could be explained by local LULC change (Gogoi et al., 2019). In the Amazon, Llopart et al. (2018) analyzed how the spread of deforestation affected the regional climate using simulated scenarios and climate models. They reported that deforestation caused a dipole pattern in response to the region’s precipitation, with increased precipitation in the eastern Amazon (+8.3%) and decreased precipitation in the west (−7.9%). At a global scale, Lawrence and Chase (2010) found that anthropogenic land cover change imposed a warming trend in the near surface atmosphere and reducing precipitation regionally, and both climate factors varied greatly between regions of the world.
In most cases, the impact of LULC change on climate results from changes in the biophysical and biogeochemical processes that regulate the complex land–atmosphere interactions (Pongratz et al., 2010; Alkama and Cescatti, 2016; Perugini et al., 2017). Evapotranspiration (ET) is one of the processes affected by climate and LULC change, and it plays an important role in balancing the hydrological cycle (Zhang et al., 2016). In temperate forest regions, for example, ET returns 71% of the precipitation to the atmosphere (Miralles et al., 2011). Using ET data derived from remote sensing or modeling, studies have been exploring the consequences of climate and LULC change on the dynamics of ET (Dias et al., 2015; Spera et al., 2016; Poon and Kinoshita, 2018; Paca et al., 2019; Qu and Zhuang, 2019; dos Santos et al., 2020). Wang et al. (2019) analyzed the spatiotemporal variability of ET over a Chinese catchment that has experienced strong climate and LULC changes. They found that the annual mean ET increased by nearly 14 mm as the result of a warming and drying trend combined with increasing areas of forest, grassland, water bodies, and urban land. Using a water-balance approach (i.e., the difference between precipitation and stream discharge) to estimate ET, Hamilton et al. (2018) found that ET is resilient in temperate humid catchments that have been experiencing climate and LULC change; that is, ET remained relatively stable. They attributed this resilience to field measurements that showed the ET rates did not differ greatly between rain-fed annual crops and perennial vegetation, and to the fact that these LULC types showed the biggest changes in area during the study period. However, this approach was limited because the ET was only calculated for the entire catchment and not independently for the different LULC types.
Even though several studies have provided spatiotemporal analysis of the combined effects of climate and LULC changes on ET (Mao et al., 2015; Li et al., 2017; Teuling et al., 2019), fewer studies have investigated the changes in ET in areas where LULC has not changed (Gaertner et al., 2019), where changes in ET are most likely driven by changes in climate variables. The limited number of studies that have investigated ET changes in areas where LULC has not changed, such as many forested areas, have reported different patterns for different climate regions. For semi-deciduous tropical forests, Vourlitis et al. (2014) showed that ET has decreased, whereas for temperate forests, Gaertner et al., 2019) reported that ET increased due to the longer growing season. Most of these studies evaluated annual ET changes, and restricted the assessment of the trade-offs between monthly and seasonal time scales (e.g., increasing ET in spring can be offset by an ET decrease in summer). Moreover, the studies did not account simultaneously for spatial variation and changes over time. Therefore, they did not produce a clear understanding on how ET changes spatially and temporally at different time scales (e.g., monthly, seasonally, and annually) in areas with stable LULC. Studies of ET in this context of stability are important because they help us to understand how stable LULC types such as forest and agricultural areas have been adapting to the new climate conditions and reveal the importance of these areas as a long-term solution to minimize climate change by stabilizing water cycles and sequestering carbon (Funk et al., 2019).
Given the abovementioned limitations of existing research and the lack of understanding of how ET rates change spatially and temporally at large scales, we designed the present study to investigate the changes in ET over areas with stable forest and cropland areas. We focused our analysis on three Baltic countries (Estonia, Latvia, and Lithuania). We used a newly developed gap-filled ET remote sensing dataset (Running et al., 2019) that provided data from 2000 to 2018. We chose these countries because the region has seen a clear shift in its climate from 1951 to 2015, with gradual warming and a slight trend of increasing precipitation (Jaagus et al., 2017). In addition, most of the region has not shown significant LULC changes during the study period, and no similar study has been performed in these three countries.
We defined unchanged forest as areas that showed no significant disturbance caused by anthropogenic activities such as clear-cut or selective logging during the study period. We defined unchanged cropland as cultivated land that remained cultivated throughout the study period but did not consider the effects of crop changes (e.g., from winter wheat to corn) to represent an LULC change. We chose forest and cropland areas for our analysis because these LULC types cover the majority of Estonia, Latvia, and Lithuania, and both types show large continuous patches of unchanged LULC. We also explored the spatiotemporal patterns of the two key factors that affect ET (i.e., precipitation and temperature) using gridded reanalysis data to better understand the driving forces for the changes in ET.
We posed two questions: (i) What are the spatial and temporal patterns of temperature, precipitation, and ET throughout the Baltic countries? (ii) How has ET of unchanged forest and cropland areas changed in this region? We hypothesized that even though the region has not experienced intense LULC change since 2000, the overall ET rates of forest and croplands have changed to adapt to the observed shifts in the climate regime in response to large-scale atmospheric circulation patterns (Jaagus et al., 2003). Note that although climate change is the terminology adopted by most similar studies, we decided to use the term climate shift because our study period is shorter than the period (at least 30 years) recommended for climate change studies (Seneviratne et al., 2012).
Materials and Methods
Study Area
The study area encompasses 175 × 103 km2 of the three Baltic countries in north-eastern Europe. The region’s climate is characterized as humid continental Dfb according to the Köppen climate classification, with mean annual temperature ranging between 5.5 and 6.5°C and mean annual precipitation ranging between 600 and 750 mm. In the westernmost part of the study region, which lies on the coast of the Baltic Sea, winters are much milder and the Köppen climate type changes to Cfb. However, parts of the region have shown shifts in the precipitation and temperature trends. The precipitation has increased during the cold months of the year (November to March) and in June, but the annual mean temperature has increased by 0.3 to 0.4 K per decade from 1951 to 2015 (Jaagus et al., 2017).
Data
Precipitation and Temperature Data
We used the gridded daily precipitation and daily mean temperature products from version v20.0e of the European Climate Assessment and Dataset, which is called E-OBS (Cornes et al., 2018). E-OBS was developed by interpolating climate data between weather stations based on data provided by the national meteorological agencies of the European countries. The product is available as a regular grid with a resolution of 0.1 or 0.25°, and covers the period since 1950. We used the 0.1°-resolution dataset, which represents a resolution of about 10 km. E-OBS has been applied in climate monitoring studies (Nastos et al., 2013; Van Der Schrier et al., 2013) and for validation of climate products (Katsanos et al., 2016; Domínguez-Castro et al., 2020). The reported shortcoming of this dataset is the uneven distribution of weather stations, which compromises the interpolation of E-OBS precipitation and temperature estimates (Hofstra et al., 2010). However, this limitation is less problematic in our study region, which has a higher weather station density (Navarro et al., 2019) than in other areas of Europe.
Even though the E-OBS grid was developed from national quality-controlled data, we checked for potential errors (e.g., missing or extreme low and high values) in the gridded precipitation and temperature datasets. We found no errors. To perform our analysis, we aggregated the gridded 0.1° daily precipitation and temperature data into monthly, seasonal, and annual temporal scales. We defined the seasons using the standard periods used for northern hemisphere climatology (Jaagus et al., 2017), with spring comprising March, April, and May; summer, June, July and August; autumn, September, October, and November; and winter, December, January, and February. For precipitation, we summed all total daily values for each month, season, and year, but for temperature, we calculated the mean for each temporal scale.
Evapotranspiration Data
To perform the ET analysis, we used the relatively recently developed MODIS MOD16A2GF product that comprises gap-filled 8-day composite images produced at 0.00416° pixel resolution (∼500 m) (Running et al., 2019). The gap-filled data is generated by mainly removing contaminated FPAR/LAI input data. For the cases where the pixel of FPAR/LAI pixels did not meet the quality criteria, the value is determined by linear interpolation between the previous period’s value (Running et al., 2019). The MODIS ET pixels represent the sum of ET (kg/m2) for 8-day periods. The product is an improvement of the MOD16A2 product that eliminates poor-quality pixels (e.g., pixels contaminated by cloud cover or aerosols). The MOD16A2 product provides almost real time estimates of ET using the Penman-Monteith equation, and has been used in several studies (Spera et al., 2016; Moura et al., 2019). We acquired 8-day composite MOD16A2GF images from January 2000 until December 2018.
Before analysis, we removed MODIS ET pixels with values ranging from 32,761 to 32,767 by assigning those values of NoData (the coding used by the R and QGis software). These pixels are flagged in the original dataset as non-vegetated areas, and therefore, no ET rate was calculated (Running et al., 2019). Moreover, we removed all pixels that showed negative values. In this way, we only used pixels that had plausible values during the entire period of analysis (2000 to 2018). Because of the pixel-removal process, our ET analysis covered 70% of the total Baltic countries territory (∼120 × 103 km2). To retrieve the monthly ET rates, we calculated the mean of the 8-day composites images within the respective month for each pixel. The mean value was then divided by eight to obtain daily values, which were finally multiplied by the number of days of each month. We used this approach to retrieve the monthly ET rates because April, May, October, and November had different number of 8-day composite images in leap years. The seasonal and annual ET rates were calculated by aggregating the monthly values. We did not analyze the winter season for four reasons: (i) No data was available in January and February of 2016. (ii) The winter months of other years showed many pixels with negative values, and this would have resulted in the exclusion of a large number of pixels since we worked only with pixels that had plausible values for the whole period. (iii) ET rates in winter are low and the values are negligible, therefore studies have mainly used only the months of the growing season (Gaertner et al., 2019; Niu et al., 2019; Ruiz-Pérez and Vico, 2020). (iv) The ET analysis was not stratified by forest type and as deciduous and evergreen forest are present in the region, the ET rates analysis would be bias since some forest types loses or maintain the leaves. Although the original unit for the ET rates was kg/m2, we decided to convert this to mm (at a rate of 1 kg/m2 for 1 mm), to align with the units used in previous studies.
Land Use and Land Cover Data
For LULC data, we used version 2.0.7 of the (CCI Land Cover product1). This product consists of annual time series of consistent global land cover maps with 300-m spatial resolution from 1992 to 2018. We used the product data from 2000, 2005, 2010, 2015, and 2018. For 2018, we used version 2.1.1 of the product, which is consistent with v2.0.7. The advantage of the newer dataset is its consistency over time. We reclassified the original 22 LULC types into 6 main classes based on the IPCC class definitions (ESA, 2017 Land Cover CCI Product user guide version 2.0, 2017) (Supplementary Table 1). The final LULC types were cropland, forest, grassland, urban, wetland, and other. We identified the pixels of forest and cropland that remained as these classes throughout the study period to extract the unchanged forest and cropland areas. The map was only created for forest and cropland because these two LULC types covered more than 87% of the entire study region. Moreover, these LULC types also showed large continuous areas in which the LULC did not change, unlike in the other LULC types, and this lets us test our research hypothesis.
Analysis
First, we examined the monthly, seasonal, and annual spatial and temporal trends for temperature and precipitation for the entire region using the E-OBS data, and the MOD16A2GF data for ET. We examined the trends at a pixel level, with a spatial resolution of 0.00416°. Second, we assessed the monthly, seasonal, and annual ET for unchanged forest and cropland areas using the MOD16A2GF data. We used the Mann-Kendall test to detect significant increasing or decreasing trends.
Spatial Analysis
To analyze ET over forested and cropland areas, we calculated the vegetation cover of forest and cropland within the MODIS ET pixels that were overlapped by these LULC types. The MODIS ET pixels were defined as forest or cropland pixels if, during the entire study period, these LULC types covered >50% of the pixel area. The MODIS pixels that showed <50% of its area as forest or cropland during the study period were considered to have changed, and were excluded from this analysis. In this way, we could investigate the MODIS ET pixels that showed a decrease, increase, or no trend during the study period for areas that had forest or cropland as the major (>50%) LULC type.
To obtain the most representative ET values for unchanged forested and cropland areas, we created a buffer that extended 1 km inward from the edge of the unchanged area and extracted only those pixels that were completely within the unchanged area. This removed the potential bias due to the edge effect for the border pixels. After these procedures, we retrieved 15,359 pixels of forest and 899 pixels of croplands as the most representative MODIS ET pixels of these LULC types. We averaged the monthly, seasonal and annual ET values of these pixels for the trend analysis.
Trend Analysis
We used the non-parametric Mann-Kendall test (Mann, 1945; Kendall, 1957; Khambhammettu, 2005) to identify pixels with significant temporal trends (significant increase or decrease, or no significant trend) for the three variables (precipitation, temperature, and ET). The Mann-Kendall test has been widely applied for trend analysis of time series of meteorological (Jaagus, 2006; Almeida et al., 2017; Atta-ur and Dawood, 2017) and hydrological data (Hamed, 2008; Dinpashoh et al., 2011; Jaagus et al., 2017). However, the Mann-Kendall test has been shown to be sensitive to autocorrelation in the input data (Kumar et al., 2009). Therefore, before applying the Mann-Kendall test, we calculated the lag 1 coefficient of correlation test for serial correlation (Bari et al., 2016; Gao et al., 2020) in the time series of precipitation, temperature and ET for all time scales of the analysis. The calculation indicated that an average of <3% of all pixels analyzed showed significant autocorrelation in all-time series. Thus, we decided not to apply any correction and to use the Mann-Kendall test on the original data. We used a confidence level of 95% to define significant decreases and increases in the time series for each pixel (p < 0.05).
To estimate the magnitude of the trend, we used the non-parametric Sen’s slope value (SS) method (Sen, 1968). The magnitude of the change is given by the median slope value for all pairwise points in the time series. Negative values of SS indicate a decreasing trend, whereas positive slopes indicate an increase. To calculate the Mann-Kendall trend and SSs, we used the package “wql” (Jassby and Cloern, 2017) implemented in version 3.6.1 of the R software. We calculated the trends as well as the SS values for all pixels at monthly, seasonal, and annual scales. We calculated SS values even for those pixels that did not show significant trends according to MK test.
Results
Land Use and Land Cover Change
In 2000, 53.1% of the Baltic countries were covered by forest, followed by cropland (36.7%) and grassland (5.2%) (Supplementary Table 2). Urban, wetland and other land together totaled 5.0% of the region (Supplementary Table 2). By 2018, forest area had decreased by 0.4% and cropland had increased by 0.4% (Supplementary Table 2). Although the total change in the area of LULC types was negligible, the changes of areas of cropland and forest to other classes were noticeable (Figure 1). For example, 2,532.1 km2 of forest was converted into cropland and 801 km2 into grassland from 2000 to 2018. At the same time 2,300.8 km2 of cropland was converted into forest (Figure 1). Despite these changes, 72.8% of the forest area and 73.2% of the cropland area in 2000 remained completely unchanged throughout the study period (Supplementary Table 3).
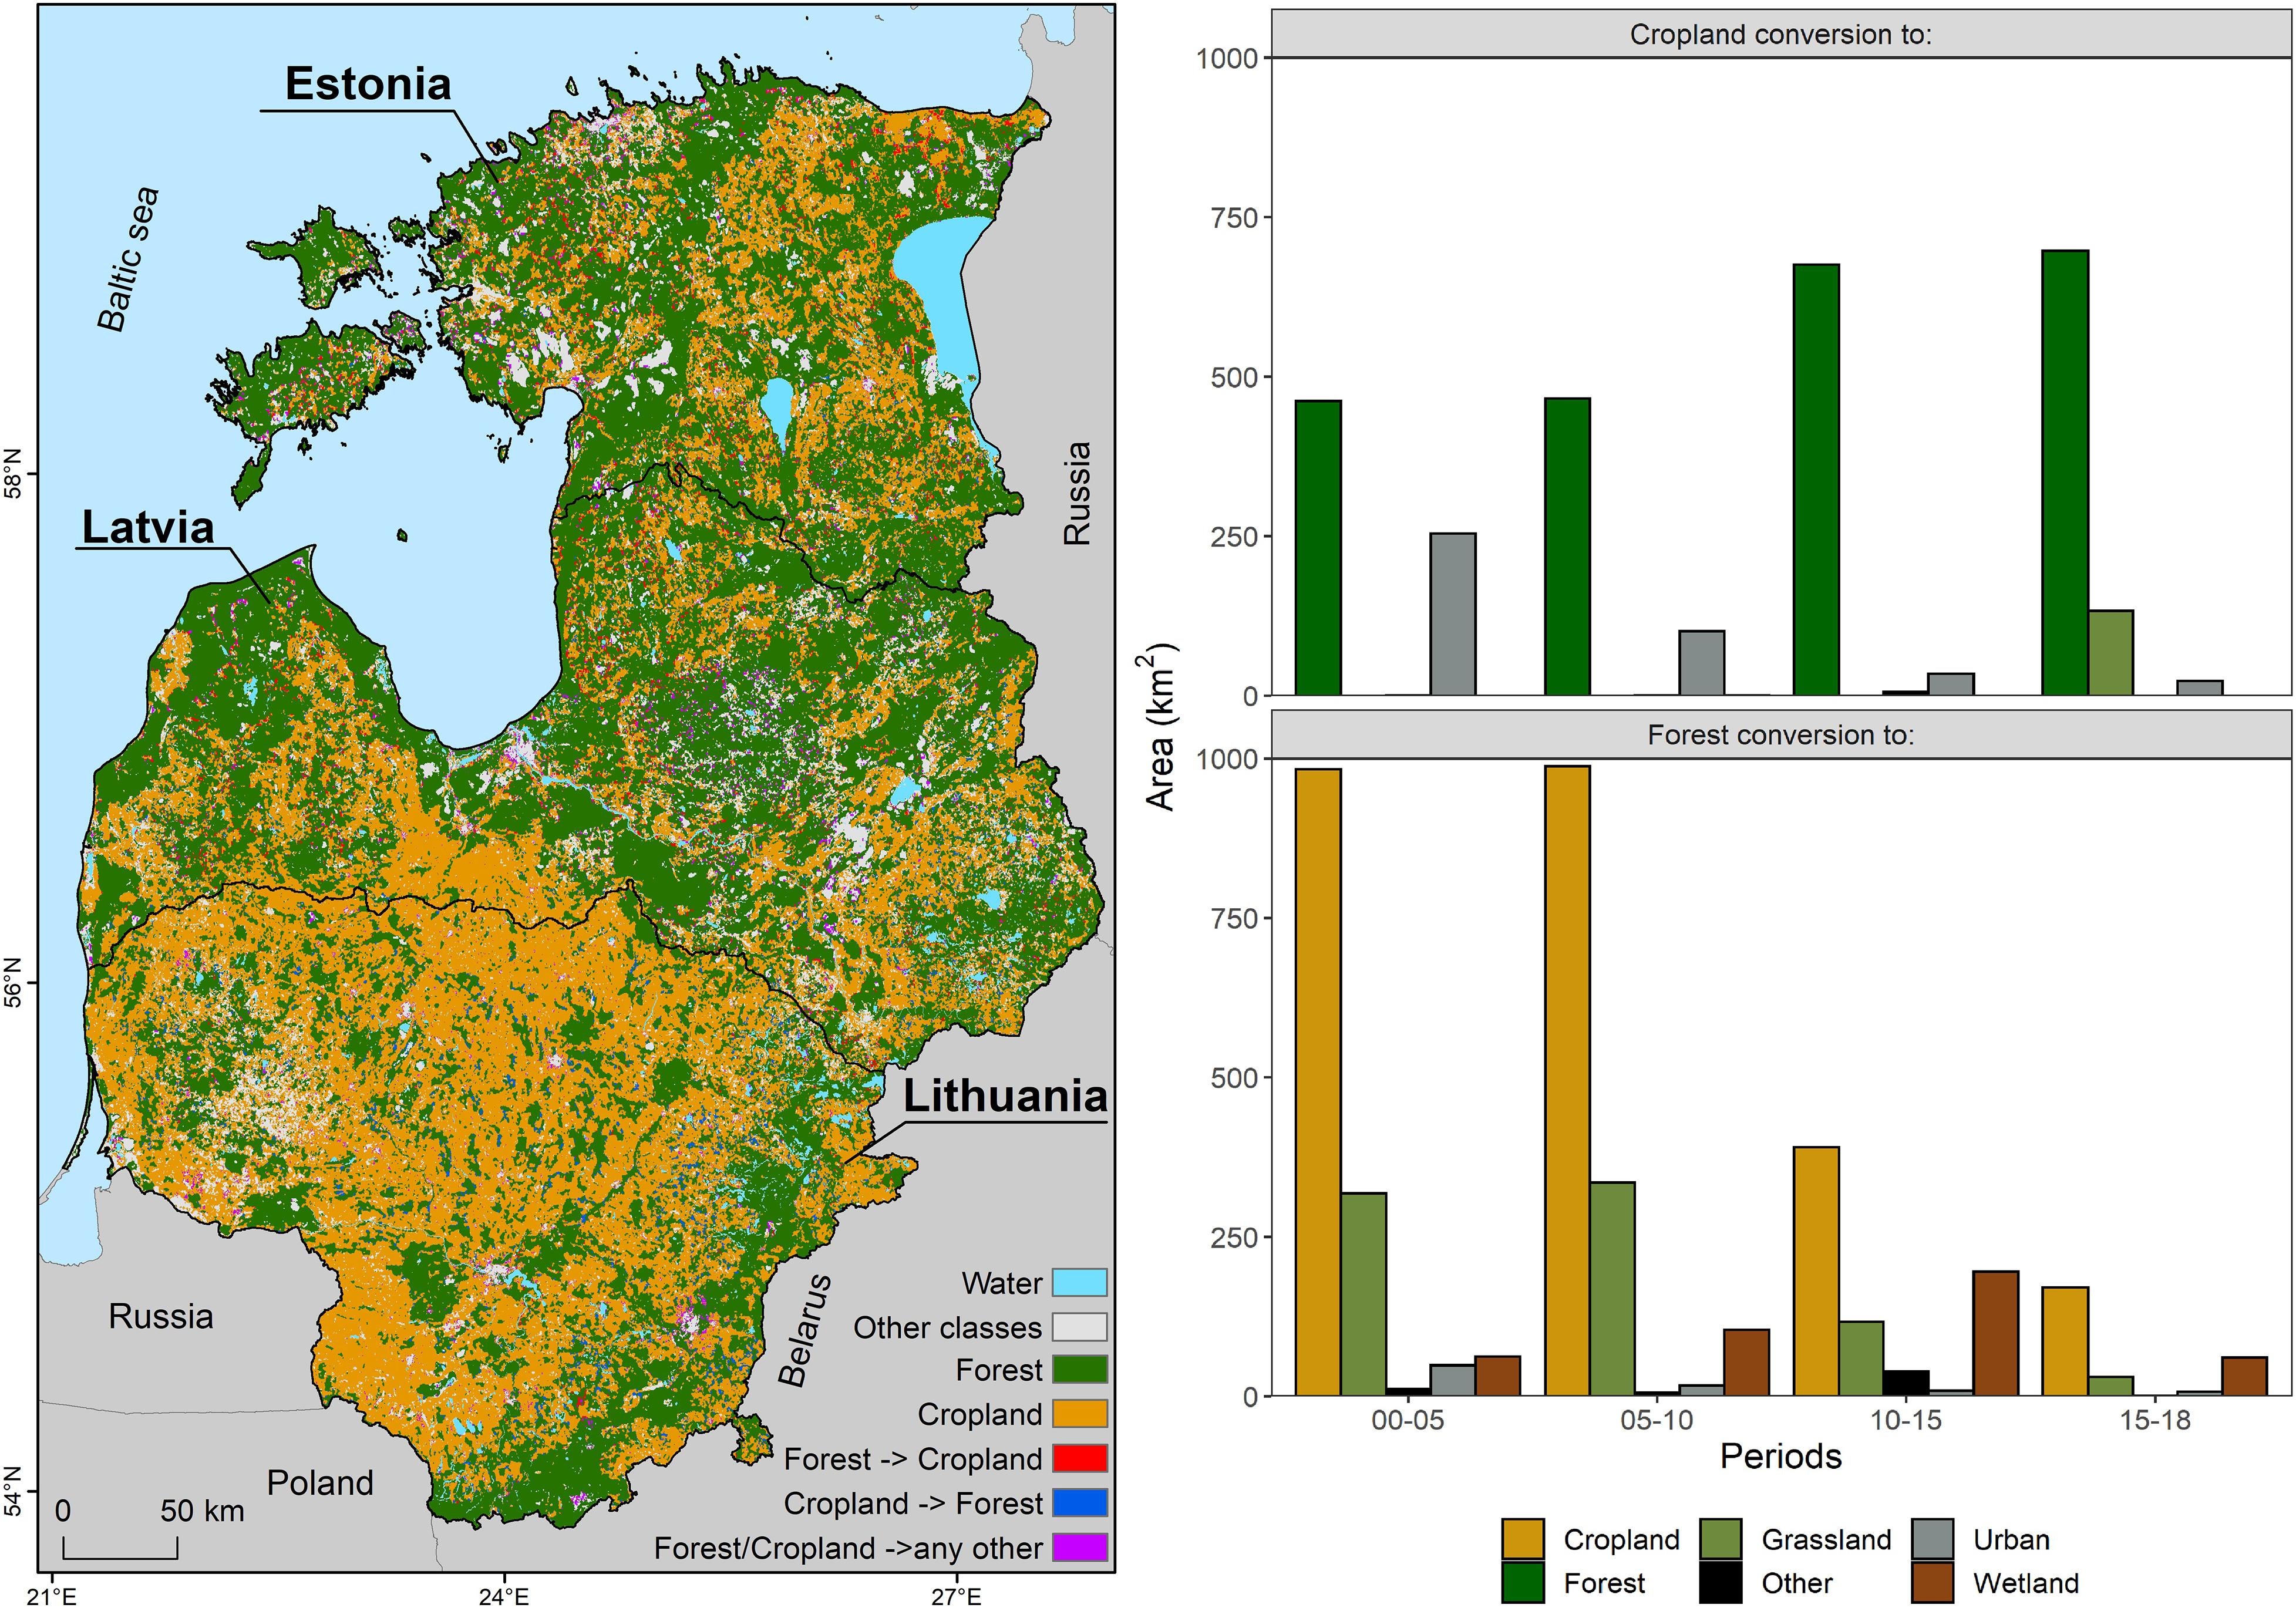
Figure 1. Changes in the areas of forest and cropland in the Baltic countries from 2000 to 2018.
Spatiotemporal Precipitation Analysis
Our spatial and temporal analyses of the monthly precipitation at a pixel level indicated that half of the months showed no significant trend in the 2,557 pixels analyzed between 2000 and 2018 (Figure 2A). April, September, and December showed a significant increase in 13.6, 3.1, and 8.1% of the total pixels (Supplementary Table 4), respectively. March, June, and July presented significant decreasing trends in a small proportion of the pixels (0.8, 1.4, and 0.2% of the total, respectively). Spatially, it is interesting to note that the pixels with the significant decreasing trend were mainly concentrated in the south-west of Lithuania (in March and June), whereas the increase in precipitation was not only in the south and southwest of Lithuania and Latvia but also in the northeast of Estonia (Figure 2A). The SS values (Figure 2B) revealed the magnitude of the change for the pixels with a significant trend (p < 0.05) and without a significant trend (p > 0.05). September showed an average SS value of 2.37 ± 0.29 mm per year (mean ± SD) for the pixels with a significant increase, for a total increase of 45 mm per pixel for the whole study period. The pixels with an increasing trend in April and December showed an average SS increase of 1.60 ± 0.26 and 1.31 ± 0.32 mm per year, respectively (Supplementary Table 4). Similar SS values were observed for the pixels with a significant decreasing trend in March, June, and July, with average SS decreases of 1.66, 2.33, and 2.22 mm per year, respectively (Supplementary Table 4).
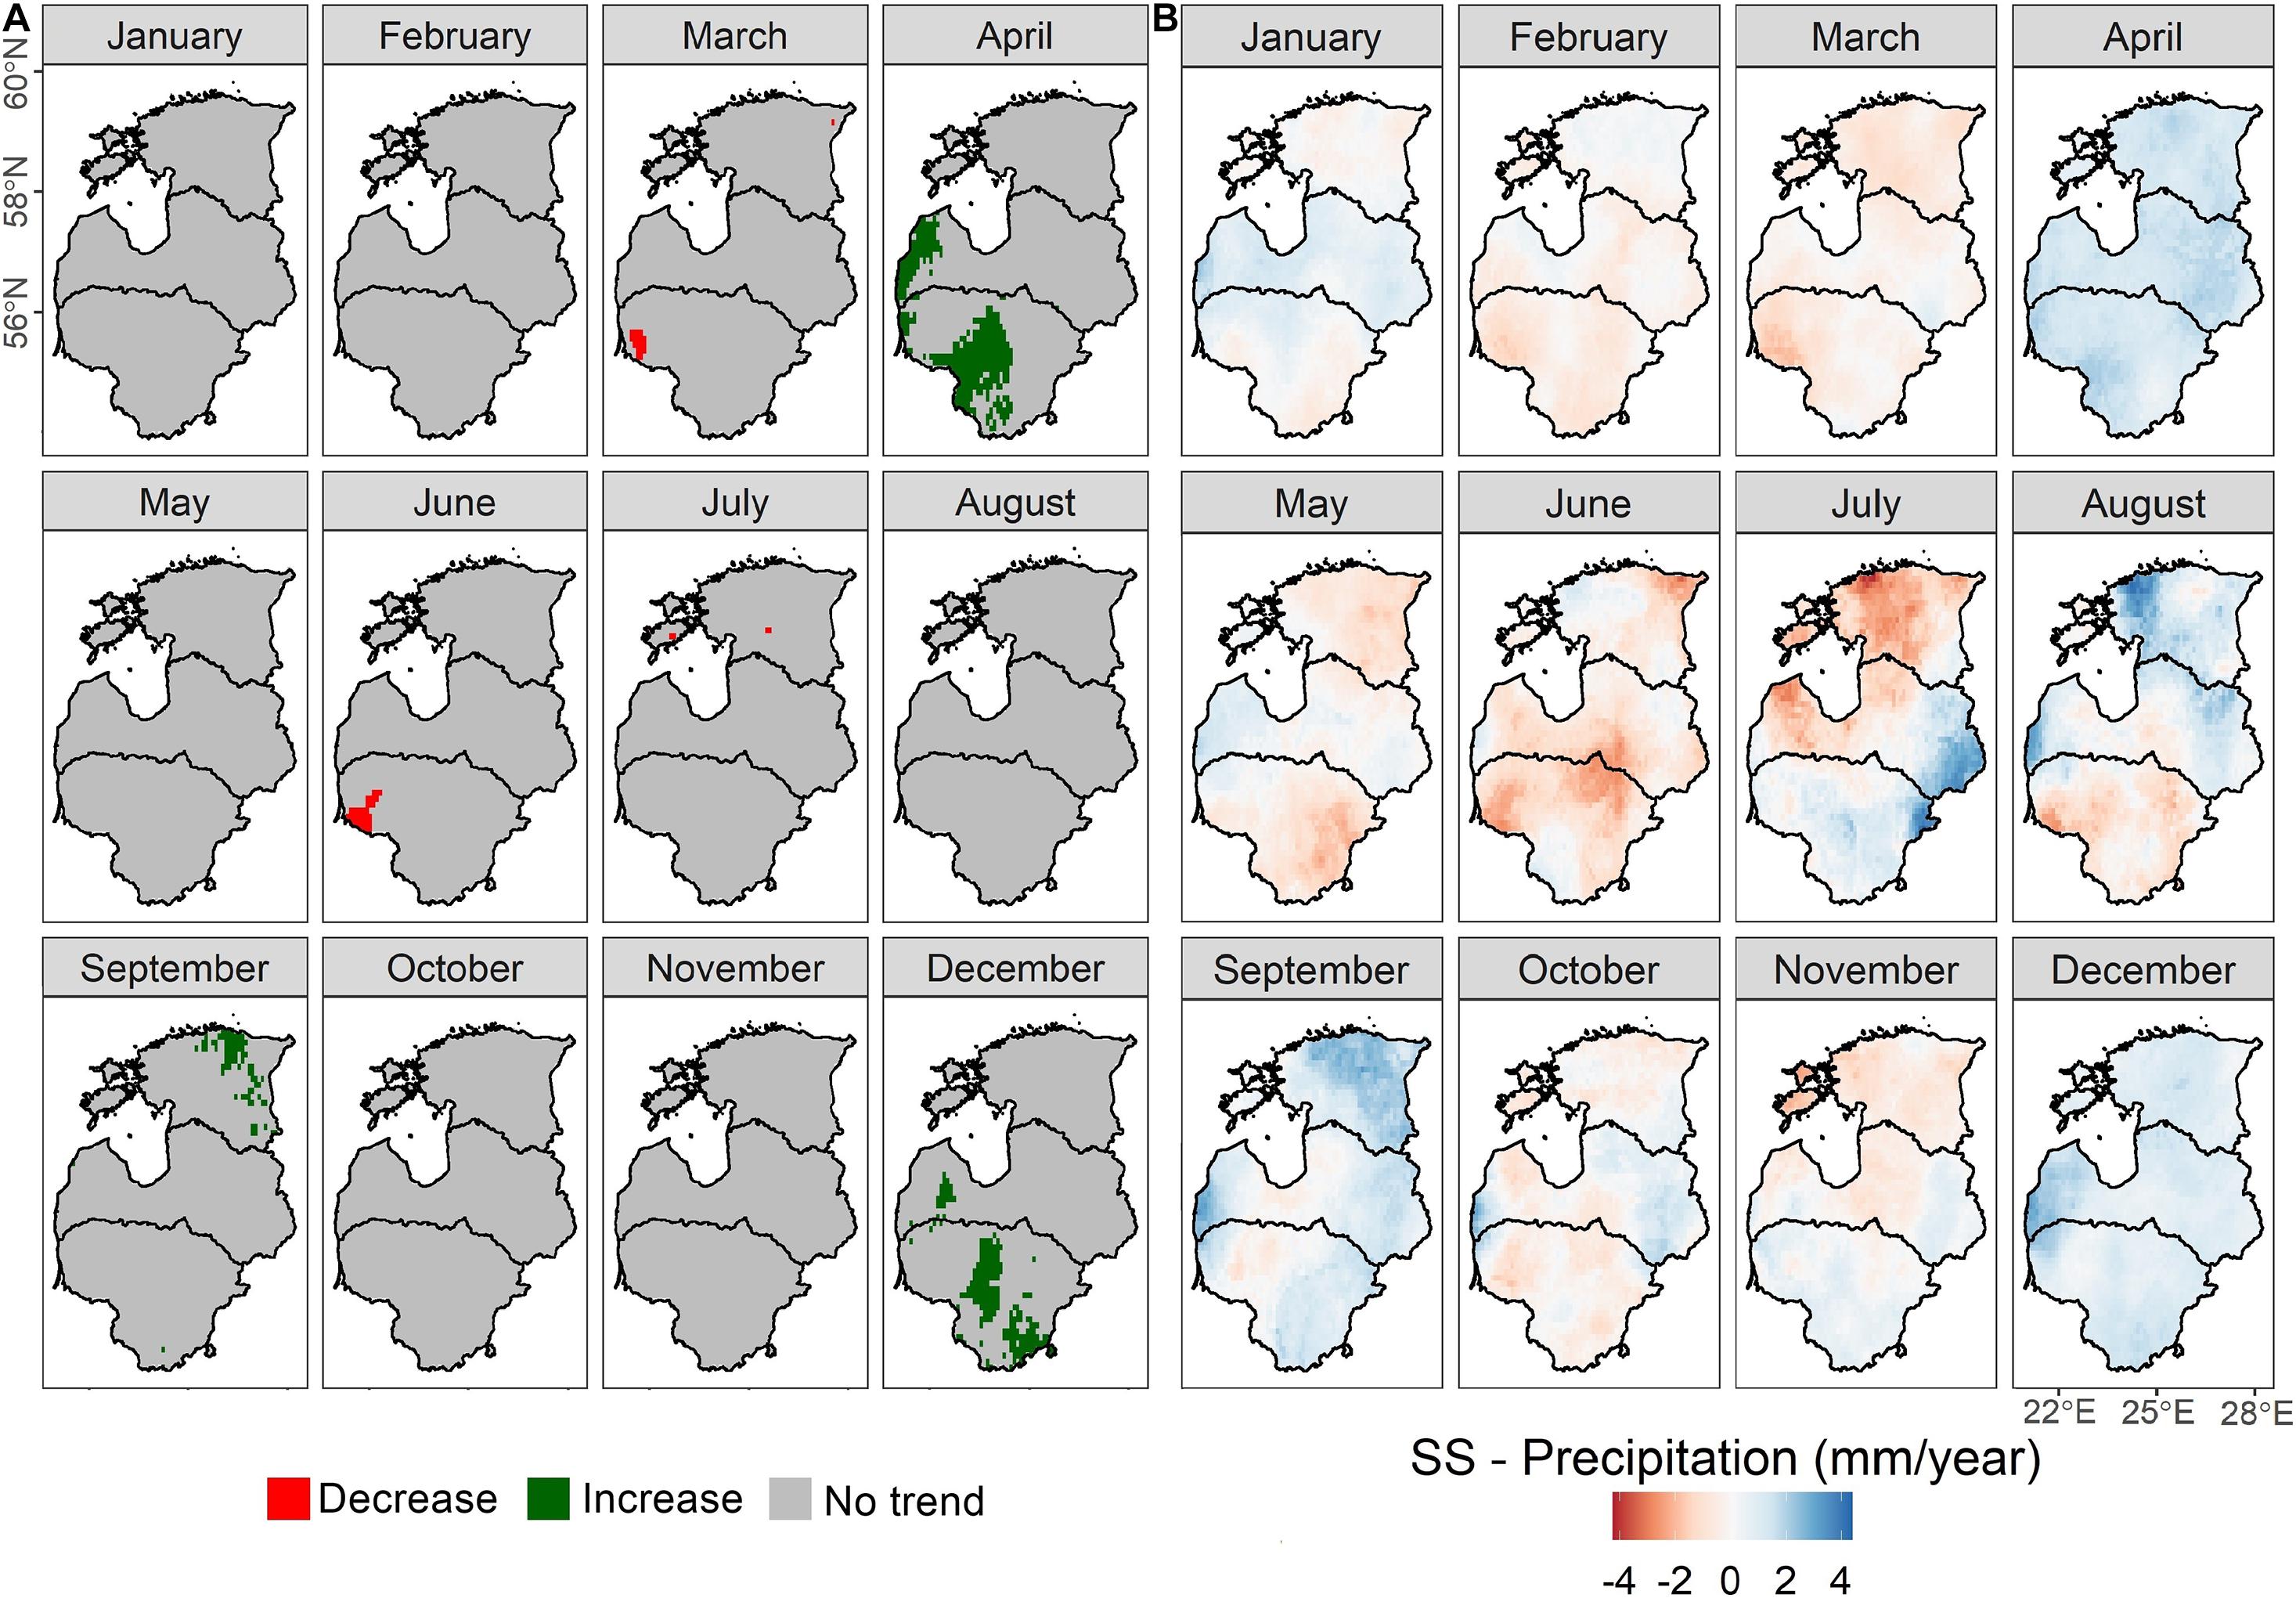
Figure 2. (A) The results of the Mann-Kendall test for statistically significant (p < 0.05) trends in monthly precipitation at the pixel level. (B) Sen’s slope (SS) values for changes in precipitation. Positive values represent increasing and negative values represent decreasing precipitation.
Although the trend analysis for seasonal precipitation (Supplementary Figure 1) showed that spring had only four pixels with a significant increasing trend and 31 pixels with a significant decreasing trend, the average SS reveals an overall increase trend of 0.32 ± 1 mm per year (mean ± SD) in the region. The pixels with an increasing trend in spring had an average SS value of 1.40 ± 0.24 mm per year, versus −1.34 mm per year for pixels with a decreasing trend (Supplementary Table 5). Winter pixels with an increasing trend (7 piels) had a higher average SS value (5.63 mm per year) than the spring pixels with an increasing trend (1.4 mm per year). Autumn and summer showed no pixel with significant trends. Despite the lack of significant trends, summer was the only season that showed a decrease in precipitation for the pixels that showed no significant trend (mean SS = −0.91 mm per year). The annual analysis revealed no significant trend for any pixel (Supplementary Figure 2 and Supplementary Table 6).
Spatial and Temporal Temperature Analysis
Analysis of the monthly mean temperature showed that 8 months presented no significant (p < 0.05) trend in any pixel (Figure 3A). Moreover, no pixel with a significant decreasing trend was observed in any month. Pixels with significant increasing trends were identified in May (6.2% of the 2,557 pixels), June (4.6%), August (16.6%) and September (89.3%). In September, the pixels with a significant increasing trend covered almost the entire region. However, in May, June and August, the pixels with an increasing trend were clustered into a few areas in northern and western Estonia and eastern Latvia and Lithuania. The average SS values of the pixels with a significant increasing trend (Figure 3B) were 0.14 ± 0.14°C per year in May (mean ± SD), 0.10 ± 0.01°C per year in June and August, and 0.13 ± 0.02°C per year in September (Supplementary Table 7).
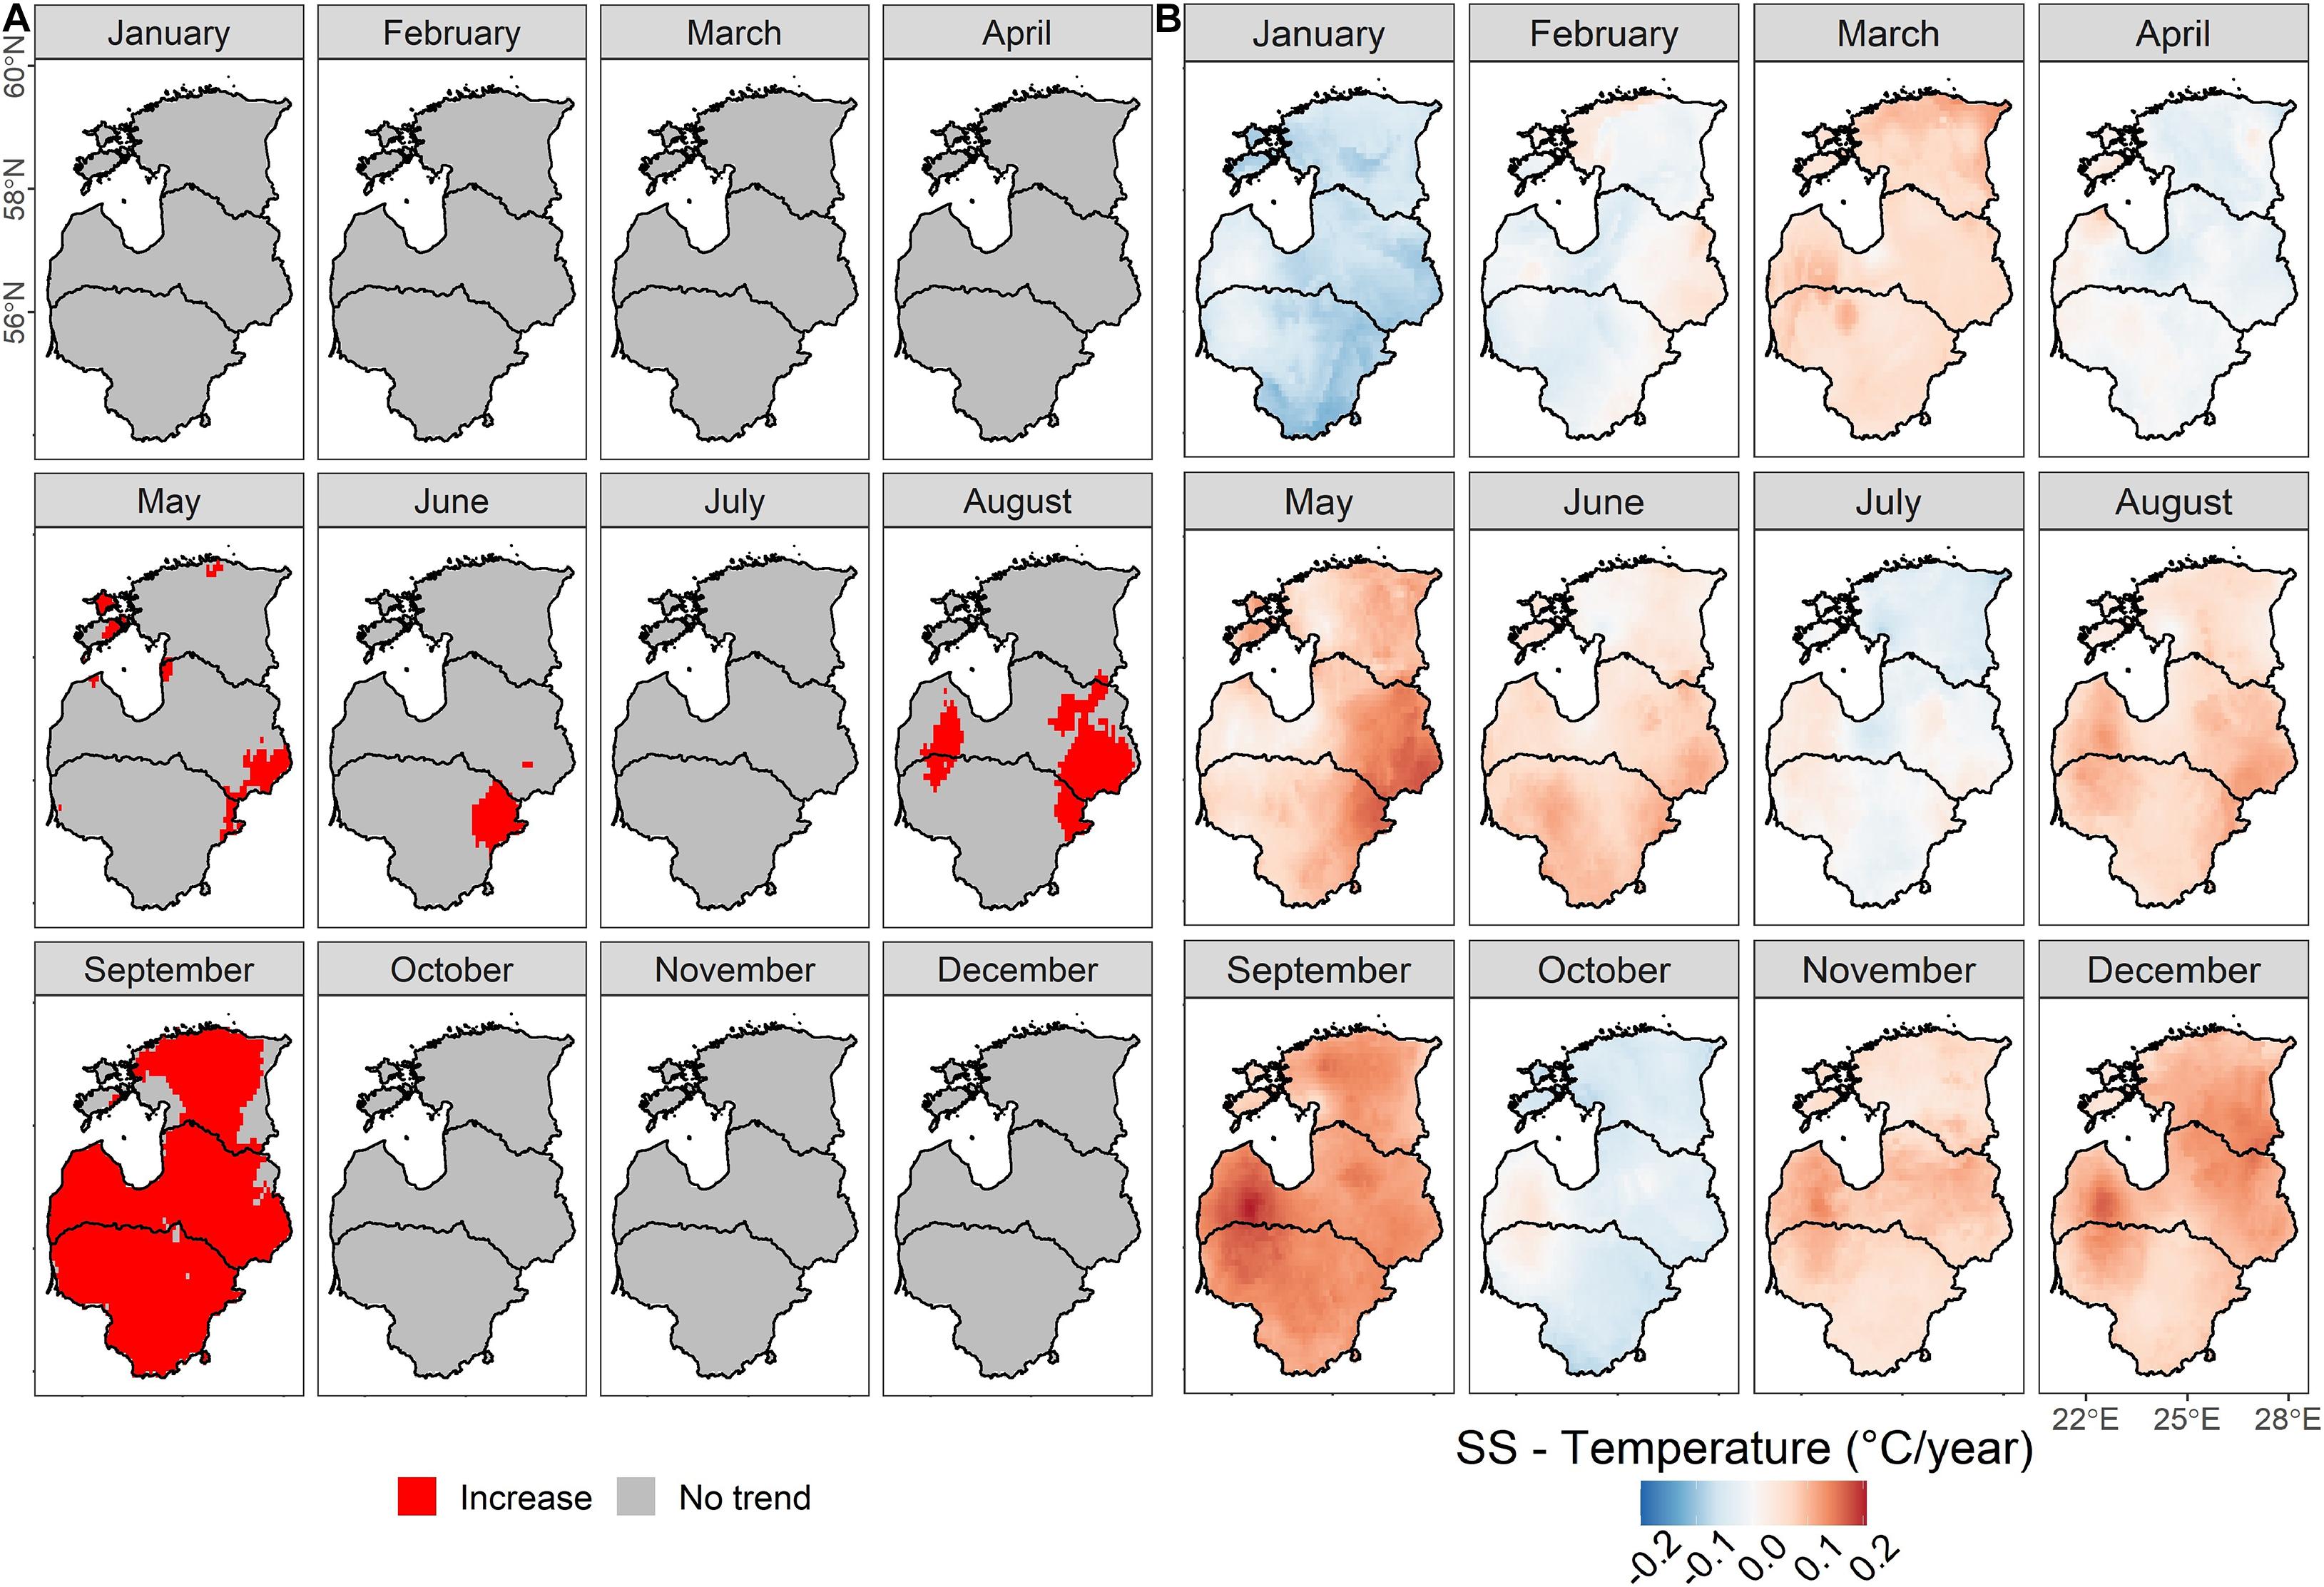
Figure 3. (A) Mann-Kendall trend analysis for monthly mean air temperature at a pixel level. (B) Sen’s slope values for monthly mean air temperature. Positive values represent a temperature increase, and negative values represent a decrease.
In the seasonal analysis, only autumn had pixels with significant increasing trends (6.6% of the pixels), and these pixels were located in the west of Lithuania and Latvia (Supplementary Figure 4). The pixels with an increasing trend in autumn had SS values that showed an average increase of 0.11 ± 0.01°C per year (Supplementary Table 8). Among the pixels with no significant trend in the other seasons, winter presented the highest average SS (0.07°C per year) with values ranging from 0.14 to −0.02°C per year (Supplementary Table 8). The annual analysis showed that 31.8% (813 out of 2557) of the pixels presented increasing trends (Supplementary Figure 5) and they are clustered in the west and east regions of Latvia and Lithuania, and in a smaller area in northern Estonia. The average SS of the pixels with an increase was 0.07°C per year, with values ranging from 0.04 to 0.09°C per year, versus 0.05°C per year for pixels with no trend and values ranging from 0.02 to 0.08°C per year (Supplementary Table 9).
Spatial and Temporal ET Analysis From 2000 to 2018
Pixels with significant (p < 0.05) increasing and decreasing trends for ET (Figure 4A) were more scattered compared to pixels with significant temperature and precipitation trends (Figure 3A). In May, June, and September, 23.2, 9.1, and 15.2% of the pixels (from a total of from 1 423 312) showed increasing ET trends, with mean SS values of 1.41 ± 0.50 (mean ± SD), 1.69 ± 0.67, and 0.65 ± 0.31 mm per year (Figure 4B), respectively. Interestingly, the mean SS values for the pixels with a decreasing trend in May, June, and September were much less common (0.1, 0.2, and 0.1%, respectively), showed SS values similar to those of the pixels with an increasing trend (Supplementary Table 10). August showed spatial segregation, with pixels that showed an increasing trend (9.3% of pixels) in the eastern part of the region and decreasing trends (3%) in the western part of the region (Figure 4A). November showed the biggest percentage of pixels with a decreasing trend for ET (9.5% of the total pixels; Supplementary Table 10). However, the mean SS values were smaller than the values for pixels with an increasing trend (Supplementary Table 10). March, April, July, and October showed <2.5% of the pixels with either increasing or decreasing trend. For these months (except July), the pixels with no significant trend revealed an average increase in the ET rates (Supplementary Table 10).
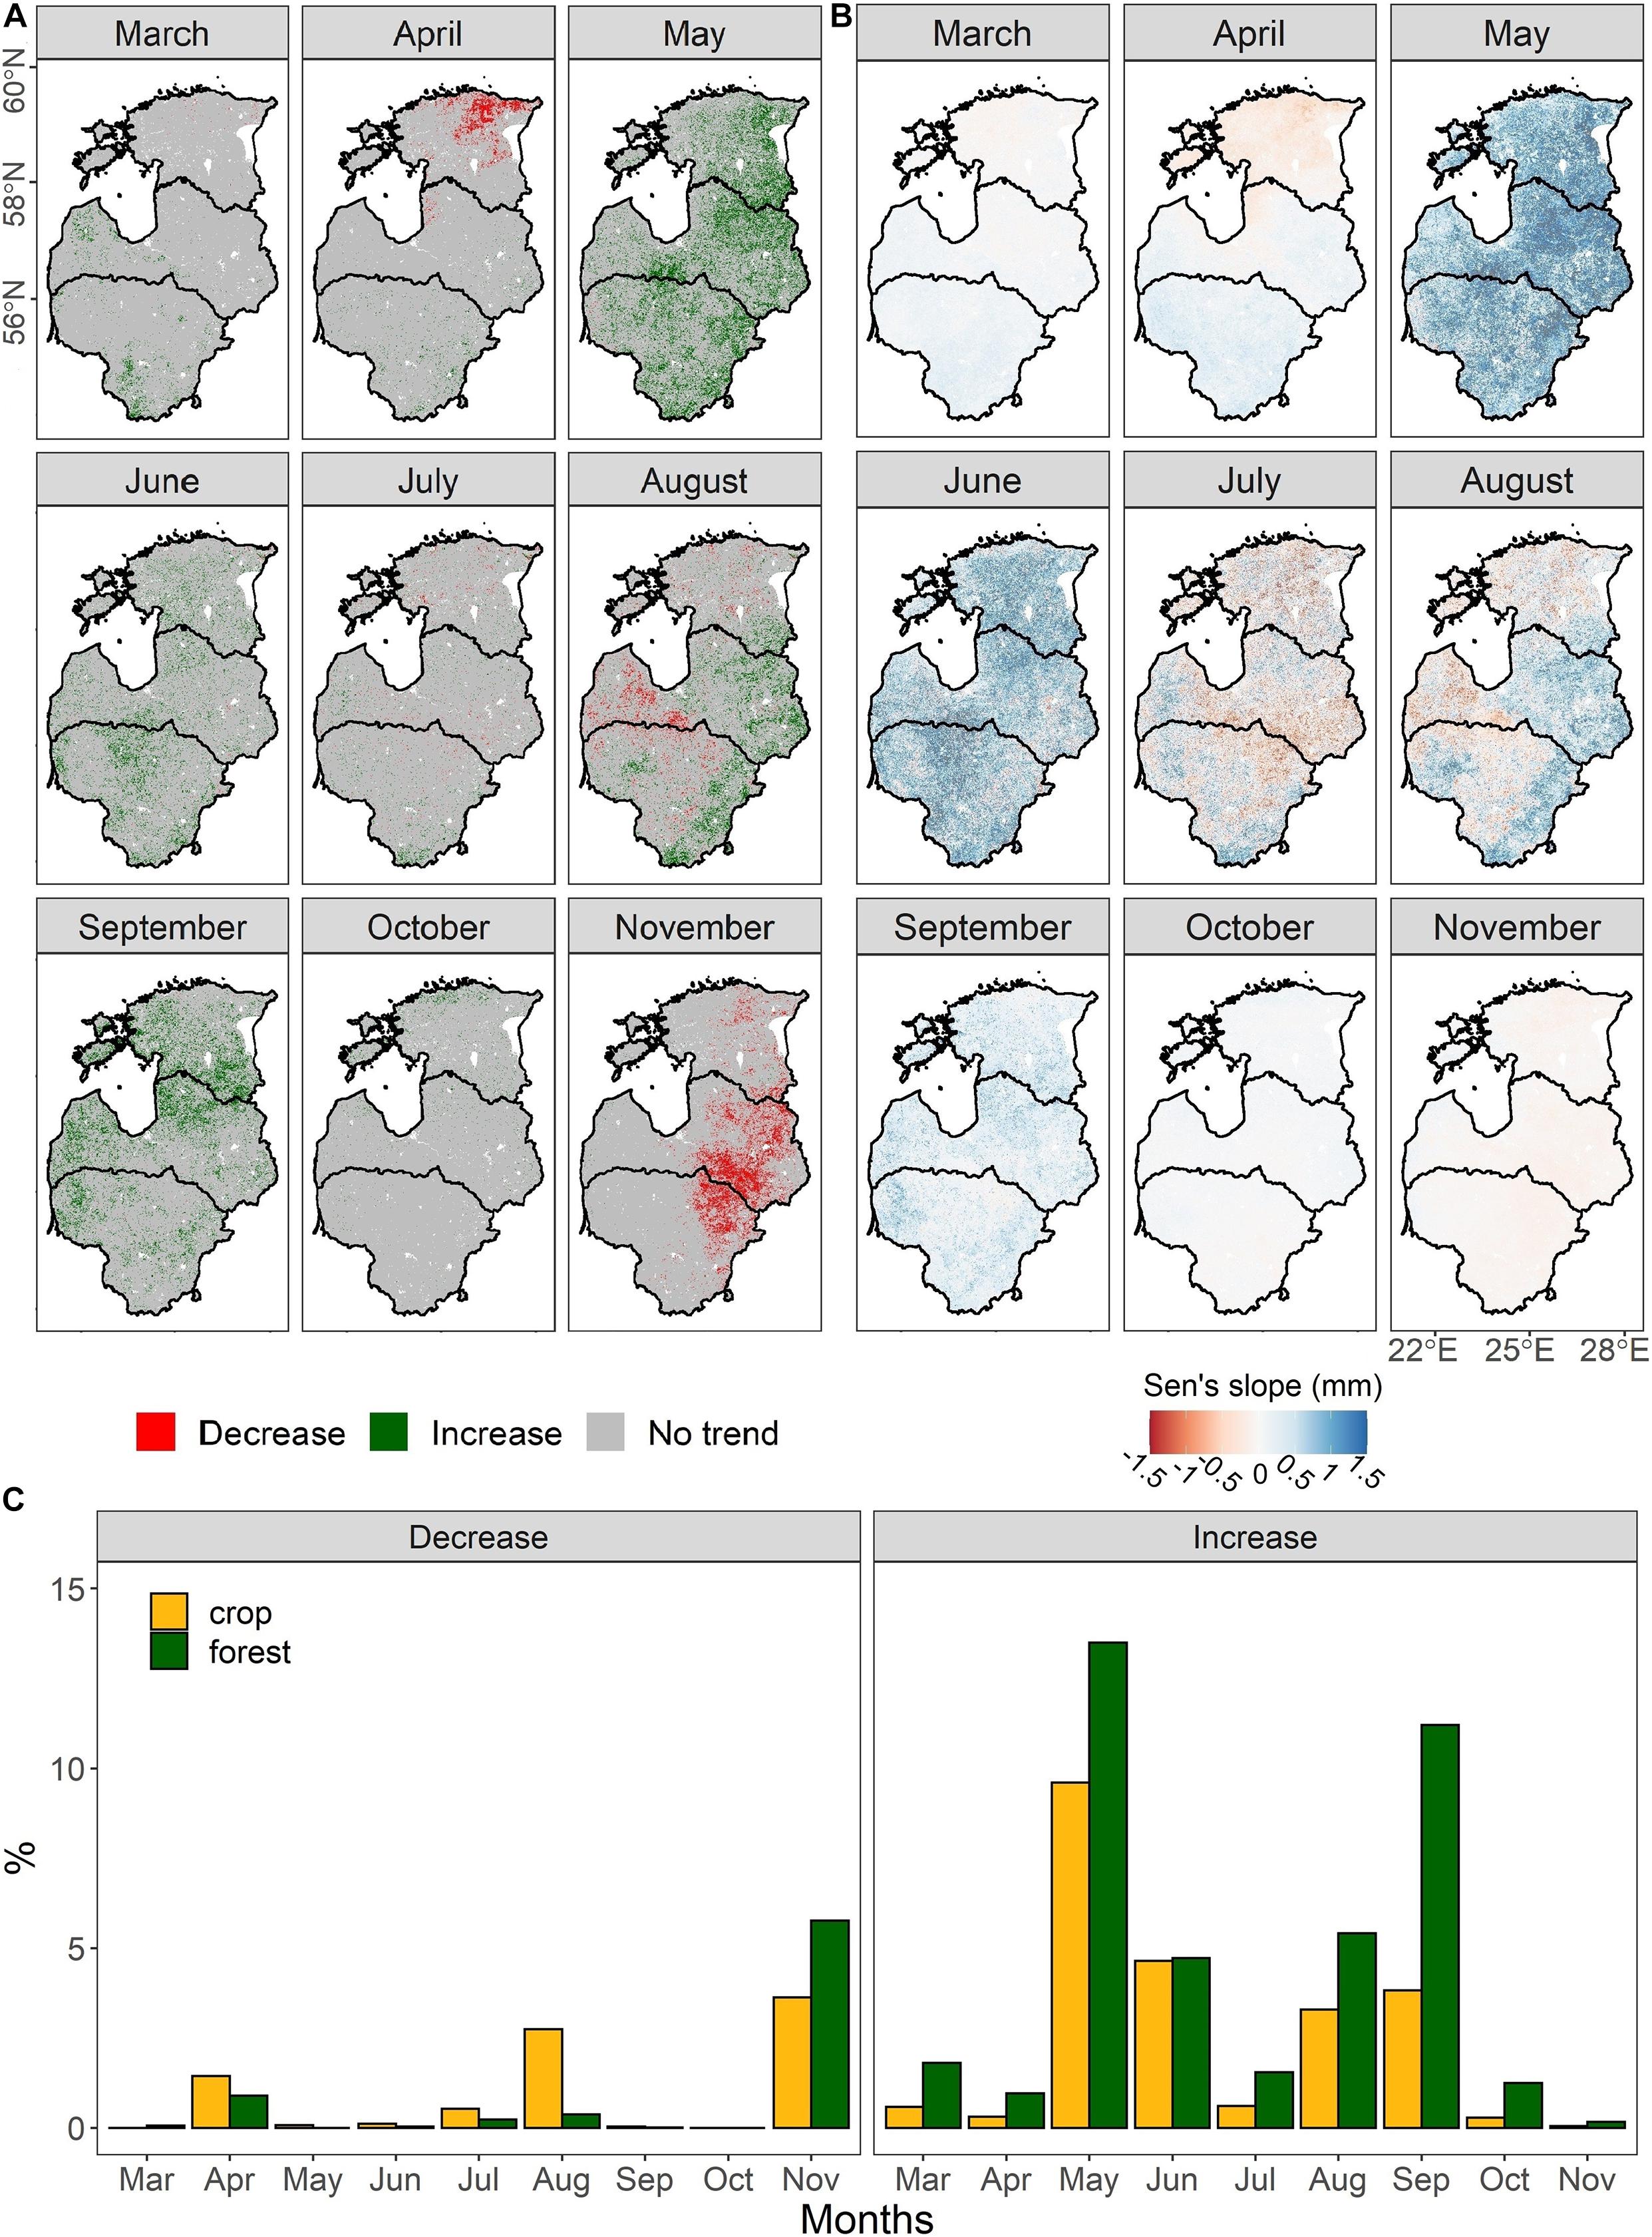
Figure 4. (A) Mann-Kendall trend analysis for evapotranspiration at a pixel scale for each month, with p < 0.05 for significant trends. (B) Sen’s slope values for evapotranspiration in each month. Positive values represent an increase, and negative values a decrease. (C) Percentage of forest and cropland pixels (>50% of the MODIS ET pixel area) that showed decreasing and increasing trends in each month.
By analysing the ET trends seasonally, we found that 13% of the pixels in autumn (Supplementary Table 11) and 13.5% in spring presented a significant increasing trend, which is more than the proportion in summer (10%). All seasons had fewer than 1% of the pixels showing a decreasing trend (Supplementary Table 11). The pixels with a decreasing trend were spread throughout the Baltic countries during summer and autumn (Supplementary Figure 6). We also observed the latter spatial pattern for pixels with an increasing trend in all three seasons. On an annual basis, the spatiotemporal analysis revealed that 34.9% of the pixels had a significant increasing trend and only 0.3% showed a significant decreasing trend (Supplementary Figure 7 and Supplementary Table 12).
We found that 83.5% of the MODIS ET pixels had forest (48.1%) and cropland (35.4%) as the major LULC type (with these types accounting for >50% of the MODIS ET pixel area). Hereafter, we refer to these as forest and cropland pixels. Most of these pixels (>77%) had no significant trend in ET in any month. Few forest and cropland pixels (<10%) showed a significant decreasing trend, with August showing the highest percentage (5.76%) for forest pixels (Figure 4C). For pixels with increasing trends, pixels of both LULC types showed similar percentages for March, April, October, and November (<2%). However, the difference between crop and forest pixels with an increasing trend was <4 percentage points in May, June, July, and August, September had a difference of 7.3 percentage points (11.2% of forest pixels and 3.8% of crop pixels; Figure 4C).
Evapotranspiration Over Unchanged Forest and Cropland Areas
We extracted the monthly ET of 10 949 MODIS ET pixels dominated by unchanged forest and 377 pixels dominated by unchanged cropland. Using the average monthly ET of these pixels, the Mann-Kendall trend analysis revealed that neither forest nor cropland showed a significant increasing or decreasing trend in any month. However, the SS values (Figure 5 and Supplementary Table 13) indicated that forest had an ET increase in most month (except July, August, and November) with May (0.7 mm per year), June (0.55 mm per year), and September (0.35 mm per year) showing the highest increasing values (Supplementary Table 13). At the same time, SS values for cropland also showed increase for most months, except August (−0.2 mm per year) and November (−0.01 mm per year). Crop ET in June presented the highest value (0.64 mm per year), followed by May (0.50 mm per year). On a seasonal basis, forest showed a significant increasing trend in autumn (SS = 0.46 mm per year). Moreover, forest showed higher SS values than cropland in all seasons (Supplementary Table 14). At an annual scale, only forest had significant increasing trend (3.46 mm per year).
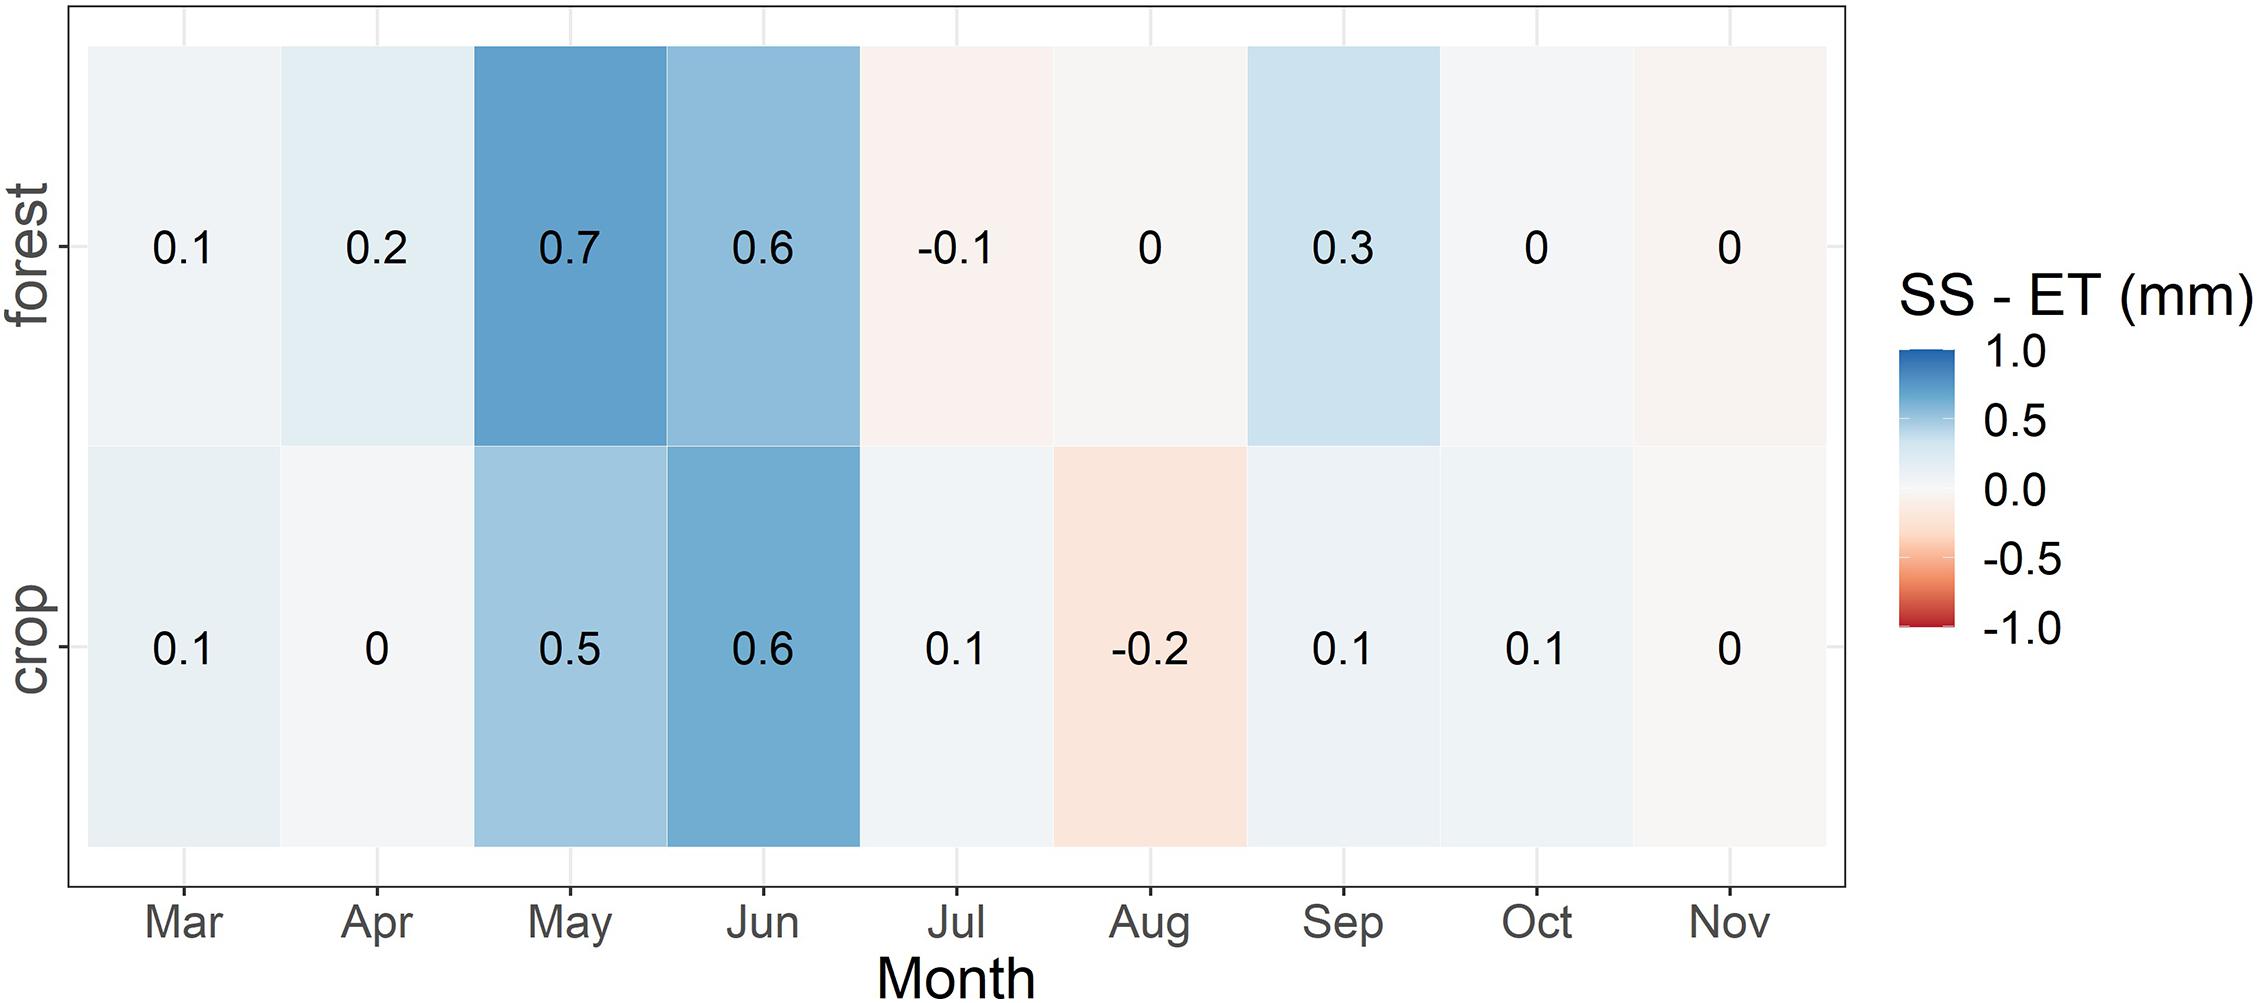
Figure 5. Sen’s slope (SS) values of evapotranspiration (ET mm) for forest and croplands in each month.
Discussion
Precipitation and Temperature
In general, our results agreed with those of previous studies (Kriauciuniene et al., 2012; Jaagus et al., 2014, 2017), which also identified shifts in precipitation and temperature at monthly, seasonal, and annual temporal scales using weather station data. However, our study advanced these studies of climate shifts by analysing them both spatially (i.e., using a gridded dataset for the whole region) and at three temporal scales. The monthly analysis provided new insights that analysis with a coarser temporal resolution (i.e., seasonal and annual) would have not provided. For instance, the SS values for the overall summer season showed a reduction in precipitation. However, the monthly analysis showed that June and July had areas with statistically significant decreasing trends for precipitation and negative mean SS values for the pixels with non-significant trends, whereas August showed positive SS values. Therefore, the negative SS values of the summer season were influenced mostly by decreased June and July precipitation but not by August changes. This highlights the necessity of evaluating trends at a monthly level, as this more clearly reveals differences between the months within a season. Moreover, the spatial analysis using the monthly time scale provided an overview of the reduction in precipitation, which was more spatially dispersed in June and more clustered in July and August. Similar observations can be done for spring. March and May (the beginning and end of spring) showed reduced precipitation (negative SS values), whereas April (in the middle of the spring) showed an increase in precipitation, although with no significant trend. This dispersion of statistically significant trends at monthly and seasonal level was also reported by Jaagus et al. (2017), who investigated precipitation trends in Estonia using weather station data. They suggested that large-scale atmospheric circulation patterns were the main factor for the high spatiotemporal variability in the precipitation over the region (Supplementary Figure 3).
As was the case in other temperate regions (Zhang et al., 2017; Oishi et al., 2018), our results also indicated that the Baltic countries are experiencing a warming shift in most months, in all seasons (although only autumn showed a significant increasing trend), and in the mean annual temperature. Most of the statistically significant increase in temperature at a monthly scale was detected at the end of spring (May), at the beginning (June) and end of summer (August), and at the beginning of autumn (September). Similar findings were reported by Kriauciuniene et al. (2012), although these authors analyzed a longer time series record (from 1922 to 2007) for Lithuania, Latvia and Estonia.
By combining the temperature and the precipitation analysis, we found critical periods. For example, at the end of spring (May) and beginning of summer (June), the temperature showed statistically significant increasing trends, whereas the precipitation during the same period showed statistically significant decreasing trends. This can limit soil water availability during the spring warming period, and this will have several consequences for plant development, especially during the growing season. According to Grillakis (2019), soil moisture droughts events are expected to increase in frequency and spatial extent, and eastern Europe is likely to be most strongly affected. Similarly, Samaniego et al. (2018) reported that up to 40% of European soils will be affected by soil drought caused by anthropogenic warming if the temperature increases by 3°C compared to the pre-industrial period.
Evapotranspiration
Based on the ET trends and the LULC change analysis, we confirmed that the changes in ET rates over the Baltic countries are most likely driven more by shifts in the climatic variables than by LULC change. This assumption agrees with the results of Li et al. (2017), who demonstrated a more significant impact of climate change than LULC change on ET throughout China. These changes in ET have an impact on the regional water balance. As highlighted by Teuling et al. (2019), the reduction in precipitation combined with an increase in ET to reduce streamflow. For example, by analysing precipitation, temperature and river discharge trends from 1991 to 2007, Kriauciuniene et al. (2012) found a significant decrease in river discharge in the western part of the Baltic region during the spring, a decrease in the whole region during the autumn, and an increase throughout the region during winter. Our results for ET showed statistically significant increases for most months that showed a reduction in river discharge in the same study area, and this partially explains the decrease in the river discharge. However, the reduction in the number of days and depth of snow cover (Rimkus et al., 2018) between 1961 and 2015 also affected the regional water balance, especially by limiting the amount of snowmelt water and groundwater, which are the major water sources for several rivers (Kriauciuniene et al., 2012). Moreover, our monthly ET analysis indicated that May, June, and July are critical months, since ET exceeds precipitation, on average, in 77% (+31.1 mm), 74.3% (+52.5 mm), and 50.7% (+36.3 mm), respectively (Supplementary Figure 8). This can potentially result in a reduction of soil moisture and groundwater availability if the water transported into the atmosphere by ET is not returning to the soil as precipitation, especially in June and July, when precipitation was decreasing. This type of seasonal hydrological shift was reported as a factor for summer drought in temperate forests (Parida and Buermann, 2014).
The changes in ET for croplands and forested areas are potentially a consequence of the lengthening growing season in the study region. Gaertner et al. (2019) found that an increase of ∼22 days in the growing season since 1982 until 2012 resulted in an increase of 12 mm in ET in the temperate forest region. They reported that temperature, vapor pressure deficit, wind, and humidity are important climatic variable for the change of the growing season. In addition, precipitation has been reported as an important factor for increasing growing season length (Dragoni and Rahman, 2012), since higher growing-season precipitation allows the vegetation to remain active over a longer period (Hussain et al., 2019). Therefore, the trends of increasing precipitation in April, August, and September (significant and not significant) combined with the temperature trends in May, August, and September that we observed, have likely driven the longer growing season. A longer growing season has been already reported for the study area using analysis of daily mean air temperature (Linderholm and Walther, 2008). According to the authors, the growing season increased between 11.5 and 12.2 days mainly due to an earlier starting of ∼10 days and a later ending of ∼2 days. Considering the findings of Gaertner et al. (2019), that a longer growing season result in an increase of ET, we can suggest that the forested ET rate increase in April and September (Figure 5) and the croplands ET rate increase in May (Figure 5) are likely caused by the changes in the growing season duration over the study area. We found that May and June showed reductions in precipitation and increases in temperature. This combination can potentially affect crop development, resulting in a soil moisture decrease that can cause drought during the early stages of crop development, and this can potentially result in significant yield reductions. For instance, the combination of decreased precipitation with decreased soil moisture can reduce crop yield (for wheat, canola, and barley) by 25 to 45% in a dry growing season (Madadgar et al., 2017).
For the forested areas, on the other hand, the reduction of ET during June and July, although not statistically significant, can be related to the decreased precipitation during these months. As a consequence, the forested areas can become more vulnerable to fires (Donis et al., 2017). One of the reasons that the decreases in ET over forested areas in June and July were not significant, and were lower than the decrease over the cropland, is that the forest can recycle more moisture due to its deeper roots (Zha et al., 2010). Lian et al. (2020) found that spring and summer soil moisture in the northern hemisphere has decreased from 1982 to 2011 due to earlier vegetation greening. They observed that this process was driven by an increase in ET rather than increased precipitation. Our observations for forest and cropland areas also agree with the results of Rimkus et al. (2017), who used the normalized-difference vegetation index, the vegetation condition index, and the standard precipitation index to study drought in the Baltic countries, concluded that cropland was affected more strongly than forest by precipitation deficits.
There are certain limitations of our study. First, our observations for unchanged cropland areas are limited by the small size of the patches of this LULC class, which did not allow us to sample <1.2% of MODIS ET pixels. To better estimate the changes in such small patches, future studies would benefit from higher resolution ET and climate datasets (Ruiz-Pérez and Vico, 2020). The datasets could be created using modeling (e.g., for ET, using the Penman-Monteith or Priestley-Taylor models). By using a higher spatial resolution, we could expand our analysis to include other LULC classes. For example, although we consolidated all forest types into a single forest class and all cropland types into a single cropland class, forests with different species or degrees of vegetation cover and different crops have different ET characteristics. In future research, these differences should be accounted for in our analysis. Another shortcoming is the lack of an uncertainty assessment for the MODIS ET data over the study region. However, several studies have pointed out the reliability of this data (Aguilar et al., 2018; Sriwongsitanon et al., 2020), with very good results over forested areas (Paca et al., 2019) and cropland areas (Velpuri et al., 2013). Future studies should also investigate the relationship or combined effect of precipitation and temperature change on ET rates at different time scales. Furthermore, it would be interesting to utilize water balance models to investigate how the changes in ET are affecting the water balance of the region (Kumar and Merwade, 2011).
Data Availability Statement
The original contributions presented in the study are included in the article/Supplementary Material, further inquiries can be directed to the corresponding author/s.
Author Contributions
BM and EU conceived the study and wrote the manuscript. BM performed the data analysis, with support from EU, JJ, and ÜM. All authors approved the manuscript for submission.
Funding
This research was funded by Mobilitas+ programme grant nos. MOBERC34 and PRG352 from the Estonian Research Council, NUTIKAS programme of the Archimedes foundation and European Regional Development Fund (EcolChange Centre of Excellence).
Conflict of Interest
The authors declare that the research was conducted in the absence of any commercial or financial relationships that could be construed as a potential conflict of interest.
Acknowledgments
We thank Geoff Hart for language editing and the reviewers for the useful comments that helped to improve our manuscript significantly.
Supplementary Material
The Supplementary Material for this article can be found online at: https://www.frontiersin.org/articles/10.3389/ffgc.2021.663327/full#supplementary-material
Footnotes
References
Aguilar, A. L., Flores, H., Crespo, G., Marín, M. I., Campos, I., and Calera, A. (2018). Performance assessment of MOD16 in evapotranspiration evaluation in Northwestern Mexico. Water 10:901. doi: 10.3390/w10070901
Alkama, R., and Cescatti, A. (2016). Biophysical climate impacts of recent changes in global forest cover. Science 351, 600–604. doi: 10.1126/science.aac8083
Almeida, C. T., Oliveira-Júnior, J. F., Delgado, R. C., Cubo, P., and Ramos, M. C. (2017). Spatiotemporal rainfall and temperature trends throughout the Brazilian Legal Amazon, 1973–2013. Int. J. Climatol. 37, 2013–2026. doi: 10.1002/joc.4831
Atta-ur, R., and Dawood, M. (2017). Spatio-statistical analysis of temperature fluctuation using Mann–Kendall and Sen’s slope approach. Clim. Dyn. 48, 783–797. doi: 10.1007/s00382-016-3110-y
Bari, S. H., Rahman, M. T. U., Hoque, M. A., and Hussain, M. M. (2016). Analysis of seasonal and annual rainfall trends in the northern region of Bangladesh. Atmos. Res. 176–177, 148–158. doi: 10.1016/j.atmosres.2016.02.008
Cao, Q., Yu, D., Georgescu, M., Han, Z., and Wu, J. (2015). Impacts of land use and land cover change on regional climate: a case study in the agro-pastoral transitional zone of China. Environ. Res. Lett. 10:124025. doi: 10.1088/1748-9326/10/12/124025
Ceccherini, G., Duveiller, G., Grassi, G., Lemoine, G., and Avitabile, V. (2020). Abrupt increase in forest harvested area over Europe After 2015. Nature 583, 72–77. doi: 10.1038/s41586-020-2438-y
Chen, L., and Dirmeyer, P. A. (2017). Impacts of land-use/land-cover change on afternoon precipitation over North America. J. Clim. 30, 2121–2140. doi: 10.1175/JCLI-D-16-0589.1
Cornes, R. C., van der Schrier, G., van den Besselaar, E. J. M., and Jones, P. D. (2018). An ensemble version of the E-OBS temperature and precipitation data sets. J. Geophys. Res. Atmos. 123, 9391–9409. doi: 10.1029/2017JD028200
Dias, L. C. P., Macedo, M. N., Costa, M. H., Coe, M. T., and Neill, C. (2015). Effects of land cover change on evapotranspiration and streamflow of small catchments in the Upper Xingu River Basin, Central Brazil. J. Hydrol. Reg. Stud. 4, 108–122. doi: 10.1016/j.ejrh.2015.05.010
Dinpashoh, Y., Jhajharia, D., Fakheri-Fard, A., Singh, V. P., and Kahya, E. (2011). Trends in reference crop evapotranspiration over Iran. J. Hydrol. 399, 422–433. doi: 10.1016/j.jhydrol.2011.01.021
Domínguez-Castro, F., Reig, F., Vicente-Serrano, S. M., Aguilar, E., Peña-Angulo, D., Noguera, I., et al. (2020). A multidecadal assessment of climate indices over Europe. Sci. Data 7:125. doi: 10.1038/s41597-020-0464-0
Donis, J., Kitenberga, M., Snepsts, G., Matisons, R., Zarins, J., and Jansons, A. (2017). The forest fire regime in Latvia during 1922–2014. Silva Fenn 51, 1–15. doi: 10.14214/sf.7746
dos Santos, C. A. C., Mariano, D. A., das Chagas, A., do Nascimento, F., Fabiane, F. R., de Oliveira, G., et al. (2020). Spatio-temporal patterns of energy exchange and evapotranspiration during an intense drought for drylands in Brazil. Int. J. Appl. Earth Obs. Geoinf. 85:101982. doi: 10.1016/j.jag.2019.101982
Dragoni, D., and Rahman, A. F. (2012). Trends in fall phenology across the deciduous forests of the Eastern USA. Agric. For. Meteorol. 157, 96–105. doi: 10.1016/j.agrformet.2012.01.019
Findell, K. L., Berg, A., Gentine, P., Krasting, J. P., Lintner, B. R., Malyshev, S., et al. (2017). The impact of anthropogenic land use and land cover change on regional climate extremes. Nat. Commun. 8, 1–9. doi: 10.1038/s41467-017-01038-w
Funk, J. M., Aguilar-Amuchastegui, N., Baldwin-Cantello, W., Busch, J., Chuvasov, E., Evans, T., et al. (2019). Securing the climate benefits of stable forests. Clim. Policy 19, 845–860. doi: 10.1080/14693062.2019.1598838
Gaertner, B. A., Zegre, N., Warner, T., Fernandez, R., He, Y., and Merriam, E. R. (2019). Climate, forest growing season, and evapotranspiration changes in the central appalachian mountains. USA. Sci. Total Environ. 650, 1371–1381. doi: 10.1016/j.scitotenv.2018.09.129
Gao, F., Wang, Y., Chen, X., and Yang, W. (2020). Trend analysis of rainfall time series in Shanxi province, Northern China (1957-2019). Water 12, 1–22. doi: 10.3390/W12092335
Gogoi, P. P., Vinoj, V., Swain, D., Roberts, G., Dash, J., and Tripathy, S. (2019). Land use and land cover change effect on surface temperature over Eastern India. Sci. Rep. 9, 1–10. doi: 10.1038/s41598-019-45213-z
Grillakis, M. G. (2019). Increase in severe and extreme soil moisture droughts for Europe under climate change. Sci. Total Environ. 660, 1245–1255. doi: 10.1016/j.scitotenv.2019.01.001
Haghtalab, N., Moore, N., and Ngongondo, C. (2019). Spatio-temporal analysis of rainfall variability and seasonality in Malawi. Reg. Environ. Chang. 19, 2041–2054. doi: 10.1007/s10113-019-01535-2
Hale, R. C., Gallo, K. P., Owen, T. W., and Loveland, T. R. (2006). Land use/land cover change effects on temperature trends at U.S. Climate Normals stations. Geophys. Res. Lett. 33, 2–5. doi: 10.1029/2006GL026358
Hamed, K. H. (2008). Trend detection in hydrologic data: the mann-kendall trend test under the scaling hypothesis. J. Hydrol. 349, 350–363. doi: 10.1016/j.jhydrol.2007.11.009
Hamilton, S. K., Hussain, M. Z., Lowrie, C., Basso, B., and Robertson, G. P. (2018). Evapotranspiration is resilient in the face of land cover and climate change in a humid temperate catchment. Hydrol. Process. 32, 655–663. doi: 10.1002/hyp.11447
Hofstra, N., New, M., and McSweeney, C. (2010). The influence of interpolation and station network density on the distributions and trends of climate variables in gridded daily data. Clim. Dyn. 35, 841–858. doi: 10.1007/s00382-009-0698-1
Hussain, M. Z., Hamilton, S. K., Bhardwaj, A. K., Basso, B., Thelen, K. D., and Robertson, G. P. (2019). Evapotranspiration and water use efficiency of continuous maize and maize and soybean in rotation in the upper Midwest U.S. Agric. Water Manag. 221, 92–98. doi: 10.1016/j.agwat.2019.02.049
Jaagus, J. (2006). Climatic changes in Estonia during the second half of the 20th century in relationship with changes in large-scale atmospheric circulation. Theor. Appl. Climatol. 83, 77–88. doi: 10.1007/s00704-005-0161-0
Jaagus, J., Briede, A., Rimkus, E., and Remm, K. (2014). Variability and trends in daily minimum and maximum temperatures and in the diurnal temperature range in Lithuania, Latvia and Estonia in 1951–2010. Theor. Appl. Climatol. 118, 57–68. doi: 10.1007/s00704-013-1041-7
Jaagus, J., Sepp, M., Tamm, T., Järvet, A., and Mõisja, K. (2017). Trends and regime shifts in climatic conditions and river runoff in Estonia during 1951–2015. Earth Syst. Dyn. 8, 963–976. doi: 10.5194/esd-8-963-2017
Jaagus, J., Truu, J., Ahas, R., and Aasa, A. (2003). Spatial and temporal variability of climatic seasons on the East European Plain in relation to large-scale atmospheric circulation. Clim. Res. 23, 111–129. doi: 10.3354/cr023111
Jassby, A. D., and Cloern, J. E. (2017). wq: Exploring Water Quality Monitoring Data. R Package. Available online at: https://cran.r-project.org/package=wq (accessed February 18, 2020).
Katsanos, D., Retalis, A., and Michaelides, S. (2016). Validation of a high-resolution precipitation database (CHIRPS) over Cyprus for a 30-year period. Atmos. Res. 169, 459–464. doi: 10.1016/j.atmosres.2015.05.015
Krauskopf, T., and Huth, R. (2020). Temperature trends in Europe: comparison of different data sources. Theor. Appl. Climatol. 139, 1305–1316. doi: 10.1007/s00704-019-03038-w
Kriauciuniene, J., Meilutyte-Barauskiene, D., Reihan, A., Koltsova, T., Lizuma, L., and Sarauskiene, D. (2012). Variability in temperature, precipitation and river discharge in the Baltic States. Boreal Environ. Res. 17, 150–162.
Kumar, S., and Merwade, V. (2011). Evaluation of NARR and CLM3.5 outputs for surface water and energy budgets in the Mississippi River Basin. J. Geophys. Res. Atmos. 116, 1–21. doi: 10.1029/2010JD014909
Kumar, S., Merwade, V., Kam, J., and Thurner, K. (2009). Streamflow trends in Indiana: Effects of long term persistence, precipitation and subsurface drains. J. Hydrol. 374, 171–183. doi: 10.1016/j.jhydrol.2009.06.012
Lawrence, P. J., and Chase, T. N. (2010). Investigating the climate impacts of global land cover change in the community climate system model. Int. J. Climatol. 30, 2066–2087. doi: 10.1002/joc.2061
Li, G., Zhang, F., Jing, Y., Liu, Y., and Sun, G. (2017). Response of evapotranspiration to changes in land use and land cover and climate in China during 2001–2013. Sci. Total Environ. 596–597, 256–265. doi: 10.1016/j.scitotenv.2017.04.080
Lian, X., Piao, S., Li, L. Z. X., Li, Y., Huntingford, C., Ciais, P., et al. (2020). Summer soil drying exacerbated by earlier spring greening of northern vegetation. Sci. Adv. 6, 1–12. doi: 10.1126/sciadv.aax0255
Linderholm, H. W., and Walther, A. (2008). Twentieth-century trends in the thermal growing season in the Greater Baltic Area. Clim. Chang. 87, 405–419. doi: 10.1007/s10584-007-9327-3
Llopart, M., Reboita, M. S., Coppola, E., Giorgi, F., da Rocha, R. P., and de Souza, D. O. (2018). Land use change over the Amazon forest and its impact on the local climate. Water 10:149. doi: 10.3390/w10020149
Madadgar, S., AghaKouchak, A., Farahmand, A., and Davis, S. J. (2017). Probabilistic estimates of drought impacts on agricultural production. Geophys. Res. Lett. 44, 7799–7807. doi: 10.1002/2017GL073606
Mahmood, R., Pielke, R. A., Hubbard, K. G., Niyogi, D., Dirmeyer, P. A., Mcalpine, C., et al. (2014). Land cover changes and their biogeophysical effects on climate. Int. J. Climatol. 34, 929–953. doi: 10.1002/joc.3736
Mao, J., Fu, W., Shi, X., Ricciuto, D. M., Fisher, J. B., Dickinson, R. E., et al. (2015). Disentangling climatic and anthropogenic controls on global terrestrial evapotranspiration trends. Environ. Res. Lett. 10:094008. doi: 10.1088/1748-9326/10/9/094008
Miralles, D. G., De Jeu, R. A. M., Gash, J. H., Holmes, T. R. H., and Dolman, A. J. (2011). Magnitude and variability of land evaporation and its components at the global scale. Hydrol. Earth Syst. Sci. 15, 967–981. doi: 10.5194/hess-15-967-2011
Moura, M. M., dos Santos, A. R., Pezzopane, J. E. M., Alexandre, R. S., da Silva, S. F., Pimentel, S. M., et al. (2019). Relation of El Niño and La Niña phenomena to precipitation, evapotranspiration and temperature in the Amazon basin. Sci. Total Environ. 651, 1639–1651. doi: 10.1016/j.scitotenv.2018.09.242
Nastos, P. T., Kapsomenakis, J., and Douvis, K. C. (2013). Analysis of precipitation extremes based on satellite and high-resolution gridded data set over Mediterranean basin. Atmos. Res. 131, 46–59. doi: 10.1016/j.atmosres.2013.04.009
Navarro, A., García-Ortega, E., Merino, A., Sánchez, J. L., Kummerow, C., and Tapiador, F. J. (2019). Assessment of IMERG precipitation estimates over Europe. Remote Sens. 11:2470. doi: 10.3390/rs11212470
Niu, Z., He, H., Zhu, G., Ren, X., Zhang, L., Zhang, K., et al. (2019). An increasing trend in the ratio of transpiration to total terrestrial evapotranspiration in China from 1982 to 2015 caused by greening and warming. Agric. For. Meteorol. 279:107701. doi: 10.1016/j.agrformet.2019.107701
Oishi, A. C., Miniat, C. F., Novick, K. A., Brantley, S. T., Vose, J. M., and Walker, J. T. (2018). Warmer temperatures reduce net carbon uptake, but do not affect water use, in a mature southern Appalachian forest. Agric. For. Meteorol. 252, 269–282. doi: 10.1016/j.agrformet.2018.01.011
Paca, V. H. D. M., Espinoza-Dávalos, G. E., Hessels, T. M., Moreira, D. M., Comair, G. F., and Bastiaanssen, W. G. M. (2019). The spatial variability of actual evapotranspiration across the Amazon river basin based on remote sensing products validated with flux towers. Ecol. Process 8:6. doi: 10.1186/s13717-019-0158-8
Parida, B. R., and Buermann, W. (2014). Increasing summer drying in North American ecosystems in response to longer nonfrozen periods. Geophys. Res. Lett. 41, 5476–5483. doi: 10.1002/2014GL060495
Perugini, L., Caporaso, L., Marconi, S., Cescatti, A., Quesada, B., De Noblet-Ducoudré, N., et al. (2017). Biophysical effects on temperature and precipitation due to land cover change. Environ. Res. Lett. 12:053002. doi: 10.1088/1748-9326/aa6b3f
Pielke, R. A. (2005). Land use and climate change. Science 310, 1625–1626. doi: 10.1126/science.1120529
Pongratz, J., Reick, C. H., Raddatz, T., and Claussen, M. (2010). Biogeophysical versus biogeochemical climate response to historical anthropogenic land cover change. Geophys. Res. Lett. 37, 1–5. doi: 10.1029/2010GL043010
Poon, P. K., and Kinoshita, A. M. (2018). Spatial and temporal evapotranspiration trends after wildfire in semi-arid landscapes. J. Hydrol. 559, 71–83. doi: 10.1016/j.jhydrol.2018.02.023
Qu, Y., and Zhuang, Q. (2019). Evapotranspiration in North America: implications for water resources in a changing climate. Mitig. Adapt. Strateg. Glob. Chang. 25, 205–220. doi: 10.1007/s11027-019-09865-6
Rimkus, E., Briede, A., Jaagus, J., Stonevicius, E., Kilpys, J., and Viru, B. (2018). Snow-cover regime in Lithuania, Latvia and Estonia and its relationship to climatic and geographical factors in 1961-2015. Boreal Environ. Res. 23, 193–208.
Rimkus, E., Stonevicius, E., Kilpys, J., MacIulyte, V., and Valiukas, D. (2017). Drought identification in the eastern Baltic region using NDVI. Earth Syst. Dyn. 8, 627–637. doi: 10.5194/esd-8-627-2017
Ruiz-Pérez, G., and Vico, G. (2020). Effects of temperature and water availability on Northern European Boreal Forests. Front. For. Glob. Chang. 3:34. doi: 10.3389/ffgc.2020.00034
Running, S., Mu, Q., Zhao, M., and Moreno, A. (2019). MOD16A2GF MODIS/Terra Net Evapotranspiration Gap-Filled 8-Day L4 Global 500 m SIN Grid V006 [Data set]. NASA EOSDIS Land Processes DAAC. Available online at: https://doi.org/10.5067/MODIS/MOD16A2GF.006 (accessed March 30, 2020).
Samaniego, L., Thober, S., Kumar, R., Wanders, N., Rakovec, O., Pan, M., et al. (2018). Anthropogenic warming exacerbates European soil moisture droughts. Nat. Clim. Chang. 8, 421–426. doi: 10.1038/s41558-018-0138-5
Sen, P. K. (1968). Estimates of the regression coefficient based on kendall’s tau. J. Am. Stat. Assoc. 63, 1379–1389.
Sena, J. A., de Deus, L. A. B., Freitas, M. A. V., and Costa, L. (2012). Extreme events of droughts and floods in amazonia: 2005 and 2009. Water Resour. Manag. 26, 1665–1676. doi: 10.1007/s11269-012-9978-3
Seneviratne, S. I., Nicholls, N., Easterling, D., Goodess, C. M., Kanae, S., Kossin, J., et al. (2012). Changes in climate extremes and their impacts on the natural physical environment. Manag. Risks Extrem. Events Disasters Adv. Clim. Chang. Adapt. Spec. Rep. Intergov. Panel Clim. Chang. 9781107025, 109–230. doi: 10.1017/CBO9781139177245.006
Silva Junior, C. H. L., Almeida, C. T., Santos, J. R. N., Anderson, L. O., Aragão, L. E. O. C., and Silva, F. B. (2018). Spatiotemporal rainfall trends in the Brazilian legal Amazon between the years 1998 and 2015. Water 10, 1–16. doi: 10.3390/w10091220
Spera, S. A., Galford, G. L., Coe, M. T., Macedo, M. N., and Mustard, J. F. (2016). Land-use change affects water recycling in Brazil’s last agricultural frontier. Glob. Chang. Biol. 22, 3405–3413. doi: 10.1111/gcb.13298
Sriwongsitanon, N., Suwawong, T., Thianpopirug, S., Williams, J., Jia, L., and Bastiaanssen, W. (2020). Validation of seven global remotely sensed ET products across Thailand using water balance measurements and land use classifications. J. Hydrol. Reg. Stud. 30:100709. doi: 10.1016/j.ejrh.2020.100709
Sy, S., and Quesada, B. (2020). Anthropogenic land cover change impact on climate extremes during the 21st century. Environ. Res. Lett. 15:034002. doi: 10.1088/1748-9326/ab702c
Teuling, A. J., De Badts, E. A. G., Jansen, F. A., Fuchs, R., Buitink, J., Van Dijke, A. J. H., et al. (2019). Climate change, reforestation/afforestation, and urbanization impacts on evapotranspiration and streamflow in Europe. Hydrol. Earth Syst. Sci. 23, 3631–3652. doi: 10.5194/hess-23-3631-2019
Van den Besselaar, E. J. M., Klein Tank, A. M. G., and Buishand, T. A. (2013). Trends in European precipitation extremes over 1951-2010. Int. J. Climatol. 33, 2682–2689. doi: 10.1002/joc.3619
Van Der Schrier, G., Van Den Besselaar, E. J. M., Klein Tank, A. M. G., and Verver, G. (2013). Monitoring European average temperature based on the E-OBS gridded data set. J. Geophys. Res. Atmos. 118, 5120–5135. doi: 10.1002/jgrd.50444
Velpuri, N. M., Senay, G. B., Singh, R. K., Bohms, S., and Verdin, J. P. (2013). A comprehensive evaluation of two MODIS evapotranspiration products over the conterminous United States: Using point and gridded FLUXNET and water balance ET. Remote Sens. Environ. 139, 35–49. doi: 10.1016/j.rse.2013.07.013
Vourlitis, G. L., de Souza Nogueira, J., de Almeida Lobo, F., and Pinto, O. B. (2014). Variations in evapotranspiration and climate for an Amazonian semi-deciduous forest over seasonal, annual, and El Niño cycles. Int. J. Biometeorol. 59, 217–230. doi: 10.1007/s00484-014-0837-1
Wang, H., Xiao, W., Zhao, Y., Wang, Y., Hou, B., Zhou, Y., et al. (2019). The spatiotemporal variability of evapotranspiration and its response to climate change and land use/land cover change in the three gorges reservoir. Water 11:1739. doi: 10.3390/w11091739
Zha, T., Barr, A. G., van der Kamp, G., Black, T. A., McCaughey, J. H., and Flanagan, L. B. (2010). Interannual variation of evapotranspiration from forest and grassland ecosystems in western canada in relation to drought. Agric. For. Meteorol. 150, 1476–1484. doi: 10.1016/j.agrformet.2010.08.003
Zhang, Y., Peña-Arancibia, J. L., McVicar, T. R., Chiew, F. H. S., Vaze, J., Liu, C., et al. (2016). Multi-decadal trends in global terrestrial evapotranspiration and its components. Sci. Rep. 6, 1–12. doi: 10.1038/srep19124
Keywords: Baltic region, climate change, evapotranspiration, remote sensing, land use and land cover change
Citation: Montibeller B, Jaagus J, Mander Ü and Uuemaa E (2021) Evapotranspiration Intensification Over Unchanged Temperate Vegetation in the Baltic Countries Is Being Driven by Climate Shifts. Front. For. Glob. Change 4:663327. doi: 10.3389/ffgc.2021.663327
Received: 02 February 2021; Accepted: 06 April 2021;
Published: 29 April 2021.
Edited by:
James Blande, University of Eastern Finland, FinlandReviewed by:
Sanjiv Kumar, Auburn University, United StatesMiguel Portillo-Estrada, University of Antwerp, Belgium
Copyright © 2021 Montibeller, Jaagus, Mander and Uuemaa. This is an open-access article distributed under the terms of the Creative Commons Attribution License (CC BY). The use, distribution or reproduction in other forums is permitted, provided the original author(s) and the copyright owner(s) are credited and that the original publication in this journal is cited, in accordance with accepted academic practice. No use, distribution or reproduction is permitted which does not comply with these terms.
*Correspondence: Bruno Montibeller, bruno.montibeller@ut.ee
†ORCID: Bruno Montibeller, 0000-0002-5250-8450; Jaak Jaagus, 0000-0002-6617-9125; Ülo Mander, 0000-0003-2340-6989; Evelyn Uuemaa, 0000-0002-0782-6740