 Brian K. Lohman
 Natalie C. Steinel
 Jesse N. Weber1,3
 Daniel I. Bolnick
- 1Department of Integrative Biology, The University of Texas at Austin, Austin, TX, United States
- 2Department of Medical Education, Dell Medical School, The University of Texas at Austin, Austin, TX, United States
- 3Division of Biological Sciences, The University of Montana, Missoula, MT, United States
Heritable population differences in immune gene expression following infection can reveal mechanisms of host immune evolution. We compared gene expression in infected and uninfected threespine stickleback (Gasterosteus aculeatus) from two natural populations that differ in resistance to a native cestode parasite, Schistocephalus solidus. Genes in both the innate and adaptive immune system were differentially expressed as a function of host population, infection status, and their interaction. These genes were enriched for loci controlling immune functions known to differ between host populations or in response to infection. Coexpression network analysis identified two distinct processes contributing to resistance: parasite survival and suppression of growth. Comparing networks between populations showed resistant fish have a dynamic expression profile while susceptible fish are static. In summary, recent evolutionary divergence between two vertebrate populations has generated population-specific gene expression responses to parasite infection, affecting parasite establishment and growth.
Introduction
Helminths are a diverse group of parasitic worms, which often establish long lasting infections in their vertebrate hosts (1), despite host immune activity. Curiously, in many host-parasite systems, helminths can persist in some host genotypes, whereas other hosts successfully eliminate infections. Therefore, a key question in biology is, why does parasite resistance differ among host individuals or populations? Host resistance depends on a complex signaling cascade, starting with the detection of pathogen molecules or pathogen induced damage to host tissues, followed by activation of a diverse suite of innate and adaptive immune cell populations. These cells may proliferate, migrate, or produce molecules that signal to other immune cells or directly attack the parasite. If the infection is cleared, the host must downregulate this costly response (1–4). Natural genetic variation in host resistance could arise from any stage(s) in an immune cascade.
Classically, the search for genes important to host immunity has been conducted in the lab using a combination of forward genetic experiments and screens for abnormal phenotypes (5, 6). Such approaches typically identify genes in which natural or induced mutations lead to loss of immunological function. In contrast, natural selection provides a powerful genetic screen for alleles that confer adaptive benefits within the complex ecological milieu in which wild vertebrates have evolved and currently live, including diverse stresses and coinfections (7, 8). Isolated host populations are often exposed to distinct local parasite species or genotypes, and consequently evolve divergent immune traits. Spatially varying coevolution thus leads to adaptive geographic variation in host genotypes and corresponding immune traits (9, 10). In contrast to lab knock-out screens, this natural genetic variation is more likely to entail genes whose alleles confer a change or gain of immune function. Loss of function is of course also a possibility, if parasites exploit a given host trait, or if a trait confers insufficient benefits to warrant its costs. By identifying these evolutionarily labile genes, biologists seek to understand the genetic and immunological mechanisms of vertebrate resistance to, and coevolution with, helminth parasites. The genes identified in this manner will be of interest not only for what they tell us about the basic biology of host parasite interactions but also as a possible source of new therapeutic strategies for controlling parasitic infections or manipulating vertebrate immunity (11, 12).
One way to identify genes favored by natural selection is to look for evolution of gene expression in response to infection. Recent advances in sequencing technology and genetic mapping have made this an accomplishable goal (13, 14). Previous studies have uncovered variation in gene expression associated with disease in rat, mouse, and human populations (15–18), but few studies have used wild populations (19–22). These studies are often underpowered, as the historically high cost of RNAseq library prep and sequencing limited biological replication (23). Few studies of variation in disease in wild populations have included more than a single population (20) or considered the effect of exposure on those individuals who did not ultimately become infected. Finally, linking changes in gene expression to host immune function requires concurrent measurement of multiple immune phenotypes, which are also missing from the majority of existing studies of wild populations of hosts. Here, we seek to close these gaps by testing the effect of exposure or infection on gene expression, using a large number of individuals from two populations with independent evidence of immune trait divergence.
We tested whether host genotype and infection status alter host gene expression, using the threespine stickleback fish (Gasterosteus aculeatus) and its native cestode parasite Schistocephalus solidus as a model host-parasite system. The cestode’s eggs are deposited into freshwater via bird feces, then hatch and are consumed by copepods, which are in turn consumed by stickleback (their obligate host). Cestodes mature only in sticklebacks’ peritoneum, then mate inside the gut of piscivorous birds. This life cycle can be recapitulated in the lab, permitting controlled genetic crossing (24) and controlled infections among host or parasite genotypes. There is naturally occurring variation in cestode infection rates among stickleback populations throughout their native range (25, 26). This is mirrored by differences in expression of a selected few immune genes, between wild caught stickleback from six populations, and between wild caught fish with vs. without cestodes (27, 28).
Recently, Weber et al. (26) identified natural populations of stickleback with dramatically different resistance to S. solidus. Marine stickleback, which resemble the likely ancestral state for modern freshwater populations, rarely encounter the cestode because its eggs do not hatch in brackish water. These fish genotypes are therefore highly susceptible to infection in laboratory exposure trials. When marine stickleback colonized post-glacial freshwater lakes, they encountered cestodes and evolved increased resistance to infection by cestodes (26).
However, not all derived freshwater populations are equally resistant. On Vancouver Island in British Columbia, Gosling Lake (Gos) stickleback are heavily infected by cestodes (50–80% of fish, per year, from 10 years of observations). In contrast, the cestode is absent in stickleback from nearby Roberts Lake (Rob) over the same period of time (18 km away) (29). The first host (copepods) and terminal hosts (piscivorous birds, mostly loons, and mergansers) are common in both lakes. Diet data from both lakes shows that Rob and Gos fish consume copepods at an equal rate (29, 30). The difference in infection rates is therefore not likely to be merely ecological. Accordingly, Weber et al. (29) used experimental infections to confirm that Rob fish are more resistant to infection than Gos fish. In the lab, cestodes infect Rob and Gos stickleback at statistically indistinguishable rates, but Rob fish greatly reduce cestode growth (by two orders of magnitude). Rob fish are able to subsequently kill established cestodes by initiating peritoneal fibrosis which sometimes leads to the formation of a cyst and cestode death. While the mechanism underlying this cestode growth suppression and killing is uncertain, potential correlates are suggestive. Lab-reared Rob fish (or, F1 hybrids with a Rob dam, i.e., mother) have a higher granulocyte:lymphocyte ratio following infection. In Rob fish, a higher fraction of the granulocytes generate reactive oxygen species (ROS), and these constitutively produce more ROS than cells from Gos fish. ROS is thought to damage the cestode tegument, and ROS production was negatively correlated with cestode growth. This higher ROS production by Rob fish is constitutive rather than induced by infection (29).
Given the immune phenotypes that differ between Rob and Gos stickleback, we hypothesized that these populations would exhibit constitutive and infection-induced differences in gene expression. Furthermore, we expected these differences to involve differential expression of immune genes, particularly those involved in ROS production and fibrosis. To test these hypotheses, we quantified gene expression of head kidneys from lab-reared Rob and Gos stickleback from three treatments: control, exposed but uninfected, and infected by S. solidus. We tested for: (i) genes whose expression differs constitutively between populations, (ii) genes which are involved in general responses to cestodes shared by both host populations, and (iii) genes whose expression depends on the interaction between host population and infection status. Genes whose expression depends on an interaction between population and infection status are prime candidates for explaining how these populations respond differently to cestodes, ultimately resulting in significantly different parasite burdens. Additionally, we tested for correlations between modules of coexpressed genes and immune phenotypes (e.g., ROS production or granulocyte:lymphocyte ratio). The number of correlated suites of genes and their correlations with various immune phenotypes can give insight into pathway level phenotypes for further study. In particular, we wish to know whether cestode establishment and cestode growth are correlated with similar or different gene expression modules, implying a shared or separate immunological cause.
Results and Discussion
We measured gene expression of the head kidney, the major site of immune cell differentiation, using TagSeq, an RNAseq method that focuses on the 3′ end of transcripts (31). We connected these results to prior work on ROS production and cell population characterization (29). We further described these cell culture results with new flow cytometry analysis, and correlated ratios of cell sub-populations with TagSeq measurements of gene expression.
Populations Differ in Expression of Genes Underlying Divergent Immune Phenotypes
Our negative binomial linear models (see Materials and Methods) identified 643 genes that were differentially expressed as a function of stickleback population (Wald, p < 0.1 after 10% FDR correction; 361 genes after 5% FDR. See Table 1 for summary statistics.). These main effects of population represent genes whose expression differs constitutively between populations (regardless of infection status). Because these differences occur in lab-raised fish, they represent heritable between-population differences in RNA abundance. Because we measured gene expression from the entire head kidney, expression differences could reflect evolved changes in gene regulation per cell, changes in cell population composition, or both. A caveat is that because we used first-generation lab-reared fish, we are as yet unable to rule out maternal or other epigenetic effects. However, comparison of Rob, Gos, and reciprocal F1 hybrids revealed little evidence for maternal effects on infection outcomes or immune traits (with the exception of granulocyte:lymphocyte ratio) (29). So, we consider maternal effects unlikely for most of the differentially expressed genes documented here.
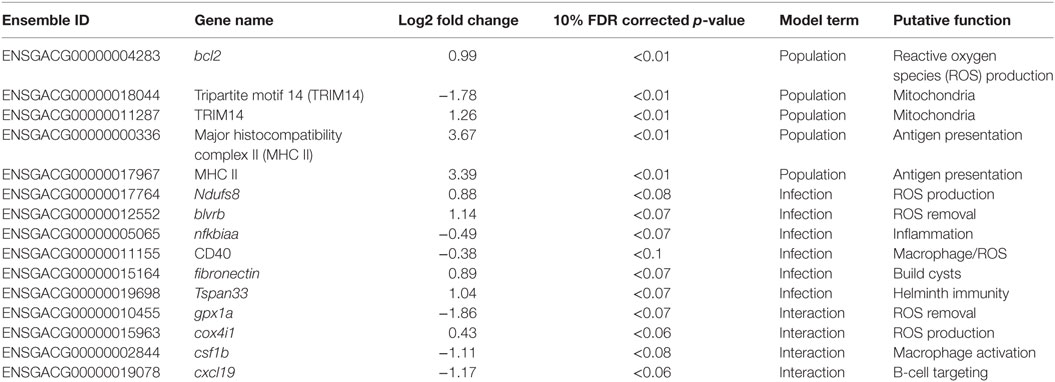
Table 1. Candidate genes; Ensembl IDs, gene names, log2 fold changes, 10% FDR corrected p-values, term in the model for which they are significant, putative function, and interpretation.
Previous studies have considered the effect of genotype on changes in stickleback immune gene expression in controlled lab infection experiments. However, these results are conflated with other factors such as environment (i.e., comparing wild-caught lake, stream, and estuary stickleback) and multiple exposures to parasites (27). Host genotype was also considered in an experimental infection of honeybees, revealing significant host genotype effects on both gene expression and infection phenotypes (32). Furthermore, host genotype effects could be potentially very important in mosquito-malaria interactions, including a unique example of dual-species trancriptomics (33). Clearly host genotype effects in macroparasite infection are worthy of future study.
Gene ontogeny (GO) showed that these differentially expressed genes are significantly enriched for several categories related to mitochondrial respiration, which can affect ROS production (Figure 1, cellular components, Mann–Whitney U-test). Rob lake fish also have higher expression of B-cell lymphoma 2 (bcl2, ENSGACG00000004283, log2foldchange = 0.99, Wald p < 0.01 after 10% FDR correction), a mitochondrial membrane protein which mediates the release of ROS-producing cytochrome C into the cell and promotes cell survival in the presence of oxidative stress (34). We observed significant differences in expression of two copies of another mitochondrial adaptor, tripartite motif 14 (TRIM14). Surprisingly, expression of each gene copy changes in opposite direction between the two host populations (ENSGACG00000018044: log2fold change = −1.78, Wald p < 0.01 after 10% FDR correction, ENSGACG00000011287: log2fold change = 1.26, Wald p < 0.01 after 10% FDR correction). TRIM14 is part of the innate immune system (35) and shows signatures of balancing selection among other populations of stickleback (36). While the majority of differences in TRIM14 expression are constitutive population effects, there is a single copy that depends on an interaction between population and infection status (see below). Together, the population differences in ROS-associated gene expression support our observation of significantly greater ROS production in Rob stickleback. It is important to note that these genes are differentially expressed between populations regardless of infection status, consistent with prior observations that ROS production is constitutive, insensitive to infection status (29).
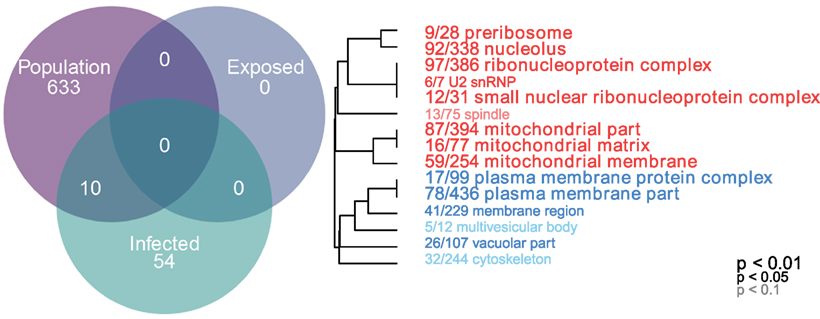
Figure 1. Linear modeling reveals differences between populations and by infection status (all genes p < 0.1 after 10% FDR correction). Genes which are differentially expressed between Rob and Gos are enriched for mitochondrial respiration (cellular components, Mann–Whitney U-test, p < 0.01 after 10% FDR correction). GO categories in red are upregulated in Rob fish, while blue indicates downregulated, relative to Gos. Numbers indicate genes present in category/total genes in category. Text size indicates statistical significance of GO term enrichment among differentially-expressed genes. See Figure S1 in Supplementary Material for molecular function and biological processes.
Major histocompatibility complex II (MHC II) is a key element of the adaptive immune system, involved in pathogen recognition. Regardless of infection status, Rob fish have higher MHC II expression than do Gos fish, for two different copies of MHC II (ENSGACG00000000336: log2fold change = 3.67, Wald p < 0.01 after 10% FDR correction, ENSGACG00000017967: log2fold change = 3.39, Wald p < 0.01 after 10% FDR correction). This difference in transcript abundance could be due to changes in the relative abundance of antigen-presenting cells (APCs) such as macrophages, which express MHC II (37). To explore this possibility, we used another statistical model to determine whether variance-stabilized expression of each MHC copy covaried with the proportion of granulocytes (as opposed to lymphocytes, described in Figure 2) in a head kidney primary cell culture, controlling for population and infection status. Rob fish have relatively more granulocytes when infected (29), so we expected a positive correlation between MHC II expression and granulocyte production. Instead, the correlation was negative (ENSGACG00000000336: β = −0.0262, t = −1.76 ENSGACG00000017967: β = −0.022, t = −1.98). Our working model to explain this result is that Rob fish have constitutively higher abundance of MHC II in their head kidneys because they have higher numbers of APCs regardless of infection status. When challenged by cestodes, Rob fish initiate a strong innate immune response, expanding the granulocyte population, but not APCs. This infection-dependent proliferation of non-APC granulocytes may dilute the relative abundance of MHC transcript, resulting in the observed negative correlation between MHC and granulocyte abundance.
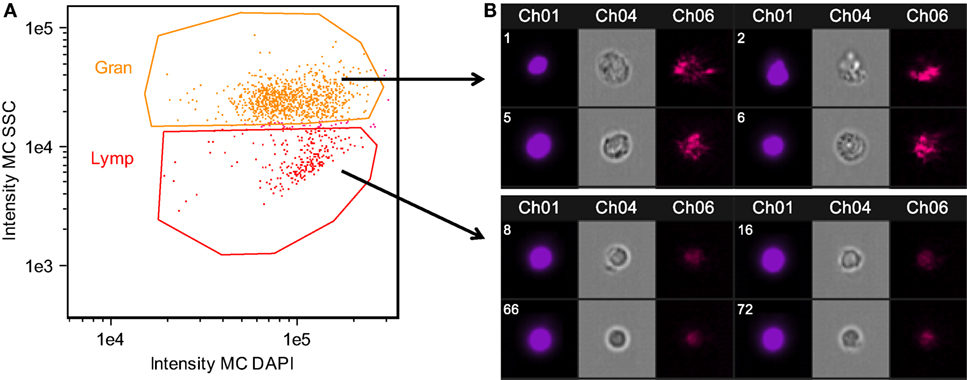
Figure 2. Confirmation of granulocyte and lymphocyte identity confirmed using Amnis imaging flow cytometry. Side scatter (SSC) high cells were morphologically consistent with granulocytes, while SSC low cells were consistent with lymphocytes. Head kidney leukocytes were permeabilized and stained with DAPI. (A) Singlet, DAPI+ cells were divided into granulocyte and lymphocyte populations based on SSC. (B) Representative images of cells within the granulocyte and lymphocyte gates. Chanel 1: DAPI nuclear stain, Chanel 4: bright field, Chanel 6: SSC.
Previous work has focused on the role of MHC allelic variation in stickleback–parasite interaction, resistance, and local adaptation (38–40). However, most of this work centers on MHC allelic composition and its correlation to infection and growth phenotypes (as a proxy for fitness). Many fewer studies quantify expression of MHC alleles. One study noted increased expression of MHC II in wild fish which were more heavily parasitized, especially when MHC allele diversity was low (39). However, only a single population of fish was considered, so our discovery of significant effect of population (Rob vs. Gos) on MHC II expression is therefore novel. It is important to note that copy number variation may complicate this result. Previous sequencing efforts have suggested that stickleback have between four and six copies of MHC II throughout their genome (41–43). Because TagSeq does not sequence the entirety of the mRNA, we cannot distinguish all MHC haplotypes present in individual fish. It is therefore possible that differences in expression of the two variants described here is due to altered regulation of only particular alleles or paralogs. Poor annotation is also a problem, but because the identity of a read is based on mapping in a relatively conserved region of the mRNA, we believe we have captured the broad patterns at play.
Infection Changes Gene Expression but Exposure Does Not
Surprisingly, no genes differed between control vs. exposed-but-uninfected fish (Wald, p < 0.1 after 10% FDR correction). This could be because resistant fish quickly mounted a response to the cestode, eliminated the parasite, and then downregulated immune function by our 42-day sample date. Or, early-acting resistance to the cestode may involve physical or chemical barriers to entry that entail constitutive gene expression or non-genetic effects (e.g., gut epithelial mucous, protective symbiotic bacteria, etc). Finally, early-stage infections may induce localized immune responses in the intestinal epithelium or peritoneum that are not reflected in systemic responses that are measured by head-kidney gene expression.
Once the cestode establishes in the peritoneum, however, it induces some shared changes in gene expression of all host genotypes. We identified 64 genes that were differentially expressed between control and infected fish (Wald, p < 0.1 after 10% FDR correction), across both host genotypes. Several of these genes are promising candidates because of their known role in host immunity. For example, infected fish increase expression of ndufs8, a component of complex I which is the main ROS producer in cells (ENSGACG00000017764: log2fold change = 0.88, Wald p < 0.08 after 10% FDR correction) (44). Other subunits of complex I are more highly expressed in Rob fish regardless of infection status, consistent with their higher constitutive production of ROS. Therefore, ndufs8 may be particularly important in regulating the production of ROS in response to infection, because it is the only complex I subunit upregulated upon infection. ROS are reduced when they act on their targets, and the raw materials can be recycled through the biliverdin/billiruben redox cycle (45). Infected fish from both populations have higher levels of blvrb (biliverden reductase B), one of the two enzymes in this ROS-recycling system (ENSGACG00000012552: log2fold change = 1.14, Wald p < 0.07 after 10% FDR correction). This upregulation should facilitate removal of ROS that may limit damage to host tissues, or facilitate subsequent ROS production.
Another important aspect of ROS-based immunity is the associated inflammation. Infected fish have decreased expression of nfkbiaa (nuclear factor kappa light polypeptide gene enhancer in B-cell inhibitor alpha a), which interacts with NF-kB to suppress inflammation (ENSGACG00000005065: log2fold change = −0.49, Wald p < 0.07 after 10% FDR correction). Nfkbiaa inhibits the pro-inflammatory NF-kB by either preventing NF-kB proteins from entering the nucleus, where they are active, or by blocking NF-kB transcription factor binding sites. NF-kB activation by TNFa or LPS reverses this binding and allows NF-kB to activate expression of pro-inflammatory genes (46). Thus, decreased nfkbiaa expression suggests an increased inflammatory response following successful infection.
Infected fish also have a slight decrease in expression of CD40 (ENSGACG00000011155: log2foldchange = −0.38, Wald p < 0.1), a co-stimulatory molecule expressed on dendritic cells, macrophages, and B-cells, which activates T- and B-cells (37). Previous studies have suggested that helminths could potentially suppress stickleback adaptive immunity (47), and the downregulation of CD40 is one plausible mechanism. Alternatively, fish with inherently lower CD40 expression may be more susceptible to infection. This raises a broader question that we are not yet able to answer, but which warrants further study: to what extent are the expression differences between infected and control fish a result of host immune response or parasite immune suppression? One plausible approach might be to measure gene expression in both host and parasite simultaneously and model host expression as a function of parasite expression and vice versa.
CD40 expression is not limited to immune cells, but can also be expressed in fibroblasts (48), so its precise function in stickleback infection by cestodes is unclear. This dual role is intriguing because fibroblast activation is associated with the formation of fibrotic cysts that encapsulate cestodes (49). These cysts likely restrict cestode movement and concentrate ROS while limiting damage to host tissues. Recall that this is a population specific defense, exhibited by Rob but not Gos fish (29), and in this statistical contrast the effect of population is averaged. In addition to changes in CD40, our linear model identified an increase of expression of fibronectin in infected Rob fish, which contributes to fibrinogen production to build cysts (3, 50) (ENSGACG00000015164: log2fold change = 0.89, Wald p < 0.07 after 10% FDR correction).
Adaptive immune system genes also respond to cestode infection. Tspan33 has recently been shown to be a marker for activated B-cells in vertebrates (51, 52). The presence of activated B-cells indicates the host immune system has recognized the parasite and is actively mounting a defense. In our study, infected fish show higher levels of tspan33 compared to controls (ENSGACG00000019698: log2fold change = 1.04, Wald p < 0.07 after 10% FDR correction). Increased expression of tspan33 in infected fish is consistent with increased activation of B-cells, an integral part of the adaptive immune response.
Population Dependent Expression Supports Prior Observations of Divergent Immune Phenotypes
The higher resistance to S. solidus infection in Rob compared to Gos stickleback could be due to constitutive differences in gene expression (as documented above), or differences in the induced immune response to infection. The latter can be detectable via interactions between host genotype and infection status. Linear modeling results identified 16 genes significant for this interaction (Wald p < 0.1 after 10% FDR correction). Most of these genes are known to affect the immune traits that Weber et al. (29) already showed are divergent between Rob and Gos fish. For example, glutathione peroxidase 1a (gpx1a) is an enzyme that degrades hydrogen peroxide, a type of ROS, into glutathione and water (53). Expression of gpx1a in Gos fish increases upon infection and therefore should tend to decrease the amount of ROS (hydrogen peroxide) available to defend against cestodes (ENSGACG00000010455: log2foldchange = −1.86, Wald p < 0.07 after 10% FDR correction). We speculate that this proactive downregulation upon infection might be a tolerance response to mitigate autoimmune damage by Gos fish, which are commonly infected and therefore might not be able to tolerate a strong ROS response. The cytochrome c complex produces ROS (53), and we see increased expression of Cytochrome c oxidase subunit IV (cox4i1) in Rob fish that are infected, while Gos fish decrease expression (ENSGACG00000015963: log2foldchange = 0.43, Wald p < 0.06 after 10% FDR correction). These gene expression data are consistent with our phenotypic data showing that Rob fish have more ROS-producing macrophages than Gos fish, and more ROS per cell. This cox4il upregulation in Rob fish may be amplified by population differences in bcl2 (see above). Oddly, we do not observe a significant infection-induced increase in ROS production in fish of either genotype. This discrepancy may reflect our head-kidney cell-culture based ROS assay, which does not rule out changes in ROS in vivo or in other tissues.
The one contrary result involves colony stimulating factor 1b (csf1b), a paralog of csf1/mcsf, a well-studied regulator of monocytes in mammals (54). csf1 increases the production of head kidney leukocytes (which includes granulocytes) in trout (Oncorhynchus mykiss)(55). In our study, csf1b is downregulated in infected Rob fish even though they have more granulocytes relative to either Gos fish or to uninfected Rob fish (ENSGACG00000002844: log2foldchange = −1.11, Wald p < 0.08 after 10% FDR correction). This discrepancy may be resolved by recognizing that we examined a single time point post-exposure. It is likely that Rob fish initially increase csf1b or another gene to drive expansion of the granulocyte population that we observe after infection. The downregulation of csf1b 42 days after infection could be a homeostatic mechanism to suppress further macrophage proliferation, after they already reached sufficient abundance. Further time series analyses would be necessary to resolve this hypothesis.
Finally, adaptive immune system genes also exhibit population specific responses to infection. Activated B-cells are critical to mounting an adaptive immune response, and they are targeted by various cytokines (37). When challenged by cestodes, Rob fish increase expression of C-X-C motif chemokine ligand 19 (cxcl19). In contrast, cestode infection reduces cxcl19 expression in Gos fish, which otherwise exhibit constitutively higher expression than Rob fish (ENSGACG00000019078: log2foldchange = −1.17, Wald p < 0.06 after 10% FDR correction; Figure 2). Ligands with this motif induce migration of leukocytes (56). Literature on cxcl19 is rare, but it has been suggested that the zebrafish cxcl19 gene is orthologous to Il-8, a major mediator of leukocyte migration to sites of inflammation (55). Regardless of whether cxcl19 is involved specifically leukocyte trafficking to sites inflammation or increasing migration of leukocytes in the absence of inflammation, both of these immune mechanisms could play an important role in defense against cestodes.
Network Analysis Suggests Two Traits: Establishment and Growth
We tested for correlations between patterns of gene expression and immune/cestode phenotypes using weighted gene co-expression network analysis (WGCNA). WGCNA provides an unbiased data-driven hierarchical clustering of genes with similar expression patterns, thereby reducing the number of genes under consideration (reduced multiple test correction) and identifying functionally similar gene modules which can be used for further statistical analysis (57). WGCNA is a more appropriate analysis for incorporating additional immune phenotype data that was collected during the infection experiment not only because of its continuous nature (vs. the categorical predictors of population and infection status) but also because the correlation between suites of co-expressed genes and traits is estimated independently for each trait, rather than simultaneously (as under the linear modeling framework), resulting in lower unexplained variance to be assigned to other traits. We used a two-step process, first looking for general pathways and subsequent correlations to phenotypes by using all samples to construct a signed network. Second, we tested for genotype-dependent network structure and module-trait correlation by building signed networks for each population of stickleback. The latter case may be especially pertinent if the regulation of gene expression plays a strong role in the genotype dependent response to infection. To explore this, we calculated module similarity between the Rob and Gos signed networks as the fraction of genes shared between any two given modules.
When all samples were combined to build a single signed coexpression network, WGCNA analysis revealed modules that were correlated with host population, ROS production, infection status, number of cestodes, total cestode mass, density of cells in host head kidney, frequency of granulocytes/lymphocytes, fraction of cells gated into various subpopulations including precursors, myeloid, and eosinophils, and finally, host families (data not shown, but this highlights the need to include family as a nested factor in the linear modeling of DESeq2).
Population differences are mainly captured by the turquoise, green, magenta, and greenyellow modules, with lesser contributions by the blue and red modules (Figure 3). These population-dependent modules have connections to population-dependent phenotypes such as ROS production. For example, top kME genes (those genes which most strongly represent a module) in the turquoise modules (positive correlation with Rob) include ROS producing cytochrome c oxidase genes and ROS recycling gpx1a (Figure 4). Together, we would expect the action of these genes to increase ROS levels. As expected, the turquoise module has a positive correlation with ROS production (r = 0.36, p = 2e–4, Figure 3).
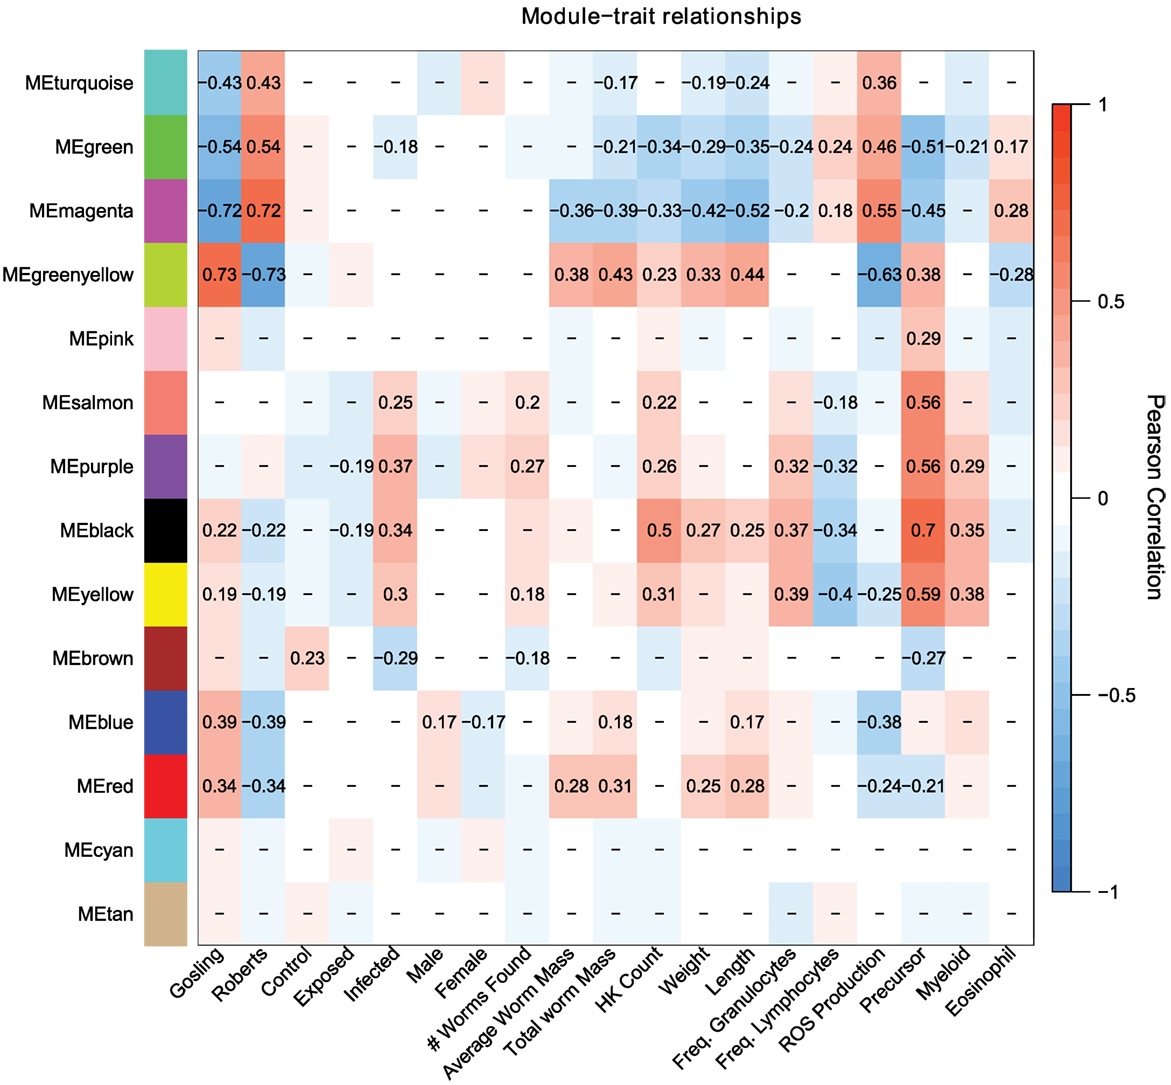
Figure 3. Weighed coexpression gene network analysis suggest that host response to cestodes involves two traits, the initial immune response (salmon, purple, black, yellow, brown) and the control over parasite growth (magenta and greenyellow). Each cell indicates the correlation between the module and a given trait. Correlations with p-values greater than 0.1 are omitted.
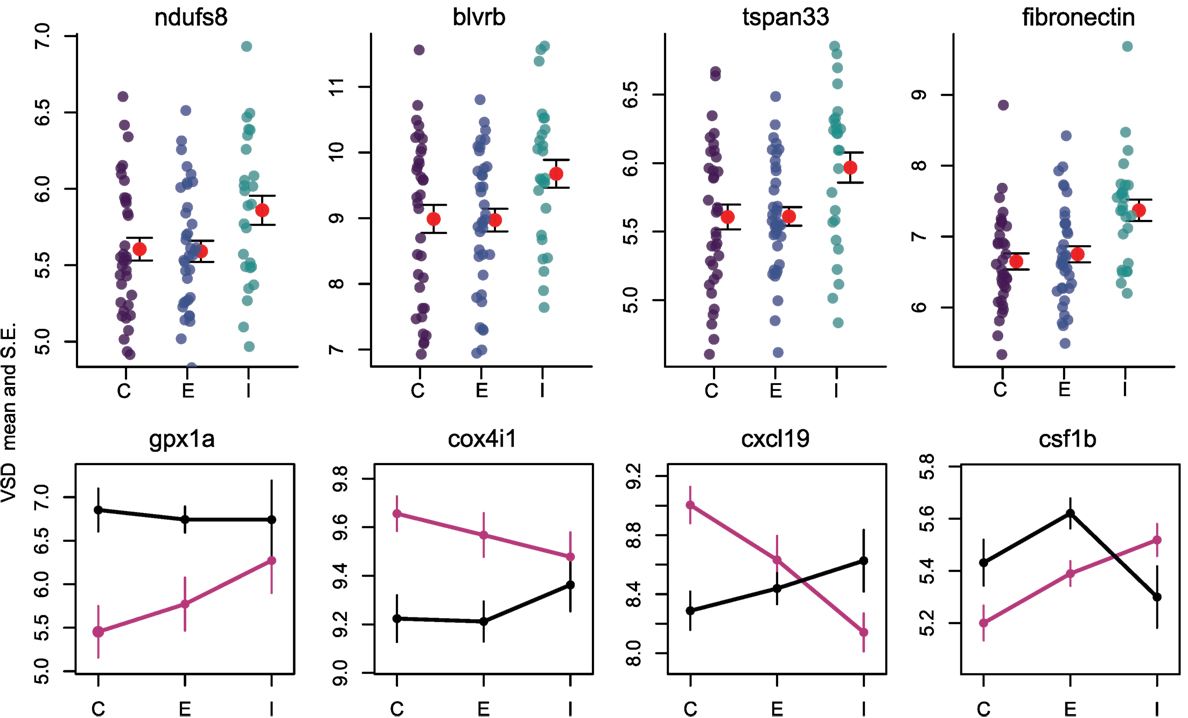
Figure 4. Reactive oxygen species production and B cells respond to infection by cestodes, both in a population independent, and dependent manner. Y axis is variance stabilized count data, the product of log transforming and library size correcting raw gene counts. For upper row, purple, blue, and teal points indicate individuals, while red points and fences indicate mean and SE. C, control; E, exposed; I, infected. Black lines are Rob and magenta lines are Gos.
Some module-trait correlations reinforce prior inferences about the immunological basis of stickleback resistance to the cestode. For example, the black module has modest to strong correlations with infection status, cell population phenotypes including density of all cells, precursors, and myeloids but is not correlated to ROS production (r = 0.13, p = 0.2, Figure 3). In contrast, the magenta and greenyellow modules are correlated with ROS production and also with cestode size, but much less so with cell population phenotypes and not at all with infection status (Figure 3). These observations imply that stickleback prevention of cestode establishment, and suppression of cestode growth, entail two distinct immune pathways (innate response and ROS production, respectively).
The magenta module has a modest, but strongly significant correlation to the fraction of cells that are eosinophils (r = 0.28, p = 0.005). A recent review highlighted the importance of eosinophils in host-helminth interactions. Specifically, at the site of host tissue damage, eosinophils are primed by fibronectin, and produce a variety of proteins which are toxic to helminths. Furthermore, the diversity of eosinophil cell surface receptors makes them central to mediate the inflammation response. Finally, helminths appear to have a number of anti-eosinophil proteins which both evade and dampen host response to the presence of helminths (58).
Constructing separate signed coexpression networks for each population reveals dramatic differences in network structure. Using the same construction parameters for each population, the Rob network resembles the combined population network, showing strong module-trait correlations for worm size, cell population phenotypes, ROS production, and sex across many different modules. In stark contrast, the Gos network is much more static, with only a subset of traits which were previously significant correlated to a single module. Overall, Gos fish have many fewer total modules and correlations between modules and traits are much weaker. To estimate relationships between networks, we calculated module similarity between every pair of Rob and Gos modules by shared gene membership. Broadly, large modules in Gos are split into many smaller modules in Rob. Thus, we conclude that there are two possible outcomes: (1) the Rob fish have evolved a more modular and dynamic repertoire of expression with which to fend off cestodes, or (2) the Gos fish evolved to maintain constitutive gene expression in response to cestodes, instead adopting a tolerance strategy (See Figures S2–10 in Supplementary Material for additional details on shared and population specific signed networks, and module similarity heat map).
Our WGCNA results confirm observed population differences in immune function and patterns of gene expression in the linear modeling. Furthermore, they support our hypothesis that there are two traits involved in stickleback resistance to cestodes: (1) innate immune response to prevent cestode establishment and (2) limiting worm growth once cestodes become established. These two traits separate into distinct modules of gene expression, each enriched for genes with immunological function matching a priori expectations. This two-trait perspective refines the question of variation in cestode prevalence among stickleback populations by focusing attention to both early and late stage infection. Future studies will be needed to describe the full time-series of gene expression as exposure and infection proceeds in these study populations, and to establish directionality of the interaction between cestodes and stickleback. While others have argued that cestodes are the primary drivers of coevolution (47), only by sequencing both host and parasite mRNAs can we hope to detail this interaction at the molecular level. Host genotype by parasite genotype interactions offers a promising opportunity for further study. Such GxG interaction was recently described in the stickleback-cestode system, but only documented growth phenotypes, and no attempt to describe the genetic basis for such traits has been made (59). We maintain that this type of study provides a means to identify evolutionarily labile genes, which underlie beneficial shifts in immune function across the geographic mosaic of host-parasite coevolution.
Summary
Using a large scale controlled laboratory infection experiment, we find changes in gene expression between two host populations, and as a function of infection status. For a smaller portion of genes, the expression response to infection differed between the two host populations. These findings are consistent with observations of host immune function in the same infection experiment (29). ROS production and recycling, B cell activation and targeting, and fibrosis appear to play important roles in stickleback defense against cestodes. Our analysis also suggests that host resistance involved two components; response to challenge by cestodes, and control over cestode growth. Furthermore, differences in coexpression networks between populations suggest that either Rob fish have evolved a more elaborate expression profile or that Gos fish are shutting down expression to tolerate cestodes. Our results not only suggest a mechanistic link between host immune phenotypes and candidate genes, but also provide the foundation for studying the direct effects of host alleles on parasite fitness.
Materials and Methods
We obtained mRNA from the head kidneys of stickleback from three experimental groups: unexposed controls (N = 16 and 19, Rob and Gos fish, respectively), exposed but ultimately uninfected stickleback (N = 21 and 16), or exposed and infected (N = 17 and 9) fish. Tissues from the latter two groups were harvested 42 days post exposure. A brief summary is presented below, but see Weber et al. (29) for full experimental methods. We focus on expression in head kidneys as it is the major site of immune cell development in fish (47, 60–62), and head kidney cell cultures were used to measure immune function independently of gene expression (stickleback have two head kidneys).
Summary of Breeding and Infection As Described in Weber et al. (29)
Weber et al. (29) generated 17 pure Rob and 16 pure Gos families by in vitro fertilization of wild caught parents. F1 fish were raised to adulthood. Members of each family were either sham exposed or exposed to cestodes via uninfected/infected copepods, respectively. Infection and screening of copepods was done by hand in a laboratory setting. After exposure, fish were grown for 42 days before being euthanized. For the present study, we subsampled from these fish, attempting to balance both population and infection status. We incorporated at least one individual from each treatment per family. Our final sample sizes (TagSeq libraries post outlier removal) are: Gos: Control: 19, Exposed: 21, Infected: 17, across 11 families. Rob: Control: 16, Exposed: 16, Infected: 9 across, 8 families (detailed in Table S1 in Supplementary Material).
Sample Collection, Sequence Library Construction, and Analysis of Flow Cytometry Data
Briefly, head kidneys were dissected from stickleback; one head kidney was used for flow cytometry (measuring ROS and describing cell populations) and the other was preserved in RNAlater at −20°C. Detailed protocols can be found in Weber et al. (29). From the stored head kidney, RNAseq libraries were constructed according to Lohman et al. (31). This method focuses sequencing effort on short “tags” adjacent to the poly-A tail of mRNAs rather than distributing sampling effort across the entire mRNA as in traditional RNAseq. Samples were sequenced on the Illumina HiSeq 2500 at the Genome Sequence and Analysis Facility at the University of Texas at Austin, producing ~6.7M raw reads per sample. See Weber et al. (29) for full ROS and flow cytometry methods. Flow cytometry data were analyzed using FlowJo software (Treestar). Granulocyte and lymphocyte populations were defined based linear forward scatter (FSC) and side scatter (SSC) gating described in Weber et al. (29). Precursor, myeloid, lymphoid, and eosinophil populations were defined using linear FSC and logarithmic SSC gating as described in Wittamer et al. (63).
Bioinformatics
TagSeq reads were processed (removal of PCR duplicates, adapter contamination, and average base quality score –n 20) according to the iRNAseq pipeline (64) using version 79 of the stickleback transcriptome from Ensemble. Resulting genes were filtered for mean counts greater than 1 among all samples, producing 9077 genes among all samples. Transcriptome annotations were based on the UniProtKB database (http://www.uniprot.org/help/uniprotkb) and followed previously described procedures (64). Code for the iRNAseq pipeline can be found here: https://github.com/z0on/tag-based_RNAseq. Code for the annotation pipeline can be found here: https://github.com/z0on/annotatingTranscriptomes.
Statistical Analysis with DESeq2
We scanned for outliers using arrayQualityMetrics (65) and removed one sample because of insufficient read depth (final N = 98). To test for differential gene expression, we used the following model in DESeq2:
where Yij is the count of gene i in individual j, βPopulation is a fixed effect with two levels: Rob and Gos, βInfectionStatus is a fixed effect with three levels: control, exposed (but not infected), and infected, and full-sibling families are nested within populations. βBatch is the lane on which samples were sequenced. An additional predictor βSex was included for genes when appropriate (lower AIC score) and improved the model fit of 839 genes total. We fit the full model (including sex) to all genes and then extracted only the 839 that were improved by the addition of sex and looked for significant p values for main effects and interactions. With the full model, 67 of these “sex improved” genes were significantly different between populations. No genes were significant for either exposure or infection, and one gene was significant for the interaction of population and infection status (myosin 5ab, ENSGACG00000006025: log2foldchange = 2.98, Wald p = 0.07). All p-values were multiple test corrected using 10% FDR (Benjamini–Hochberg). Although fish from the controlled infection experiment were exposed to three different parasite genotypes (each family exposed to only one parasite genotype), we are only interested in the host response to any parasite, and therefore average across parasite genotypes by simply not including this as a term in our linear model.
GO with GO_MWU
We used the Mann–Whitney U test for GO analysis. This approach has been described (66) and the code for analysis can be found here: https://github.com/z0on/GO_MWU.
Weighted Coexpression Gene Network Analysis
Raw read counts were normalized using limma (67) for input into WGCNA (57). All genes included in the post filter data were included in the WGCNA analysis. Following the walkthrough in Langfelder and Horvath (57), we built a signed network with a soft thresholding power of 7, and a minimum module size of 30 genes. Following dynamic tree cut, we merged modules with greater than 80% similarity, producing 14 modules. We separated Rob and Gos samples and repeated this process with the same parameters.
Caveats and Limitations
Our study flips the traditional search for immune candidate genes from inbred lab strains to wild populations, using historical natural selection as a tool to screen for changes in gene expression associated with parasite infection. While our host-parasite model system is powerful, it does have some limitations. The reference genome is of generally good quality but annotation is lacking (approximately 22.5% of the entries in the stickleback genome are either unnamed or labeled as novel genes). Thus, GO analysis is performed after assigning GO accession terms by BLAST homology, rather than functional verification, a common solution for non-model systems. The features of the stickleback genome may be missing potentially interesting immunological genes which are sufficiently diverged from human or mouse genes and therefore may be unannotated. In particular, the number and location of MHC II paralogs remains uncertain, illustrating need for genome sequence improvement. With respect to MHC II in particular, the unknown number of gene copies in the populations of interest may potentially complicate our estimates of gene expression.
Our linear modeling with DESeq2 employs appropriate FDR correction, but we choose to accept higher than “standard” p-values associated with LFC because of the direct connection between candidate genes and independently observed immune phenotypes. If, for example, we had not measured immune phenotypes, we would not accept log2 fold changes in expression with associated p-values greater than 0.05 but less than 0.1. Furthermore, we chose a very low base min mean filter because we have high confidence in detecting lowly expressed genes (31). We also wished to include more genes in our enrichment analysis and this also detracts from our power due to multiple test correction. We accordingly accept slightly larger than normally allowed p-values. Our TagSeq based approach has been shown to be at least as good as total RNAseq methods (having an equal or higher correlation between observed and known values of a spike in control) but does not account for splice variants or copy number variation, which may be potentially important in the evolution of immune responses.
Our study used tissue from a single organ (head kidneys) for both gene expression and immune phenotype measures. Head kidneys are a crucial hematopoetic organ in fish, but analysis of other tissues may produce different results. Moreover, head kidneys contain multiple immune cell populations that we are unable to sort effectively for cell-type-specific expression studies. We do use cell population counts (proportion granulocytes vs. lymphocytes) as a covariate, which as noted for MHC weakly contributes to expression variation of a few genes. But, lacking monoclonal antibodies to many immune cell receptors in stickleback, we cannot readily distinguish among finer subdivisions of cell types. This resource limitation, typical of most non-model organisms, limits our ability to statically detect effects of cell population composition on expression.
Data Archival Location
Instructions for accessing the code for analysis and plotting, and raw sequence data from UT Austin’s permanent data archive are located in supplementary materials.
Author Contributions
BL built, sequenced, and analyzed TagSeq libraries. NS and JW provided samples, flow cytometry data, and comments on analysis and interpretation of results. BL and DB wrote the manuscript with comments from NS and JW. All authors approved the final version.
Conflict of Interest Statement
The authors declare that the research was conducted in the absence of any commercial or financial relationships that could be construed as a potential conflict of interest.
Acknowledgments
This work was supported by the Howard Hughes Medical Institute (DB). We thank John Lovell and Marie Strader for helpful comments during data analysis and writing.
Supplementary Material
The Supplementary Material for this article can be found online at http://journal.frontiersin.org/article/10.3389/fimmu.2017.01071/full#supplementary-material.
References
1. Maizels RM, Balic A, Gomez-Escobar N, Nair M, Taylor MD, Allen JE. Helminth parasites – masters of regulation. Immunol Rev (2004) 201(1):89–116. doi:10.1111/j.0105-2896.2004.00191.x
2. Maizels RM, Yazdanbakhsh M. Immune regulation by helminth parasites: cellular and molecular mechanisms. Nat Rev Immunol (2003) 3(9):733–44. doi:10.1038/nri1183
3. Anthony RM, Rutitzky LI, Urban JF, Stadecker MJ, Gause WC. Protective immune mechanisms in helminth infection. Nat Rev Immunol (2007) 7(12):975–87. doi:10.1038/nri2199
4. Gause WC, Wynn TA, Allen JE. Type 2 immunity and wound healing: evolutionary refinement of adaptive immunity by helminths. Nat Rev Immunol (2013) 13(8):607–14. doi:10.1038/nri3476
5. Beutler B, Jiang Z, Georgel P, Crozat K, Croker B, Rutschmann S, et al. Genetic analysis of host resistance: toll-like receptor signaling and immunity at large. Annu Rev Immunol (2006) 24:353–89. doi:10.1146/annurev.immunol.24.021605.090552
6. Beutler B, Du X, Xia Y. Precis on forward genetics in mice. Nat Immunol (2007) 8(7):659–64. doi:10.1038/ni0707-659
7. Beraldi D, McRae AF, Gratten J, Pilkington JG, Slate J, Visscher PM, et al. Quantitative trait loci (QTL) mapping of resistance to strongyles and coccidia in the free-living Soay sheep (Ovis aries). Int J Parasitol (2007) 37(1):121–9. doi:10.1016/j.ijpara.2006.09.007
8. Schielzeth H, Husby A. Challenges and prospects in genome-wide quantitative trait loci mapping of standing genetic variation in natural populations. Ann N Y Acad Sci (2014) 1320(1):35–57. doi:10.1111/nyas.12397
9. Eizaguirre C, Lenz TL, Kalbe M, Milinski M. Rapid and adaptive evolution of MHC genes under parasite selection in experimental vertebrate populations. Nat Commun (2012) 3:621. doi:10.1038/ncomms1632
10. Stutz WE, Bolnick DI. Natural selection on MHC IIβ in parapatric lake and stream stickleback: balancing, divergent, both or neither? Mol Ecol (2017). doi:10.1111/mec.14158
11. Geary TG, Thompson DP, Klein RD. Mechanism-based screening: discovery of the next generation of anthelmintics depends upon more basic research. Int J Parasitol (1999) 29(1):105–12. doi:10.1016/S0020-7519(98)00170-2
12. Geary TG, Sakanari JA, Caffrey CR. Anthelmintic drug discovery: into the future. J Parasitol (2015) 101(2):125–33. doi:10.1645/14-703.1
13. Cookson W, Liang L, Abecasis G, Moffatt M, Lathrop M. Mapping complex disease traits with global gene expression. Nat Rev Genet (2009) 10(3):184–94. doi:10.1038/nrg2537
14. Pasaniuc B, Price AL. Dissecting the genetics of complex traits using summary association statistics. Nat Rev Genet (2016) 18(2):117–27. doi:10.1038/nrg.2016.142
15. Hubner N, Wallace CA, Zimdahl H, Petretto E, Schulz H, Maciver F, et al. Integrated transcriptional profiling and linkage analysis for identification of genes underlying disease. Nat Genet (2005) 37(3):243–53. doi:10.1038/ng1522
16. Barrett JC, Hansoul S, Nicolae DL, Cho JH, Duerr RH, Rioux JD, et al. Genome-wide association defines more than 30 distinct susceptibility loci for Crohn’s disease. Nat Genet (2008) 40(8):955–62. doi:10.1038/ng.175
17. Emilsson V, Thorleifsson G, Zhang B, Leonardson AS, Zink F, Zhu J, et al. Genetics of gene expression and its effect on disease. Nature (2008) 452(7186):423–8. doi:10.1038/nature06758
18. Wijayawardena BK, Minchella DJ, DeWoody JA. The influence of trematode parasite burden on gene expression in a mammalian host. BMC Genomics (2016) 17(1):600. doi:10.1186/s12864-016-2950-5
19. Hawley DM, Altizer SM. Disease ecology meets ecological immunology: understanding the links between organismal immunity and infection dynamics in natural populations. Funct Ecol (2011) 25(1):48–60. doi:10.1111/j.1365-2435.2010.01753.x
20. Pedersen AB, Babayan SA. Wild immunology. Mol Ecol (2011) 20(5):872–80. doi:10.1111/j.1365-294X.2010.04938.x
21. Viney M, Lazarou L, Abolins S. The laboratory mouse and wild immunology. Parasite Immunol (2015) 37(5):267–73. doi:10.1111/pim.12150
22. Huang Y, Chain FJ, Panchal M, Eizaguirre C, Kalbe M, Lenz TL, et al. Transcriptome profiling of immune tissues reveals habitat-specific gene expression between lake and river sticklebacks. Mol Ecol (2016) 25(4):943–58. doi:10.1111/mec.13520
23. Todd EV, Black MA, Gemmell NJ. The power and promise of RNA-seq in ecology and evolution. Mol Ecol (2016) 25(6):1224–41. doi:10.1111/mec.13526
24. Schärer L, Wedekind C. Lifetime reproductive output in a hermaphrodite cestode when reproducing alone or in pairs: a time cost of pairing. Evol Ecol (1999) 13(4):381–94. doi:10.1023/A:1006789110502
25. MacColl ADC. Parasite burdens differ between sympatric three-spined stickleback species. Ecography (2009) 32(1):153–60. doi:10.1111/j.1600-0587.2008.05486.x
26. Weber JN, Kalbe M, Shim KC, Erin NI, Steinel NC, Ma L, et al. Resist globally, infect locally: a transcontinental test of adaptation by stickleback and their tapeworm parasite. Am Nat (2017) 189(1):43–57. doi:10.1086/689597
27. Lenz TL, Eizaguirre C, Rotter B, Kalbe M, Milinski M. Exploring local immunological adaptation of two stickleback ecotypes by experimental infection and transcriptome-wide digital gene expression analysis. Mol Ecol (2013) 22(3):774–86. doi:10.1111/j.1365-294X.2012.05756.x
28. Stutz WE, Schmerer M, Coates JL, Bolnick DI. Among-lake reciprocal transplants induce convergent expression of immune genes in threespine stickleback. Mol Ecol (2015) 24(18):4629–46. doi:10.1111/mec.13295
29. Weber JN, Steinel NC, Shim KC, Bolnick DI. Recent evolution of cestode growth suppression by threespine stickleback. Proc Natl Acad Sci U S A (2017). doi:10.1073/pnas.1620095114
30. Snowberg LK, Hendrix KM, Bolnick DI. Covarying variances: more morphologically variable populations also exhibit more diet variation. Oecologia (2015) 178(1):89–101. doi:10.1007/s00442-014-3200-7
31. Lohman BK, Weber JN, Bolnick DI. Evaluation of TagSeq, a reliable low-cost alternative for RNAseq. Mol Ecol Resour (2016) 16(6):1315–21. doi:10.1111/1755-0998.12529
32. Barribeau SM, Sadd BM, du Plessis L, Schmid-Hempel P. Gene expression differences underlying genotype-by-genotype specificty in a host-parasite system. Proc Natl Acad Sci U S A (2014) 111:3496–501. doi:10.1073/pnas.1318628111
33. Choi Y-J, Aliota MT, Mayhew GF, Erickson SM, Christensen BM. Dual RNA-seq of parasite and host reveals gene expression dynamics during filarial worm–mosquito interactions. PLoS Negl Trop Dis (2014) 8(5):e2905. doi:10.1371/journal.pntd.0002905
34. Martindale JL, Holbrook NJ. Cellular response to oxidative stress: signaling for suicide and survival. J Cell Physiol (2002) 192(1):1–15. doi:10.1002/jcp.10119
35. Zhou Z, Jia X, Xue Q, Dou Z, Ma Y, Zhao Z, et al. TRIM14 is a mitochondrial adaptor that facilitates retinoic acid-inducible gene-I-like receptor-mediated innate immune response. Proc Natl Acad Sci U S A (2014) 111(2):E245–54. doi:10.1073/pnas.1316941111
36. Hohenlohe PA, Bassham S, Etter PD, Stiffler N, Johnson EA, Cresko WA. Population genomics of parallel adaptation in threespine stickleback using sequenced RAD tags. PLoS Genet (2010) 6(2):e1000862. doi:10.1371/journal.pgen.1000862
38. Kurtz J, Kalbe M, Aeschilmann PB, Haberli MA, Wegner KM, Reusch TBH, et al. Major histocompatibility complex diversity influences parasite resistance and innate immunity in sticklebacks. Proc Biol Sci (2004) 271:197–204. doi:10.1098/rspb.2003.2567
39. Wegner KM, Kalbe M, Rauch G, Kurtz J, Schaschl H, Reusch TBH. Genetic variation in MHC class II expression and interactions with MHC sequence polymorphism in three-spined sticklebacks. Mol Ecol (2006) 15(4):1153–64. doi:10.1111/j.1365-294X.2006.02855.x
40. Lenz TL, Eizaguirre C, Kalbe M, Milinski M. Evaluating patters of convergent evolution and trans-species polymorphism at MHC immunogenes in two sympatric stickleback species. Evolution (2013) 67:2400–12. doi:10.1111/evo.12124
41. Sato A, Figueroa F, O’hUigin C, Steck N, Klein J. Cloning of major histocompatibility complex (MHC) genes from threespine stickleback, Gasterosteus aculeatus. Mol Mar Biol Biotechnol (1998) 7:221–31.
42. Reusch TB, Schaschl H, Wegner KM. Recent duplication and inter-locus gene conversion in major histocompatibility class II genes in a teleost, the three-spined stickleback. Immunogenetics (2004) 56(6):427–37. doi:10.1007/s00251-004-0704-z
43. Reusch TBH, Langefors Å. Inter- and intralocus recombination drive MHC class IIB gene diversification in a teleost, the three-spined stickleback Gasterosteus aculeatus. J Mol Evol (2005) 61(4):531–41. doi:10.1007/s00239-004-0340-0
44. Procaccio V, Depetris D, Soularue P, Mattei M-G, Lunardi J, Issartel J-P. cDNA sequence and chromosomal localization of the NDUFS8 human gene coding for the 23 kDa subunit of the mitochondrial complex I. Biochim Biophys Acta (1997) 1351(1):37–41. doi:10.1016/S0167-4781(97)00020-1
45. Barañano DE, Rao M, Ferris CD, Snyder SH. Biliverdin reductase: a major physiologic cytoprotectant. Proc Natl Acad Sci U S A (2002) 99(25):16093–8. doi:10.1073/pnas.252626999
46. Verma IM, Stevenson JK, Schwarz EM, Van Antwerp D, Miyamoto S. Rel/NF-kappa B/I kappa B family: intimate tales of association and dissociation. Genes Dev (1995) 9(22):2723–35. doi:10.1101/gad.9.22.2723
47. Scharsack JP, Koch K, Hammerschmidt K. Who is in control of the stickleback immune system: interactions between Schistocephalus solidus and its specific vertebrate host. Proc Biol Sci (2007) 274(1629):3151–8. doi:10.1098/rspb.2007.1148
48. Grewal IS, Flavell RA. CD40 and CD154 in cell-mediated immunity. Annu Rev Immunol (1998) 16(1):111–35. doi:10.1146/annurev.immunol.16.1.111
49. Zeisberg M, Strutz F, Müller GA. Role of fibroblast activation in inducing interstitial fibrosis. J Nephrol (1999) 13:S111–20.
50. Gratchev A, Guillot P, Hakiy N, Politz O, Orfanos C, Schledzewski K, et al. Alternatively activated macrophages differentially express fibronectin and its splice variants and the extracellular matrix protein βIG-H3. Scand J Immunol (2001) 53(4):386–92. doi:10.1046/j.1365-3083.2001.00885.x
51. Hevezi P, Vences-Catalan F, Maravillas-Montero JL, White CA, Casali P, Llorente L, et al. TSPAN33 is a novel marker of activated and malignant B cells. Clin Immunol (2013) 149(3):388–99. doi:10.1016/j.clim.2013.08.005
52. Perez-Martinez C, Zlotnik A, Santos-Argumedo L. Tspan33 is differentially expressed during B cell differentiation (LYM7P. 620). J Immunol (2015) 194(1 Suppl):200–12.
53. Turrens JF. Mitochondrial formation of reactive oxygen species. J Physiol (2003) 552(2):335–44. doi:10.1113/jphysiol.2003.049478
54. Akagawa KS, Komuro I, Kanazawa H, Yamazaki T, Mochida K, Kishi F. Functional heterogeneity of colony-stimulating factor-induced human monocyte-derived macrophages. Respirology (2006) 11(Suppl 1):S32–6. doi:10.1111/j.1440-1843.2006.00805.x
55. Wang T, Hanington PC, Belosevic M, Secombes CJ. Two macrophage colony-stimulating factor genes exist in fish that differ in gene organization and are differentially expressed. J Immunol (2008) 181(5):3310–22. doi:10.4049/jimmunol.181.5.3310
56. Belperio JA, Keane MP, Arenberg DA, Addison CL, Ehlert JE, Burdick MD, et al. CXC chemokines in angiogenesis. J Leukoc Biol (2000) 68(1):1–8.
57. Langfelder P, Horvath S. WGCNA: an R package for weighted correlation network analysis. BMC Bioinformatics (2008) 9(1):559. doi:10.1186/1471-2105-9-559
58. Shin MH, Lee YA, Min D-Y. Eosinophil-mediated tissue inflammatory responses in helminth infection. Korean J Parasitol (2009) 47(Suppl):S125–31. doi:10.3347/kjp.2009.47.S.S125
59. Kalbe M, Eizaguirre C, Scharsack JP, Jakobsen PJ. Reciprocal cross infection of sticklebacks with the diphyllobothriidean cestode Schistocephalus solidus reveals consistent population differences in parasite growth and host resistance. Parasit Vectors (2016) 9(1):1. doi:10.1186/s13071-016-1419-3
60. Scharsack JP, Kalbe M, Derner R, Millinski M. Modulation of granulocyte responses in three-spined sticlebacks Gasterosteus aculeatus infected with the tapeworm Schistocephalus solidus. Dis Aquat Organ (2004) 59:141–50. doi:10.3354/dao059141
61. Fischer U, Utke K, Somamoto T, Kollner B, Ototake M, Nakanishi T. Cytotoxic activities of fish leucocytes. Fish Shellfish Immunol (2006) 20(2):209–26. doi:10.1016/j.fsi.2005.03.013
62. Fischer U, Koppang EO, Nakanishi T. Teleost T and NK cell immunity. Fish Shellfish Immunol (2013) 35(2):197–206. doi:10.1016/j.fsi.2013.04.018
63. Wittamer V, Bertrand JY, Gutschow PW, Traver D. Characterization of the mononuclear phagocyte system in zebrafish. Blood (2011) 117(26):7126–35. doi:10.1182/blood-2010-11-321448
64. Dixon GB, Davies SW, Aglyamova GA, Meyer E, Bay LK, Matz MV. Genomic determinants of coral heat tolerance across latitudes. Science (2015) 348(6242):1460–2. doi:10.1126/science.1261224
65. Kauffmann A, Gentleman R, Huber W. arrayQualityMetrics—a bioconductor package for quality assessment of microarray data. Bioinformatics (2009) 25(3):415–6. doi:10.1093/bioinformatics/btn647
66. Wright RM, Aglyamova GV, Meyer E, Matz MV. Gene expression associated with white syndromes in a reef building coral, Acropora hyacinthus. BMC Genomics (2015) 16(1):371. doi:10.1186/s12864-015-1540-2
Keywords: gene expression, host–parasite, ecoimmunology, stickleback, reactive oxygen species
Citation: Lohman BK, Steinel NC, Weber JN and Bolnick DI (2017) Gene Expression Contributes to the Recent Evolution of Host Resistance in a Model Host Parasite System. Front. Immunol. 8:1071. doi: 10.3389/fimmu.2017.01071
Received: 14 June 2017; Accepted: 16 August 2017;
Published: 12 September 2017
Edited by:
Andrew Steven Flies, University of Tasmania, AustraliaReviewed by:
Katherine Buckley, George Washington University, United StatesMagdalena Chadzińska, Jagiellonian University, Poland
Copyright: © 2017 Lohman, Steinel, Weber and Bolnick. This is an open-access article distributed under the terms of the Creative Commons Attribution License (CC BY). The use, distribution or reproduction in other forums is permitted, provided the original author(s) or licensor are credited and that the original publication in this journal is cited, in accordance with accepted academic practice. No use, distribution or reproduction is permitted which does not comply with these terms.
*Correspondence: Brian K. Lohman, YnJpYW4ua2VpdGgubG9obWFuQGdtYWlsLmNvbQ==