 Markus D. Lacher1*
 Gerhard Bauer2
 Brian Fury2Sanne Graeve1Emily L. Fledderman2Tye D. Petrie2Dane P. Coleal-Bergum2Tia Hackett2Nicholas H. Perotti2Ying Y. Kong3
 William W. Kwok3Joseph P. Wagner1†
 Charles L. Wiseman1‡William V. Williams1‡
- 1BriaCell Therapeutics Corp., Berkeley, CA, United States
- 2GMP Facility, Institute for Regenerative Cures, University of California, Davis (UCD), Sacramento, CA, United States
- 3Benaroya Research Institute at Virginia Mason, Seattle, WA, United States
Targeted cancer immunotherapy with irradiated, granulocyte–macrophage colony-stimulating factor (GM-CSF)-secreting, allogeneic cancer cell lines has been an effective approach to reduce tumor burden in several patients. It is generally assumed that to be effective, these cell lines need to express immunogenic antigens coexpressed in patient tumor cells, and antigen-presenting cells need to take up such antigens then present them to patient T cells. We have previously reported that, in a phase I pilot study (ClinicalTrials.gov NCT00095862), a subject with stage IV breast cancer experienced substantial regression of breast, lung, and brain lesions following inoculation with clinical formulations of SV-BR-1-GM, a GM-CSF-secreting breast tumor cell line. To identify diagnostic features permitting the prospective identification of patients likely to benefit from SV-BR-1-GM, we conducted a molecular analysis of the SV-BR-1-GM cell line and of patient-derived blood, as well as a tumor specimen. Compared to normal human breast cells, SV-BR-1-GM cells overexpress genes encoding tumor-associated antigens (TAAs) such as PRAME, a cancer/testis antigen. Curiously, despite its presumptive breast epithelial origin, the cell line expresses major histocompatibility complex (MHC) class II genes (HLA-DRA, HLA-DRB3, HLA-DMA, HLA-DMB), in addition to several other factors known to play immunostimulatory roles. These factors include MHC class I components (B2M, HLA-A, HLA-B), ADA (encoding adenosine deaminase), ADGRE5 (CD97), CD58 (LFA3), CD74 (encoding invariant chain and CLIP), CD83, CXCL8 (IL8), CXCL16, HLA-F, IL6, IL18, and KITLG. Moreover, both SV-BR-1-GM cells and the responding study subject carried an HLA-DRB3*02:02 allele, raising the question of whether SV-BR-1-GM cells can directly present endogenous antigens to T cells, thereby inducing a tumor-directed immune response. In support of this, SV-BR-1-GM cells (which also carry the HLA-DRB3*01:01 allele) treated with yellow fever virus (YFV) envelope (Env) 43–59 peptides reactivated YFV-DRB3*01:01-specific CD4+ T cells. Thus, the partial HLA allele match between SV-BR-1-GM and the clinical responder might have enabled patient T lymphocytes to directly recognize SV-BR-1-GM TAAs as presented on SV-BR-1-GM MHCs. Taken together, our findings are consistent with a potentially unique mechanism of action by which SV-BR-1-GM cells can act as APCs for previously primed CD4+ T cells.
Introduction
In contrast to traditional chemo- or radiation therapies that kill fast-dividing cells irrespective of whether they are cancerous or normal, the goal of cancer immunotherapy is to eliminate malignant cells based on their antigenic makeup, their tumor-associated antigens (TAAs). There are several viable ways to induce an immune response against TAAs, in part determined by whether the antigens are localized intra- or extracellularly. For instance, although chimeric antigen receptors (1, 2) and bispecific antibodies crosslinking cytotoxic T cells with cancer cells (3) rely on the antigens’ cell surface presence, ectopic T cell receptor (4), tumor-infiltrating lymphocyte (TIL) (5, 6), and vaccine-based approaches (7–18) require display of antigenic peptides by major histocompatibility complexes (MHCs), regardless of whether the peptides represent intra- or extracellular TAAs.
Whole-cell preparations with live but irradiated cancer cells express a very large number of antigens of which some may be coexpressed in the patient’s tumor(s) (19). Although a tumor shielded by an immune-suppressive microenvironment may not elicit an immune response, whole-cell preparations, if injected into immune-permissive sites, may allow development of otherwise inhibited antibody and cell-mediated immunity. However, even though an immune response induced by the injected cells may have a tumor-directed component, and even elicit tumor regression, the antigen(s) mediating this effect rarely are known.
For targeted immunotherapy studies with whole-cell preparations (also referred to as therapeutic cancer vaccines), both autologous and allogeneic cells have been applied. Autologous cancer cells, derived from the tumor of the patient to be treated, almost, per definition, are expected to express relevant antigens, including patient-specific neoepitopes. On the other hand, while allogeneic cell lines engineered to express granulocyte–macrophage colony-stimulating factor (GM-CSF) may induce strong immune responses by promoting antigen display on dendritic cells (DCs), they may lack key antigens (9, 15). With variable success, therapeutic cancer vaccines have been clinically tested against a variety of malignancies representing both hematologic and solid cancers, such as leukemia, melanoma, pancreatic, prostate, breast, lung, and colon cancers (7, 8, 10, 11, 14, 16, 18, 20–23). Notably, in a mouse model, Ogawa et al. demonstrated that a similar approach may also be suitable to prevent tumor establishment (prophylactic treatment), i.e., that whole-cell preparations may prevent the development of tumors and not solely serve to reduce the tumor burden of already existing disease (24).
We previously established a cell line from a chest wall lesion of a metastatic breast cancer patient (17). The cell line, referred to as SV-BR-1, is estrogen receptor/progesterone receptor negative and very strongly HER2/neu (ERBB2) positive (17). To enhance the cells’ immune reactivity, SV-BR-1 cells were genetically engineered to stably overexpress GM-CSF, yielding the SV-BR-1-GM cell line. Several advanced-stage cancer patients, mostly with breast cancer, were treated with irradiated (200 Gy) SV-BR-1-GM cells (16). The study employed a pretreatment step with low-dose cyclophosphamide, which has similarly been used in other studies to blunt the activity of regulatory T cells (25). Additionally, 2 and 4 days after the administration of the SV-BR-1-GM cells, interferon-alpha 2b (IFN-α2b) was injected into each inoculation site to provide an additional “danger signal” (16, 26).
In our initial round of clinical assessment, four evaluable patients completed the SV-BR-1-GM program. One subject responded to the regimen with a near-complete regression of multiple breast lesions and a complete remission of a lung metastasis but relapsed 3 months after the sixth and last cycle, with lesions in the lung, soft tissue, breast, and brain. After obtaining Food and Drug Administration (FDA) permission, treatment resumed. Consequently, a systemic response was observed whereby tumors at multiple sites, including the brain, promptly regressed (16).
Here, we describe a molecular fingerprint of SV-BR-1-GM established with samples representing developmental intermediates including master cell banks (MCBs) and drug product. We present several lines of evidence suggesting that SV-BR-1-GM cells can act as antigen-presenting cells (APCs) and thereby mount an effective tumor-directed immune response. In particular, while likely other aspects such as cross-presentation by DCs contribute to SV-BR-1-GM’s mechanism of action (MoA), our observations are consistent with a role in which SV-BR-1-GM cells express, process, and display TAAs directly to T cells. However, SV-BR-1-GM cells do not express CD80 or CD86, encoding ligands for the costimulatory receptor CD28, and are thus likely to only activate previously primed, rather than naïve, T cells.
Materials and Methods
Culturing of Cells
SV-BR-1-GM lots were manufactured in RPMI-1640 supplemented with 10% FBS and l-glutamine or Gibco GlutaMAX (Thermo Fisher Scientific, Waltham, MA, USA) (full medium). Typically, for culture expansion toward cell banks, media changes were conducted with only about 50% of new medium. For early lots, SV-BR-1-GM cells were expanded from cryopreserved cell suspensions starting from T-25 flasks with sequential propagation in larger flasks and harvesting from about thirty T-150 flasks. Current lots are expanded in 10-STACK CellSTACK Culture Chambers (Corning Inc., Corning, NY, USA). A549 cells were obtained from the American Type Culture Collection (ATCC; Manassas, VA, USA) and cultured in ATCC-formulated F-12K medium supplemented with 10% fetal bovine serum.
Microarray Gene Expression Profiling
SV-BR-1-GM cells, obtained directly from cryogenic vials following recovery from liquid nitrogen storage or harvested from cultures, were lysed in Buffer RLT (Qiagen, Valencia, CA, USA) with or without supplementation with β-mercaptoethanol. Total RNA was isolated from lysates via RNeasy Mini Kits (Qiagen) then subjected to microarray hybridization at the University of Minnesota Genomics Center (MN, USA). In short, RNA was amplified as antisense RNA and biotinylated using the Illumina™ TotalPrep™-96 RNA Amplification Kit (Thermo Fisher Scientific) according to the manufacturer’s instructions. The biotinylated antisense RNA was then hybridized onto HumanHT-12 v4 Expression BeadChip arrays (Illumina, San Diego, CA, USA) and thereafter stained with Cy3-streptavidin. Fluorescent signal intensities were acquired on an iScan array scanner (Illumina). Average signal intensities and detection p-values were calculated using GenomeStudio (Illumina). Thereafter, non-normalized data sets passing below defined quality control (QC) criteria were analyzed with various modules of GenePattern using the public server portal (http://www.broadinstitute.org/cancer/software/genepattern/) (27). If applicable, datasets to be compared were merged using the MergeColumns version 1 module. Expression levels of all Illumina samples to be cross-compared were quantile-normalized using the IlluminaNormalizer version 2 (beta) module then further processed in Microsoft Excel and/or subjected to log transformation and hierarchical clustering via the HierarchicalClustering version 6 module (distance correlation: Pearson correlation; clustering method: Pairwise average-linkage). Heat maps and dendrograms of clustered data were generated using the HierarchicalClusteringViewer version 11 module. To compare gene expression levels between SV-BR-1-GM and samples analyzed by others, Gene Expression Omnibus [(GEO); National Center for Biotechnology Information (NCBI)] (28) DataSets, also generated on the Illumina HumanHT-12 v4 Expression BeadChip platform, were merged with SV-BR-1-GM data sets and processed as described above. For the in silico analyses of GEO DataSets generated on Affymetrix Human Genome U133 Plus 2.0 Arrays, CEL files were RMA/quantile-normalized and background-subtracted using the ExpressionFileCreator module of GenePattern then filtered in Microsoft Excel as described subsequently.
A gene was defined as expressed if at least one corresponding probe yielded a quantile-normalized expression value above the median “expression” level among all human RNA-targeting, non-control, probes (max. 47323 for the HumanHT-12 v4 Expression BeadChip arrays, Illumina). This background cutoff definition coincides with the roughly 50% of genes expressed in a collection of human tissues at levels detectable by massively parallel signature sequencing in a study by Jongeneel et al. (29). However, since the tissues analyzed must have contained an unknown number of different cell types and unknown relative contributions of each cell type to the overall number of cells, this definition likely overestimates the extent of actual background. Nevertheless, consequently, it may reduce the probability of calling nonexpressed genes expressed.
QC of Non-Normalized Data Sets
The integrity of preamplified SV-BR-1-GM RNA was determined via Agilent’s 4200 TapeStation system (Agilent, Santa Clara, CA, USA). Samples with an RNA integrity number equivalent (RINe) value of less than 7.5 were excluded from further analyses. Additionally, for SV-BR-1-GM as well as samples obtained via GEO (NCBI) and processed on HumanHT-12 v.4 BeadChips, non-normalized data sets were assessed for gene expression variability. Except where stated otherwise, low-variability samples were excluded from further processing, with low-variability defined as a ratio between the expression value at the 95th and 5th, respectively, percentile of less than 10.
Sample Representation
For comparative gene expression analyses, individual genes were represented in the various SV-BR-1-GM sample types [MCB cryo, clinical product (CP) Lot IV culture, CP Lot IV 4p cryo, CP Lot IV 4p culture, CP Lot V cryo, CP Lot VIII cryo, CP Lot VIII culture 1d, CP Lot VIII culture 3d, and RES Lot II cryo] by their arithmetic means of their gene expression values. For calculations requiring one representative SV-BR-1-GM gene expression value, the median value among the arithmetic means was used. Representative gene expression levels for samples other than SV-BR-1-GM, obtained from GEO, were defined as follows: Breast cancer cell line samples from DataSet GSE48398 and human mammary epithelial cell samples (HMECs, “early proliferating” vs. “deep senescence”, treated with siGLO siRNA) from DataSet GSE56718 (30) were represented by their arithmetic means. Normal breast sample types (ALDH NEG, ALDH POS, ERBB3 NEG, NCL, BASAL, STROMAL) from DataSet GSE35399 (31) were represented by their median expression values unless stated otherwise. For DataSet GSE48398, only expression profiles from cells cultured at 37°C were utilized. For the comparison between the breast cancer (DataSet GSE2943) and the normal tissues (DataSet GSE7307), the 95th percentile values among all breast cancer tissues (HER2_3+, HER2_2+, HER2_0-1+ of GSE2943) and the 95th percentile values among the maximum expression values of each group of normal tissue (Data Sheet S1 in Supplementary Material, GSE7307) were used as comparators. The 95th percentile rather than maximum (of the max.) expression values were chosen to accommodate potential “outliers.” Cancer/testis antigen (CTA) overexpression in SV-BR-1-GM cells was defined by the following criteria: The representative CTA transcript level in SV-BR-1-GM cells was to be both >1.5 times the background cutoff value AND >1.5 times the max. transcript level among the non-cultured (NC) normal breast cell types (SV-BR-1-GM/Max), AND the max. CTA transcript level among the NC normal breast cell types was to be <1.5 times the background cutoff value, whereby the max. NC transcript level was established among the representative values of each sample type.
In Silico Identification of Putative SV-BR-1-GM TAAs
Quantile-normalized SV-BR-1-GM gene expression values were compared to those of normal human breast cells represented by the GEO DataSets GSE35399 (31), GSE56718 (30), and MCF10A from GSE48398. Genes for which the representative SV-BR-1-GM expression value was both >1.5 times the background cutoff value (defined above) and >1.5 times higher than the maximum representative value among all groups of normal breast cells were additionally subjected to the second, medium stringency, filtration step (expression level > 5 times the background cutoff value). Verification of the genes retained after medium stringency filtration was done via the quotients of the representative breast cancer samples in GSE2943 and those of the quantile-normalized and grouped normal tissues in GEO DataSet GSE7307 (high stringency filter). Groups of normal tissues are listed in Data Sheet S1 in Supplementary Material. As cutoff value for high stringency filter retention served the quotient (Breast Cancer/Normal Tissues) value for the ERBB2 Affymetrix probe 216836_s_at (quotient = 3.95): Genes of probes for which the quotient is ≥3.00 were defined as “verified.”
To assess transcript expression levels of 279 confirmed or putative CTAs (Data Sheets S4 in Supplemental Material) in SV-BR-1-GM cells in comparison to several other breast cancer cell lines and normal breast cells, GEO DataSets of both cultured [GSE56718 (30) and GSE48398 (MCF10A)] and noncultured [GSE35399 (31)] normal breast cells were utilized. The CTA genes chosen for the analysis were selected from those described by Dobrynin et al., (2013) (32) and Chapman et al. (33), those listed in the CT database (34), and those represented by the nCounter Human PanCancer Immune Profiling Panel (NanoString Technologies, Seattle, WA, USA).
Verification of Expression of Immune-Related Genes by Quantitative Reverse Transcription-Polymerase Chain Reaction (qRT-PCR), Transcript Counting (nCounter), ELISA, and Flow Cytometry
To confirm expression of immune-related genes, several methods were employed. For a subset of the genes, expression was assessed by qRT-PCR at the University of Minnesota Genomics Center (MN, USA) using commercially available TaqMan assays (Table S1 in Supplementary Data Sheet S2 in Supplementary Material) and the (nonirradiated) samples listed in Table S2 in Supplementary Data Sheet S2 in Supplementary Material, which were also assessed by microarray hybridization. Data were acquired on an ABI 7900HT real-time PCR instrument. To establish whether the immune-related genes are also expressed by irradiated SV-BR-1-GM cells from clinical formulations, cells were irradiated with 200 Gy then resuspended in Lactated Ringer’s solution (LRS) and courier-transported under temperature controlled (2–8°C) conditions from the manufacturing site (UC Davis GMP facility, Sacramento, CA, USA) to the processing laboratory in Berkeley, CA, USA. The shipping containers (Crēdo Cube™ Series 4 parcel shippers; Pelican BioThermal, Plymouth, MN, USA) were opened, 4 h and 24 h after completion of the formulation process. Samples were immediately thereafter assessed for cell viability, seeded in 6-well plates, and cultured in full medium. Supernatants (SNs) and cells were harvested from the original clinical formulations, and after 1 and 3 days of culturing. RNA (extracted via RNeasy Mini Kit; Qiagen) was subjected to nCounter-based transcript counting (NanoString Technologies) at the University of Minnesota Genomics Center with the CodeSets (probes) listed in Table S3 in Supplementary Data Sheet S2 in Supplementary Material. Using nSolver Version 4.0 (NanoString), data was background-subtracted and normalized against the system positive controls and the reference genes (ADRM1, APTX, DGUOK, GNG5, PSMA4, RPL38, TMEM14C, and UBE3C), using the geometric means for both the positive control and reference gene sets. For the background subtraction, the max. values of the system negative controls were subtracted.
To assess protein expression levels of key immune-related factors, SNs from samples derived from the 4- and 24-h-old clinical formulations were subjected to ELISA using the Human GM-CSF, IL-6, IL-8, IL-10, IL-15, and KITLG (free SCF) ELISA MAX™ Deluxe kits (BioLegend, Inc., San Diego, CA, USA).
To establish whether and to what extent human leukocyte antigen (HLA)-DRβ3 (encoded by HLA-DRB3) is expressed on the surface of irradiated SV-BR-1-GM cells, cells were subjected to a modified formulation process whereby cells, after harvesting using TrypLE Express (Thermo Fisher Scientific) and irradiation (200 Gy), were cryopreserved in CryoStor 5 (CS5) cell freeze medium (BioLife Solutions, Inc., Bothell, WA, USA) then shipped overnight, on dry ice, to the processing laboratory. To assess HLA-DR cell surface expression by flow cytometry, irradiated SV-BR-1-GM cells cryopreserved in CS5 medium as well as nonirradiated SV-BR-1-GM and A549 cells, both freshly harvested using TrypLE Express, were treated with an Fc receptor blocking agent (Human TruStain FcX™, BioLegend; used 1:20 diluted) and stained with 20 µg/ml of a FITC-conjugated anti-human HLA-DR antibody (clone L243; BioLegend) or with 20 µg/ml of a FITC-conjugated mouse IgG2a, κ isotype control antibody (clone MOPC-173; BioLegend). Stained cells were subjected to flow cytometry, whereby the data was acquired on a BD LSRFortessa™ cell analyzer using FACSDiva software (BD Biosciences, San Jose, CA, USA) and analyzed using Flowing Software version 2.5.1 (Turku Bioimaging, Finland and Turku Centre for Biotechnology, Finland; software developer: Perttu Terho).
SV-BR-1-GM Peptide Treatment and T Cell Activation
SV-BR-1-GM cells were either serum-starved for 24 h, harvested using trypsin and then irradiated (200 Gy) or cultured in full medium, harvested via trypsin and utilized without irradiation. Control human PBMCs (DRB3*01:01 and non-DRB3*01:01) were harvested from fresh whole blood. SV-BR-1-GM cells (serum-starved then irradiated or nonirradiated without serum-starvation) and control PBMCs (irradiated with 50 Gy) were treated with 1 µg/ml (final concentration) of the yellow fewer virus (YFV) Envelope (Env) 43–59 peptide (sequence: ISLETVAIDRPAEVRKV) (35) or of a varicella zoster virus (VZV) open reading frame (ORF) 68 control peptide (Sequence: IWPRNDYDGFLENAHEHHGV) and cocultured with a T cell clone recognizing YFV-DRB3*01:01 peptide-loaded MHCs (pMHCs). No wash-out step of unbound peptides was employed. Prior to coculturing, T cells were rested for 4 days. For coculturing, 50 K SV-BR-1-GM cells or control PBMCs and 50 K rested CD4+ T cells per well in 96-well format were used. IFN-γ was assessed from SNs harvested after 72 h of coculturing by ELISA employing anti-human IFN-γ clones B27 and 4S-B3 as capture and detection, respectively, antibodies (both from BioLegend), and DELFIA Europium-labeled streptavidin (PerkinElmer, Waltham, MA, USA) and DELFIA Enhancement Solution (PerkinElmer) for detection using a Perkin Elmer Wallac 1420 Victor2 Microplate Reader.
HLA Typing and Immunohistochemistry (IHC)
SV-BR-1-GM and peripheral blood cell samples were subjected to high-resolution HLA typing for HLA-A, HLA-B, and HLA-DRB3. HLA-DRβ3 expression on tumor specimens was assessed on paraffin-embedded tissues by IHC using a rabbit polyclonal antibody raised against an N-terminal region of human HLA-DRβ3 (product code ab196601; Abcam, Cambridge, MA, USA). Both HLA typing and IHC were conducted at the City of Hope (Duarte, CA, USA).
Frequencies of HLA Allele Combinations
From the allele frequencies (AFs) reported by Gragert et al. (36), estimated “phenotype frequencies” (PFs) were calculated indicating probabilities that an individual carries at least 1 of SV-BR-1-GM’s expressed HLA-A, HLA-B, or HLA-DRB3 alleles (HLA-A*24:02, HLA-B*35:08, HLA-B*55:01, HLA-DRB3*01:01, HLA-DRB3*02:02) or allele groups (HLA-A*24, HLA-B*35, HLA-B*55, HLA-DRB3*01, HLA-DRB3*02). For the following definitions, alleles and allele groups are both referred to as “alleles,” and the sums of the individual SV-BR-1-GM HLA-A, -B, and -DRB3 AFs are referred to as ΣAFHLA-A, ΣAFHLA-B, and ΣAFHLA-DRB3, respectively. The PFs were calculated as follows: PFHLA-A = 1 − (1 − ΣAFHLA-A)2, PFHLA-B = 1 − (1 − ΣAFHLA-B)2, and PFHLA-DRB3 = 1 − (1 − ΣAFHLA-DRB3)2, whereby (1-ΣAFHLA-A)2, (1-ΣAFHLA-B)2, and (1-ΣAFHLA-DRB3)2 are the probabilities that an individual does not carry at least 1 of SV-BR-1-GM’s expressed HLA-A, -B, or -DRB3, respectively, alleles (exponent = 2 since diploid, i.e., 2n). AFs used for the calculations were obtained from Gragert et al.’s supplementary data 5 and included frequencies of alleles with different designations but with amino acids identical in the antigen recognition site (Gragert et al.’s supplementary data 1) (36).
Ethics Approval and Consent to Participate
The clinical aspect of this study was conducted with US FDA and St. Vincent Medical Center institutional review board approval, and written informed patient consent was obtained (16). The clinical trial was registered under ClinicalTrials.gov Identifier NCT00095862.
Results
SV-BR-1-GM Samples Used for This Study
The SV-BR-1 cell line was established from a chest wall lesion of a female metastatic breast cancer patient. The polyclonal SV-BR-1-GM cell line was derived from SV-BR-1 cells following stable transfection with CSF2 (encoding human GM-CSF) and zeocin-selection (US7674456, Patent Application number: US 10/868,094) (16, 17) (Figure 1A). Even though additional parameters are expected to contribute to the potency of SV-BR-1-GM, we assume GM-CSF to be a major factor (15).
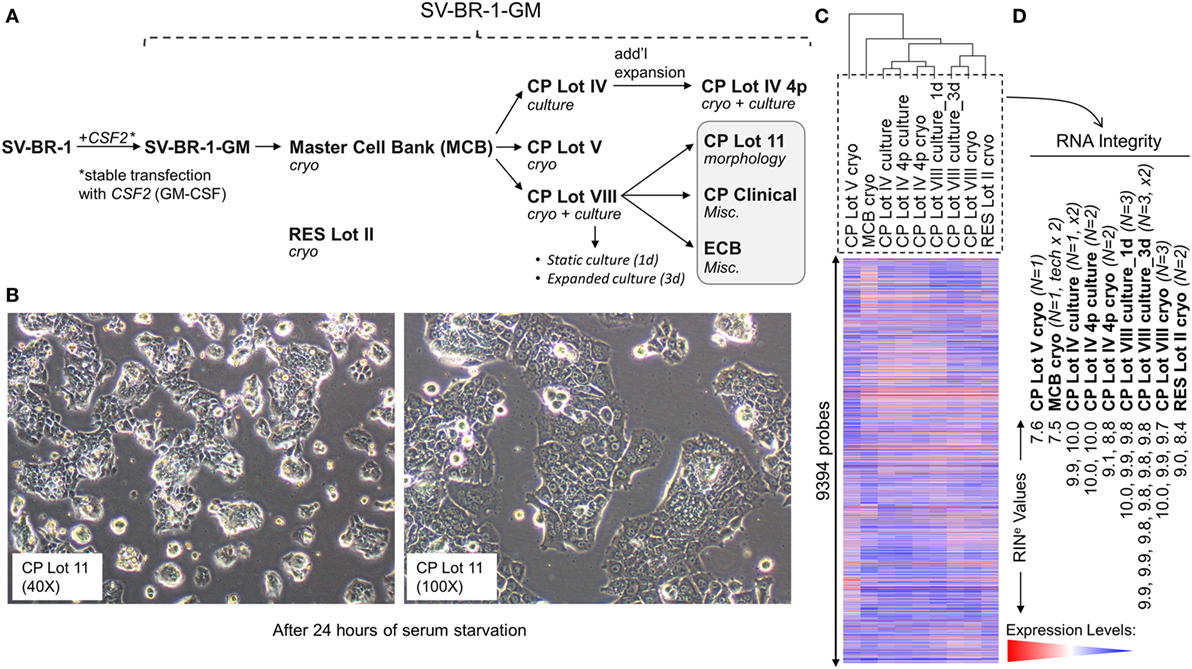
Figure 1. Development of SV-BR-1-GM. (A) The SV-BR-1-GM cell line was derived from SV-BR-1 breast cancer cells following stable transfection with CSF2 [encoding human granulocyte–macrophage colony-stimulating factor (GM-CSF)]. The SV-BR-1 cell line itself was established from a chest wall lesion of a metastatic breast cancer patient (16, 17). The depicted developmental stages of SV-BR-1-GM represent samples used for this study rather than provide a comprehensive overview of all lots generated thus far. From an original master cell bank (MCB), several “clinical product” (CP) lots for actual or potential clinical use were established. “RES Lot II” refers to a research sample type and “ECB” to an engineering cell bank. RNA for gene expression analysis was extracted from cells taken directly from cryogenic vials (“cryo”) or following a culturing step (“culture”). “CP Lot VIII” was studied both as a presumptive static culture (“1d”) and as an expanded culture (“3d”), whereby for the former, samples were harvested on the first day (t = 0), and for the latter, on the third day (t = 2, i.e., 2 days later) of a time-course assessing GM-CSF secretion (outlined in Figure S5 in Supplementary Presentation S1 in Supplementary Material). Although no culture expansion took place from seeding to t = 0 (“static culture”), cell numbers of cultures harvested at t = 2 were 1.7–3.2 times the seeding cell numbers (“expanded culture”). (B) Culture morphology of SV-BR-1-GM, as exemplified by 40× and 100× original magnifications of a culture derived from the SV-BR-1-GM Lot 11 bank following 24 h of serum starvation. Of note, SV-BR-1-GM cells may grow in monolayers but can also grow as minimally adherent, sphere-like, structures, especially when seeded at very low densities. (C,D) Quality control (QC). (C) Hierarchical clustering of SV-BR-1-GM samples based on their microarray gene expression profiles. Normalized gene expression levels of samples belonging to the same sample type were averaged (arithmetic mean) prior to clustering. (D) Only samples with a RINe value of at least 7.5 were used for this study. Note that the CP Lot V cryo sample clustered separately and did not pass the minimal variability QC metric (see Materials and Methods) and was thus excluded from additional analyses.
Granulocyte–macrophage colony-stimulating factor signaling involves GM-CSF binding to the α subunit of its receptor and recruitment of the receptor’s β subunit (37). Whereas a very restricted region in GM-CSF’s first α helix was suggested to interact with the receptor’s β subunit, several regions further downstream contact the α subunit (38). Compared to the NCBI Reference Sequence of GM-CSF (NP_000749.2), SV-BR-1-GM’s ectopic GM-CSF ORF contains some vector sequence and varies at positions 36 (Thr instead of Met) and 100 (Thr instead of Ile) of the mature GM-CSF protein sequence. However, neither Met36 nor Ile100 seems to be directly involved in receptor binding (38, 39) thus questioning whether these variations actually exert a biological effect, especially impair intracellular signaling. In agreement with signaling activity and thus GM-CSF bioactivity, cell culture SN from irradiated SV-BR-1-GM cells supported cell viability and proliferation of MUTZ-3 cells, a cell line reported to depend on cytokines such as GM-CSF (40), whereas SN from parental SV-BR-1 cells (not engineered to express GM-CSF) had at most a minimal effect (data not shown).
Since the excision of the original tumor specimen in 1999, several lots of both SV-BR-1 and SV-BR-1-GM have been manufactured. Figure 1A indicates SV-BR-1-GM samples for which gene expression profiles were generated and their genealogy. Whereas cell banks derived from the MCB (passage 8) and cryopreserved below or at around passage 20 were somewhat arbitrary designated “Clinical Product” (CP) lots, an SV-BR-1-GM sample cryopreserved at passage 30 (RES Lot II) is for this study considered a “research” sample. When used clinically following current practice, SV-BR-1 and SV-BR-1-GM cells are first serum-starved for 24 h in order to remove bovine antigens then irradiated (to abrogate cell proliferation). The serum starvation step was initially carried out prior to cryopreservation of the CP, which was irradiated upon thawing without a preceding culture step. More recently, cell banks have been cryopreserved without prior serum starvation. However, for clinical application, cells from such recent lots are thawed, short-term cultured, serum-starved, then irradiated. As demonstrated in Figure 1B, serum starvation did not obviously perturb epithelial cell morphology as evidenced by the monolayer phenotype with little or no signs of stress. On a related note, nevertheless, it is worth mentioning that at least in some instances, after seeding at (very) low densities in serum-containing medium, SV-BR-1-GM cells were found to grow as minimally adherent, sphere-like, structures. Gene expression profiles were generated on Illumina HumanHT-12 v.4 Bead Chips from RNA either directly obtained from cryopreserved cell suspensions (“cryo” tag in sample names) or from recent cultures (“culture” tag in sample names). Whereas a certain degree of gene expression variability was apparent among different SV-BR-1-GM sample types (Figure 1C), overall, all SV-BR-1-GM samples clustered together and seem to exhibit substantially different gene expression profiles than other established breast cancer cell lines as well as normal breast cell types (Figure S1 in Supplementary Presentation S1 in Supplementary Material). Samples with RNA integrity number equivalent (RINe) values of <7.5 were excluded from the analyses. Similarly, samples, such as CP Lot V cryo, failing another QC test (see Materials and Methods) were not used in further comparative analyses even if their RINe values may have been ≥7.5 (Figure 1D).
SV-BR-1-GM Expresses a Gene Signature Associated With Immunostimulatory Functions
We discovered that SV-BR-1-GM cells expressed several genes with known immune system-associated roles, for example, MHC class II-based antigen presentation by professional APCs such as DCs. Among the latter category of genes are HLA-DMA, HLA-DRA, and CD74, the latter of which giving rise to invariant chain (Ii) and class II-associated invariant chain peptide (CLIP).
To systematically address this observation, we generated a database from published reports (41–83) with 111 genes with known immunostimulatory roles (Data Sheet S3 in Supplementary Material). In particular, genes were included encoding (i) cell surface ligands for T cell costimulatory receptors or other cell surface-associated factors known to positively stimulate T cells (i.e., support T cell activation rather than inhibition), (ii) cytokines and other soluble (free) factors with positive T cell-stimulatory functions such as supporting activation, promoting survival, and/or inducing chemotaxis, (iii) factors promoting maturation, survival, chemotaxis, and/or in vitro generation of DCs, and (iv) factors promoting antigen presentation. Of the 111 genes, 22 had quantile-normalized expression levels in all SV-BR-1-GM samples of more than 1.5 times the background cutoff value (see Materials and Methods for definition), with 11 out of these 22 biomarkers expressed at levels more than five times the background cutoff value as demonstrated by at least 1 Illumina probe (Figure 2; Figures S2 and S3 in Supplementary Presentation S1 in Supplementary Material). Of note, microarray-based expression levels of HLA-DRB3, even though apparently higher than 1.5 times the background cutoff value, are not shown as we did not consider the corresponding Illumina probe (ILMN_1717261) reliable since it suggested expression in more samples than expected considering HLA-DRB3 prevalence (data not shown). Nevertheless, HLA-DRB3 does seem to be expressed in SV-BR-1-GM cells, as demonstrated by nCounter-based transcript counting (Figure 3).
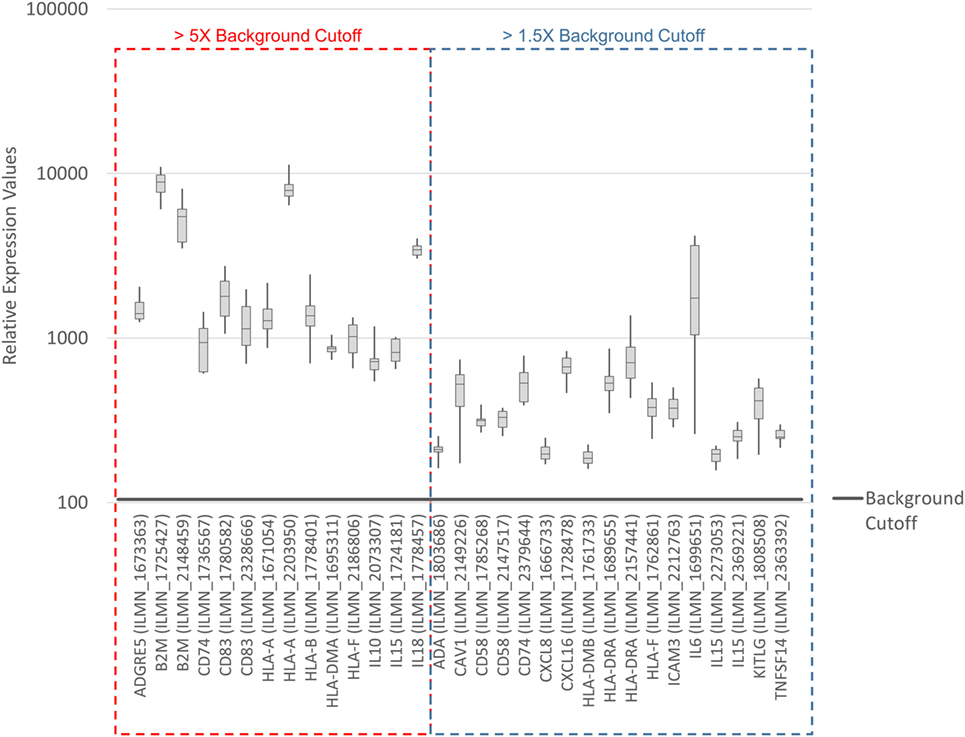
Figure 2. Microarray-based transcript levels of immunostimulatory factors expressed in SV-BR-1-GM cells. 111 genes with known immunostimulatory roles were identified in published reports (41–83) (Data Sheet S3 in Supplementary Material) and their microarray-based RNA expression levels determined. The 22 genes shown presented with transcript levels >1.5 times the background cutoff value (median quantile-normalized “expression” level, see Materials and Methods) in each of the SV-BR-1-GM samples. “Relative Expression Values” refers to quantile-normalized mRNA levels. ILMN_… refer to the Illumina probe sequence identifiers (PROBE_ID) of the probes yielding the expression levels shown.
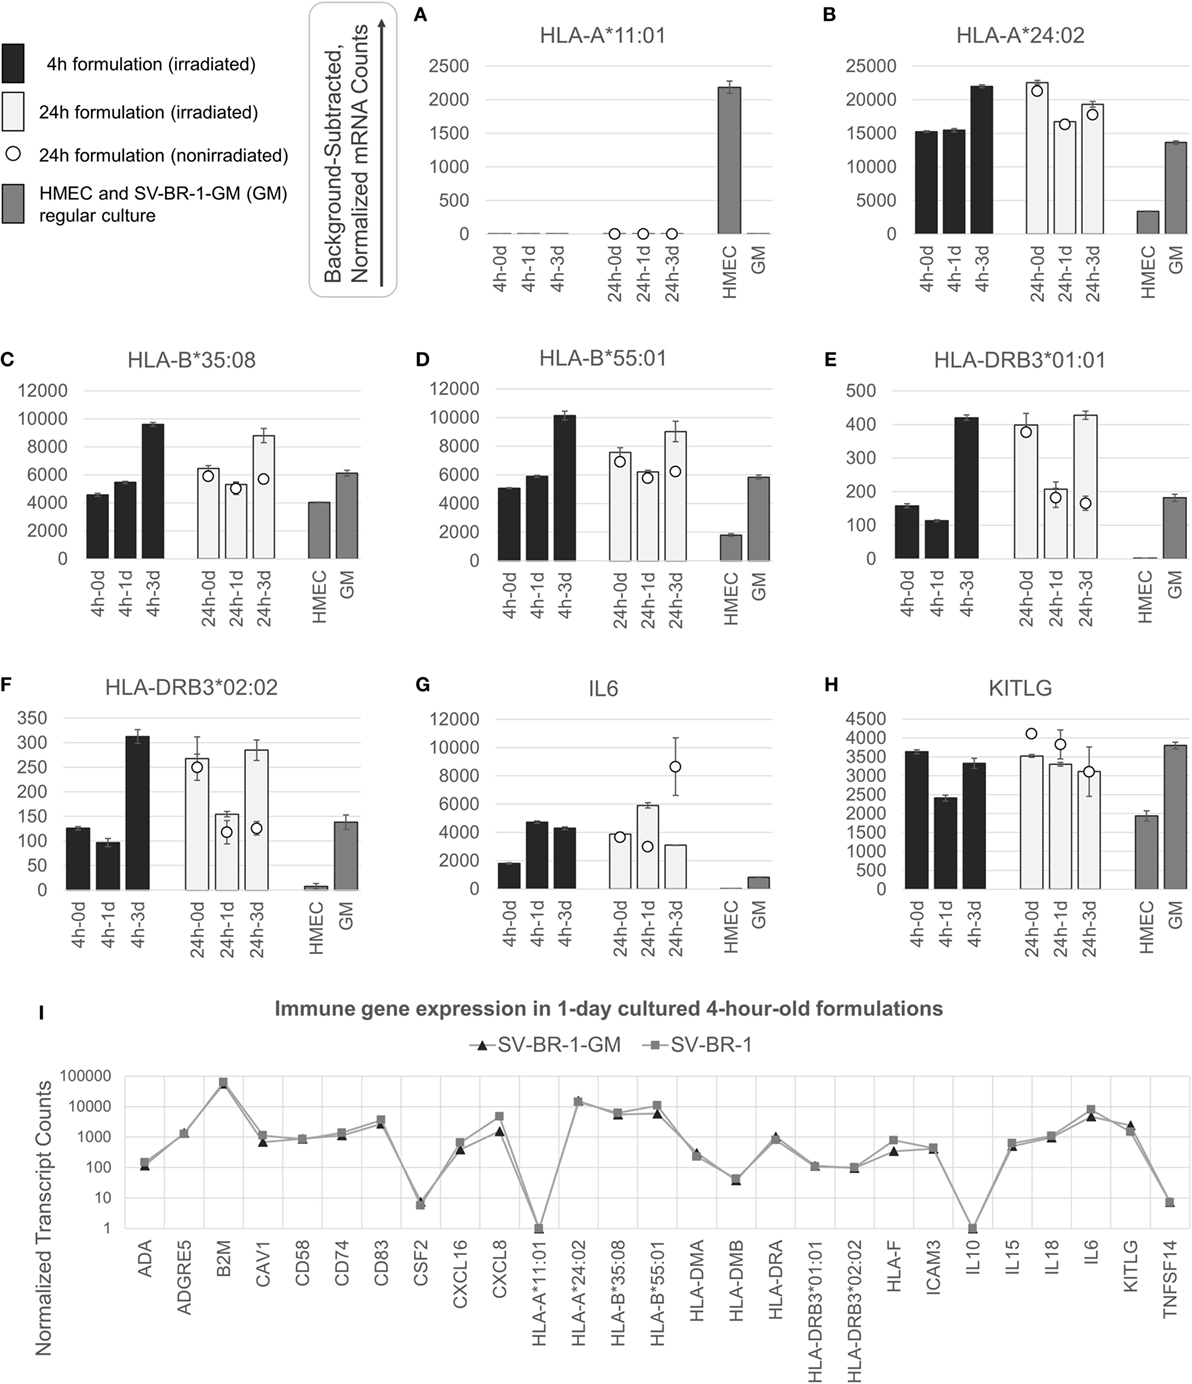
Figure 3. nCounter-based transcript levels of immunostimulatory factors expressed in irradiated and nonirradiated SV-BR-1-GM cells. SV-BR-1-GM cells from 4- and 24-h-old clinical formulations were seeded in 6-well plates and cultured in full medium. Cells were harvested after 1 day and 3 days of culturing then subjected to nCounter-based assessment of the transcript levels of a set of 24 immune-related genes (Immune Signature candidates). For the 24-h series, also nonirradiated cells resuspended in Lactated Ringer’s solution (LRS) and processed in parallel were included. In a separate experiment, transcript levels of the Immune Signature candidates were measured from nonirradiated human mammary epithelial cells (HMECs) and SV-BR-1-GM cells cultured in parallel. Shown are background-subtracted, normalized transcript levels of HLA-A, -B, and -DRB3, whereby the probes (CodeSets) were designed to distinguish between HLA-A*01:01 (A) and HLA-A*24:02 (B), HLA-B*35:08 (C) and HLA-A*55:01 (D), and HLA-DRB3*01:01 (E) and HLA-DRB3*02:02 (F); and of IL6 (G) and KITLG (H). (I) Comparison of the expression levels of the 24 immune-related genes between SV-BR-1 and SV-BR-1-GM cells by the nCounter approach. Comparing the 4-h formulations cultured for 1 day, almost identical expression profiles were obtained. Note that the values of CSF2 (encoding GM-CSF) shown indicate background or minute transcript levels of endogenous CSF2 since the nCounter ProbeSet employed did not match in sequence with the exogenous CSF2 expressed by SV-BR-1-GM. For (A–H), values shown are arithmetic means of background-subtracted, normalized transcript levels from triplicate wells ± SDs or from three aliquots per formulation ± SDs for the d0 samples. d0 denotes cells obtained from the original 4- or 24-h-old formulations and lysed without culturing. GM refers to cultured, nonirradiated SV-BR-1-GM cells not subjected to the formulation process. For (I), values shown are arithmetic means of background-subtracted, normalized transcript levels from triplicate (SV-BR-1-GM) or duplicate (SV-BR-1) wells. Values for all genes of the Immune Signature candidates are shown in Data Sheet S3 in Supplementary Material.
Among the 22 immune-related biomarkers studied, one salient and unusual finding was the expression of both MHC class I and II components such as B2M, HLA-A, HLA-B, HLA-F, HLA-E, and HLA-H (MHC class I components) (see Figure S2 in Supplementary Presentation S1 in Supplementary Material), and HLA-DMA, HLA-DRA, and CD74 (MHC class II-associated factors) (see Figures S3 and S4 in Supplementary Presentation S1 in Supplementary Material). Of note, even though HLA-E and HLA-H were strongly expressed in SV-BR-1-GM cells, they do not seem to be clearly associated with immunostimulatory roles, and therefore are not considered factors likely contributing to the clinical efficacy of SV-BR-1-GM.
Intrigued by the possibility that SV-BR-1-GM may have direct immunostimulatory effects beyond those by GM-CSF, we sought to confirm expression of several of the immune-related genes by qRT-PCR. This gene set also included HLA-DRB3 and HLA-DMB, with the latter only barely expressed at more than 1.5 times the background cutoff value but being functionally tied to HLA-DMA (84), another immunostimulatory biomarker expressed in SV-BR-1-GM cells (Figure 2). The confirmatory experiment was conducted on a subset of the SV-BR-1-GM samples used for Illumina microarray analysis and with RNA from MCF7 cells, a breast cancer cell line carrying the HLA-DRB3*02:02 allele (85) as a calibrator sample. As demonstrated in Figure S4 in Supplementary Presentation S1 in Supplementary Material, all MHC class II-related transcripts analyzed (i.e., HLA-DRA, HLA-DRB3, HLA-DMA, HLA-DMB, CD74) were not only expressed in SV-BR-1-GM cells per se but this at substantially higher levels than in MCF7 cells. Furthermore, even though SV-BR-1-GM cells were engineered to express CSF2 (encoding GM-CSF), we did not detect CSF2 transcripts by Illumina microarray gene expression profiling (data not shown). However, this finding is not surprising because the Illumina probe for CSF2 (ILMN_1661861) mapped to a sequence in the gene’s 3′ untranslated region which is not represented by SV-BR-1-GM’s ectopic CSF2 sequence. Importantly, by ELISA, we did demonstrate GM-CSF protein expression in medium conditioned by both irradiated and nonirradiated SV-BR-1-GM cells (Figure 4; Figure S5 in Supplementary Presentation S1 in Supplementary Material).
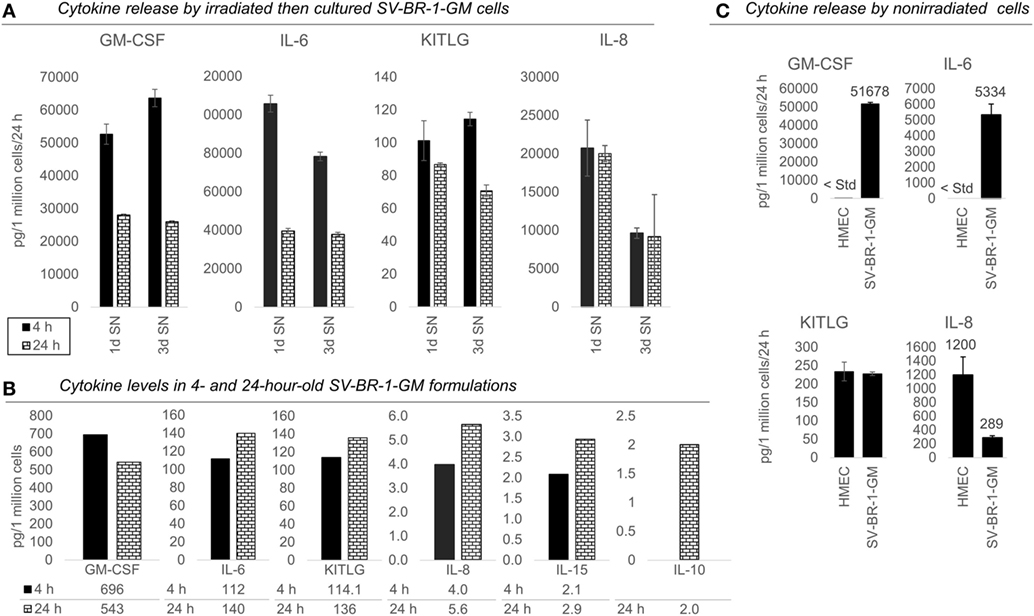
Figure 4. Cytokines secretion by irradiated and nonirradiated SV-BR-1-GM cells. (A) SV-BR-1-GM cells from 4- and 24-h-old clinical formulations were seeded in 6-well plates and cultured in full medium. Culture supernatants (SNs) were harvested after 1 day and 3 days of culturing then assessed for cytokine release. Note the substantially reduced levels of granulocyte–macrophage colony-stimulating factor (GM-CSF) and interleukin (IL)-6 for the 24 h compared to the 4 h old formulation. Values shown are arithmetic means from triplicate wells ± SDs, expressed as pg cytokine/1 million viable cells (at time of seeding)/24 h. For KITLG, one of the 24 h, 3d wells was excluded as the obtained cytokine levels were substantially higher than those of the other two wells. For IL-8, ELISAs for the 4 and 24 h samples were conducted on different days. (B) Cytokine levels in the Lactated Ringer’s solution (LRS) fractions of the formulations from (A). For IL-10, data are only shown for the 24 h sample. Values shown are arithmetic means from technical duplicates, expressed as pg cytokine/1 million total cells. (C) Nonirradiated human mammary epithelial cells (HMECs) and SV-BR-1-GM cells were cultured in parallel then assessed for cytokine release 24 h after replacing the culture medium. Note that the IL-6 and IL-8 levels from the nonirradiated SV-BR-1-GM cells shown here are substantially lower than those from the irradiated SV-BR-1-GM cells shown in (A). Values shown are arithmetic means from triplicate wells ± SDs, expressed as pg cytokine/1 million viable cells/24 h, whereby cell viability was determined on the day of medium change (initiation of cytokine accumulation) from cells cultured in parallel wells.
Taken together, in addition to the 22 genes with transcript representation in Figure 2, also HLA-DRB3 and CSF2 (GM-CSF) are considered relevant immunostimulatory factors potentially contributing to the efficacy of the SV-BR-1-GM targeted immunotherapy, raising the roster of queried immune-related factors to 24.
Verification of Expression of the 24 Immune-Related Factors
To establish whether the 24 genes with immunostimulatory functions are also expressed in SV-BR-1-GM cells having undergone the clinical formulation process (which includes irradiation of the cells then resuspension in LRS), cells were formulated at the UC Davis GMP facility (Sacramento, CA, USA) then courier-transported under temperature controlled (2–8°C) conditions to the processing laboratory in Berkeley, CA, USA. The shipping containers were opened then samples processed, 4 h (4) and 24 h (24) after completion of the formulation process. This mirrored the actual protocol activities closely: The 4-h time point represents the approximate time from completion of the formulation process to inoculation for patients dosed at a clinical site in vicinity of the UC Davis GMP facility. The 24-h time point represents the formulations’ expiry time.
Since in a clinical context, SV-BR-1-GM cells are inoculated as a replication-incompetent (irradiated) cell suspension with variable percentages of live cells, it is reasonable to speculate that continued expression of the immune-related genes improves SV-BR-1-GM’s therapeutic efficacy. To assess whether these genes are indeed still expressed in cells having undergone the formulation process, cells and SNs from the 4- and 24-h-old formulations were either analyzed directly (without culturing) or after a cell culturing period of 1 or 3 days. Whereas the original LRS and culture SNs were analyzed for presence and levels of secreted immune-related factors by ELISA, we used nCounter-based transcript counting to assess transcript levels of all 24 immune-related genes.
Appreciable levels of RNA from all but three (IL10, TNFSF14, and endogenous CSF2) of the immune-related genes were observed in samples derived from the clinical formulations, both from formulated cells cultured prior to harvest and from cell aliquots of the formulations lysed without culturing (Figure 3 and Data Sheet S3 in Supplementary Material), consistent with continued transcription of most of these immune-related genes despite the irradiation step. The lack of more than at most minimal endogenous CSF2 (encoding GM-CSF) transcript levels is not concerning, since the nCounter CodeSet employed was not designed to detect transcripts from the ectopic (transfected) CSF2 ORF. However, in the case of HLA-A, only one of SV-BR-1-GM’s alleles (HLA-A*24:02) seems to be expressed. Since the nCounter CodeSet (probe) for the other, HLA-A*11:01, did yield a clear signal with another cell type, HMECs, we have no evidence suggesting lack of probe hybridization per se (Figures 3A,B), although we have not experimentally confirmed the hybridization efficiency of the CodeSet. Expression of HLA-B and HLA-DRB3 was apparent for each of SV-BR-1-GM’s alleles: HLA-B*35:08, HLA-B*55:01, HLA-DRB3*01:01, and HLA-DRB3*02:02 (Figures 3C–F). Furthermore, substantial RNA expression levels were observed for IL6 and KITLG (Figures 3G,H). To compare expression levels of the 24 immune-related genes between parental SV-BR-1 cells and SV-BR-1-GM cells, also SV-BR-1 cells were analyzed by the nCounter approach. Almost identical expression profiles were obtained with 4-h-old formulations cultured for 1 day (Figure 3I). This is consistent with the assumption that the engineering of the SV-BR-1 cells to express GM-CSF did not affect the cells’ ability to exert immunostimulatory functions. Furthermore, based on our microarray data, SV-BR-1-GM cells at most marginally express CSF2RB, encoding the β chain common for the GM-CSF, IL-3, and IL-5 receptors, suggesting lack of autocrine GM-CSF effects (data not shown) (37).
Also, we confirmed protein expression of several of the immune-related factors. GM-CSF, IL-6, IL-8, and KITLG (free SCF) were detected in SNs from cultured formulations (Figure 4A) and in the original 4- and 24-h formulations (Figure 4B). However, IL-10 and IL-15 were not detected in culture SNs (data not shown), but low levels were measured in the original LRS-based formulations (Figure 4B). Nevertheless, these data suggest only minimal, if any, contribution of IL-10 and IL-15 to the clinical activity of SV-BR-1-GM. In contrast to IL15, transcript levels of IL10 could not be verified (Data Sheet S3 in Supplementary Material), suggesting that indeed at most minute levels of IL-10 are expressed by SV-BR-1-GM cells. Therefore, IL-10 is not expected to contribute to SV-BR-1-GM’s MoA. Moreover, while IL-18 was detected by two different ELISA kits from two different vendors, the presumptive protein levels were highly discordant. Whereas high IL-18 levels were measured by one kit in (i) the original formulations (LRS), (ii) SN from cultured and irradiated SV-BR-1-GM cells, and (iii) SN from cultured and nonirradiated SV-BR-1-GM cells, IL-18 was only detected in LRS at the highest sample concentration tested (1:10 diluted) by the other kit (data not shown).
To address which of the immune-related factors are overexpressed in SV-BR-1-GM cells compared to normal breast cells, RNA and protein levels were measured from both nonirradiated SV-BR-1-GM and nonirradiated HMECs cultured in parallel. Similarly to the formulations, for SV-BR-1-GM cells, clear transcript expression was confirmed for all 24 genes except for IL10 and TNFSF14. Importantly, even though several genes were expressed at higher levels in HMECs than in SV-BR-1-GM cells, transcript levels of all MHC class II-associated genes (HLA-DMA, -DMB, -DRA, -DRB3, and CD74) were considerably higher in SV-BR-1-GM cells compared to HMECs (Figure 3; Data Sheet S3 in Supplementary Material). Furthermore, whereas GM-CSF, IL-6, IL-8, and KITLG were measured and detected in SV-BR-1-GM culture SNs, GM-CSF and IL-6 were not (or at most at minute levels) detected in HMEC SNs. On the other hand, free SCF (KITLG) levels were similar in SV-BR-1-GM and HMEC SNs, but IL-8 levels were >4 times higher in SNs from HMECs than from SV-BR-1-GM cells (Figure 4C).
To establish whether and to what extent HLA-DRβ3 (encoded by HLA-DRB3) is expressed on the surface of SV-BR-1-GM cells, cells were irradiated then cryopreserved in CS5 freeze medium. Both cryopreserved and freshly harvested, nonirradiated SV-BR-1-GM cells were subjected to flow cytometry employing a monoclonal anti-HLA-DR antibody (clone L243) recognizing a conformational epitope on HLA-DRα only present when complexed with an HLA-DRβ chain. In the case of SV-BR-1-GM, the β chain is thought to be HLA-DRβ3 for the following reasons: (i), HLA-DRB1 is not (or at most marginally) expressed at the transcript level (Data Sheet S3 in Supplementary Material); (ii), SV-BR-1-GM’s diploid presence of HLA-DRB3 indicates absence of HLA-DRB4 and 5; and (iii), the remaining HLA-DRB genes (HLA-DRB2, 6, 7, 8, and 9) are pseudogenes (73, 85). As demonstrated in Figure 5, HLA-DR expression was heterogeneous, with about a third of the nonirradiated and some 15% of the irradiated SV-BR-1-GM cells staining positive for HLA-DR. Similarly, the per-cell signal intensity was higher in nonirradiated than in irradiated cells, suggesting that the irradiation process negatively affected HLA-DR gene expression and/or transport to the cell surface. A549 cells served as negative control and reference cell line (86, 87).
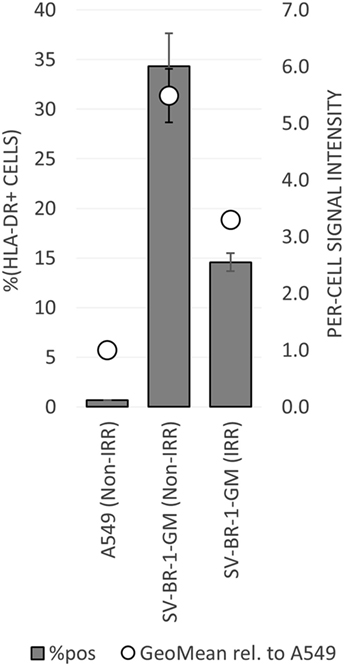
Figure 5. HLA-DR expression on irradiated and nonirradiated SV-BR-1-GM cells. SV-BR-1-GM cells were stained with a FITC-conjugated mouse monoclonal anti-HLA-DR antibody (clone L243) recognizing an epitope from HLA-DRα only present when complexed with an HLA-DRβ chain. Shown are arithmetic means ± SDs of technical triplicates (SV-BR-1-GM) or duplicates (A549) from (i) the percentages of HLA-DR positive cells (left axis) and (ii) the per-cell HLA-DR signal intensities normalized to the geometric mean of the signal intensity by the A549 negative control and reference cell line (value of A549 = 1) (right axis) (86, 87) Non-IRR, non-irradiated; IRR, irradiated.
In collaboration with Creatv MicroTech (Potomac, MD, USA), in a preliminary study, nonirradiated SV-BR-1-GM cells were fixed and stained with a polyclonal anti-HLA-DRβ3 antibody (product code ab196601; Abcam) then analyzed in the context of an IHC-like process. Of note, given the high sequence similarity among HLA-DRβ chains, it seems likely that this antibody (which was also used to generate the data shown in Figure 6) can crossreact with HLA-DRβ chains other than β3. 15% of the cells were strongly positive for HLA-DRβ3, and another 21% had an intermediate signal (preliminary data not shown). However, while 0% of the negative control human umbilical vein endothelial cells (HUVECs) cells were strongly HLA-DRβ3 positive, 19% of the HUVECs had an intermediate signal (preliminary data not shown). Nevertheless, these findings also suggest that at least about 15 percent of SV-BR-1-GM cells express HLA-DR and that the β chain in these HLA-DR complexes is β3, since, based on our RNA and HLA typing data, SV-BR-1-GM cells do not express appreciable levels of another HLA-DRβ chain.
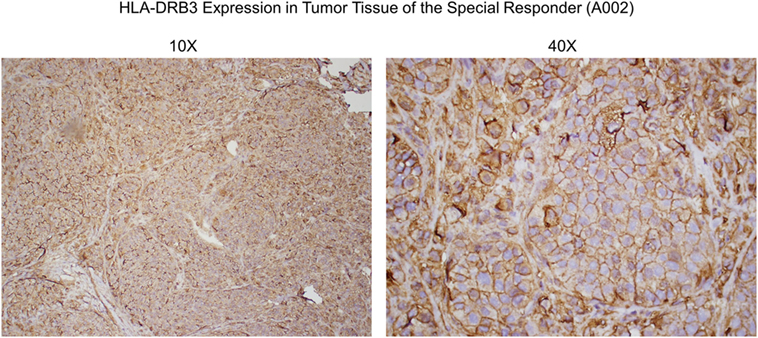
Figure 6. Anti-HLA-DRβ3 antibody staining of a tumor specimen from the strong clinical responder. To assess whether the strong clinical responder (16), referred to as subject A002 in this article, presented with tumor expression of HLA-DRβ3, paraffin-embedded A002 tumor material was stained with a rabbit polyclonal antibody raised against an N-terminal region of human HLA-DRβ3. As demonstrated, immunoreactivity was apparent.
In preliminary flow cytometry experiments with nonirradiated SV-BR-1-GM cells, we also attempted to measure the cell surface levels of HLA-DRβ3 directly using a mouse polyclonal antibody raised against the full-length protein (MaxPab B02P; Abnova, Taipei, Taiwan). With this antibody, a very small (~3%) fraction of apparently HLA-DRβ3 (very weakly) positive SV-BR-1-GM cells was identified, with the negative control cell lines (A549 and T-47D) being negative (data not shown). However, given that the HLA-DRβ3 per-cell signal intensity was rather minuscule, the validity of this result is questioned, especially in light of the data both obtained with the anti-HLA-DRα antibody (Figure 5) and by Creatv MicroTech.
Taken together, we have confirmed expression of 22 out of the 24 immune-related genes considered relevant for SV-BR-1-GM’s MoA. The complete 22-gene Immune Signature is shown in Table 1.
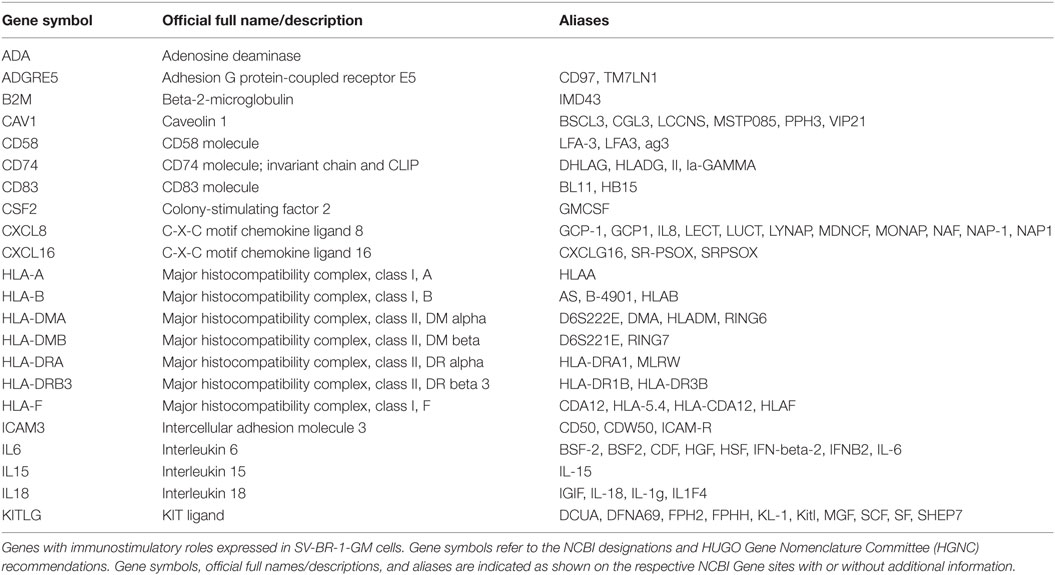
Table 1. 22-gene Immune Signature expressed in SV-BR-1-GM cells.
HLA Allele Matches Between SV-BR-1-GM and a Robust Clinical Responder
By low-resolution HLA typing, we previously established that the robust clinical responder (here referred to as subject A002) and SV-BR-1-GM cells had similarities in their HLA phenotypes (16). To find out whether such similarities are further reflected at the allele level, peripheral blood cells from patients and SV-BR-1-GM cells were subjected to high-resolution HLA typing for HLA-A, -B, and -DRB3. Indeed, whereas the three clinical trial subjects who did not experience SV-BR-1-GM-induced tumor regression had at most an HLA-A allele match with SV-BR-1-GM, subject A002 matched both at HLA-A (*11:01) and HLA-DRB3 (*02:02) (Table 2). However, since we cannot confirm expression of HLA-A*11:01 in SV-BR-1-GM cells with the nCounter CodeSet (probe) employed (Figure 3A), in this patient, the HLA-DRB3*02:02 match alone may have been clinically relevant. This finding agrees with an MoA in which tumor antigens displayed on HLA-DRβ3-based MHCs expressed on SV-BR-1-GM cells would contribute to the therapeutic efficacy of the cell line.
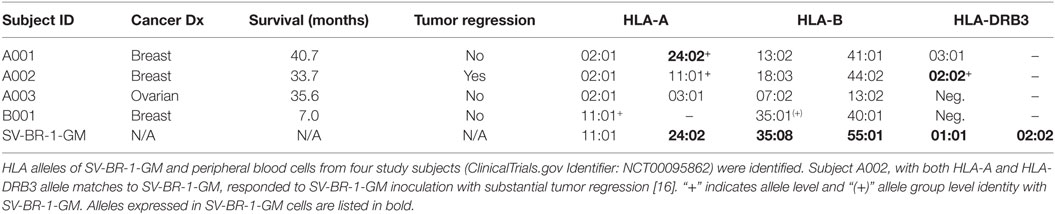
Table 2. HLA alleles.
Since HLA typing was conducted using peripheral blood cells, and because targeted cancer immunotherapy requires cancer cell MHC expression, we sought to identify whether HLA-DRβ3 protein is present on a paraffin-embedded tumor specimen from clinical trial subject A002. As demonstrated in Figure 6, immunoreactivity was indeed apparent, thus further supporting the postulated role of MHC class II in the MoA of SV-BR-1-GM.
CTAs Expressed in SV-BR-1-GM
Cancer/testis antigens represent a class of antigens with physiological expression predominantly restricted to testicular or placental tissue, and, for a subset, brain tissue. However, CTAs may become upregulated following malignant conversion of cells from a variety of organs. For many of such CTAs, immunostimulatory roles have been established (6, 32–34, 88–91).
Given such features, we assessed the mRNA expression levels of 279 confirmed or putative CTAs (Data Sheets S4 in Supplemental Material) in SV-BR-1-GM cells in comparison to several other breast cancer cell lines and normal breast cells. Following hierarchical clustering on both genes and samples, a group of CTA genes (KIF2C, OIP5, CEP55, PBK, KIF20B, TTK, CABYR, SPAG1, CCNA1, PLAC1, and PRAME) emerged with particularly good discrimination between SV-BR-1-GM and normal breast cells (Figure 7). However, expression of some of the genes in SV-BR-1-GM cells was weak and/or highly variable among the different SV-BR-1-GM samples. Nevertheless, PRAME, KIF2C, CEP55, and PBK were robustly expressed in SV-BR-1-GM cells (Figure 8) with PRAME exhibiting the highest fold-change ratio between the SV-BR-1-GM expression level and the maximum expression level among the normal breast samples (Table 3). In contrast to PRAME (Figure 8A), KIF2C, CEP55, and PBK were also expressed in cultured HMECs. Interestingly, the expression values of the latter three genes are higher in “early proliferating” than in senescent HMECs (Figures 8B–D) (30), suggesting that perhaps also in vivo proliferating breast epithelial cells express these genes. A list of CTAs with transcript expression values greater in SV-BR-1-GM cells than in normal breast cell types is shown in Table 3.
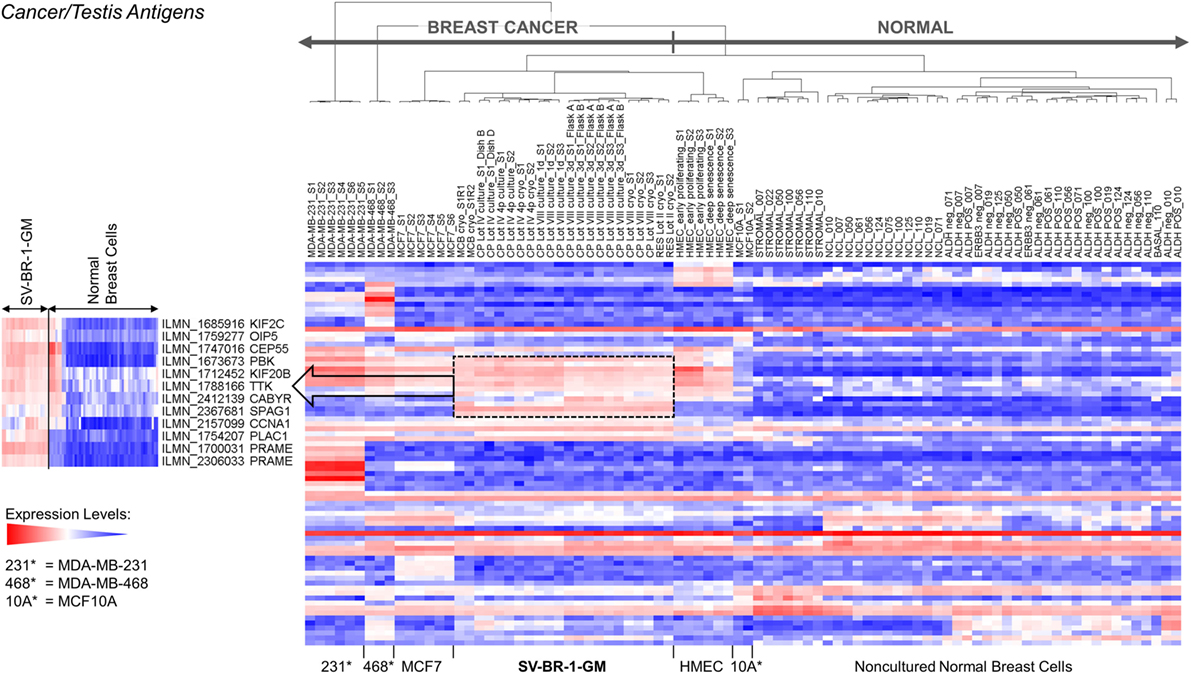
Figure 7. Cancer/testis antigen (CTA) expression in SV-BR-1-GM cells. RNA expression levels of 279 confirmed or putative CTAs (Data Sheets S4 in Supplementary Material) were compared between SV-BR-1-GM, other established breast cancer cell lines, and several normal human breast cell types. Quantile-normalized and log2-transformed microarray-based RNA expression levels are displayed according to a global gradient color scheme. Red means a higher expression level than white, and white means a higher expression level than blue. Only CTAs with a maximum representative expression value among all samples >1.5 times the background cutoff value were included.
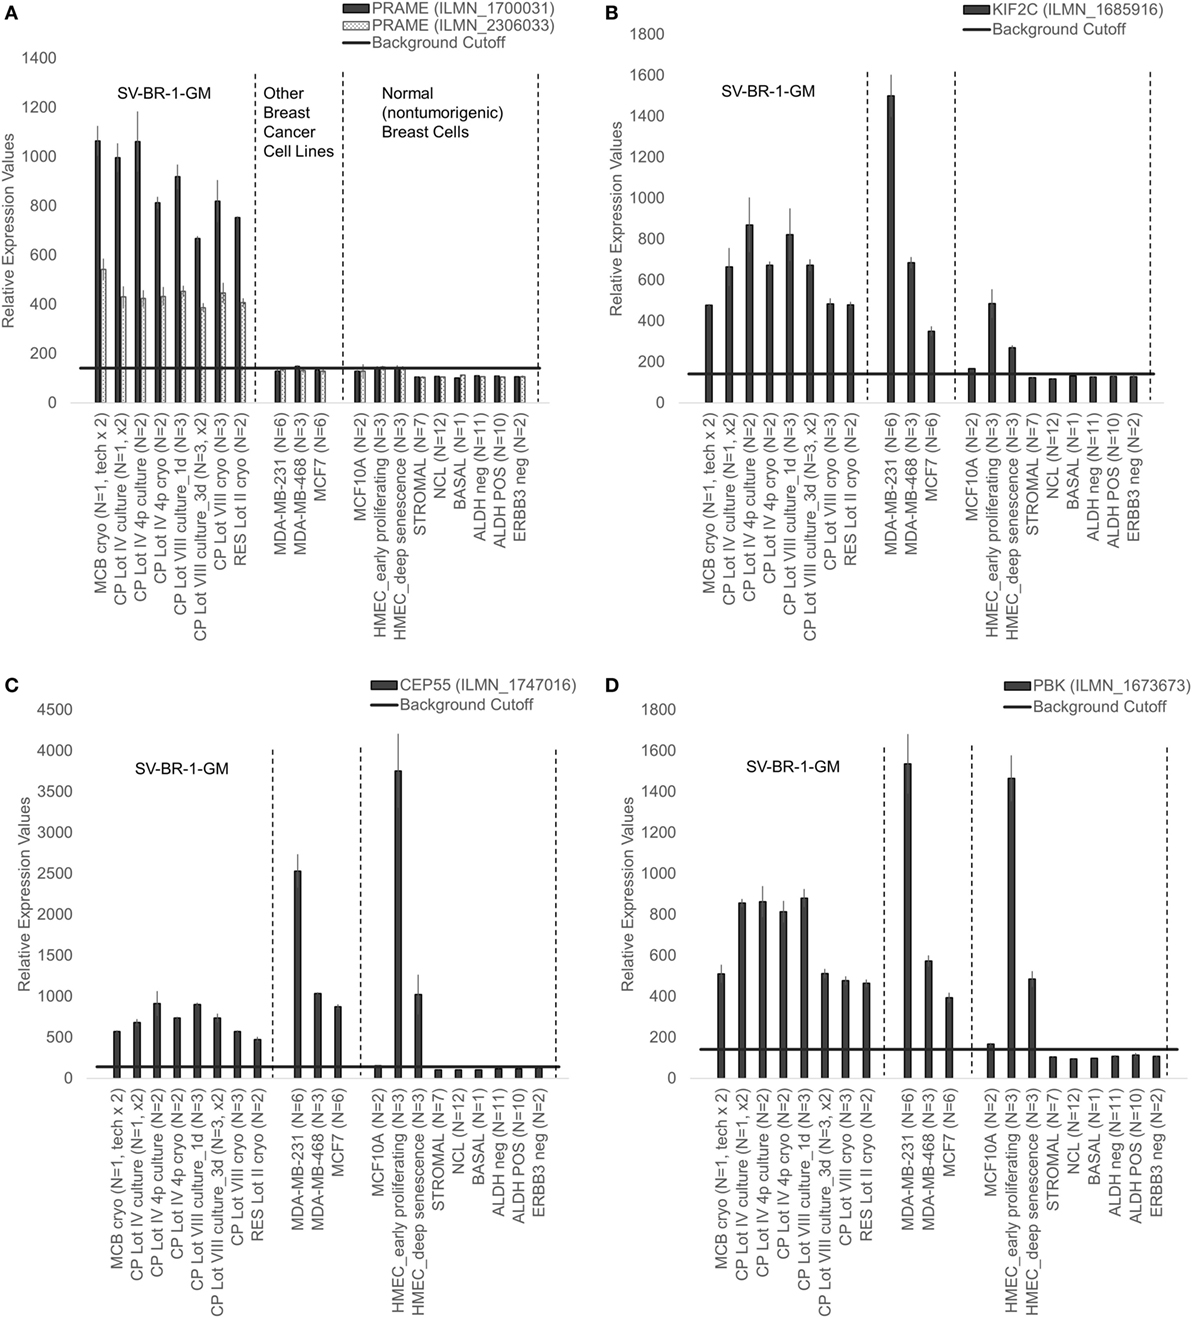
Figure 8. Cancer/testis antigen selectively expressed in SV-BR-1-GM cells. Quantile-normalized microarray-based RNA levels of PRAME (A), KIF2C (B), CEP55 (C), and PBK (D) “Relative Expression Values” refers to quantile-normalized mRNA levels. Values shown are arithmetic means. Error bars indicate SDs, except for STROMAL, NCL, BASAL, ALDH neg, ALDH POS, ERBB3 neg. for which standard error of the mean (S.E.M.) values are shown.
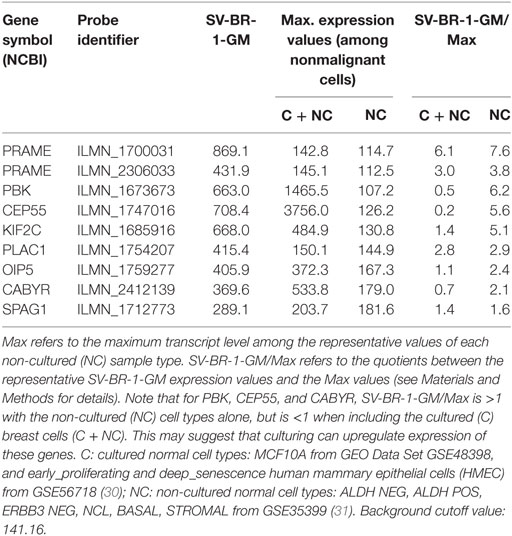
Table 3. Cancer/testis antigen expression in SV-BR-1-GM cells.
Other Candidate Immunogens Expressed in SV-BR-1-GM Cells
Even though SV-BR-1-GM expresses an “immune signature” (Table 1), the latter alone is unlikely sufficient to induce a strong tumor-directed immune response as it does not provide cancer specificity. It is reasonable to hypothesize that for patients responding to whole-cell targeted cancer immunotherapies with tumor regression such missing directionality is provided by the cell line through overexpression of TAAs coexpressed in the tumors. Candidate TAAs for the SV-BR-1-GM cell line include the CTAs addressed above and illustrated in Figures 7 and 8.
To systematically search for SV-BR-1-GM antigens with potential to break immune tolerance by overexpression, we employed a 2-tier microarray-based approach. First, genes upregulated in SV-BR-1-GM cells relative to normal breast cells were identified. For this, we compared gene expression levels in SV-BR-1-GM cells to those of a variety of normal human breast cell types described by Shehata et al. [GEO DataSet GSE35399 (31)], Lowe et al. [GEO DataSet GSE56718 (30)], and MCF10A from GEO DataSet GSE48398. Two serial filters were applied to quantile-normalized gene expression values to enrich for genes likely differentiating SV-BR-1-GM from normal breast cells. After low-stringency filtration, 588 different genes (including some of non-coding RNA) were retained, of which, after medium-stringency filtration, 353 remained (Figures S6 and S7 in Supplementary Presentation S1 in Supplementary Material; Data Sheet S5 in Supplementary Material).
Second, among the 353 genes retained after medium-stringency filtration, those not only upregulated relative to normal breast cells but also relative to tissues other than breast were considered verified immunogen candidates. This second criterion is sought to enrich for genes with an “actual” potential to break immune tolerance since physiologically high levels of gene expression not only in breast but also in tissues of other organs may prevent breakage of tolerance. The high-stringency filter applied in this step compared GEO DataSet GSE29431 (breast cancer tissues) to a subset of samples represented by GEO DataSet GSE7307 (nonmalignant tissues) (Data Sheet S1 in Supplementary Material) and was conducted on 328 genes retained after medium-stringency filtration (no Affymetrix probes were found for 25 of the 353 genes retained after medium-stringency filtration). Of note, the filter cutoff criteria (see Materials and Methods) were selected to retain ERBB2 (HER2/neu), whose immunogenic properties are being explored in several clinical trials (13, 92). Thirty-one genes were verified as TAA candidates using this strategy (Table 4). Interestingly, four of them, ERBB2 (HER2/neu), MIEN1, PGAP3, and STARD3, mapped to 17q12, a region frequently amplified in breast cancer (Figure S8 in Supplementary Presentation S1 in Supplementary Material). In the context of breast cancer, ERBB2 (HER2) is clearly the most widely studied TAA among these four candidate immunogens. However, the apparent coregulation of the other three with ERBB2 suggests that Her2 positive tumors (likely also expressing one or several of the other antigens) may be effectively targeted by SV-BR-1-GM targeted immunotherapy by means of antigens beyond ERBB2.
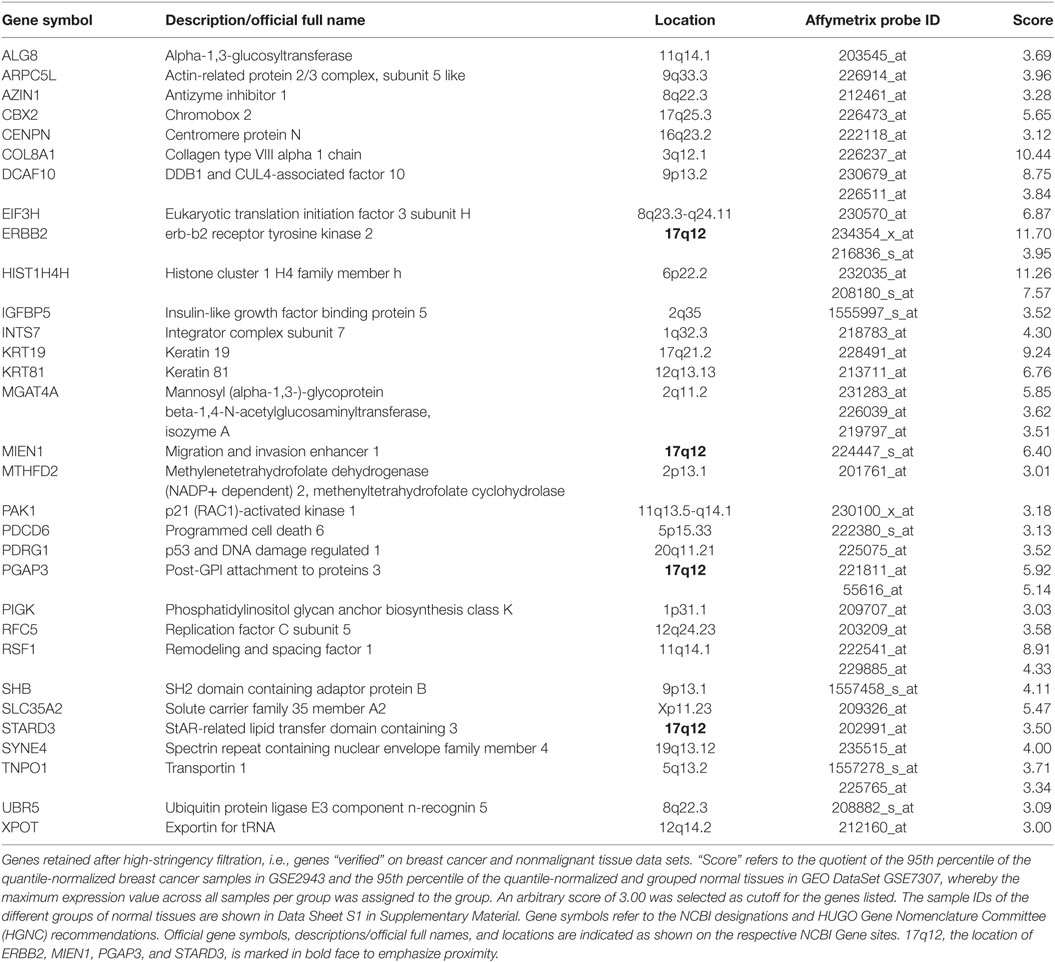
Table 4. In silico verified candidate TAAs.
SV-BR-1-GM Cells Are APCs
To establish whether the expression of the Immune Signature, especially the MHC class II components, translates into APC activity, SV-BR-1-GM cells were treated with yellow fever virus (YFV) Envelope (Env) 43–59 peptides (35) and cocultured with a CD4+ T cell clone known to recognize such YFV Env peptides when associated with HLA-DRB3*01:01-based HLA-DR complexes (Figure 9A). Indeed, IFN-γ secretion was significantly higher with SV-BR-1-GM cells treated with the YFV Env peptide compared to those obtained via an “irrelevant” peptide from VZV or via non-DRB3*01:01 PBMCs treated with the YFV peptide (Figures 9B,C). These results identify SV-BR-1-GM cells as APCs for CD4+ T cells. Of note, the T cells employed had been previously activated and were extensively expanded prior to their use in the study, thus not representing naïve T cells. Since SV-BR-1-GM cells do not express CD80 or CD86, encoding ligands for the costimulatory receptor CD28, SV-BR-1-GM is unlikely to activate naïve, i.e., nonprimed T cells. On the other hand, lack of CD80 (B7-1) may predict absence of NK cell-mediated destruction of SV-BR-1-GM (93).
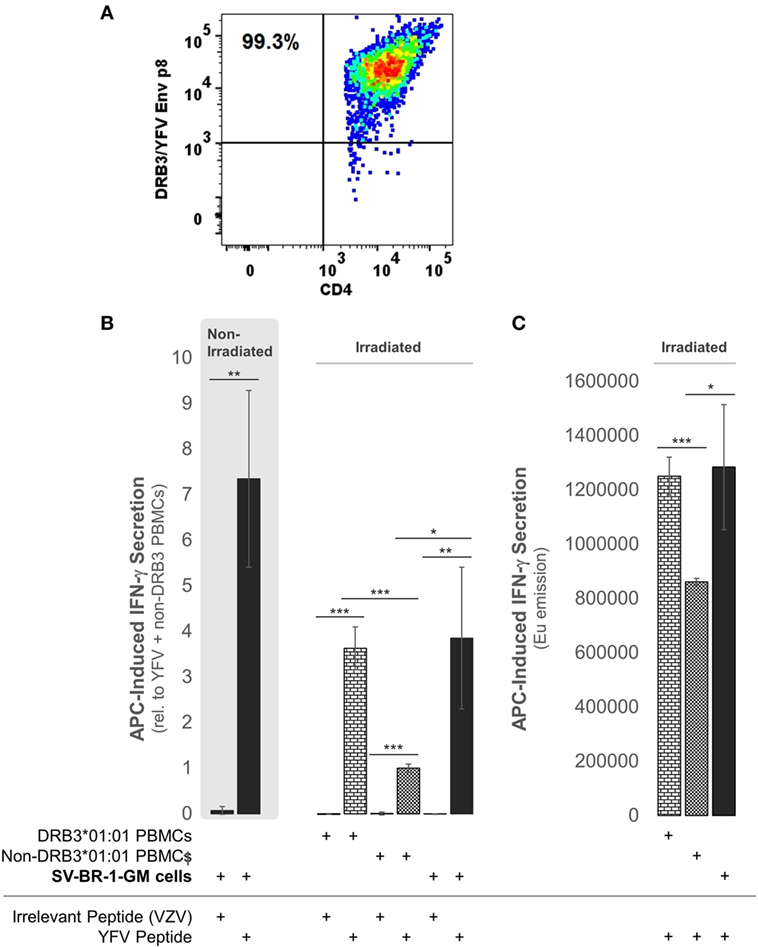
Figure 9. SV-BR-1-GM cells act as antigen-presenting cells (APCs). SV-BR-1-GM cells were cultured and serum-starved for 24 h then coincubated with yellow fever virus (YFV) Envelope (Env) 43–59 peptides (35) known to bind to HLA-DR complexes with an HLA-DRB3*01:01-based β chain and a YFV-DRB3*01:01-specific CD4+ T cell clone (A). (A) T cell clone after staining with YFV Env p8/DRB3*01:01 tetramers, as assessed by flow cytometry. Almost all T cells are both YFV Env p8/DRB3 and CD4 positive. (B) After 72 h of coculturing, T cell activation was assessed by determining the levels of secreted interferon (IFN)-γ. Values shown are arithmetic means from technical triplicates ± SDs, normalized to the mean IFN-γ level obtained from the YFV peptide-treated non-DRB3 PBMC reference wells. Background IFN-γ levels obtained from T cells treated with peptides in the absence of APCs (SV-BR-1-GM or PBMCs) were subtracted. (C) IFN-γ levels without background subtraction and normalization of a part of the experiment represented by panel (B). Values shown are arithmetic means of the Europium emission values at 615 nm from technical triplicates ± SDs. (B,C) one-tailed Student’s t-tests were employed to assess significance, with * referring to 0.01 ≤ p < 0.05, ** to 0.001 ≤ p < 0.01, and *** to p < 0.001.
Discussion
With targeted immunotherapies using allogeneic whole-cell preparations, patients are inoculated with a wide variety of antigens of which some may be TAAs coexpressed in patient tumors. However, whether or not an effective immune response is mounted against such TAAs depends on numerous factors. In this report, we present four main lines of evidence suggesting that SV-BR-1-GM cells can act as APCs and thereby could potentially mount an effective tumor-directed immune response. First, despite their presumptive breast epithelial origin, SV-BR-1-GM cells express a set of genes including MHC class I and II components associated with immune cells rather than with epithelial cells. Second, in a pilot study, a robust clinical response occurred in a clinical trial subject with an HLA-DRB3 allele match to SV-BR-1-GM. This raises the possibility that in this patient, TAA-MHC complexes expressed on the surface of SV-BR-1-GM cells directly stimulated corresponding T cells. However, since in this pilot study both the number of patients (four evaluable patients), and the number of patients with an HLA-DRB3 allele match to SV-BR-1-GM (one, A002) are low, it is difficult to estimate the significance of such a match. Third, peptide-treated SV-BR-1-GM cells activated cocultured peptide-specific CD4+ T cells restricted to the SV-BR-1-GM expressed HLA-DRB3 *01:01 allele. Fourth, SV-BR-1-GM cells overexpress TAAs including CTAs such as PRAME.
Among four evaluable clinical trial subjects in a pilot study, three with breast and one with ovarian cancer, objective tumor regression following SV-BR-1-GM inoculation was only seen in one patient (16), in this article referred to as A002. In contrast to the other three patients, subject A002 carried an MHC class II allele (HLA-DRB3*02:02) that was also present in SV-BR-1-GM (Table 2). Additionally, it is worth mentioning that in an ongoing phase I/IIa clinical trial (ClinicalTrials.gov identifier: NCT03066947) similarly conducted as the pilot study, the HLA matching hypothesis found continued support as demonstrated by the regression of multiple pulmonary nodules in a patient with metastatic breast cancer with a mixed clinical response (progression of metastatic disease in the liver) who matched at HLA-A*24:02 and HLA-DRB3*02:02 with SV-BR-1-GM (data not shown).
Together with a set of other genes with known immunostimulatory roles, SV-BR-1-GM cells express a 22-gene Immune Signature (Table 1). From a mechanistic perspective, these findings are consistent with a model in which TAAs are displayed on SV-BR-1-GM cell surface MHCs where they can directly and/or indirectly (upon “cross-dressing,” i.e., upon trogocytosis-based transfer onto APCs such as DCs) activate T cells (Figures S9A,B in Supplementary Presentation S1 in Supplementary Material) (94–96). It should be noted that although while an MHC class II allele match between patient A002 and SV-BR-1-GM may have been key in eliciting an effective anti-tumor immune response, one could envision that patients matching at an expressed MHC class I HLA allele may also benefit from direct antigen presentation provided their tumors express TAAs coexpressed in SV-BR-1-GM. However, even though a study suggested that B7-1 (CD80) positive tumor vaccines may result in some degree of direct antigen presentation to CD8+ T cells (97), in a mouse model, MHC class I-restricted tumor antigens were not detectably presented by the tumor itself (98), thus questioning whether MHC class I expression by SV-BR-1-GM cells indeed contributes to the cell line’s therapeutic potential. Furthermore, it is important to emphasize that the data presented here does not exclude cross-presentation, the more classical mechanism for tumor antigen display, as an additional contributor to SV-BR-1-GM’s MoA. It even seems very reasonable to hypothesize that after direct T cell stimulation by live, irradiated SV-BR-1-GM cells, antigens from apoptotic SV-BR-1-GM cells are taken up by DCs and used to activate patient T cells (Figure S9C in Supplementary Presentation S1 in Supplementary Material). With such a mechanism, targeted immunotherapy with SV-BR-1-GM would both directly and indirectly stimulate patient T cells, with only the former requiring HLA matching between SV-BR-1-GM and the patient.
Since the proposed MoA of the SV-BR-1-GM regimen (Figure S9A in Supplementary Presentation S1 in Supplementary Material) may similarly apply to other GVAX immunotherapies, one may wonder whether in such programs patients with MHC class I and/or II allele matches had better clinical responses to the vaccine than those without. Moreover, if HLA alleles indeed contribute to the efficacy of GVAX immunotherapies, high-resolution HLA typing should be considered as a companion diagnostic. Table 5 outlines estimated “phenotype frequencies” (PFs) of HLA-A, -B, and -DRB3 alleles expressed in SV-BR-1-GM for different subpopulations. As shown, combined HLA-DRB3*01:01 &*02:02 PFs range from 29.7 to 68.2%, i.e., the probability that a randomly selected individual carries at least one of SV-BR-1-GM’s expressed HLA-DRB3 alleles is 29.7–68.2% depending on the subpopulation. When loosening restrictions to only consider the allele groups, combination frequencies are only marginally higher (ranging from 29.8 to 68.6%) since SV-BR-1-GM’s HLA-DRB3 alleles (*01:01 and *02:02) are the most frequent alleles of the DRB3*01 and *02 allele groups (36).
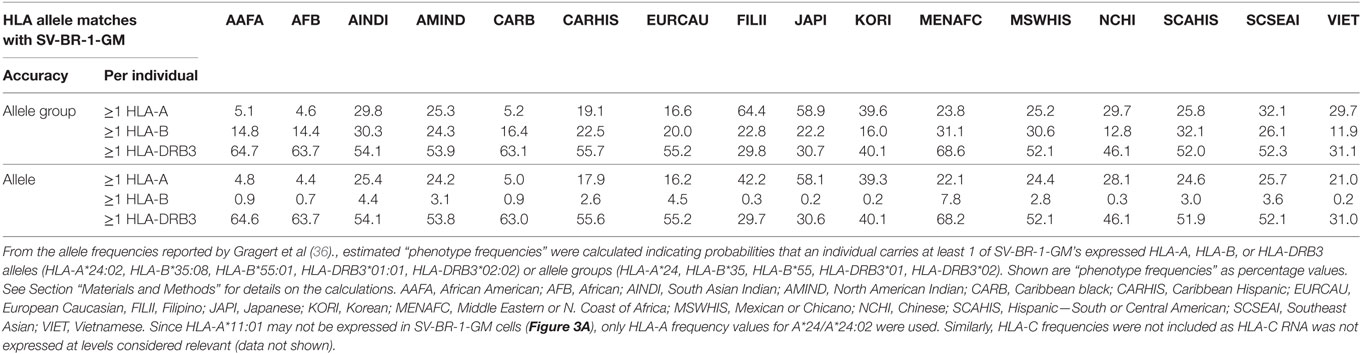
Table 5. “Phenotype Frequencies” of HLA alleles expressed in SV-BR-1-GM cells.
To mitigate the risk for tumor development by the vaccine itself, SV-BR-1-GM cells are irradiated with 200 Gy (20,000 rad) prior to their clinical application (16). Interestingly, Sharma et al. demonstrated that ex vivo gamma-irradiation may upregulate both MHC class I and CTAs in cancer cell lines representing different cancer types and in biopsy samples from sarcoma patients. Importantly, such gene expression changes were accompanied by increased recognition by CD8+ cells (99). This notion is also important clinically, as there is evidence suggesting that tumor irradiation could enhance the benefits of immunotherapy (100–102). Surprisingly, we observed reduced HLA-DR cell surface levels on irradiated compared to nonirradiated SV-BR-1-GM cells (Figure 5). However, it is unclear whether for SV-BR-1-GM cells, irradiation with 200 Gy indeed downregulates HLA-DR cell surface expression or whether differences in the handling of the cell preparations have accounted for the observed results. Furthermore, HLA-DR expression was heterogeneous, with only some 15% of the irradiated SV-BR-1-GM cells staining positive for HLA-DR. However, since each treatment cycle under the current protocol includes inoculation of 20 million SV-BR-1-GM cells, distributed into four intradermal sites (5 million cells per site), each patient is still believed to receive enough HLA-DR+ cells to induce the postulated HLA-dependent immune response.
It can be hypothesized that, in addition to matching HLA alleles, TAAs coexpressed in the vaccine and patient tumors were chiefly responsible for the favorable course of action observed in patient A002. In the molecular study presented here we sought to identify candidate TAAs whose overexpression in SV-BR-1-GM cells may break immunologic tolerance.
Immunologic tolerance is a double-edged sword. Its underlying mechanisms prevent both autologous antigens from evoking an immune response (autoimmunity) and the recognition of tumors by the immune system. Several methods to break tolerance have been described, including the use of immune checkpoint inhibitors or monoclonal antibodies delivering costimulatory signals to T cells (103). In the context of targeted cancer immunotherapy with live, irradiated whole-cell preparations, GM-CSF secreted by the cell line has been attributed a major role in overcoming immune tolerance (9). However, given that GM-CSF-expressing whole-cell vaccines express a vast array of antigens coexpressed in healthy cells, one would imagine that autoimmunity may accompany such treatments. Indeed, thyroglobulin antibody seroconversion following GVAX immunotherapy has been reported (and was associated with prolonged survival). However, since thyroglobulin was not found to be expressed in the GVAX cell lines used, the development of the thyroglobulin antibodies was likely based on alternative mechanism(s) (20).
We hypothesized that TAAs responsible for SV-BR-1-GM’s anti-tumor effect might be overexpressed in the cell line and as such could mediate the breakage of immune tolerance. This was addressed by means of a 2-tier microarray-based in silico approach. First, we wanted to identify genes upregulated in SV-BR-1-GM cells relative to normal breast cells. This was accomplished by comparing several different lots of SV-BR-1-GM to a variety of normal human breast cell types. Second, the genes with apparently higher expression levels in SV-BR-1-GM compared with normal breast cells were subjected to an in silico verification step for which the genes’ expression levels in breast cancer were compared to those of normal tissues of various organs. Since breakage of immune tolerance by overexpression may, at least in principle, only occur for genes with no/low physiological expression at every site permissive for immune surveillance, we reasoned that ideal candidate immunogens should be highly expressed in SV-BR-1-GM cells and breast cancer tissues but not, or only minimally, in normal tissues other than immune-privileged sites. The bioinformatics strategy applied to verify immunogen candidates reflects this theory. Thirty-one genes encoding candidate TAAs were considered more highly expressed in both SV-BR-1-GM cells and breast cancer tissues than in normal tissues (Table 4). Interestingly, among these thirty-one genes, six were located on chromosome 17 of which four mapped to 17q12, namely ERBB2 (HER2/neu), MIEN1 (C17orf37), PGAP3 (PERLD1), and STARD3 (Figure S8 in Supplementary Presentation S1 in Supplementary Material). This suggests that not only ERBB2 may be amplified in a subset of breast cancers but also other candidate TAAs located in vicinity of ERBB2 may be coamplified in the same cells (104, 105). Interestingly, in contrast to ERBB2, relatively little is known about MIEN1 (106–108) and PGAP3 (109), thus providing opportunities for further exploration. High StARD3 protein levels with a strong association with HER2 amplification was reported for approximately 10% of breast cancers in two Finnish nationwide patient cohorts (110).
Cancer/testis antigens are a class of TAAs specifically expressed in cancer and germline tissues (6, 32–34, 88–91). The stringent filtering approach which yielded 31 in silico verified TAA candidates did not select for CTAs. However, when gene expression profiles of a set of 279 CTAs (Data Sheets S4 in Supplementary Material) were analyzed, several CTAs, most notably PRAME, were found to be selectively expressed in SV-BR-1-GM compared to normal breast cells (Figures 7 and 8; Table 3). Even though it was not found to be expressed in noncancerous tissues other than tissues of the testis and the endometrium, PRAME was missed in the stringent in silico screen because in the 54 breast cancer specimens analyzed, PRAME expression was restricted to only 11 (20%) samples of which only 2 (4%) demonstrated appreciable expression levels (data not shown). Furthermore, at least some of the CTAs may have low expression levels in SV-BR-1-GM cells (Figures 7 and 8). However, as demonstrated by Groeper et al., CTA-specific TILs could even be expanded from tumors with undetectable CTA levels (6). This may suggest that minuscule (below level of detection) CTA expression levels may suffice for CTA-specific T cell retention in the tumor or that such T cells only coincidentally happened to reside in the tumor tissue as it was resected. In agreement with the latter possibility, CTA-directed cytotoxicity of TILs from tumors with undetectable CTA expression was weak (6).
In summary, the study presented here supports a model in which SV-BR-1-GM’s tumor-directed effects reported previously (16) were mediated at least in part by the cell line’s 22-gene “Immune Signature,” which includes factors ranging from MHC class I and II components to ligands for T cell costimulatory receptors and chemokines known to promote attraction of immune cells, and by TAAs such as PRAME. Importantly, peptide-treated SV-BR-1-GM cells selectively activated pMHC-specific CD4+ T cells, which confirms that SV-BR-1-GM cells can act as APCs and suggests that this functionality is critical for SV-BR-1-GM’s MoA.
Conclusion
Unlike other established breast cancer cell lines, SV-BR-1-GM cells not only express known and putative TAAs; they also express a collection of factors with known roles in promoting immune responses. Most notably, in addition to MHC class I factors, also class II genes such as HLA-DMA, -DMB, -DRA, and -DRB3 are expressed. Since MHC class II components are associated with bone fide APCs such as DCs, their expression in SV-BR-1-GM cells is surprising and may point to a unique MoA. Since the patient who responded to the SV-BR-1-GM regimen with tumor regression (16) carried an MHC class II allele also expressed in SV-BR-1-GM cells, we hypothesize that patients coexpressing SV-BR-1-GM TAAs and expressing matching HLA alleles are more likely to develop a strong tumor-directed immune response than those without such characteristics.
Data Availability
Microarray data of the 22 samples passing QC (i.e., excluding CP Lot V cryo) discussed in this publication have been deposited in NCBI’s Gene Expression Omnibus (28) and are accessible through GEO Series accession number GSE112239 (https://www.ncbi.nlm.nih.gov/geo/query/acc.cgi?acc=GSE112239).
Ethics Statement
The clinical aspect of this study was conducted with US Food and Drug Administration (FDA) and St. Vincent Medical Center institutional review board (IRB) approval, and written informed patient consent was obtained (16). The clinical trial was registered under ClinicalTrials.gov Identifier NCT00095862.
Author Contributions
ML conceived the study and interpreted data, conducted bioinformatics analyses and part of the wet laboratory experiments, and wrote the manuscript. GB lead the manufacturing of CP Lot VIII and oversaw technical procedures. BF and EF expanded MCB cells to CP Lot VIII and conducted experiments. TP and TH expanded cells. DC-B, SG, and YK conducted experiments. WK, JW, and WW provided intellectual input. CW oversaw the manufacturing of several SV-BR-1-GM lots and provided intellectual input. All authors read and approved the final manuscript.
Conflict of Interest Statement
BriaCell Therapeutics Corp. owns SV-BR-1-GM and the following SV-BR-1-GM-associated intellectual property: (1) US7674456 (issued US patent) and (2) PCT/US2017/019757 (international patent application). Furthermore, BriaCell Therapeutics Corp. acts as Sponsor on two current SV-BR-1-GM clinical trials (ClinicalTrials.gov Identifiers NCT03066947 and NCT03328026). ML, SG, CW, and WW have equity in BriaCell Therapeutics Corp. The other authors declare that they have no competing interests.
Acknowledgments
We thank Dr. Young Kim at the City of Hope Laboratories for kindly assessing HLA protein expression in tumor tissue, Darrell Johnson and his team from the University of Minnesota Genomics Center for their outstanding gene expression services, Dr. Alex Kharazi for his excellent contributions to the development of the SV-BR-1-GM program prior to the initiation of the study presented here, Drs. Lauren Collison and Don Healey for their diligent SV-BR-1-GM manufacturing and development efforts, and the Creatv MicroTech team for its outstanding contributions to our clinical program.
Funding
All aspects of this project were funded by BriaCell Therapeutics Corp.
Supplementary Material
The Supplementary Material for this article can be found online at https://www.frontiersin.org/articles/10.3389/fimmu.2018.00776/full#supplementary-material.
Presentation 1. Figure S1: Hierarchical clustering of SV-BR-1-GM samples in comparison to other human breast cancer cell lines (A and B) or normal human breast cells (B). Heat maps of genes regulated similarly as ERBB2 are shown in C. Figure S2 demonstrates microarray-based gene expression levels of MHC class I and Figure S3 of MHC class II components in SV-BR-1-GM cells. Figure S4: Confirmation of several MHC class II components by quantitative RT-PCR. Figure S5: Levels of GM-CSF secreted by nonirradiated SV-BR-1-GM cells are shown. Figure S6: Overview of the in silico filtration strategy to identify candidate TAAs. Figure S7: Illustration of the low- and medium-stringency in silico filtration approach. Figure S8: Genes expressed in SV-BR-1-GM cells and located on chromosome 17q12 (“ERBB2 amplicon”). Figure S9: Hypothetical mechanism of action of SV-BR-1-GM as a therapeutic cancer vaccine (A). Factors expressed in SV-BR-1-GM cells and some of their known roles as immune modulators. Expression of MHC class I and II genes is consistent with a model in which SV-BR-1-GM cells directly stimulate cytotoxic T lymphocytes (CD8+) and T helper cells (CD4+), and thereby, potentially, induce both cytotoxic and humoral responses. The presence of functional MHC class II is unexpected given the cells’ presumptive breast epithelial origin and may in part be responsible for the tumor-directed clinical effects observed in patients matching at an HLA class II allele with SV-BR-1-GM. Nevertheless, since SV-BR-1-GM cells do not express CD80 or CD86 mRNA they unlikely act directly as antigen-presenting cells activating naïve T cells. However, activation of naïve T cells may occur via dendritic cells (DCs), after direct transfer of tumor-associated antigen (TAA)-MHC complexes from the cell surface of SV-BR-1-GM cells to the cell surface of DCs by means of trocycytosis (cross-dressing) (B) and/or by uptake and intracellular processing of SV-BR-1-GM antigens via cross-presentation (C). CTL, cytotoxic T lymphocyte; TH, T helper cell. Shown is a subset of the factors with immunomodulatory roles expressed in SV-BR-1-GM cells. Additional factors are listed in Table 1.
Data Sheet 1. Accession numbers and descriptions of normal tissue samples from GEO DataSet GSE7307 used for the in silico verification step of candidate TAAs are shown.
Data Sheet 2. Reagents and samples for quantitative RT-PCR and nCounter-based verification of gene expression are shown.
Data Sheet 3. List of genes with immunostimulatory roles and Immune Signature candidates are shown.
Data Sheet 4. A list of cancer/testis antigens (CTAs) is provided.
Data Sheet 5. Genes retained after the low- and medium in silico filtration steps are shown.
Abbreviations
APC, antigen-presenting cell; CTA, cancer/testis antigen; DC, dendritic cell; HGNC, Human Genome Organisation (HUGO) Gene Nomenclature Committee; HLA, human leukocyte antigen; HMEC, human mammary epithelial cell; MHC, major histocompatibility complex; MoA, mechanism of action; pMHC, peptide-loaded MHC; qRT-PCR, quantitative reverse transcription-polymerase chain reaction; TAA, tumor-associated antigen.
References
1. Maus MV, Grupp SA, Porter DL, June CH. Antibody-modified T cells: CARs take the front seat for hematologic malignancies. Blood (2014) 123(17):2625–35. doi:10.1182/blood-2013-11-492231
2. Maude SL, Frey N, Shaw PA, Aplenc R, Barrett DM, Bunin NJ, et al. Chimeric antigen receptor T cells for sustained remissions in leukemia. N Engl J Med (2014) 371(16):1507–17. doi:10.1056/NEJMoa1407222
3. Kontermann RE, Brinkmann U. Bispecific antibodies. Drug Discov Today (2015) 20(7):838–47. doi:10.1016/j.drudis.2015.02.008/28220
4. Robbins PF, Kassim SH, Tran TL, Crystal JS, Morgan RA, Feldman SA, et al. A pilot trial using lymphocytes genetically engineered with an NY-ESO-1-reactive T-cell receptor: long-term follow-up and correlates with response. Clin Cancer Res (2015) 21(5):1019–27. doi:10.1158/1078-0432.CCR-14-2708
5. Prickett TD, Crystal JS, Cohen CJ, Pasetto A, Parkhurst MR, Gartner JJ, et al. Durable complete response from metastatic melanoma after transfer of autologous T cells recognizing 10 mutated tumor antigens. Cancer Immunol Res (2016) 4(8):669–78. doi:10.1158/2326-6066.CIR-15-0215
6. Groeper C, Gambazzi F, Zajac P, Bubendorf L, Adamina M, Rosenthal R, et al. Cancer/testis antigen expression and specific cytotoxic T lymphocyte responses in non small cell lung cancer. Int J Cancer (2007) 120(2):337–43. doi:10.1002/ijc.22309
7. Chen G, Gupta R, Petrik S, Laiko M, Leatherman JM, Asquith JM, et al. A feasibility study of cyclophosphamide, trastuzumab, and an allogeneic GM-CSF-secreting breast tumor vaccine for HER2+ metastatic breast cancer. Cancer Immunol Res (2014) 2(10):949–61. doi:10.1158/2326-6066.CIR-14-0058
8. Creelan BC, Antonia S, Noyes D, Hunter TB, Simon GR, Bepler G, et al. Phase II trial of a GM-CSF-producing and CD40L-expressing bystander cell line combined with an allogeneic tumor cell-based vaccine for refractory lung adenocarcinoma. J Immunother (2013) 36(8):442–50. doi:10.1097/CJI.0b013e3182a80237
9. Gupta R, Emens LA. GM-CSF-secreting vaccines for solid tumors: moving forward. Discov Med (2010) 10(50):52–60.
10. Le DT, Wang-Gillam A, Picozzi V, Greten TF, Crocenzi T, Springett G, et al. Safety and survival with GVAX pancreas prime and Listeria monocytogenes-expressing mesothelin (CRS-207) boost vaccines for metastatic pancreatic cancer. J Clin Oncol (2015) 33(12):1325–33. doi:10.1200/JCO.2014.57.4244
11. Lipson EJ, Sharfman WH, Chen S, McMiller TL, Pritchard TS, Salas JT, et al. Safety and immunologic correlates of melanoma GVAX, a GM-CSF secreting allogeneic melanoma cell vaccine administered in the adjuvant setting. J Transl Med (2015) 13:214. doi:10.1186/s12967-015-0572-3
12. Lollini PL, Cavallo F, Nanni P, Quaglino E. The promise of preventive cancer vaccines. Vaccines (Basel) (2015) 3(2):467–89. doi:10.3390/vaccines3020467
13. Mittendorf EA, Clifton GT, Holmes JP, Schneble E, van Echo D, Ponniah S, et al. Final report of the phase I/II clinical trial of the E75 (nelipepimut-S) vaccine with booster inoculations to prevent disease recurrence in high-risk breast cancer patients. Ann Oncol (2014) 25(9):1735–42. doi:10.1093/annonc/mdu211
14. Santegoets SJ, Stam AG, Lougheed SM, Gall H, Jooss K, Sacks N, et al. Myeloid derived suppressor and dendritic cell subsets are related to clinical outcome in prostate cancer patients treated with prostate GVAX and ipilimumab. J Immunother Cancer (2014) 2:31. doi:10.1186/s40425-014-0031-3
15. Srivatsan S, Patel JM, Bozeman EN, Imasuen IE, He S, Daniels D, et al. Allogeneic tumor cell vaccines: the promise and limitations in clinical trials. Hum Vaccin Immunother (2014) 10(1):52–63. doi:10.4161/hv.26568
16. Wiseman CL, Kharazi A. Objective clinical regression of metastatic breast cancer in disparate sites after use of whole-cell vaccine genetically modified to release sargramostim. Breast J (2006) 12(5):475–80. doi:10.1111/j.1075-122X.2006.00319.x
17. Wiseman CL, Kharazi A. Phase I study with SV-BR-1 breast cancer cell line vaccine and GM-CSF: clinical experience in 14 patients. Open Breast Cancer J (2010) 2:4–11. doi:10.2174/1876817201002010004
18. Silvestri I, Cattarino S, Agliano AM, Collalti G, Sciarra A. Beyond the immune suppression: the immunotherapy in prostate cancer. Biomed Res Int (2015) 2015:794968. doi:10.1155/2015/794968
19. Keenan BP, Jaffee EM. Whole cell vaccines – past progress and future strategies. Semin Oncol (2012) 39(3):276–86. doi:10.1053/j.seminoncol.2012.02.007
20. De Remigis A, de Gruijl TD, Uram JN, Tzou SC, Iwama S, Talor MV, et al. Development of thyroglobulin antibodies after GVAX immunotherapy is associated with prolonged survival. Int J Cancer (2015) 136(1):127–37. doi:10.1002/ijc.28973
21. Soares KC, Rucki AA, Kim V, Foley K, Solt S, Wolfgang CL, et al. TGF-beta blockade depletes T regulatory cells from metastatic pancreatic tumors in a vaccine dependent manner. Oncotarget (2015) 6(40):43005–15. doi:10.18632/oncotarget.5656
22. Borrello IM, Levitsky HI, Stock W, Sher D, Qin L, DeAngelo DJ, et al. Granulocyte-macrophage colony-stimulating factor (GM-CSF)-secreting cellular immunotherapy in combination with autologous stem cell transplantation (ASCT) as postremission therapy for acute myeloid leukemia (AML). Blood (2009) 114(9):1736–45. doi:10.1182/blood-2009-02-205278
23. Emens LA, Asquith JM, Leatherman JM, Kobrin BJ, Petrik S, Laiko M, et al. Timed sequential treatment with cyclophosphamide, doxorubicin, and an allogeneic granulocyte-macrophage colony-stimulating factor-secreting breast tumor vaccine: a chemotherapy dose-ranging factorial study of safety and immune activation. J Clin Oncol (2009) 27(35):5911–8. doi:10.1200/JCO.2009.23.3494
24. Ogawa T, Kusumoto M, Mizumoto K, Sato N, Tanaka M. Adenoviral GM-CSF gene transduction into breast cancer cells induced long-lasting antitumor immunity in mice. Breast Cancer (1999) 6(4):301–4. doi:10.1007/BF02966444
25. Le DT, Jaffee EM. Regulatory T-cell modulation using cyclophosphamide in vaccine approaches: a current perspective. Cancer Res (2012) 72(14):3439–44. doi:10.1158/0008-5472.CAN-11-3912
26. Arico E, Belardelli F. Interferon-alpha as antiviral and antitumor vaccine adjuvants: mechanisms of action and response signature. J Interferon Cytokine Res (2012) 32(6):235–47. doi:10.1089/jir.2011.0077
27. Reich M, Liefeld T, Gould J, Lerner J, Tamayo P, Mesirov JP. GenePattern 2.0. Nat Genet (2006) 38(5):500–1. doi:10.1038/ng0506-500
28. Edgar R, Domrachev M, Lash AE. Gene expression omnibus: NCBI gene expression and hybridization array data repository. Nucleic Acids Res (2002) 30(1):207–10. doi:10.1093/nar/30.1.207
29. Jongeneel CV, Delorenzi M, Iseli C, Zhou D, Haudenschild CD, Khrebtukova I, et al. An atlas of human gene expression from massively parallel signature sequencing (MPSS). Genome Res (2005) 15(7):1007–14. doi:10.1101/gr.4041005
30. Lowe R, Overhoff MG, Ramagopalan SV, Garbe JC, Koh J, Stampfer MR, et al. The senescent methylome and its relationship with cancer, ageing and germline genetic variation in humans. Genome Biol (2015) 16:194. doi:10.1186/s13059-015-0748-4
31. Shehata M, Teschendorff A, Sharp G, Novcic N, Russell IA, Avril S, et al. Phenotypic and functional characterisation of the luminal cell hierarchy of the mammary gland. Breast Cancer Res (2012) 14(5):R134. doi:10.1186/bcr3334
32. Dobrynin P, Matyunina E, Malov SV, Kozlov AP. The novelty of human cancer/testis antigen encoding genes in evolution. Int J Genomics (2013) 2013:105108. doi:10.1155/2013/105108
33. Chapman KB, Prendes MJ, Kidd JL, Sternberg H, West MD, Wagner J. Elevated expression of cancer/testis antigen FSIP1 in ER-positive breast tumors. Biomark Med (2013) 7(4):601–11. doi:10.2217/bmm.13.58
34. Almeida LG, Sakabe NJ, deOliveira AR, Silva MC, Mundstein AS, Cohen T, et al. CTdatabase: a knowledge-base of high-throughput and curated data on cancer-testis antigens. Nucleic Acids Res (2009) 37(Database issue):D816–9. doi:10.1093/nar/gkn673
35. James EA, LaFond RE, Gates TJ, Mai DT, Malhotra U, Kwok WW. Yellow fever vaccination elicits broad functional CD4+ T cell responses that recognize structural and nonstructural proteins. J Virol (2013) 87(23):12794–804. doi:10.1128/JVI.01160-13
36. Gragert L, Madbouly A, Freeman J, Maiers M. Six-locus high resolution HLA haplotype frequencies derived from mixed-resolution DNA typing for the entire US donor registry. Hum Immunol (2013) 74(10):1313–20. doi:10.1016/j.humimm.2013.06.025
37. Broughton SE, Hercus TR, Nero TL, Dottore M, McClure BJ, Dhagat U, et al. Conformational changes in the GM-CSF receptor suggest a molecular mechanism for affinity conversion and receptor signaling. Structure (2016) 24(8):1271–81. doi:10.1016/j.str.2016.05.017
38. Brown CB, Pihl CE, Kaushansky K. Mapping of human granulocyte-macrophage-colony-stimulating-factor domains interacting with the human granulocyte-macrophage-colony-stimulating-factor-receptor alpha-subunit. Eur J Biochem (1994) 225(3):873–80. doi:10.1111/j.1432-1033.1994.0873b.x
39. Hansen G, Hercus TR, McClure BJ, Stomski FC, Dottore M, Powell J, et al. The structure of the GM-CSF receptor complex reveals a distinct mode of cytokine receptor activation. Cell (2008) 134(3):496–507. doi:10.1016/j.cell.2008.05.053
40. Hu ZB, Ma W, Zaborski M, MacLeod R, Quentmeier H, Drexler HG. Establishment and characterization of two novel cytokine-responsive acute myeloid and monocytic leukemia cell lines, MUTZ-2 and MUTZ-3. Leukemia (1996) 10(6):1025–40.
41. Arruda LB, Sim D, Chikhlikar PR, Maciel M Jr, Akasaki K, August JT, et al. Dendritic cell-lysosomal-associated membrane protein (LAMP) and LAMP-1-HIV-1 gag chimeras have distinct cellular trafficking pathways and prime T and B cell responses to a diverse repertoire of epitopes. J Immunol (2006) 177(4):2265–75. doi:10.4049/jimmunol.177.4.2265
42. Bates JM, Flanagan K, Mo L, Ota N, Ding J, Ho S, et al. Dendritic cell CD83 homotypic interactions regulate inflammation and promote mucosal homeostasis. Mucosal Immunol (2015) 8(2):414–28. doi:10.1038/mi.2014.79
43. Caux C, Massacrier C, Vanbervliet B, Dubois B, Van Kooten C, Durand I, et al. Activation of human dendritic cells through CD40 cross-linking. J Exp Med (1994) 180(4):1263–72. doi:10.1084/jem.180.4.1263
44. Lee S, Margolin K. Cytokines in cancer immunotherapy. Cancers (Basel) (2011) 3(4):3856–93. doi:10.3390/cancers3043856
45. Leitner J. The Role of Costimulatory Pathways During the Activation of Human T Cells [Dissertation (Ph.D. Thesis)]. Austria: University of Vienna (2011). Available from: othes.univie.ac.at/15063/1/2011-03-07_0107588.pdf (Accessed: April 5, 2018).
46. Ohshima Y, Tanaka Y, Tozawa H, Takahashi Y, Maliszewski C, Delespesse G. Expression and function of OX40 ligand on human dendritic cells. J Immunol (1997) 159(8):3838–48.
47. Rescigno M, Piguet V, Valzasina B, Lens S, Zubler R, French L, et al. Fas engagement induces the maturation of dendritic cells (DCs), the release of interleukin (IL)-1beta, and the production of interferon gamma in the absence of IL-12 during DC-T cell cognate interaction: a new role for Fas ligand in inflammatory responses. J Exp Med (2000) 192(11):1661–8. doi:10.1084/jem.192.11.1661
48. Wong BR, Josien R, Lee SY, Sauter B, Li HL, Steinman RM, et al. TRANCE (tumor necrosis factor [TNF]-related activation-induced cytokine), a new TNF family member predominantly expressed in T cells, is a dendritic cell-specific survival factor. J Exp Med (1997) 186(12):2075–80. doi:10.1084/jem.186.12.2075
49. Zou GM, Tam YK. Cytokines in the generation and maturation of dendritic cells: recent advances. Eur Cytokine Netw (2002) 13(2):186–99.
50. Bleijs DA, de Waal-Malefyt R, Figdor CG, van Kooyk Y. Co-stimulation of T cells results in distinct IL-10 and TNF-alpha cytokine profiles dependent on binding to ICAM-1, ICAM-2 or ICAM-3. Eur J Immunol (1999) 29(7):2248–58.
51. Damle NK, Aruffo A. Vascular cell adhesion molecule 1 induces T-cell antigen receptor-dependent activation of CD4+T lymphocytes. Proc Natl Acad Sci U S A (1991) 88(15):6403–7. doi:10.1073/pnas.88.15.6403
52. Dieu MC, Vanbervliet B, Vicari A, Bridon JM, Oldham E, Ait-Yahia S, et al. Selective recruitment of immature and mature dendritic cells by distinct chemokines expressed in different anatomic sites. J Exp Med (1998) 188(2):373–86. doi:10.1084/jem.188.2.373
53. Gokhale A, Kanthala S, Latendresse J, Taneja V, Satyanarayanajois S. Immunosuppression by co-stimulatory molecules: inhibition of CD2-CD48/CD58 interaction by peptides from CD2 to suppress progression of collagen-induced arthritis in mice. Chem Biol Drug Des (2013) 82(1):106–18. doi:10.1111/cbdd.12138
54. He S, Wang L, Wu Y, Li D, Zhang Y. CCL3 and CCL20-recruited dendritic cells modified by melanoma antigen gene-1 induce anti-tumor immunity against gastric cancer ex vivo and in vivo. J Exp Clin Cancer Res (2010) 29:37. doi:10.1186/1756-9966-29-37
55. Leitner J, Grabmeier-Pfistershammer K, Steinberger P. Receptors and ligands implicated in human T cell costimulatory processes. Immunol Lett (2010) 128(2):89–97. doi:10.1016/j.imlet.2009.11.009
56. Sutavani RV, Bradley RG, Ramage JM, Jackson AM, Durrant LG, Spendlove I. CD55 costimulation induces differentiation of a discrete T regulatory type 1 cell population with a stable phenotype. J Immunol (2013) 191(12):5895–903. doi:10.4049/jimmunol.1301458
57. Arango Duque G, Descoteaux A. Macrophage cytokines: involvement in immunity and infectious diseases. Front Immunol (2014) 5:491. doi:10.3389/fimmu.2014.00491
58. Goswami R, Kaplan MH. A brief history of IL-9. J Immunol (2011) 186(6):3283–8. doi:10.4049/jimmunol.1003049
59. Hirano N, Butler MO, Xia Z, Ansen S, von Bergwelt-Baildon MS, Neuberg D, et al. Engagement of CD83 ligand induces prolonged expansion of CD8+ T cells and preferential enrichment for antigen specificity. Blood (2006) 107(4):1528–36. doi:10.1182/blood-2005-05-2073
60. Imai T, Baba M, Nishimura M, Kakizaki M, Takagi S, Yoshie O. The T cell-directed CC chemokine TARC is a highly specific biological ligand for CC chemokine receptor 4. J Biol Chem (1997) 272(23):15036–42. doi:10.1074/jbc.272.23.15036
61. Luo H, Yu G, Wu Y, Wu J. EphB6 crosslinking results in costimulation of T cells. J Clin Invest (2002) 110(8):1141–50. doi:10.1172/JCI15883
62. Mandapathil M, Szczepanski M, Harasymczuk M, Ren J, Cheng D, Jackson EK, et al. CD26 expression and adenosine deaminase activity in regulatory T cells (Treg) and CD4(+) T effector cells in patients with head and neck squamous cell carcinoma. Oncoimmunology (2012) 1(5):659–69. doi:10.4161/onci.20387
63. Prazma CM, Tedder TF. Dendritic cell CD83: a therapeutic target or innocent bystander? Immunol Lett (2008) 115(1):1–8. doi:10.1016/j.imlet.2007.10.001
64. Rodriguez RM, Pitzalis C, Kingsley GH, Henderson E, Humphries MJ, Panayi GS. T lymphocyte adhesion to fibronectin (FN): a possible mechanism for T cell accumulation in the rheumatoid joint. Clin Exp Immunol (1992) 89(3):439–45. doi:10.1111/j.1365-2249.1992.tb06977.x
65. Shimizu Y, van Seventer GA, Horgan KJ, Shaw S. Costimulation of proliferative responses of resting CD4+ T cells by the interaction of VLA-4 and VLA-5 with fibronectin or VLA-6 with laminin. J Immunol (1990) 145(1):59–67.
66. Turner MD, Nedjai B, Hurst T, Pennington DJ. Cytokines and chemokines: at the crossroads of cell signalling and inflammatory disease. Biochim Biophys Acta (2014) 1843(11):2563–82. doi:10.1016/j.bbamcr.2014.05.014
67. Gibbert K, Schlaak JF, Yang D, Dittmer U. IFN-alpha subtypes: distinct biological activities in anti-viral therapy. Br J Pharmacol (2013) 168(5):1048–58. doi:10.1111/bph.12010
68. Oft M. IL-10: master switch from tumor-promoting inflammation to antitumor immunity. Cancer Immunol Res (2014) 2(3):194–9. doi:10.1158/2326-6066.CIR-13-0214
69. Geijtenbeek TB, Torensma R, van Vliet SJ, van Duijnhoven GC, Adema GJ, van Kooyk Y, et al. Identification of DC-SIGN, a novel dendritic cell-specific ICAM-3 receptor that supports primary immune responses. Cell (2000) 100(5):575–85. doi:10.1016/S0092-8674(00)80693-5
70. Le Y, Zhou Y, Iribarren P, Wang J. Chemokines and chemokine receptors: their manifold roles in homeostasis and disease. Cell Mol Immunol (2004) 1(2):95–104.
71. Lebre MC, Burwell T, Vieira PL, Lora J, Coyle AJ, Kapsenberg ML, et al. Differential expression of inflammatory chemokines by Th1- and Th2-cell promoting dendritic cells: a role for different mature dendritic cell populations in attracting appropriate effector cells to peripheral sites of inflammation. Immunol Cell Biol (2005) 83(5):525–35. doi:10.1111/j.1440-1711.2005.01365.x
72. Ray P, Krishnamoorthy N, Ray A. Emerging functions of c-kit and its ligand stem cell factor in dendritic cells: regulators of T cell differentiation. Cell Cycle (2008) 7(18):2826–32. doi:10.4161/cc.7.18.6752
73. Dorak MT, Lawson T, Machulla HK, Mills KI, Burnett AK. Increased heterozygosity for MHC class II lineages in newborn males. Genes Immun (2002) 3(5):263–9. doi:10.1038/sj.gene.6363862
74. Foroni I, Couto AR, Bettencourt BF, Santos M, Lima M, Bruges-Armas J. HLA-E, HLA-F and HLA-G — the non-classical side of the MHC cluster. In: Xi Y, editor. HLA and Associated Important Diseases. (Chap. 3), (2014). Distributed Under Terms of Creative Commons Attribution License. doi:10.5772/57507
75. Fortin JS, Cloutier M, Thibodeau J. Exposing the specific roles of the invariant chain isoforms in shaping the MHC class II peptidome. Front Immunol (2013) 4:443. doi:10.3389/fimmu.2013.00443
76. Shiina T, Hosomichi K, Inoko H, Kulski JK. The HLA genomic loci map: expression, interaction, diversity and disease. J Hum Genet (2009) 54(1):15–39. doi:10.1038/jhg.2008.5
77. Yang J, Yi Q. Killing tumor cells through their surface beta(2)-microglobulin or major histocompatibility complex class I molecules. Cancer (2010) 116(7):1638–45. doi:10.1002/cncr.24953
78. Ezinne CC, Yoshimitsu M, White Y, Arima N. HTLV-1 specific CD8+ T cell function augmented by blockade of 2B4/CD48 interaction in HTLV-1 infection. PLoS One (2014) 9(2):e87631. doi:10.1371/journal.pone.0087631
79. Ma DY, Clark EA. The role of CD40 and CD154/CD40L in dendritic cells. Semin Immunol (2009) 21(5):265–72. doi:10.1016/j.smim.2009.05.010
80. Ohnuma K, Uchiyama M, Yamochi T, Nishibashi K, Hosono O, Takahashi N, et al. Caveolin-1 triggers T-cell activation via CD26 in association with CARMA1. J Biol Chem (2007) 282(13):10117–31. doi:10.1074/jbc.M609157200
81. Gessani S, Conti L, Del Corno M, Belardelli F. Type I interferons as regulators of human antigen presenting cell functions. Toxins (Basel) (2014) 6(6):1696–723. doi:10.3390/toxins6061696
82. Hillyer P, Raviv N, Gold DM, Dougherty D, Liu J, Johnson TR, et al. Subtypes of type I IFN differentially enhance cytokine expression by suboptimally stimulated CD4(+) T cells. Eur J Immunol (2013) 43(12):3197–208. doi:10.1002/eji.201243288
83. Lee N, You S, Shin MS, Lee WW, Kang KS, Kim SH, et al. IL-6 receptor alpha defines effector memory CD8+ T cells producing Th2 cytokines and expanding in asthma. Am J Respir Crit Care Med (2014) 190(12):1383–94. doi:10.1164/rccm.201403-0601OC
84. Guce AI, Mortimer SE, Yoon T, Painter CA, Jiang W, Mellins ED, et al. HLA-DO acts as a substrate mimic to inhibit HLA-DM by a competitive mechanism. Nat Struct Mol Biol (2013) 20(1):90–8. doi:10.1038/nsmb.2460
85. Edgecombe AD. HLA Class II Expression on Breast Cancer Cells. Masters thesis, Faculty of Medicine, Memorial University of Newfoundland, Canada (2002). Available from: http://research.library.mun.ca/9160/1/Edgecombe_AllisonD.pdf (Accessed: April 5, 2018).
86. Jiang Y, Arase N, Kohyama M, Hirayasu K, Suenaga T, Jin H, et al. Transport of misfolded endoplasmic reticulum proteins to the cell surface by MHC class II molecules. Int Immunol (2013) 25(4):235–46. doi:10.1093/intimm/dxs155
87. Corbiere V, Dirix V, Norrenberg S, Cappello M, Remmelink M, Mascart F. Phenotypic characteristics of human type II alveolar epithelial cells suitable for antigen presentation to T lymphocytes. Respir Res (2011) 12:15. doi:10.1186/1465-9921-12-15
88. Suri A, Jagadish N, Saini S, Gupta N. Targeting cancer testis antigens for biomarkers and immunotherapy in colorectal cancer: current status and challenges. World J Gastrointest Oncol (2015) 7(12):492–502. doi:10.4251/wjgo.v7.i12.492
89. Fratta E, Coral S, Covre A, Parisi G, Colizzi F, Danielli R, et al. The biology of cancer testis antigens: putative function, regulation and therapeutic potential. Mol Oncol (2011) 5(2):164–82. doi:10.1016/j.molonc.2011.02.001
90. Gjerstorff MF, Andersen MH, Ditzel HJ. Oncogenic cancer/testis antigens: prime candidates for immunotherapy. Oncotarget (2015) 6(18):15772–87. doi:10.18632/oncotarget.4694
91. LaVoy EC, Bollard CM, Hanley PJ, Blaney JW, O’Connor DP, Bosch JA, et al. A single bout of dynamic exercise enhances the expansion of MAGE-A4 and PRAME-specific cytotoxic T-cells from healthy adults. Exerc Immunol Rev (2015) 21:144–53.
92. Marchini C, Kalogris C, Garulli C, Pietrella L, Gabrielli F, Curcio C, et al. Tailoring DNA vaccines: designing strategies against HER2-positive cancers. Front Oncol (2013) 3:122. doi:10.3389/fonc.2013.00122
93. Wu TC, Huang AY, Jaffee EM, Levitsky HI, Pardoll DM. A reassessment of the role of B7-1 expression in tumor rejection. J Exp Med (1995) 182(5):1415–21. doi:10.1084/jem.182.5.1415
94. Bonaccorsi I, Pezzino G, Morandi B, Ferlazzo G. Drag cells in immunity (plasmacytoid DCs dress up as cancer cells). Oncoimmunology (2014) 3:e27897. doi:10.4161/onci.28184
95. Nakayama M. Antigen presentation by MHC-dressed cells. Front Immunol (2015) 5:672. doi:10.3389/fimmu.2014.00672
96. Smyth LA, Harker N, Turnbull W, El-Doueik H, Klavinskis L, Kioussis D, et al. The relative efficiency of acquisition of MHC:peptide complexes and cross-presentation depends on dendritic cell type. J Immunol (2008) 181(5):3212–20. doi:10.4049/jimmunol.181.5.3212
97. Huang AY, Bruce AT, Pardoll DM, Levitsky HI. Does B7-1 expression confer antigen-presenting cell capacity to tumors in vivo? J Exp Med (1996) 183(3):769–76. doi:10.1084/jem.183.3.769
98. Huang AY, Golumbek P, Ahmadzadeh M, Jaffee E, Pardoll D, Levitsky H. Role of bone marrow-derived cells in presenting MHC class I-restricted tumor antigens. Science (1994) 264(5161):961–5. doi:10.1126/science.7513904
99. Sharma A, Bode B, Wenger RH, Lehmann K, Sartori AA, Moch H, et al. gamma-Radiation promotes immunological recognition of cancer cells through increased expression of cancer-testis antigens in vitro and in vivo. PLoS One (2011) 6(11):e28217. doi:10.1371/journal.pone.0028217
100. Safi S, Beckhove P, Warth A, Benner A, Roeder F, Rieken S, et al. A randomized phase II study of radiation induced immune boost in operable non-small cell lung cancer (RadImmune trial). BMC Cancer (2015) 15:988. doi:10.1186/s12885-015-2006-2
101. Finkelstein SE, Salenius S, Mantz CA, Shore ND, Fernandez EB, Shulman J, et al. Combining immunotherapy and radiation for prostate cancer. Clin Genitourin Cancer (2015) 13(1):1–9. doi:10.1016/j.clgc.2014.09.001
102. Reynders K, Illidge T, Siva S, Chang JY, De Ruysscher D. The abscopal effect of local radiotherapy: using immunotherapy to make a rare event clinically relevant. Cancer Treat Rev (2015) 41(6):503–10. doi:10.1016/j.ctrv.2015.03.011
103. Makkouk A, Weiner GJ. Cancer immunotherapy and breaking immune tolerance: new approaches to an old challenge. Cancer Res (2015) 75(1):5–10. doi:10.1158/0008-5472.CAN-14-2538
104. Hongisto V, Aure MR, Makela R, Sahlberg KK. The HER2 amplicon includes several genes required for the growth and survival of HER2 positive breast cancer cells – a data description. Genom Data (2014) 2:249–53. doi:10.1016/j.gdata.2014.06.025
105. Sahlberg KK, Hongisto V, Edgren H, Makela R, Hellstrom K, Due EU, et al. The HER2 amplicon includes several genes required for the growth and survival of HER2 positive breast cancer cells. Mol Oncol (2013) 7(3):392–401. doi:10.1016/j.molonc.2012.10.012
106. Evans EE, Henn AD, Jonason A, Paris MJ, Schiffhauer LM, Borrello MA, et al. C35 (C17orf37) is a novel tumor biomarker abundantly expressed in breast cancer. Mol Cancer Ther (2006) 5(11):2919–30. doi:10.1158/1535-7163.MCT-06-0389
107. Katz E, Dubois-Marshall S, Sims AH, Faratian D, Li J, Smith ES, et al. A gene on the HER2 amplicon, C35, is an oncogene in breast cancer whose actions are prevented by inhibition of Syk. Br J Cancer (2010) 103(3):401–10. doi:10.1038/sj.bjc.6605763
108. Kpetemey M, Chaudhary P, Van Treuren T, Vishwanatha JK. MIEN1 drives breast tumor cell migration by regulating cytoskeletal-focal adhesion dynamics. Oncotarget (2016) 7(34):54913–24. doi:10.18632/oncotarget.10798
109. Knaus A, Awaya T, Helbig I, Afawi Z, Pendziwiat M, Abu-Rachma J, et al. Rare noncoding mutations extend the mutational spectrum in the PGAP3 subtype of hyperphosphatasia with mental retardation syndrome. Hum Mutat (2016) 37(8):737–44. doi:10.1002/humu.23006
110. Vassilev B, Sihto H, Li S, Holtta-Vuori M, Ilola J, Lundin J, et al. Elevated levels of StAR-related lipid transfer protein 3 alter cholesterol balance and adhesiveness of breast cancer cells: potential mechanisms contributing to progression of HER2-positive breast cancers. Am J Pathol (2015) 185(4):987–1000. doi:10.1016/j.ajpath.2014.12.018
Keywords: SV-BR-1-GM, GVAX, targeted immunotherapy, whole-cell vaccine, therapeutic cancer vaccine, antigen-presenting cells
Citation: Lacher MD, Bauer G, Fury B, Graeve S, Fledderman EL, Petrie TD, Coleal-Bergum DP, Hackett T, Perotti NH, Kong YY, Kwok WW, Wagner JP, Wiseman CL and Williams WV (2018) SV-BR-1-GM, a Clinically Effective GM-CSF-Secreting Breast Cancer Cell Line, Expresses an Immune Signature and Directly Activates CD4+ T Lymphocytes. Front. Immunol. 9:776. doi: 10.3389/fimmu.2018.00776
Received: 26 July 2017; Accepted: 28 March 2018;
Published: 15 May 2018
Edited by:
José Mordoh, Leloir Institute Foundation (FIL), ArgentinaReviewed by:
Derre Laurent, Centre Hospitalier Universitaire Vaudois (CHUV), SwitzerlandAlex Yee-Chen Huang, Case Western Reserve University, United States
Copyright: © 2018 Lacher, Bauer, Fury, Graeve, Fledderman, Petrie, Coleal-Bergum, Hackett, Perotti, Kong, Kwok, Wagner, Wiseman and Williams. This is an open-access article distributed under the terms of the Creative Commons Attribution License (CC BY). The use, distribution or reproduction in other forums is permitted, provided the original author(s) and the copyright owner are credited and that the original publication in this journal is cited, in accordance with accepted academic practice. No use, distribution or reproduction is permitted which does not comply with these terms.
*Correspondence: Markus D. Lacher, bWxhY2hlckBicmlhY2VsbC5jb20=
†Present address: Joseph P. Wagner, University of California Drug Discovery Consortium, San Francisco, CA, United States
‡These authors have contributed equally to this work.