 Ameya Kulkarni
 Chengying Xu
- Department of Mechanical and Aerospace Engineering, North Carolina State University, Raleigh, NC, United States
Deep learning methods have been extensively studied and have been proven to be very useful in multiple fields of technology. This paper presents a deep learning approach to optically detect hidden hardware trojans in the manufacturing and assembly phase of printed circuit boards to secure electronic supply chains. Trojans can serve as backdoors of accessing on chip data, can potentially alter functioning and in some cases may even deny intended service of the chip. Apart from consumer electronics, printed circuit boards are used in mission critical applications like military and space equipment. Security compromise or data theft can have severe impact and thus demand research attention. The advantage of the proposed method is that it can be implemented in a manufacturing environment with limited training data. It can also provide better coverage in detection of hardware trojans over traditional methods. Image recognition algorithms need to have deeper penetration inside the training layers for recognizing physical variations of image patches. However, traditional network architectures often face vanishing gradient problem when the network layers are added. This hampers the overall accuracy of the network. To solve this a Residual network with multiple layers is used in this article. The ResNet34 algorithm can identify manufacturing tolerances and can differentiate between a manufacturing defect and a hardware trojan. The ResNet operates on the fundamental principle of learning from the residual of the output of preceding layer. In the degradation issue, it is observed that, a shallower network performs better than deeper network. However, this is with the downside of lower accuracy. Thus, a skip connection is made to provide an alternative path for the gradient to skip forward the training of few layers and add in multiple repeating blocks to achieve higher accuracy and lower training times. Implementation of this method can bolster automated optical inspection setup used to detect manufacturing variances on a printed circuit board. The results show a 98.5% accuracy in optically detecting trojans by this method and can help cut down redundancy of physically testing each board. The research results also provide a new consideration of hardware trojan benchmarking and its effect on optical detection.
Introduction
In February of 2021, the United States president Joe Biden signed an executive order on American supply chain. (Biden 2021). The briefing asks for the secretary of commerce to identify risks in semiconductor manufacturing and policy recommendations to thwart cyber-attacks that can impact small businesses and the government. However, cyber security concerns are not restricted to just one country. The Internet of things (IoT) has led to emergence of several new applications in myriad market segments. This need for smarter electronics has led to tremendous growth in the semiconductor segment. The growth is spread from small businesses to fortune 500 companies. In order to remain cost competitive, industries are largely relying on sub vendors and entities which are located globally.
Recently Indian government has announced a billion-dollar cash incentive for semiconductor manufacturers who are willing to set up chip fabrication units in the country. (Phartiyal, and Shah 2021). Lucrative opportunities like these help semiconductor companies to invest on a global platform whilst being cost competitive. Apart from the cost benefits, this helps businesses to develop complex and dynamic supply chains which can remain resilient to any supply chain disruptions. This complex supply chain network however comes along with a downside. The distribution of the supply chain network has several unintentional security vulnerabilities. Untrusted entities in these third-party intellectual property (3PIP) vendors, service stations, wafer manufacturers, System on chip (SOC) developers can exploit these vulnerabilities to alter the functioning of the chip.
A hardware trojan is a malicious modification of the original circuit to exploit the intended functioning. These trojans can serve as backdoors to the hardware design to leak sensitive information. The scope of the hardware trojan however is just not limited to data leaks, instances of attacks like denial of service, downgrading performance have also been recorded [Bhunia, and Tehranipoor 2019a, 109–140]. A typical hardware trojan structure consists of mainly two parts: a trigger and a payload. The payload remains inactive most of the times unless it is set off externally under rare conditions. While the trigger remains optional, the payload is carefully inserted and masked inside the circuit. Since the trigger is activated rarely, its response to test vectors will remain unaffected. Thus, standard functional testing alone cannot provide the necessary coverage to detect these trojans.
Attackers can physically vary distances between circuit elements, changing width and adding components on the printed circuit board. Additionally, automated optical inspection (AOI) is often seen to be ineffective in case of a dense printed circuit board [Bhunia, and Tehranipoor 2019b, 81–105]. Thus, to effectively monitor trojan insertion even the smallest varying patch in a printed circuit board must be critically observed. Detection of these alterations is extremely difficult because of the physical size, process variation, time involved and complex nature of the work. Also, the existing detection methods do not guarantee 100% fault coverage.
By utilizing the advancements in machine vision and artificial intelligence (AI), a technique of optical monitoring can potentially help detect malicious chips hidden inside the printed circuit boards (PCB). Such a technique can not only help in increased coverage, but also will help in automating the task altogether. In this article, we are interested in leveraging the power of sophisticated scanners and image classification algorithms to locate and highlight any physical variation. These variations are labelled and classified into potential hidden chips, manufacturing errors and standard manufacturing variance.
A human analyst can label these variations based on their judgement. This labelled database will then serve as the training data for the classifier network. A transfer learning approach is proposed to help ease the training of the convolutional neural network (CNN) algorithm. Transfer learning is a popular approach in deep learning (Arinez. et al., 2020). In this method, a pre-trained model is used as a steppingstone. New data, which is different, yet similar would be trained over the original model. This helps in reducing computing energy, skill level and makes it easier for implementing deep learning models with limited databases. This step is important for execution in industrial practices as it does not have any requirement on strong computing background from manufacturing employees.
1) In the first step of the proposed approach, a defect-free image dataset will be used as the golden template. An image acquisition set-up at the factory floor would capture raw image data which would then be compared with the template data.
2) The second step in our approach is to extract features based on image processing. The factory floor images acquired in step one would be subtracted from the template highlighting just defects, hidden trojans and any misalignment. The resultant database would then be labelled by an expert human in the loop. As discussed above, a human analyst will label them into three categories: potential trojans, defects and normal manufacturing variances. The accuracy of this method can be evaluated by examining the classification results obtained over a validation dataset.
3) It has been a known fact that feature extraction using deep learning requires the network to penetrate deeper in the trainable layers. A residual learning network ResNet serves well for this purpose. Apart from this, ResNet can overcome the bottlenecking issues as the architecture works by bypassing the input of the first layer and uses it as the output of the last layer, the gradients can flow directly through skip connections from later to initial layers. ResNet can also solve the vanishing gradient problem typically faced by the competitive algorithms. (He, Zhang, Ren and Sun 2015). Considering all these factors, a 34-layered ResNet was selected for the current application.
4) Next, by determining a good learning rate, transfer learning is implemented to fine tune the architecture for verification. The accuracy of the method can be verified by examining the confusion matrix and performing conclusive testing of the boards. This can be performed by examining the functional gates, side channel analysis, etc. By combining the deep learning method and conclusive functional testing a better coverage over hardware trojans detection can be achieved.
Combining the benefits of an image classifier and conclusive functional testing, manufacturers can secure consumer electronics from vulnerabilities with higher accuracy while saving on cost and skills. The key benefit of this method would be faster roll out of detection algorithms with limited data.
Proposed Deep Learning Approach
Image Acquisition
A typical diagnostic method for detecting hardware anomalies consists of two main inspection methods namely: Automated Optical Inspection (AOI) module and X-Ray inspection. Both methods require little to no human interaction. An optical inspection module consists of high definition cameras that captures videos of the assembly line. The video panes are frozen and stitched into a large image file and are compared against a template image. Defects like scratches, blemishes, missing components, skewed alignment can be detected with greater accuracy than a human eye. However, it is important to note the shortcomings of an automated optical inspection. AOI machines cannot identify defects in densely packed circuit boards. The machines are also restricted to line of sight and cannot identify hidden joints. The method also lacks in capturing the depth of the image since it is heavily dependent on the resolution of the optical inspection machine. Higher resolution machines are in effect more costly. A three dimensional optical testing may overcome this however, this method remains expensive and time consuming. Thus, to overcome the high price and increased reliability, an artificial intelligence based multilayered image recognition architecture can be deemed beneficial; as these algorithms can penetrate deep in the trainable layers.
As mentioned earlier, the images acquired by the AOI procedure will consist of manufacturing defects, hidden trojans and manufacturing variability within the control parameters. Since the downstream process of each of these variations differ from one another, it is important for the classifier to generate results to identify the differences in these three variations. Typical hardware defects in a printed circuit boards are over soldering, burs, short circuits, etc. A hardware trojan appearance is recognized by the classifier as a rectangular shape which somewhat resembles a radio frequency (RF) diplexer. A manufacturing defect is much varied in shape. A typical bur or an over solder defect has an appearance of an ink blot. The manufacturing variability is perceived by the classifier as a small red line over the template image.
When multiple labelled variations of these defects are fed to the classifier, the classifier can recognize the similarity between the validation dataset and training dataset. See Figure 1: Labelled training data. This is achieved by the classifier by making decisions based on the external appearance of these variations. The artificial intelligence based ResNet34 classifier will be trained to make decisions and classify verification dataset into these three classes. In the proposed future work, the classifier can be trained to make classification decisions based on types of defects, different classes of trojans, counterfeits, with availability of abundant data.

FIGURE 1. Labelled training data.
In this paper, the image dataset from a linear charge coupled device (CCD) scanner dataset with around 48 pixels per millimeter has been used. The image dataset was adopted from arXiv’s research article (Tang et al., 2019). The original size of the image template and validated image is around 16 k x 16 k pixels. They are cropped into many smaller images with size of 640 × 640 and aligned. This testing data was then modified and samples of hardware trojans were added using graphics editing software application.
The additions made were of various sizes and shapes. A rectangular shape was selected based on an article (Robertson and Riley, 2018), which showcased a nanochip conception resembling a signal conditioning coupler or a RF diplexer. This nanochip was allegedly added to a server’s motherboard to siphon off government data. These chips incorporated memory, networking capability, and had sufficient processing power for an attack.
Image Pre-processing and Feature Extraction
Image differencing is a technique of subtracting a pair of images from one another to highlight changes. A pair of test and template images is carefully aligned so that corresponding points coincide. These images are photometrically compatible. The differenced contour is then stored as an image file. These contours now represent the misalignments, defects, and the hardware trojans that were added. The benefit of doing this is to lower the burden of recognizing patterns on the classifier model. This reduction can also help in tracing issues in a densely packed printed circuit board. This converts the problem of complex pattern recognition into a digit recognition problem. There are multiple commits of digit recognition algorithms that have been used previously by the research community. A transfer learning approach can help retrain these previous commits with limited data more easily.
In this article, after executing the image differentiation step, 1,012 instances of misalignment, manufacturing defects and trojans were recorded. These extracts were saved in portable network graphic format. Next, a labelled dataset from these extracts was created. The extracts were labelled based on human analyst input. The data was stored in a comma separated value file. This dataset was divided into three classification types. The inserted trojan consisted of 11.56% of the entire dataset. The trojan instances were purposely kept below 12% to train the algorithm with limited benchmarked data. This is done assuming that in an actual production scenario, the probability of infected printed circuit boards will be low. This will help simulate the actual production scenario.
Feature Classification
Feature recognition requires a deeper penetration in the training layers of an algorithm. Our labelled dataset was trained on a 34 layered residual network to extract the features. However increasing network depth does not work by stacking layers. Deep networks are harder to train because of the vanishing gradient problem. (He et al., 2015). This saturates the network performance and starts quickly degrading when the network penetrates in deeper training layers. ResNet has been implemented on the low resolution (32 × 32) image dataset CIFAR 10 (Canadian Institute for Advanced Research) and ImageNet 2012 (224 × 224) and has a top 5 error rate of 3.3% (He et al., 2015; He et al., 2016; Ruiz 2018) The image size and resolution here is important as this will directly correspond to the feature map. The size of our trojan is small too. Hence a ResNet model and stochastic gradient descent iterative algorithm (SGD) becomes crucial to train our model. The ResNet34 structure is summarized in Table 1 ResNet 34 Architecture.
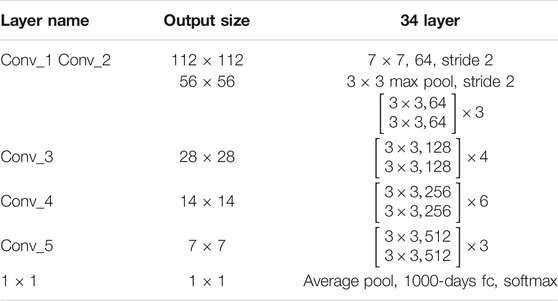
TABLE 1. ResNet 34 architecture.
When the deeper network begins to converge, a degradation problem is revealed: as network depth increases, accuracy becomes saturated and then rapidly degrades. Such degradation is not caused by overfitting and adding more layers to a deep network increase training error does not improve the overall accuracy. The decline in training accuracy demonstrates that not all systems are simple to converge. To overcome this, a deep residual network instead of hoping that a few stacked layers suit a desired underlying mapping directly, they specifically let these layers fit a residual mapping.
The structure of the ResNet 34 consists of 33 convolutional layers (Conv), batch normalization and rectified linear unit (ReLU). A softmax function is applied to the final layer of the ResNet. The output of the Residual block can be mathematically represented as y = F(x)+x. Where x and y are the inputs and outputs of the function and F is the residual function itself. Feedforward neural networks with shortcut connections can realize the formulation of F(x)+x. Shortcut connections are those that skip one or more of the layers. Identity mapping is performed by the shortcut connections, and their outputs are added to the outputs of the stacked layers. When compared to its plain counterpart, the ResNet network converges faster. Figure 2: Overview of ResNet implementation.
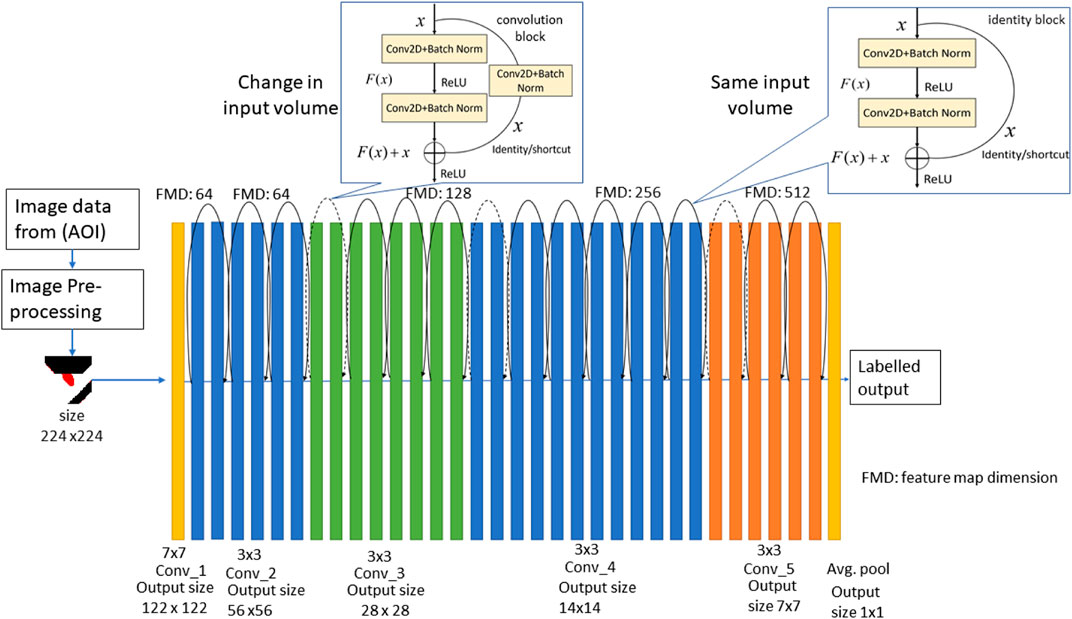
FIGURE 2. Overview of ResNet implementation.
ResNet34 is made up of one convolution and pooling phase followed by four layers of similar actions. Each of the layers follow the same pattern. ResNet performs such 3 × 3 convolution with a fixed feature map dimension [64, 128, 256, 512] and bypass the input after every two convolutions. It is important to note that the width and height remain constant during the entire layer. The dotted line represents the change in the dimension of the input volume.
The implementation of these on the ImageNet 2012 model begins with the resizing of the training data. The subtracted image dataset is resized to 244 × 244 patch. The first phase on the ResNet before entering general layer behavior is a block Conv1 that consists of a convolution layer, batch normalization and max pooling operation. The kernel size used is 7 and the size of the feature map is 64. The output size of the operation is 122 × 122. A batch normalization, which is an elemental operation is then performed. The output volume remains unaffected since it is an element wise operation. Lastly, a max pooling operation of 3 × 3 size is used to get the desired output size.
Padding is used on input layers to tweak the output layers to match the output size. The operation of ResNet consists of several repeating blocks. The 3 × 3 convolutions with batch normalization and max pooling operation comprises of this repeating block. The skip connection for varying input volume is adjusted by increasing stride and performing a convolution and pooling operation to match the input size of the following block. This same procedure is repeated over the entire 34 layers (Conv_2, Conv_3, Conv_4, Conv_5). The down sampling of output volume is achieved by increasing stride over the layers just like in plain architectures.
The identity shortcut or skip connection is done by bypassing output volume to the addition operator. In case of the output dimension not matching input, this shortcut operation performs either a padding operation or convolution operation to ensure the output size is not altered.
This reduction between layers is accomplished by increasing the stride to 2 at the first convolution of each layer, rather than by a pooling operation, as we are accustomed to seeing in down samplers.
To ease the implementation of the algorithm in a manufacturing setting, the deep learning model is trained over fastai library. This library is an open source API based on PyTorch. (Howard and Gugger, 2020; McClure, 2020). The deep learning library in fastai can be useful to train algorithms in an industrial setting since it uses a user friendly coding environment. Since we are going to be using a transfer learning approach to ease training the algorithm with limited data, we have used a pre-trained PyTorch model to cut down on training time. These pretrained models have been trained on large, benchmarked dataset which are similar to our model.
Transfer Learning
Transfer learning is a machine learning approach where a pre-trained model is used to train a new similar model. The benefit of this method is that classifier models do not need to be rebuilt to suit an isolated purpose. The key motivation of using a transfer learning approach is the unavailability of a vast amount of labelled data. Since there is little information on the physical appearance of a hardware trojan, identification and labelling of hardware trojans even by expert analysts is challenging. As more and more hardware trojans are being benchmarked, this issue can be resolved. (Shakya et al., 2017). Another advantage of using the transfer learning approach is that the computing demand drops significantly. In a manufacturing environment, investing on costly servers may not be considered prudent. In transfer learning, the model carries the weights and features from the previous training. This set up is known as the frozen model.
Next, to prevent unnecessary long training times the hyper parameters, specifically learning rate was set with the one cycle policy. (Smith 2018). By setting high learning rates, the model to get more accuracy in less epochs can be developed. The learning rate range test proposed by (Smith 2018), training begins with a small learning rate which is increased gradually and linearly throughout a pre-training run. This single run provides valuable information like the maximum learning rate and the network response over the range of learning rates. This information can be used to find a range of learning rates which can be used to train specific layers based on their position in the unfrozen model. After training the last few layers of the frozen model for ten epochs with the default hyperparameters, the model is unfrozen to update the weights with this differential learning rate. Next, based on the learning rate range plot against the loss function is observed to find out the right learning rate. This ensures that the architecture is fine tuned.
Results
The image classifier was trained on the dataset as described above. An augmented dataset consisting of 20% of the training dataset was used for validating the model. The performance of the classifier was evaluated by examining the confusion matrix. The trained network classified the validation dataset in 3 main types namely, hardware trojan, manufacturing defect and none of these. The confusion matrix was plotted using the SciKit learn’s metrics report (Sklearn.Metrics.Classification_Report — Scikit-Learn 0.24.2 Documentation, 2021).
The diagonal elements of the confusion matrix represent the number of points for which the predicted label is equal to the true label. The non-diagonal elements represent any misclassification by the network. Thus, for ideal performance, the classifier must provide all the values in the diagonal elements and negligible in the non-diagonal elements. Thus, the classifier has flagged 21 trojan instances, defect labels with 79 instances and all 98 instances of manufacturing variability of the validation dataset. The resultant confusion matrix is presented in Figure 3 Confusion Matrix.
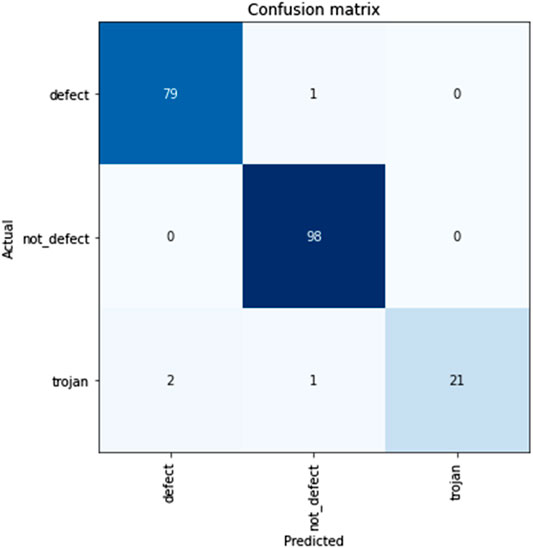
FIGURE 3. Confusion Matrix For the Trojan class, the TP value is 21. FN value is 3, FP is 0, and TN is 177. The overall accuracy of the network is 98.51% with the True positive rate of the trojan class being at 87.5%.
A true positive (TP) is the value that is predicted accurately in the confusion matrix. These are the diagonal elements of the confusion matrix. The true negatives (TN) are the values that are negative and are correctly labelled as negative. False positives (FP) are records that are predicted as positives but are in fact negative. Similarly, false negatives (FN) are values which are predicted as negative but are positives. The performance of the network and resultant confusion matrix can be assessed based on the overall sensitivity also known as true positive rate (TPR), specificity also known as true negative rate (TNR). The positive predictive value (PPV) is the indicator of the overall precision of the method. The negative predictive value (NPV) is the measure of gauging classifier performance for accurately flagging true negative cases. The formulae to calculate each of these parameters is represented in Table 2 Interpretation of Confusion Matrix.
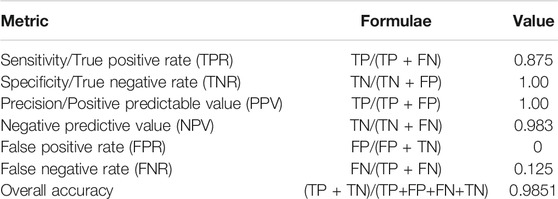
TABLE 2. Interpretation of confusion matrix.
The results for true positive rate (TPR), the true negative rate (TNR), Positive predictive value (PPV), negative predictive value (NPV), false positive rate (FPR) and overall accuracy (ACC) for the Trojan class is showcased in Table 2 Interpretation of Confusion Matrix. False positive rate (FPR) and false negative rate (FNR) is used to understand classifier misrepresentation percentage. These rates should be close to null.
Discussion
Improvement in Accuracy
Based on the interpretation of the confusion matrix the proposed methodology has accurately identified malicious modification with 98.51% accuracy. The key focus of the method is to effectively launch an image classifier with limited data. In the conducted study, the model was able to learn from a dataset with only 117 instances of trojans out of 1,012 images. With more labelled data, the accuracy of the method can be enhanced. Another way of improving accuracy is by augmenting available data (Shorten and Khoshgoftaar 2019). As mentioned earlier, feature extraction requires training networks to have deeper penetration. Use of alternative networks like ResNet 50 or ResNet100 can help enhance the feature representation. However, this comes with the downside of increased training time and need for abundant labelled data.
Improvement in Recognition of Hardware Trojans
Optical detection of PCB defects using a deep learning approach have been extensively studied (Deng et al., 2018) (Dai et al., 2020) (Zhang et al., 2018). In the future, a multiclass image classifier could potentially detect defect types, multiple hardware trojan class, counterfeits with greater precision using a single deep learning algorithm. The study further highlights the need of benchmarking hardware trojans and documenting the physical attributes of the trojans can help train the classifier to detect and classify hardware trojan with type and class. (Shakya et al., 2017) (Salmani, Tehranipoor and Karri 2013). Further, conclusive testing by performing a side channel analysis on the true positive trojan boards can improve the coverage of detecting hardware trojans. (Amelian and Borujeni 2018). This will help reduce the redundancy of testing all the boards for hardware trojans. Thereby, saving usable man hours and making it a practical solution in creating a resilient electronic supply chain.
Alternative Uses of Methodology
The use of deep learning is not limited just to recognizing malicious chips in printed circuit boards. While the scope of the paper limits the application to trojan detection, the methodology can have multiple other applications like automated quality monitoring (Shevchik et al., 2019), early detection of terminal illness like Coronavirus (El Asnaoui and Chawki 2020), detection of defects in steel rolls [Feng, Gao and Luo 2021] to name a few areas.
Data Availability Statement
The raw data supporting the conclusion of this article will be made available by the authors, without undue reservation.
Author Contributions
AK and CX conceived the idea for the article, planned the structure, and edited the final manuscript. AK wrote significant sections of the final manuscript. CX is the main organizer and advisor of this work.
Conflict of Interest
The authors declare that the research was conducted in the absence of any commercial or financial relationships that could be construed as a potential conflict of interest.
Publisher’s Note
All claims expressed in this article are solely those of the authors and do not necessarily represent those of their affiliated organizations, or those of the publisher, the editors and the reviewers. Any product that may be evaluated in this article, or claim that may be made by its manufacturer, is not guaranteed or endorsed by the publisher.
References
Amelian, A., and Borujeni, S. E. (2018). A Side-Channel Analysis for Hardware Trojan Detection Based on Path Delay Measurement. J. Circuit Syst. Comp. 27 (09), 1850138. doi:10.1142/s0218126618501384
Arinez, J. F., Chang, Q., Gao, R. X., Xu, C., and Zhang, J. (2020). Artificial Intelligence in Advanced Manufacturing: Current Status and Future Outlook. J. Manufacturing Sci. Eng. 142 (11), 110804. doi:10.1115/1.4047855
Bhunia, S., and Tehranipoor, M. (2019b). Printed Circuit Board (PCB): Design and Test. Hardware Security, 81–105. doi:10.1016/b978-0-12-812477-2.00009-5
Bhunia, S., and Tehranipoor, M. (2019a). “Hardware Trojans.” Hardware Security. Hardware Trojans, 109–140. doi:10.1016/b978-0-12-812477-2.00010-1
Biden, J. R. (2021). Executive Order on America's Supply Chains. Washington DC: The White House. The United States GovernmentAvailable at: https://www.whitehouse.gov/briefing-room/presidential-actions/2021/02/24/executive-order-on-americas-supply-chains/ (February 24, 2021).
Dai, W., Mujeeb, A., Erdt, M., and Sourin, A. (2020). Soldering Defect Detection in Automatic Optical Inspection. Adv. Eng. Inform. 43, 101004. doi:10.1016/j.aei.2019.101004
Deng, Y.-S., Luo, A.-C., and Dai, M.-J. (2018). Building an Automatic Defect Verification System Using Deep Neural Network for PCB Defect Classification, 4Th International Conference on Frontiers of Signal Processing. Poitiers, France: ICFSP. doi:10.1109/icfsp.2018.8552045
El Asnaoui, K., and Chawki, Y. (2020). Using X-Ray Images and Deep Learning for Automated Detection of Coronavirus Disease. J. Biomol. Struct. Dyn. 39, 3615–3626. doi:10.1080/07391102.2020.1767212
He, K., Zhang, X., Ren, S., and Sun, J. (2015). Deep Residual Learning for Image Recognition. Available at: https://arxiv.org/abs/1512.03385.
He, K., Zhang, X., Ren, S., and Sun, J. (2016). Deep Residual Learning for Image Recognition, IEEE Conference on Computer Vision and Pattern Recognition, Las Vegas, NV, June 27-30, 2016. Las Vegas, NV: CVPR. doi:10.1109/cvpr.2016.90
Howard, J., and Gugger, S. (2020). Fastai: A Layered API for Deep Learning. Information 11 (2), 108. doi:10.3390/info11020108
McClure, S. (2020). Building an End-To-End Defect Classifier Application for Printed Circuit Boards. Available at: https://towardsdatascience.com/building-an-end-to-end-deep-learning-defect-classifier-application-for-printed-circuit-board-pcb-6361b3a76232 (Accessed March 15, 2021).
Phartiyal, S., and Shah, A. (2021). “Exclusive: A Billion for Every Chip-Maker Who 'Makes in India,' Sources Say.” Reuters. Available at: https://www.reuters.com/article/india-semiconductor/exclusive-a-billion-for-every-chip-maker-who-makes-in-india-sources-say-idUSKBN2BN12H (March 31, 2021).
Robertson, J., and Riley, M. (2018). The Big Hack: How China Used a Tiny Chip to Infiltrate U.S. Companies. New York City, NY: Bloomberg Bussinessweek Available at: https://www.bloomberg.com/news/features/2018-10-04/the-big-hack-how-china-used-a-tiny-chip-to-infiltrate-america-s-top-companies.
Ruiz, P. (2018). Towards Data Science. Understanding and Visualizing Resnets, Available at: https://towardsdatascience.com/understanding-and-visualizing-resnets-442284831be8.
Salmani, H., Tehranipoor, M., and Karri, R. 2013. "On Design Vulnerability Analysis and Trust Benchmarks Development". IEEE 31St International Conference On Computer Design (ICCD). doi:10.1109/iccd.2013.6657085
Shakya, B., He, T., Salmani, H., Forte, D., Bhunia, S., and Tehranipoor, M. (2017). Benchmarking of Hardware Trojans and Maliciously Affected Circuits. J. Hardw Syst. Secur 1 (1), 85–102. doi:10.1007/s41635-017-0001-6
Shevchik, S. A., Masinelli, G., Kenel, C., Leinenbach, C., and Wasmer, K. (2019). Deep Learning for In Situ and Real-Time Quality Monitoring in Additive Manufacturing Using Acoustic Emission. IEEE Trans. Ind. Inf. 15 (9), 5194–5203. doi:10.1109/tii.2019.2910524
Shorten, C., and Khoshgoftaar, T. M. (2019). A Survey on Image Data Augmentation for Deep Learning. J. Big Data 6 (1). doi:10.1186/s40537-019-0197-0
Smith, Leslie. N. (2018). A Disciplined Approach to Neural Network Hyper-Parameters: Part 1 - Learning Rate, Batch Size, Momentum, and Weight Decay. Available at: ArXiv.abs/1803.09820. doi:10.1201/9780203741009
Sklearn.Metrics.Classification_Report — Scikit-Learn 0.24.2 Documentation (2021). Scikit-Learn.Org. Available at: https://scikit-learn.org/stable/modules/generated/sklearn.metrics.classification_report.html.
Tang, S., Fan, H., Huang, X., and Yang, J. (2019). Online PCB Defect Detector on A New PCB Defect Dataset. February 17. Available at: https://arxiv.org/abs/1902.06197.
Keywords: hardware trojan, deep learning, artificial intelligence, printed circuit boards manufacturing, optical inspection, hardware cybersecurity
Citation: Kulkarni A and Xu C (2021) A Deep Learning Approach in Optical Inspection to Detect Hidden Hardware Trojans and Secure Cybersecurity in Electronics Manufacturing Supply Chains. Front. Mech. Eng 7:709924. doi: 10.3389/fmech.2021.709924
Received: 14 May 2021; Accepted: 16 July 2021;
Published: 27 July 2021.
Edited by:
Amir Koushyar Ziabari, Oak Ridge National Laboratory (DOE), United StatesReviewed by:
William Halsey, Oak Ridge National Laboratory (DOE), United StatesAbdulrahman Alaql, University of Florida, United States
Copyright © 2021 Kulkarni and Xu. This is an open-access article distributed under the terms of the Creative Commons Attribution License (CC BY). The use, distribution or reproduction in other forums is permitted, provided the original author(s) and the copyright owner(s) are credited and that the original publication in this journal is cited, in accordance with accepted academic practice. No use, distribution or reproduction is permitted which does not comply with these terms.
*Correspondence: Chengying Xu, Y2hlcnlsLnh1QG5jc3UuZWR1