 Quan Zhou
 Fan Zhang†
- Department of Gynecology and Obstetrics, The People's Hospital of China Three Gorges University/The First People's Hospital of Yichang, Yichang, China
E2Fs are a family of pivotal transcription factors. Accumulative evidence indicates that aberrant expression or activation of E2Fs is a common phenomenon in malignances, and significant associations have been noted between E2Fs and tumorigenesis or progression in a wide range of cancers. However, the expression patterns and exact roles of each E2F contributing to tumorigenesis and progression of ovarian cancer (OC) have not yet been elucidated. In this study, we investigated the distinct expression and prognostic value of E2Fs in patients with OC by analyzing a series of databases, including ONCOMINE, GEPIA, cBioPortal, Metascape, and Kaplan–Meier plotter. The mRNA expression levels of E2F1/3/5/8 were found to be significantly upregulated in patients with OC and were obviously associated with tumor stage for OC. Aberrant expression of E2F2/5/7/8 was found to be associated with the clinical outcomes of patients with OC. These results suggest that E2F2/5/8 might serve as potential prognostic biomarkers and targets for OC. However, future studies are required to validate our findings and promote the clinical utility of E2Fs in OC.
Introduction
Ovarian cancer (OC) is a commonly diagnosed gynecological malignancy with the highest cancer-related death rate worldwide (1). According to the development trend, the lifetime incidence for ovarian malignancies is 1 in 72 (1.39%), and the lifetime risk of death from OC is 1 in 96 (1.04%) for women (2). In 2018, approximately 22,240 new cases of OC were diagnosed, and 14,070 OC-related deaths occurred in the United States (3). The high lethality rate can be attributed to the lack of effective biomarkers to detect the disease and to predict the outcome for heterogeneous biological subgroups of patients. Over 75% of patients are not diagnosed until the disease is advanced (stages III and IV), for which the 5-year overall survival (OS) rate is below 30 % (2, 4, 5). Thus, identifying reliable predictive biomarkers for early diagnosis and precise prognosis and developing novel molecular-targeted therapeutic strategies for OC are urgently required.
At present, several predictive biomarkers, which might have potential diagnostic, prognostic, or therapeutic values for OC, have been reported. Some of these markers include osteopontin, mesothelin, vascular cell adhesion molecule-1, kallikreins, B7-H4, human prostasin, apolipoprotein A1, interleukin-6/8, glutathione S-transferase polymorphisms, folate receptor alpha miRNA, and aldehyde dehydrogenase (6). Although some of the abovementioned biomarkers of OC have attracted considerable attention, most of them were investigated individually and not as a part of the entire oncogenesis process; related studies are still in the preliminary investigation or clinical validation stage. Further, these potential OC biomarkers do not play a significant role in improving the screening, diagnosis, prognosis, prevention, and therapy of OC (3, 4).
E2Fs, a group of genes that encode a family of transcription factors in higher eukaryotes, are widely expressed in many tissues and organs (7). The E2F family includes eight members: E2F1 to E2F8 (8). The members have different homology, which apparently affects their function; hence, the E2F family is divided into the following two subfamilies: E2F1-3 are activators of transcription, whereas E2F4-8 act as repressors (9). The molecular functions of E2Fs are cellular proliferation, differentiation, DNA repair, cell cycle regulation, and cell apoptosis (10). Increased aberrant expression or activation of E2Fs has been reported in several human malignancies; in some studies, E2Fs might act as promising biomarkers to predict tumor prognosis (9–11). Therefore, identifying the underling mechanisms of E2F-mediated oncogenes or tumor suppressors as predictive biomarkers might provide novel therapeutic strategies. Several E2Fs were shown to be deregulated in OC compared with that in normal tissues, and high expression levels of E2F1, E2F2, E2F4, E2F7, and E2F8 were found to be significantly associated with survival rate in OC (12, 13). More importantly, E2F1 and E2F2 have attracted increasing attention as targeted molecular therapeutic genes for OC (13–16). However, the differences in expression levels, genetic alterations, biological functions, molecular mechanisms, and prognostic significance of the majority of E2Fs in OC have not yet been completely elucidated.
The development of microarray and RNA-sequencing technology has revolutionized RNA and DNA research, which has become a crucial component of biological and biomedical research (17, 18). In this study, we extended the knowledge related to OC based on various large databases for conducting the comprehensive analysis of the relationships between the eight E2F subtypes and the pathogenesis and progression of OC.
Materials and Methods
ONCOMINE Analysis
The gene expression array datasets of ONCOMINE (www.oncomine.org) are a publicly accessible, online cancer microarray database that helps facilitate research from genome-wide expression analyses. ONCOMINE was used to analyze the mRNA levels of E2F family members in OC (19, 20). The thresholds were restricted as follows: P-value = 0.001; fold-change = 1.5; and data type, mRNA. For each gene, comparison between cancer specimen and normal control dataset analysis was performed.
GEPIA Dataset Analysis
Gene Expression Profiling Interactive Analysis (GEPIA) is an interactive web server for estimating mRNA expression data based on 9,736 tumors and 8,587 normal samples in the Cancer Genome Atlas (TCGA) and Genotype-tissue Expression dataset projects. GEPIA provides key interactive and customizable functions, including differential expression analysis, profiling plotting, correlation analysis, patient survival analysis, similar gene detection, and dimensionality reduction analysis (21).
TCGA and CBioPortal Analysis
The cBioPortal for cancer genomics (http://www.cbioportal.org/) is affiliated with the Memorial Sloan Kettering Cancer Center and provides information regarding the integrative analysis of complex cancer genomics and clinical profiles from 105 cancer studies in the TCGA pipeline (22). The frequency of E2F family gene alterations (amplification, deep deletion, and missense mutations), copy number variance obtained from Genomic Identification of Significant Targets in Cancer(GISTC), and mRNA expression z-scores (RNA Seq V2 RSEM) were assessed using the cBioPortal for Cancer Genomics database and TCGA. In addition, co-expression and network analyses were performed according to the online instructions of cBioPortal (23).
Functional Enrichment Analysis
Metascape (http://metascape.org) is a free, well-maintained, user-friendly gene-list analysis tool for gene annotation and analysis. It is an automated meta-analysis tool to understand common and unique pathways within a group of orthogonal target-discovery studies. In this study, Metascape was used to conduct pathway and process enrichment analysis of E2F family members and neighboring genes significantly associated with E2F alterations. For this, the Gene Ontology (GO) terms for biological process, cellular component, and molecular function categories, as well as Kyoto Encyclopedia of Genes and Genomes (KEGG) pathways, were enriched based on the Metascape online tool. Only terms with P-value < 0.01, minimum count of 3, and enrichment factor of >1.5 were considered as significant. The most statistically significant term within a cluster was chosen as the one representing the cluster. A subset of enriched terms was selected and rendered as a network plot to further determine the relationship among terms, where terms with similarity of >0.3 were connected by edges. Protein–protein interaction enrichment analysis was performed using the following databases: BioGrid, InWeb_IM, and OmniPath. Further, Molecular Complex Detection (MCODE) algorithm was applied to identify densely connected network components.
The Kaplan–Meier Plotter Analysis
Kaplan–Meier plotter (www.kmplot.com) is an online database containing microarray gene expression data and survival information derived from Gene Expression Omnibus, TCGA, and the Cancer Biomedical informatics Grid, which contain gene expression data and survival information of 1,816 clinical OC patients (24). In this study, the prognostic value of the mRNA expression of E2F family members was evaluated using the Kaplan–Meier plotter. The OS, progression-free survival (PFS), and post-progression survival (PPS) of patients with OC were determined by dividing the patient samples into two groups based on median expression (high vs. low expression) and assessing using a Kaplan–Meier survival plot, with a hazard ratio with 95% confidence intervals and log rank p-value. Subgroup analyses were performed by dividing patients based on pathological and histological subtypes.
Results
Transcription Levels of E2Fs in Patients With OC
Eight E2F family members have been identified in human cancers. We compared the transcriptional levels of E2Fs in cancers with those in normal tissue samples by using ONCOMINE databases (Figure 1 and Table 1). ONCOMINE analysis revealed that the mRNA expression of E2F1, E2F4, E2F5, and E2F8 was upregulated in patients with OC. The transcription levels of E2F1 were significantly higher in patients with OC in three datasets (25, 26). In Yoshihara's dataset (26), E2F1 was overexpressed in ovarian serous adenocarcinoma compared with that in the normal samples, with a fold change of 26.734 and p–value of 6.79E-05. In Bonome's dataset (25), E2F1 was overexpressed in ovarian carcinoma with a fold change of 1.644 and p–value of 2.60E-07. In the TCGA dataset, E2F1 was overexpressed in ovarian serous carcinoma compared with that in the normal samples, with a fold change of 1.639 and p–value of 1.29E-06. The transcription levels of E2F3 were significantly higher in patients with OC in four datasets (26–28). In the TCGA dataset, the fold change of mRNA expression of E2F3 in ovarian serous carcinoma was 2.013 and p–value of 1.96E-11. In Welsh's dataset (27), E2F3 was upregulated in ovarian serous carcinoma with a fold change of 2.574 and p–value of 3.40E-07. In Lu's dataset (28) and Yoshihara's dataset (26), E2F3 was significantly overexpressed in ovarian serous adenocarcinoma with fold changes of 1.838 (p–value = 1.27E-04) and 1.833 (p–value = 5.66E-04), respectively. The mRNA levels of E2F4 in ovarian carcinoma (fold change = 1.573 and p–value = 7.77E-04) and ovarian serous carcinoma (fold change = 2.574 and p–value = 1.01E-06) were significantly higher than those in the normal samples in Bonome's (25) and Welsh's datasets (27). The transcriptional levels of E2F5 in ovarian carcinoma (fold change = 4.355 and p–value = 2.71E-08) were significantly different from those in the normal samples in Yoshihara's dataset (26). A similar trend was found for E2F8 in Lu's (28) and TCGA datasets: the mRNA levels of E2F8 in ovarian serous adenocarcinoma (fold change = 1.771 and p–value = 6.04E-05) and ovarian serous carcinoma (fold change = 3.136 and p–value = 7.97E-06) were significantly higher than those in the normal samples. In addition, no significant difference in E2F2, E2F6, and E2F7 mRNA expression was found between OC and normal controls, according to ONCOMINE analysis. Although the transcription levels of E2F2 were also slightly higher than those in normal ovarian tissues with p-value of no more than 0.05, the cut-off of fold change was <1.5.
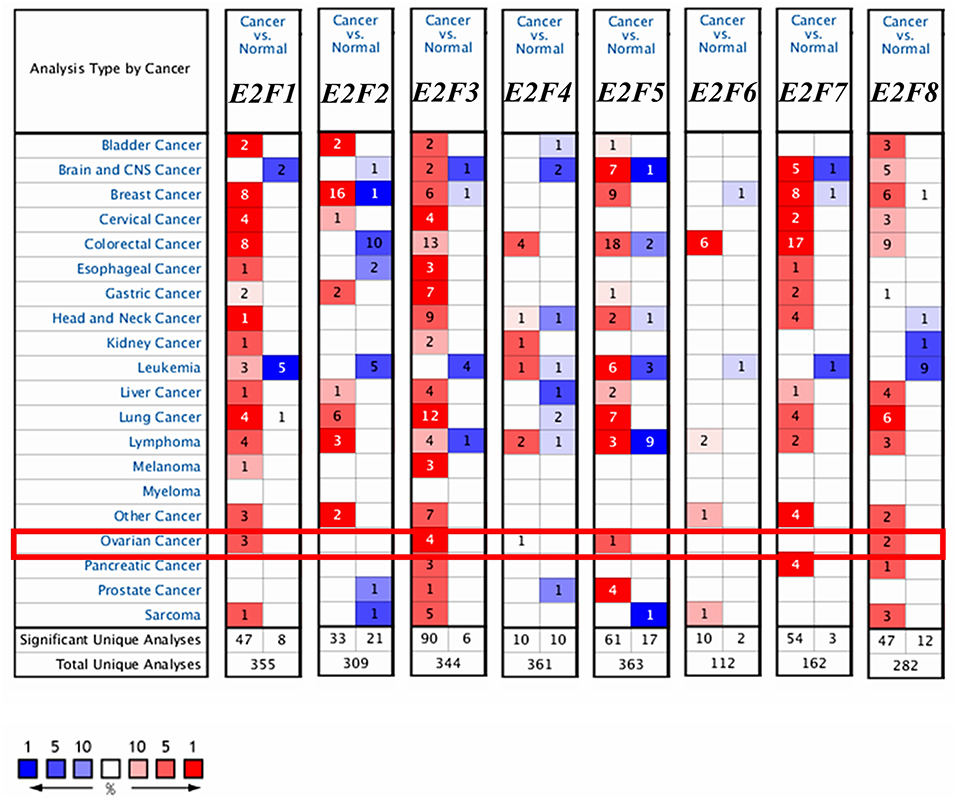
Figure 1. The transcription levels of E2F family members in different types of cancers (ONCOMINE). The graph shows the numbers of datasets with statistically significant mRNA over-expression (red) or down-regulated expression (blue) of the target gene. The threshold was designed with following parameters: p-value of 1E-3 and fold change of 1.5.
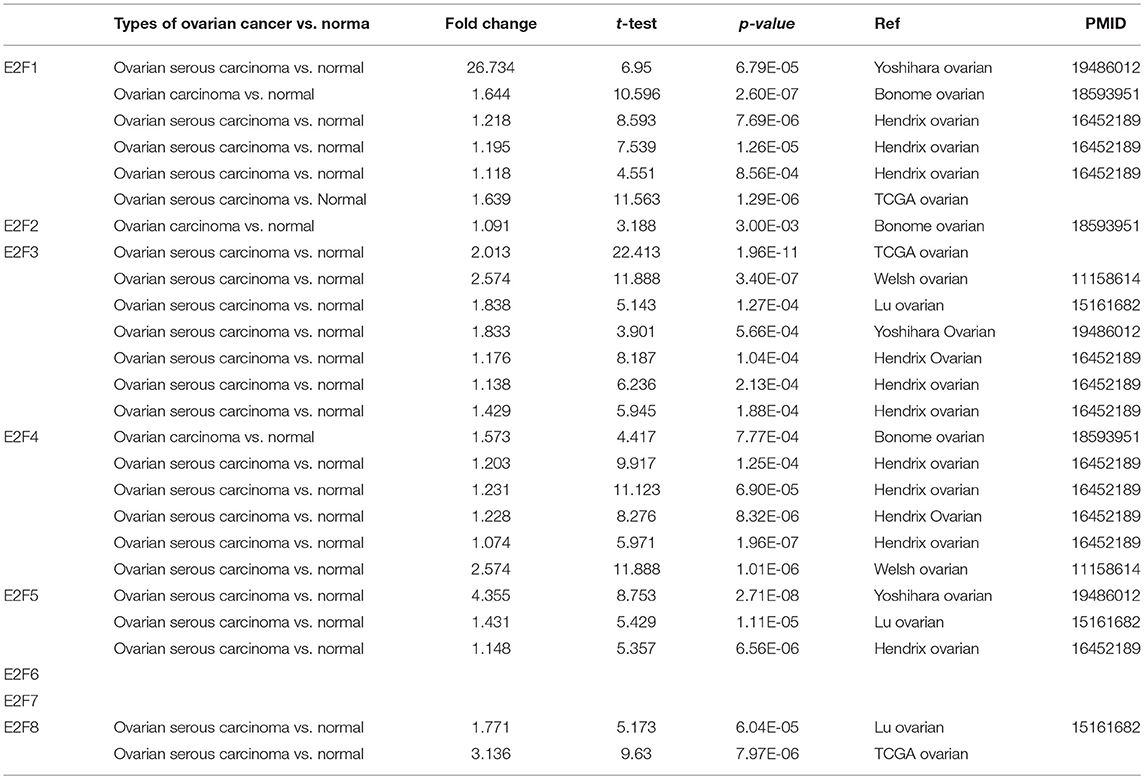
Table 1. The transcription levels of E2F family members in between different types of OC and ovarian normal tissues (ONCOMINE).
We compared the transcription expression of E2F family members between OC and normal tissues by using the GEPIA dataset (Figure 2). The results showed that the mRNA expression levels of E2F1, E2F2, E2F3, E2F5, and E2F8 were significantly higher in OC tissues than in normal ovarian tissues, whereas the transcription expression levels of E2F4, E2F6, and E2F7 were not significantly different between OC and normal tissues. By using the GEPIA dataset, we also analyzed the relationship between the transcription levels of E2Fs and the tumor stage of patients with OC. The mRNA expression of E2F family members was found to be significantly and negatively associated with the tumor stage for OC (Figure 3).
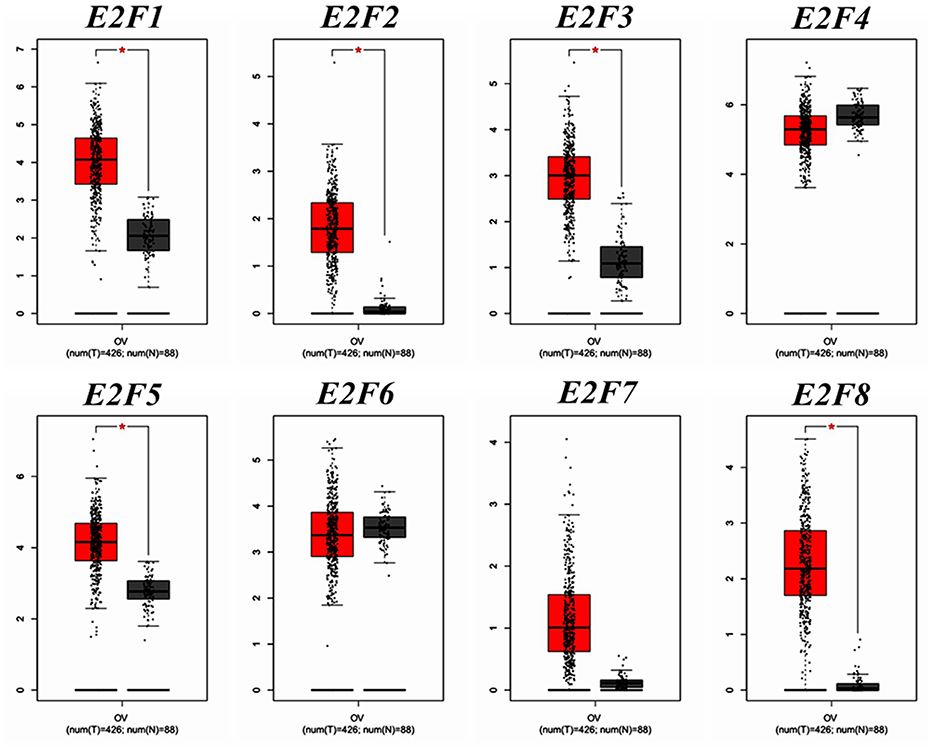
Figure 2. The expression of E2F family members in OC patients (GEPIA). Box plots derived from gene expression data for GEPIA comparing the expression of a specific E2F family member in OC tissue and normal tissues; the p-value was set at 0.05. The mRNA expression pattern of E2F1, E2F2, E2F3, E2F4, E2F5, E2F6, E2F7, and E2F8 between OC and normal tissues. *Indicate that the results are statistically significant.
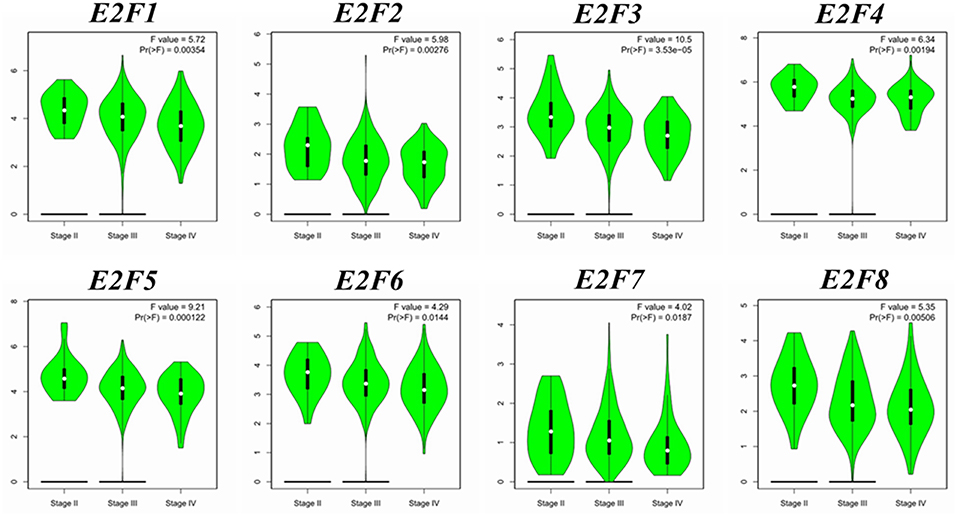
Figure 3. Correlation between E2F expression and tumor stage in OC patients (GEPIA). Violin plot derived from correlation between the expression of a specific E2F family member and tumor stage in patients with OC; the p-value was set at 0.05. The distribution of E2F1, E2F2, E2F3, E2F4, E2F5, E2F6, E2F7, and E2F8 mRNA expression correlated with tumor stage.
Co-expression and Interaction Analyses of E2Fs at the Gene and Protein Levels in Patients With OC
Pearson correlation analysis was conducted using expression data (RNA Seq V2 RSEM) of E2F family members collected from the cBioPortal online tool for OC (TCGA, Provisional). The results indicated a significant positive correlation among E2F1 and E2F3; E2F3 with E2F1, E2F4, and E2F7; E2F4 with E2F3 and E2F8; and E2F8 with E2F4. However, significant negative correlations were noted for E2F2 with E2F5; E2F5 with E2F2 and E2F8; and E2F8 with E2F2 (Figure 4A).
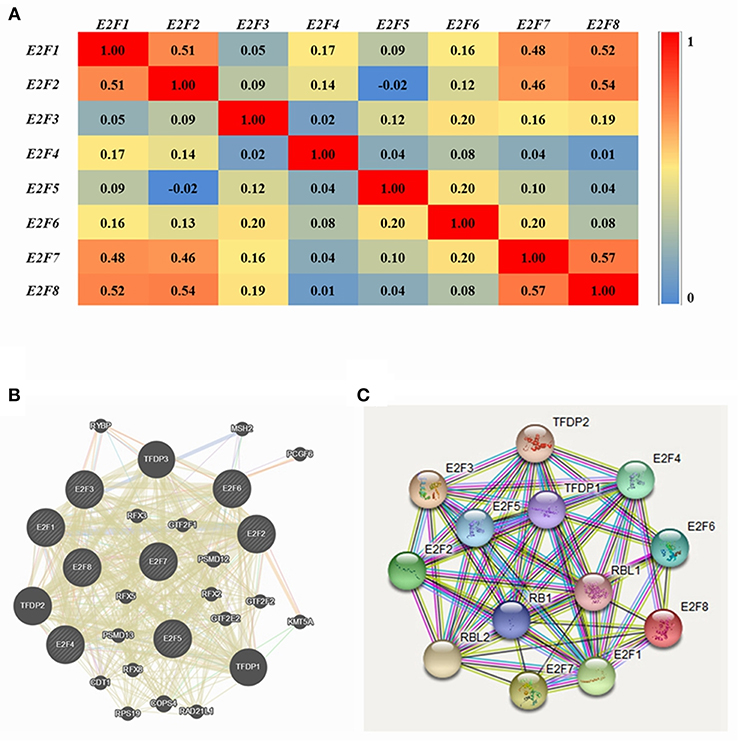
Figure 4. Co-expression and interaction analysis of E2F family members at the gene and protein levels in patients with OC (cBioPortal and GeneMANIA). (A) Pearson correlation of E2F family members. (B) Gene–gene interaction network among E2F family members in the cBioPortal dataset. (C) Protein–protein interaction network among E2F family members in the GeneMANIA dataset.
GeneMANIA was used to conduct correlation analysis of E2F family members at the gene level (Figure 4B). The results revealed relationships in co-expression between E2F1 and E2F2, E2F2 and E2F5, E2F3 and E2F2, E2F6 and E2F5, as well as E2F7 and E2F2. Relationships were noted in co-localization between E2F1 and E2F3, as well as E2F3 and E2F2. Further, relationships were noted between E2F3 and E2F4 in genetic interactions, and E2F1 and E2F2 participated in a network group. In addition, the same pathway was shared between E2F1 and E2F3, E2F1and E2F4, E2F3 and E2F4, as well as E2F4 and E2F2. Physical interactions were noted between E2F1 and E2F4 as well as E2F7 and E2F2. Moreover, relationships were noted between E2F1 with E2F4 and E2F5, E2F2 and E2F5, E2F3 and E2F4, E2F4 and E2F2, as well as E2F6 and E2F5. Shared protein domains were noted among E2F1 with E2F5, E2F7, and E2F8; E2F2 with E2F6 and E2F8; E2F3 with E2F5, E2F6, E2F7, and E2F8; E2F4 with E2F5 and E2F8; E2F6 and E2F5; E2F7 with E2F4, E2F5, E2F6, and E2F8; as well as E2F8 with E2F5 and E2F6.
STRING analysis was conducted to identify interactions of E2F gene family members at the protein expression level. E2F1 was shown to interact with E2F2, E2F4, and E2F8, and E2F7 was found to interact with E2F8 with regard to co-expression, text-mining, and protein homology. Detailed results are shown in Figure 4C.
E2F Genetic Alteration and Neighbor Gene Network in Patients With OC
Alteration frequency of E2F mutations in OC was analyzed using cBioPortal. A total of 839 patients from three datasets of ovarian serous carcinoma were analyzed. Among the 3 OC datasets analyzed, gene set/pathway was altered in 389 (22.2%) of the queried samples, and alterations ranging from 31.02% (188/606) to 13.7% (83/606) were found for the gene sets submitted for analysis (Figure 5A). The percentages of genetic alterations in E2F family members for OC varied from 3 to 14% for individual genes based on the TCGA Provisional dataset (E2F1, 9%; E2F2, 4%; E2F3, 16%; E2F4, 10%; E2F5, 14%; E2F6, 10%; E2F7, 3%; E2F8, 4%; Figure 5B). The results of Kaplan–Meier plotter and log-rank test indicated no significant difference in OS and disease-free survival (DFS) between the cases with alterations in one of the query genes and those without alterations in any query genes (P-values, 0.224 and 0.874, respectively; Figures 5C,D). Next, we constructed the network for E2Fs and the 50 most frequently altered neighbor genes by using the cBioPortal. The results showed that ATR, CBX4, CCND2, CCNE1, CCNE2, CDK6, CDKN1A, CDKN1B, CEBPA, CEEBBP, CTBP1, DNMT1, EED, EZH2, GSK3B, HDAC1, HES1, LIN37, LIN9, MAML2, MAMLD1, MAPK11, MCL1, MYC, NFATC2, PCNA, POLD3, POLG, PRMT5, RB1, RBBP4, RBL2, RPS6KB1, RRM2B, SMAD2, SMARCA2, SNW1, SUV39H1, SUZ12, TBP, TERT, TFDP2, TFE3, TK2, TOPBP1, TP53, TRRAP, UXT, XRCC1, and YY1 were closely associated with E2F alterations and functions (Figure 5E).
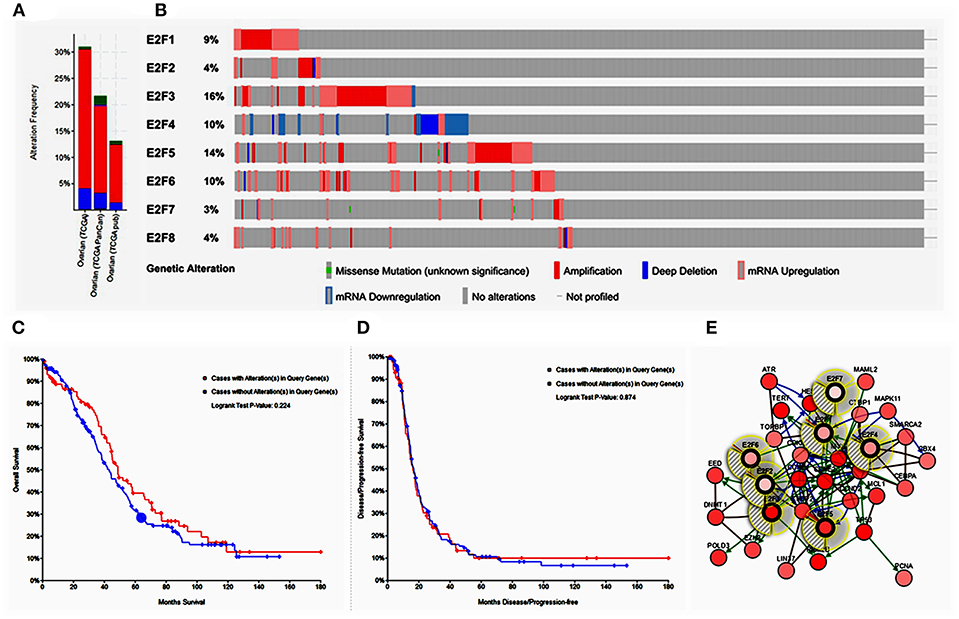
Figure 5. Alteration frequency of E2F family members and neighbor gene network in OC (cBioPortal). (A) Summary of alterations in E2F family members. (B) OncoPrint visual summary of alteration on a query of E2F family members. (C) Kaplan–Meier plots comparing OS in cases with/without E2F family member gene alterations. (D) Kaplan–Meier plots comparing disease-free survival (DFS) in cases with/without E2F family member alterations. (E) Gene–gene interaction network among E2F family members and 50 most frequently altered neighboring genes.
Functional Enrichment Analysis of E2Fs in Patients With OC
The functions of E2F family members and their neighboring genes were predicted by analyzing GO and KEGG in Metascape. The top 20 GO enrichment items were classified into three functional groups: biological process group (11 items), molecular function group (5 items), and cellular component group (4 items; Figures 6A,B and Table 2). The E2F family members and their neighboring genes were mainly enriched in cell cycle, apoptosis, and transcriptional regulation biological processes such as G1/S transition of mitotic cell cycle, negative regulation of G0 to G1 transition, negative regulation of cell proliferation, DNA biosynthetic process, DNA replication, telomere maintenance, negative regulation of cell differentiation, negative regulation of transcription involved in G1/S transition of mitotic cell cycle, intrinsic apoptotic signaling pathway by p53 class mediator, liver development, and apoptotic signaling pathway. The molecular functions for these genes were mainly transcription regulation by sequence-specific DNA binding, transcription co-regulator activity, promoter-specific chromatin binding, DNA-binding transcription repressor activity, RNA polymerase II-specific, and RNA polymerase II transcription factor binding; the cellular components that these genes were involved in were the nuclear chromosome, transferase complex, SWI/SNF superfamily-type complex, and nuclear body.
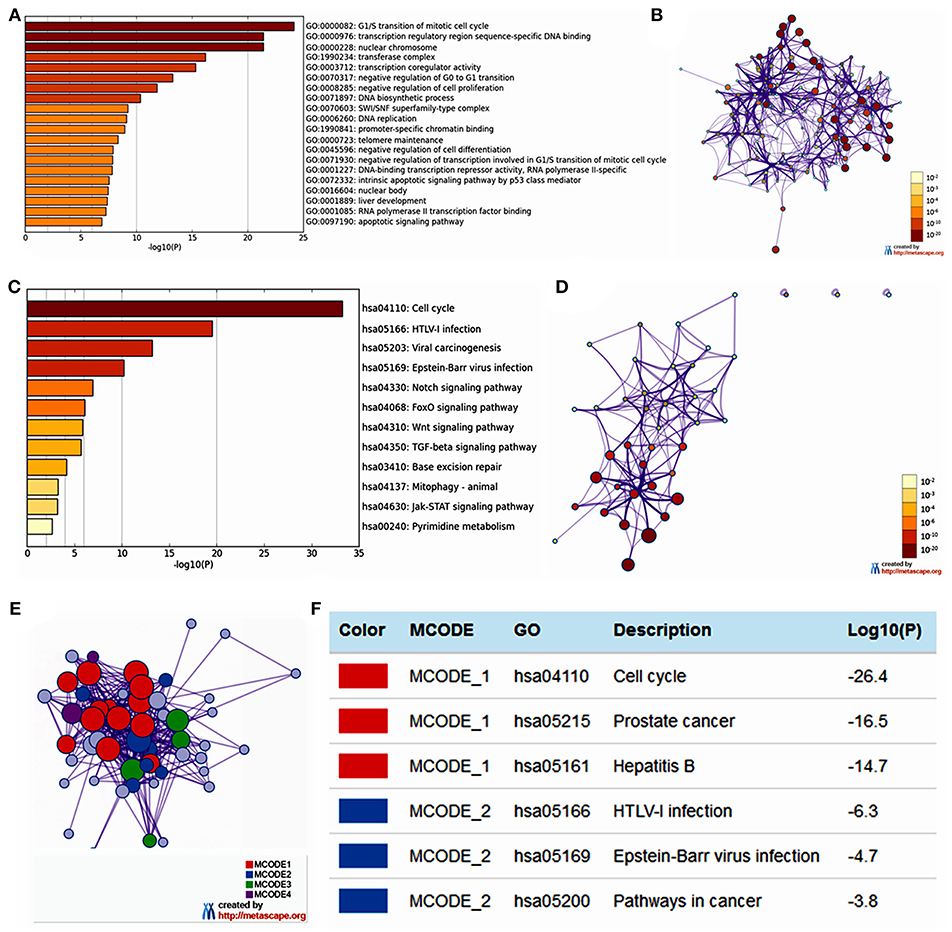
Figure 6. The enrichment analysis of E2F family members and neighboring genes in OC (Metascape). (A) Heatmap of Gene Ontology (GO) enriched terms colored by p-values. (B) Network of GO enriched terms colored by p-value, where terms containing more genes tend to have a more significant p-value. (C) Heatmap of Kyoto Encyclopedia of Genes and Genomes (KEGG) enriched terms colored by p-values. (D) Network of KEGG enriched terms colored by p-value, where terms containing more genes tend to have a more significant p-value. (E) Protein–protein interaction (PPI) network and four most significant MCODE components form the PPI network. (F) Independent functional enrichment analysis of three MCODE components.
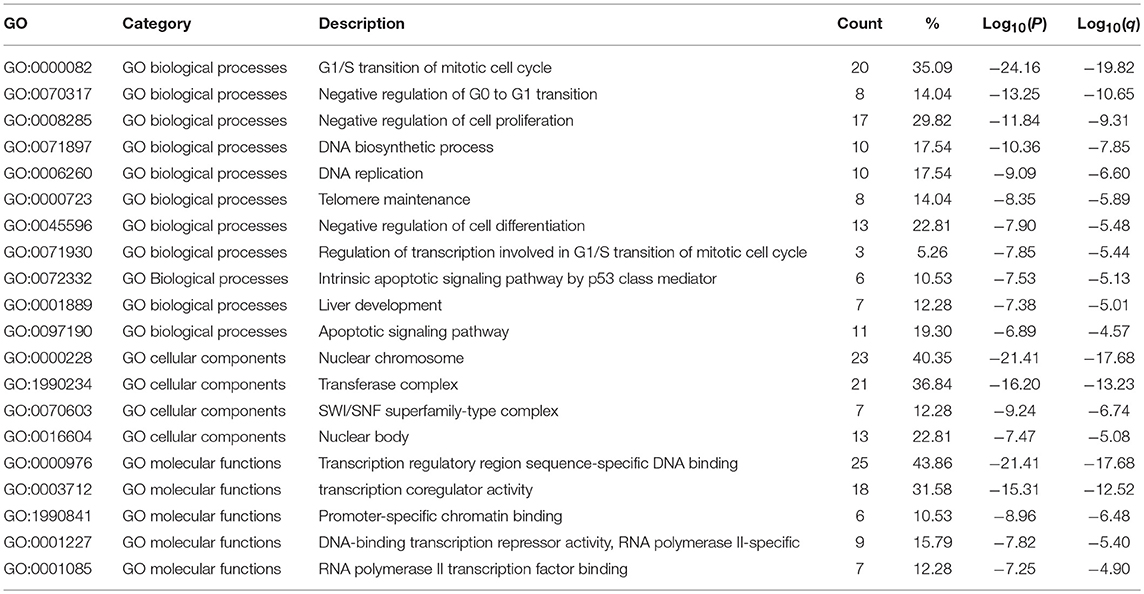
Table 2. The GO function enrichment analysis of E2F family members and neighbor genes in OC (GeneMANIA).
The top 12 KEGG pathways for the E2F family members and their neighboring genes are shown in Figures 6C,D and Table 3. Among these pathways, the cell cycle signaling pathway, viral carcinogenesis signaling pathway, TGF-beta signaling pathway, Wnt signaling pathway, and Jak-STAT signaling pathway were found to be related to multiple tumor development and were involved in OC tumorigenesis and pathogenesis. In addition, to better understand the relationship between E2F family members and OC, we performed a Metascape protein–protein interaction enrichment analysis. The protein–protein interaction network and MCODE components identified in the gene lists are shown in Figures 6E,F. The four most significant MCODE components were extracted from the protein–protein interaction network. After pathway and process enrichment analysis was independently applied to each MCODE component, the results showed that biological function was mainly related to cell cycle, prostate cancer, hepatitis B, HTLV-I infection, Epstein–Barr virus infection, and pathways in cancer.
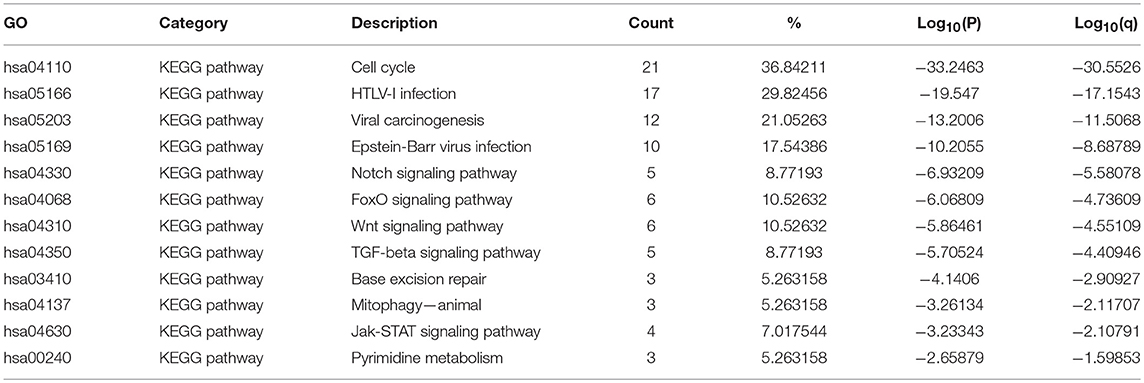
Table 3. The KEGG function enrichment analysis of E2F family members and neighbor genes in OC (GeneMANIA).
Prognostic Values of E2Fs in Patients With OC
By using Kaplan–Meier plotter analysis, we initially assessed the prognostic significance of the E2F family members in all OC patients. The Kaplan–Meier survival curves are shown in Figure 7 and Table 4. The increased mRNA levels of E2F7 and E2F8 were strongly associated with poor OS; the remaining E2F family members were not related with OS in OC. The high expression of E2F5, E2F6, and E2F8 mRNA was predicted to have worse PFS, whereas high E2F4 mRNA expression was correlated to longer PFS in OC patients. In addition, increased E2F1, E2F2, E2F4, and E2F7 mRNA expression levels were associated with poor PPS.
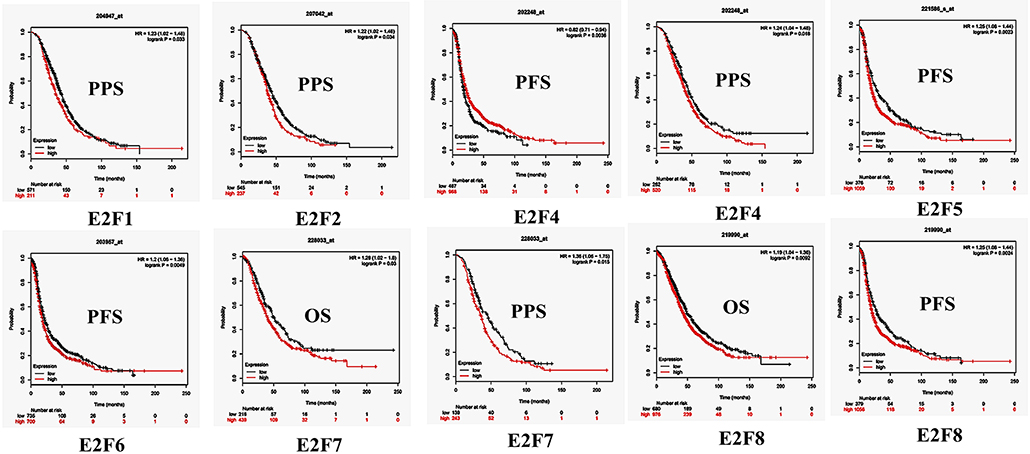
Figure 7. The prognostic value of mRNA level of E2F family members in OC patients (Kaplan–Meier plotter). The OS, PFS, and PPS survival curves comparing patients with high (red) and low (black) E2F family member expression in OC were plotted using Kaplan–Meier plotter database at the threshold of p-value of < 0.05.
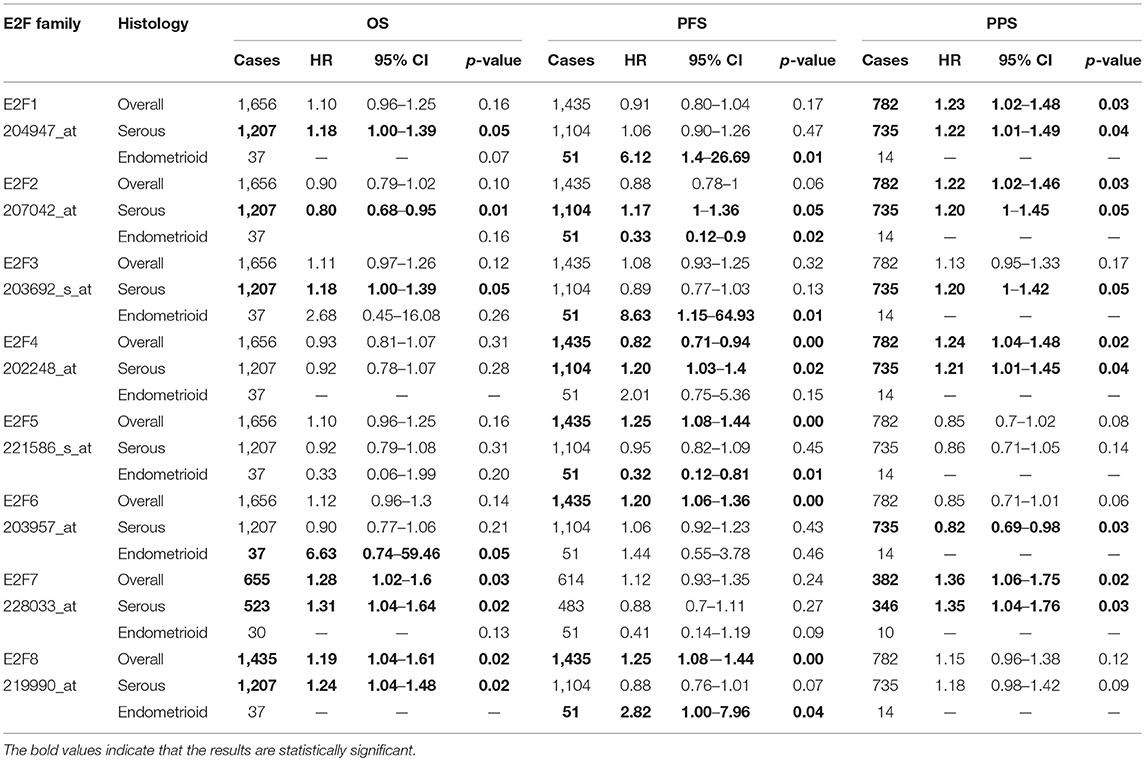
Table 4. The Prognostic values of E2F family members in all and different pathological subtypes OC patients (Kaplan-Meier plotter).
Further, we assessed the correlation of individual E2F family members with different pathological and histological subtypes of OC, including serous and endometrioid. The high mRNA expression levels of E2F1, E2F3, E2F7, and E2F8 were correlated to poor OS in serous OC patients, whereas increased E2F2 mRNA expression was associated with better OS in serous OC patients. Further, increased E2F2 and E2F4 mRNA expression levels were associated with poor PFS in serous OC patients. High mRNA expression of E2F1, E2F2, E2F3, E2F4, and E2F7 was significantly associated with worse PPS. However, increased E2F6 mRNA expression level was correlated with better PPS. In endometrioid OC, none of the E2F family members were related with prognosis in endometrioid OC. High E2F1, E2F3, and E2F8 mRNA expression levels were associated with poor PFS, whereas increased E2F2 and E2F5 mRNA expression levels were associated with superior PFS in endometrioid OC patients. Data to calculate PPS in patients with endometrial OC based on Kaplan–Meier online tool were not sufficient. The prognostic value of mRNA level of E2F family members in OC patients using Kaplan–Meier plotter (p > 0.05) are shown in Appendix.
Discussion
Numerous studies have suggested that E2Fs are involved in not only proliferation and differentiation but also apoptosis and tumorigenesis (7, 10). Accumulative evidence indicated that aberrant expression or activation of E2Fs is a common phenomenon in malignances, and significant associations between E2Fs and tumorigenesis or progression of patients with cancer has been partially confirmed (10, 29). However, the patterns of expression and the exact roles of distinct E2F family members in OC are not yet known. In this study, we attempted to systematically explore the expression patterns, prognostic values, genetic alteration, correlation, and potential functions of different E2Fs in OC.
E2F1, the most classic member of the E2F family, was found to play roles in both proliferation and apoptosis and exhibited a complex role in tumor development regulation (30). E2F1 has been shown sto exhibit dual properties and can act as a tumor suppressor or oncogene in the same cancer (11, 13, 31). However, E2F1 overexpression is known to contribute to the development and progression of OC, and this role is mediated by the p53-dependent apoptotic pathway and PI3K/AKT signaling pathway and microRNA activity (13, 31). More and more studies revealed that E2F1 overexpression could produce more aggressive tumors with a high proliferation rate and chemoresistance (32–34). In our study, ONCOMINE and GEPIA datasets revealed that the expression of E2F1 was up-regulated in human OC, and E2F1 expression was linked with the clinical characteristics of patients with OC. By using Kaplan–Meier plotter, we found increased E2F1 RNA expression level, which was associated with poor PPS in all patients with OC, which seemed consistent with the role of E2F3 as an oncogene.
E2F2 regulates many cell processes such as cell cycle, DNA synthesis, proliferation, and tumorigenesis (35). Previous studies indicated that like E2F1, E2F2 exhibited oncogenic or tumor suppressive activity, and overexpression of E2F2 contributed to the development of several solid tumors, indicating worse patient outcome (36, 37). However, the predictive roles of E2F2 for oncogenesis, prognosis, and prediction of therapeutic in human OC are not yet completely understood. In this study, E2F2 expression was found to be higher in OC tissues than in normal tissues and was significantly and negatively correlated with tumor stage in patients with OC. In addition, high E2F2 expression was significantly correlated with worse PPS in all patients with OC.
The E2F3 transcription factor is known to play a role in controlling cell cycle progression. Recently, the clear oncogenic role of E2F3 was revealed in several human cancers (38). Amplification and overexpression of E2F3 has been shown to be closely associated with clinical stage, pathological grading, proliferation index, and tumor aggression (39). Interestingly, E2F3a was found to be essential in EGFR-mediated proliferation in ovarian cancer cells (40). An in vitro study showed that siRNA for E2F3 facilitated the silencing of E2F3 overexpression and protected against breast cancer. Therefore, E2F3 might be a newly identified diagnostic and potential therapeutic target for solid human cancers (41). In this study, the expression of E2F3 in OC tissues was higher than that in normal tissues. We also found that E2F3 expression was significantly and negatively correlated with tumor stage in patients with OC. Further, although no significant association was observed between E2F3 and clinical outcomes in all OC patients, subgroup analysis revealed that E2F3 overexpression was associated with reduced OS and PPS in serous OC patients, as well as worse PFS in endometrioid OC patients.
E2F4 is a key regulator of cell transformation, proliferation, and cell cycle progression, and a recent study showed that patients exhibiting high expression of E2F4 target genes exhibited more severe cancer and shorter survival (42). In OC, E2F4 is involved in cell cycle arrest at the G0 phase in TOV21G and SKOV3 cells, and this role is enhanced by deregulated cyclin-dependent kinase inhibitors such as p27, p130/Rb2, and p130/Rb2 (43). Lawrenson et al. (44) confirmed that E2F4 variants are associated with OC pathogenesis by conducting genome-wide association studies. Reimer et al. (14, 15) found that the expression level of E2F4 was lower in tissues of platinum-resistant OC patients than in tissues of platinum-sensitive patients, which indicated a tumor suppressor function and prognostic value for E2F4. In our study, the expression of E2F4 was slightly lower in OC tissues than in normal ones and was markedly and negatively correlated with tumor stage in patients with OC. Survival analysis results showed that increased E2F4 expression was significantly correlated with longer PFS in all OC patients.
E2F5 is an important member of the E2F family. It has growth-repressive characteristics that have been observed in several solid cancers such as osteosarcoma, colon cancer, breast cancer, and OC (4). A recent study showed E2F5 overexpression in early as well as advanced stages of OC, and E2F5 status was shown to significantly improve malignancy diagnosis of epithelial OC (12). Moreover, silencing of E2F5 by using miR-132 inhibited the proliferation, colony formation, migration, and invasion of OC cells (45). Thus, E2F5 has been suggested to have a putative role in OC pathogenesis. In this study, E2F5 expression was higher in OC tissues than in normal ones and was significantly and negatively correlated with tumor stage in patients with OC. Furthermore, an elevated level of E2F5 was significantly associated with a worse PFS in all patients with OC.
E2F6, one of the unique E2F family members, is known to be a pRb-independent transcription repressor of E2F-target genes (46). Although the possible links between E2F6 and cell growth control are intriguing, little is known about the regulation mechanism, and the expression pattern and prognostic role of E2F6 in OC are not yet known. In this study, no significant difference in E2F6 expression was noted between OC tissues and normal ones, but E2F6 expression was negatively correlated with tumor stage in patients with OC. Interestingly, the overexpression of E2F6 was significantly correlated with worse PFS in all patients with OC.
E2F7 is an atypical E2F family member that acts as a transcriptional repressor of E2F target genes, thereby contributing to cell cycle arrest for DNA repair and genomic integrity (47). One study showed that the down-regulation of E2F7 might contribute to platinum resistance, and high expression of E2F7 predicted favorable DFS and OS in OC (14). Clements et al. (48) revealed that BRCA2-deficient cells are less sensitive to PARP inhibitor and cisplatin treatment after E2F7 depletion, thereby indicating that E2F7 could be a putative biomarker for tumor response to PARP inhibitor therapy. In this study, like that of E2F6, no significant difference in E2F7 expression was noted between OC and normal tissues, but E2F7 expression was significantly and negatively correlated with tumor stage in patients with OC. Further, high E2F7 expression was significantly correlated with poor PFS and PPS in all and serous OC patients, indicating its oncogenic role in OC.
E2F8 is a recently identified member of the E2F family with a duplicated DNA-binding domain feature discriminated from that in E2F1-6 (49). Accumulating evidence indicates that E2F8 is indispensable for angiogenesis, lymphangiogenesis, and embryonic development. E2F8 is highly expressed in various tumors and promotes tumor progression, and serves as a therapeutic target in lung and liver cancers (50, 51). Unfortunately, there is little research evidence between E2F8 and ovarian cancer diagnosis, staging, prognosis, and targeted drug therapy. In this study, E2F8 was significantly overexpressed in OC tissues, and its expression was markedly and negatively correlated with the tumor stage of patients with OC. Interestingly, high E2F8 expression was significantly correlated with poor OS and PFS in all patients with OC.
Growing evidence suggests that the cross-talk of the eight members of the E2F family is causatively involved in cell cycle control, cell proliferation, apoptosis, and carcinogenesis (8, 9, 31, 52). In this study, co-expression and correlation analyses of the E2F family were performed at both the gene and protein levels. These findings are similar to those of previous studies. For example, E2F1 and E2F3 were shown to be target genes involved in the p53 and p73 pathways for inducing apoptosis in a transgenic mouse model (53). Reimer et al. (14, 15) showed that deregulation of both proliferation-promoting and proliferation-inhibiting E2F transcription factors and their cross-talk is crucial for tumor progression of OC and influence clinical outcome; thus, they could be possible useful targets in anti-cancer therapy. Although we partially recognized the important role of E2F interactions in the pathogenesis and development of OC, the cross-talk and specific molecular mechanisms of E2F family members remain to be further investigated.
To further clarify the genetic alteration, potential function, and carcinogenic mechanism of the E2F family members, we calculated the percentages of genetic alterations in E2F family members for OC and found that they varied from 3 to 14% for individual genes based on TCGA Provisional dataset. Further, cases with alterations in one of the query gene had worse OS and DFS than those without any alterations in the query genes, but the difference was not statistically significant. We constructed a network for E2F family members and 50 neighboring genes. The results of functional analysis indicated that these genes are mainly enriched in tumor-related pathways related to the development of multiple tumors. Our study adds to the growing evidence regarding the complexity of the E2F family members and their associated signaling pathways, which offer clues into the rational development of multi-targeted and E2F-mediated targeted therapy.
Conclusions
In summary, our results indicated that the mRNA expression levels of E2F1, E2F3, E2F5, and E2F8 were significantly upregulated, and obvious and negatively associated with tumor stage for OC. Furthermore, aberrant expression of E2F2, E2F5, E2F7, and E2F8 were found to be associated with the clinical outcomes of patients with OC. These results suggest that E2F2, E2F5, and E2F8 may serve as potential prognostic biomarkers and targets for OC. These results may be beneficial to better understand the molecular underpinning of OC and may be useful to develop tools for more accurate OC prognosis and for promoting the development of E2F-mediated drug for OC treatment. However, future studies are required to validate our findings and thus promote the clinical utility of E2Fs serving as prognostic indicators or therapeutic targets in OC.
Author Contributions
QZ and M-ZZ developed the idea and designed the research. FZ and ZH analyzed the data. QZ and ZH wrote the draft of the manuscript. QZ and M-ZZ obtained copies of studies and revised the writing. All authors read and approved the submitted version.
Funding
This study is funded by the Yichang Medical and Health Research Project (No. A17-301-12) to QZ.
Conflict of Interest Statement
The authors declare that the research was conducted in the absence of any commercial or financial relationships that could be construed as a potential conflict of interest.
Supplementary Material
The Supplementary Material for this article can be found online at: https://www.frontiersin.org/articles/10.3389/fonc.2019.00161/full#supplementary-material
Appendix. The prognostic value of mRNA level of E2F family members in OC patients using Kaplan-Meier plotter (p > 0.05).
Abbreviations
OC, ovarian cancer; EGFR, epidermal growth factor receptor; GEPIA, Gene Expression Profiling Interactive Analysis; DAVID, The Database for Annotation, Visualization and Integrated Discovery; GO, Gene Ontology; KEGG, Kyoto Encyclopedia of Genes and Genomes; OS, overall survival; PFS, progression-free survival; PPS, post progression survival; DFS, disease-free survival.
References
1. Torre LA, Bray F, Siegel RL, Ferlay J, Lortet-Tieulent J, Jemal A. Global cancer statistics, 2012. CA Cancer J Clin. (2015) 65:87–108. doi: 10.3322/caac.21262
2. Jelovac D, Armstrong DK. Recent progress in the diagnosis and treatment of ovarian cancer. CA Cancer J Clin. (2011) 61:183–203. doi: 10.3322/caac.20113
3. Torre LA, Trabert B, DeSantis CE, Miller KD, Samimi G, Runowicz CD, et al. Ovarian cancer statistics, 2018. CA Cancer J Clin. (2018) 68:284–96. doi: 10.3322/caac.21456
4. Holschneider CH, Berek JS. Ovarian cancer: epidemiology, biology, and prognostic factors. Semin Surg Oncol. (2000) 19:3–10. doi: 10.1002/1098-2388(200007/08)19:1<3:aid-ssu2>3.0.co;2-s
5. Matulonis UA, Sood AK, Fallowfield L, Howitt BE, Sehouli J, Karlan BY. Ovarian cancer. Nat Rev Dis Primers. (2016) 2:16061. doi: 10.1038/nrdp.2016.61
6. Muinao T, Deka Boruah HP, Pal M. Diagnostic and prognostic biomarkers in ovarian cancer and the potential roles of cancer stem cells - An updated review. Exp Cell Res. (2018) 362:1–10. doi: 10.1016/j.yexcr.2017.10.018
7. Attwooll C, Lazzerini Denchi E, Helin K. The E2F family: specific functions and overlapping interests. EMBO J. (2004) 23:4709–16. doi: 10.1038/sj.emboj.7600481
8. Iaquinta PJ, Lees JA. Life and death decisions by the E2F transcription factors. Curr Opin Cell Biol. (2007) 19:649–57. doi: 10.1016/j.ceb.2007.10.006
9. Tsantoulis PK, Gorgoulis VG. Involvement of E2F transcription factor family in cancer. Eur J Cancer. (2005) 41:2403–14. doi: 10.1016/j.ejca.2005.08.005
10. Chen HZ, Tsai SY, Leone G. Emerging roles of E2Fs in cancer: an exit from cell cycle control. Nat Rev Cancer. (2009) 9:785–97. doi: 10.1038/nrc2696
11. Emmrich S, Putzer BM. Checks and balances: E2F-microRNA crosstalk in cancer control. Cell Cycle. (2010) 9:2555–67. doi: 10.4161/cc.9.13.12061
12. Kothandaraman N, Bajic VB, Brendan PN, Huak CY, Keow PB, Razvi K, et al. E2F5 status significantly improves malignancy diagnosis of epithelial ovarian cancer. BMC Cancer. (2010) 10:64. doi: 10.1186/1471-2407-10-64
13. Zhan L, Zhang Y, Wang W, Song E, Fan Y, Wei B. E2F1: a promising regulator in ovarian carcinoma. Tumour Biol. (2016) 37:2823–31. doi: 10.1007/s13277-015-4770-7
14. Reimer D, Sadr S, Wiedemair A, Goebel G, Concin N, Hofstetter G, et al. Expression of the E2F family of transcription factors and its clinical relevance in ovarian cancer. Ann N Y Acad Sci. (2006) 1091:270–81. doi: 10.1196/annals.1378.073
15. Reimer D, Sadr S, Wiedemair A, Stadlmann S, Concin N, Hofstetter G, et al. Clinical relevance of E2F family members in ovarian cancer–an evaluation in a training set of 77 patients. Clin Cancer Res. (2007) 13:144–51. doi: 10.1158/1078-0432.CCR-06-0780
16. Shackney SE, Chowdhury SA, Schwartz R. A novel subset of human tumors that simultaneously overexpress multiple E2F-responsive Genes Found in Breast, Ovarian, and Prostate Cancers. Cancer Inform. (2014) 13:89–100. doi: 10.4137/CIN.S14062
17. Sealfon SC, Chu TT. RNA and DNA microarrays. Methods Mol Biol. (2011) 671:3–34. doi: 10.1007/978-1-59745-551-0_1
18. Raghavachari N, Barb J, Yang Y, Liu P, Woodhouse K, Levy D, et al. A systematic comparison and evaluation of high density exon arrays and RNA-seq technology used to unravel the peripheral blood transcriptome of sickle cell disease. BMC Med Genomics. (2012) 5:28. doi: 10.1186/1755-8794-5-28
19. Rhodes DR, Yu J, Shanker K, Deshpande N, Varambally R, Ghosh D, et al. ONCOMINE: a cancer microarray database and integrated data-mining platform. Neoplasia. (2004) 6:1–6. doi: 10.1016/s1476-5586(04)80047-2
20. Rhodes DR, Kalyana-Sundaram S, Mahavisno V, Varambally R, Yu J, Briggs BB, et al. Oncomine 3.0: genes, pathways, and networks in a collection of 18,000 cancer gene expression profiles. Neoplasia. (2007) 9:166–80. doi: 10.1593/neo.07112
21. Tang Z, Li C, Kang B, Gao G, Li C, Zhang Z. GEPIA: a web server for cancer and normal gene expression profiling and interactive analyses. Nucleic Acids Res. (2017) 45:W98–102. doi: 10.1093/nar/gkx247
22. Hu XF, Yao J, Gao SG, Yang YT, Peng XQ, Feng XS. Midkine and syndecan1 levels correlate with the progression of malignant gastric cardiac adenocarcinoma. Mol Med Rep. (2014) 10:1409–15. doi: 10.3892/mmr.2014.2369
23. Cerami E, Gao J, Dogrusoz U, Gross BE, Sumer SO, Aksoy BA, et al. The cBio cancer genomics portal: an open platform for exploring multidimensional cancer genomics data. Cancer Discov. (2012) 2:401–4. doi: 10.1158/2159-8290.CD-12-0095
24. Gyorffy B, Lanczky A, Szallasi Z. Implementing an online tool for genome-wide validation of survival-associated biomarkers in ovarian-cancer using microarray data from 1287 patients. Endocr Relat Cancer. (2012) 19:197–208. doi: 10.1530/ERC-11-0329
25. Bonome T, Levine DA, Shih J, Randonovich M, Pise-Masison CA, Bogomolniy F, et al. A gene signature predicting for survival in suboptimally debulked patients with ovarian cancer. Cancer Res. (2008) 68:5478–86. doi: 10.1158/0008-5472.CAN-07-6595
26. Yoshihara K, Tajima A, Komata D, Yamamoto T, Kodama S, Fujiwara H, et al. Gene expression profiling of advanced-stage serous ovarian cancers distinguishes novel subclasses and implicates ZEB2 in tumor progression and prognosis. Cancer Sci. (2009) 100:1421–8. doi: 10.1111/j.1349-7006.2009.01204.x
27. Welsh JB, Zarrinkar PP, Sapinoso LM, Kern SG, Behling CA, Monk BJ, et al. Analysis of gene expression profiles in normal and neoplastic ovarian tissue samples identifies candidate molecular markers of epithelial ovarian cancer. Proc Natl Acad Sci USA. (2001) 98:1176–81. doi: 10.1073/pnas.98.3.1176
28. Lu KH, Patterson AP, Wang L, Marquez RT, Atkinson EN, Baggerly KA, et al. Selection of potential markers for epithelial ovarian cancer with gene expression arrays and recursive descent partition analysis. Clin Cancer Res. (2004) 10:3291–300. doi: 10.1158/1078-0432.CCR-03-0409
29. Li Y, Huang J, Yang D, Xiang S, Sun J, Li H, et al. Expression patterns of E2F transcription factors and their potential prognostic roles in breast cancer. Oncol Lett. (2018) 15:9216–30. doi: 10.3892/ol.2018.8514
30. Denechaud PD, Fajas L, Giralt A. E2F1, a novel regulator of metabolism. Front Endocrinol. (2017) 8:311. doi: 10.3389/fendo.2017.00311
31. Putzer BM, Engelmann D. E2F1 apoptosis counterattacked: evil strikes back. Trends Mol Med. (2013) 19:89–98. doi: 10.1016/j.molmed.2012.10.009
32. Huang CL, Liu D, Nakano J, Yokomise H, Ueno M, Kadota K, et al. E2F1 overexpression correlates with thymidylate synthase and survivin gene expressions and tumor proliferation in non small-cell lung cancer. Clin Cancer Res. (2007) 13:6938–46. doi: 10.1158/1078-0432.CCR-07-1539
33. Tetikkurt US, Ozaydin IY, Ceylan S, Gurbuz Y, Erdogan N, Oz F. Predicting malignant potential of gastrointestinal stromal tumors: role of p16 and E2F1 expression. Appl Immunohistochem Mol Morphol. (2010) 18:338–43. doi: 10.1097/PAI.0b013e3181d245c0
34. Samaka RM, Aiad HA, Kandil MA, Asaad NY, Holah NS. The prognostic role and relationship between E2F1 and SV40 in diffuse large B-cell lymphoma of egyptian patients. Anal Cell Pathol. (2015) 2015:919834. doi: 10.1155/2015/919834
35. Xanthoulis A, Tiniakos DG. E2F transcription factors and digestive system malignancies: how much do we know? World J Gastroenterol. (2013) 19:3189–98. doi: 10.3748/wjg.v19.i21.3189
36. Ivey-Hoyle M, Conroy R, Huber HE, Goodhart PJ, Oliff A, Heimbrook DC. Cloning and characterization of E2F-2, a novel protein with the biochemical properties of transcription factor E2F. Mol Cell Biol. (1993) 13:7802–12.
37. Xie L, Li T, Yang LH. E2F2 induces MCM4, CCNE2 and WHSC1 upregulation in ovarian cancer and predicts poor overall survival. Eur Rev Med Pharmacol Sci. (2017) 21:2150–6.
38. Trikha P, Sharma N, Pena C, Reyes A, Pecot T, Khurshid S, et al. E2f3 in tumor macrophages promotes lung metastasis. Oncogene. (2016) 35:3636–46. doi: 10.1038/onc.2015.429
39. Al Ahmed HA, Nada O. E2F3 transcription factor: A promising biomarker in lung cancer. Cancer Biomark. (2017) 19:21–6. doi: 10.3233/CBM-160196
40. Reimer D, Hubalek M, Kiefel H, Riedle S, Skvortsov S, Erdel M, et al. Regulation of transcription factor E2F3a and its clinical relevance in ovarian cancer. Oncogene. (2011) 30:4038–49. doi: 10.1038/onc.2011.119
41. Vimala K, Sundarraj S, Sujitha MV, Kannan S. Curtailing overexpression of E2F3 in breast cancer using siRNA (E2F3)-based gene silencing. Arch Med Res. (2012) 43:415–22. doi: 10.1016/j.arcmed.2012.08.009
42. Khaleel SS, Andrews EH, Ung M, DiRenzo J, Cheng C. E2F4 regulatory program predicts patient survival prognosis in breast cancer. Breast Cancer Res. (2014) 16:486. doi: 10.1186/s13058-014-0486-7
43. Hu J, Nakhla H, Friedman E. Transient arrest in a quiescent state allows ovarian cancer cells to survive suboptimal growth conditions and is mediated by both Mirk/dyrk1b and p130/RB2. Int J Cancer. (2011) 129:307–18. doi: 10.1002/ijc.25692
44. Lawrenson K, Iversen ES, Tyrer J, Weber RP, Concannon P, Hazelett DJ, et al. Common variants at the CHEK2 gene locus and risk of epithelial ovarian cancer. Carcinogenesis. (2015) 36:1341–53. doi: 10.1093/carcin/bgv138
45. Tian H, Hou L, Xiong YM, Huang JX, Zhang WH, Pan YY, et al. miR-132 targeting E2F5 suppresses cell proliferation, invasion, migration in ovarian cancer cells. Am J Transl Res. (2016) 8:1492–501.
46. Major JL, Salih M, Tuana BS. E2F6 protein levels modulate drug induced apoptosis in cardiomyocytes. Cell Signal. (2017) 40:230–8. doi: 10.1016/j.cellsig.2017.09.022
47. Mitxelena J, Apraiz A, Vallejo-Rodriguez J, Garcia-Santisteban I, Fullaondo A, Alvarez-Fernandez M, et al. An E2F7-dependent transcriptional program modulates DNA damage repair and genomic stability. Nucleic Acids Res. (2018) 46:4546–59. doi: 10.1093/nar/gky218
48. Clements KE, Thakar T, Nicolae CM, Liang X, Wang HG, Moldovan GL. Loss of E2F7 confers resistance to poly-ADP-ribose polymerase (PARP) inhibitors in BRCA2-deficient cells. Nucleic Acids Res. (2018) 46:8898–907. doi: 10.1093/nar/gky657
49. Wali VB, Gilmore-Hebert M, Mamillapalli R, Haskins JW, Kurppa KJ, Elenius K, et al. Overexpression of ERBB4 JM-a CYT-1 and CYT-2 isoforms in transgenic mice reveals isoform-specific roles in mammary gland development and carcinogenesis. Breast Cancer Res. (2014) 16:501. doi: 10.1186/s13058-014-0501-z
50. Park SA, Platt J, Lee JW, Lopez-Giraldez F, Herbst RS, Koo JS. E2F8 as a novel therapeutic target for lung cancer. J Natl Cancer Inst. (2015) 107:djv151. doi: 10.1093/jnci/djv151
51. Lv Y, Xiao J, Liu J, Xing F. E2F8 is a potential therapeutic target for hepatocellular carcinoma. J Cancer. (2017) 8:1205–13. doi: 10.7150/jca.18255
52. Weijts B, Westendorp B, Hien BT, Martinez-Lopez LM, Zijp M, Thurlings I, et al. Atypical E2Fs inhibit tumor angiogenesis. Oncogene. (2018) 37:271–6. doi: 10.1038/onc.2017.336
Keywords: E2Fs, ovarian cancer, database mining, prognostic value, bioinformatics analysis
Citation: Zhou Q, Zhang F, He Z and Zuo M-Z (2019) E2F2/5/8 Serve as Potential Prognostic Biomarkers and Targets for Human Ovarian Cancer. Front. Oncol. 9:161. doi: 10.3389/fonc.2019.00161
Received: 14 November 2018; Accepted: 25 February 2019;
Published: 22 March 2019.
Edited by:
Jian-Jun Wei, Northwestern University, United StatesReviewed by:
Zhaojian Liu, Shandong University, ChinaKruti P. Maniar, Northwestern University, United States
Copyright © 2019 Zhou, Zhang, He and Zuo. This is an open-access article distributed under the terms of the Creative Commons Attribution License (CC BY). The use, distribution or reproduction in other forums is permitted, provided the original author(s) and the copyright owner(s) are credited and that the original publication in this journal is cited, in accordance with accepted academic practice. No use, distribution or reproduction is permitted which does not comply with these terms.
*Correspondence: Quan Zhou, emhvdXF1YW44NTE5QDE2My5jb20=
†These authors have contributed equally to this work