 Xiaofan Lu1†
 Yang Wang2†Liyun Jiang1
 Jun Gao1Yue Zhu1Wenjun Hu1Jiashuo Wang1Xinjia Ruan1Zhengbao Xu1Xiaowei Meng1
 Bing Zhang2*
 Fangrong Yan1*
- 1Research Center of Biostatistics and Computational Pharmacy, China Pharmaceutical University, Nanjing, China
- 2Department of Radiology, The Affiliated Nanjing Drum Tower Hospital of Nanjing University Medical School, Nanjing, China
The status of lymph node (LN) metastases plays a decisive role in the selection of surgical procedures and post-operative treatment. Several histopathologic features, known as predictors of LN metastasis, are commonly available post-operatively. Medical imaging improved pre-operative diagnosis, but the results are not fully satisfactory due to substantial false positives. Thus, a reliable and robust method for pre-operative assessment of LN status is urgently required. We developed a prediction model in a training set from the TCGA-BLCA cohort including 196 bladder urothelial carcinoma samples with confirmed LN metastasis status. Least absolute shrinkage and selection operator (LASSO) regression was harnessed for dimension reduction, feature selection, and LNM signature building. Multivariable logistic regression was used to develop the prognostic model, incorporating the LNM signature, and a genomic mutation of MLL2, and was presented with a LNM nomogram. The performance of the nomogram was assessed with respect to its calibration, discrimination, and clinical usefulness. Internal validation was evaluated by the testing set from the TCGA cohort and independent validation was assessed by two independent cohorts. The LNM signature, which consisted of 48 selected features, was significantly associated with LN status (p < 0.005 for both the training and testing sets of the TCGA cohort). Predictors contained in the individualized prediction nomogram included the LNM signature and MLL2 mutation status. The model demonstrated good discrimination, with an area under the curve (AUC) of 98.7% (85.3% for testing set) and good calibration with p = 0.973 (0.485 for testing set) in the Hosmer-Lemeshow goodness of fit test. Decision curve analysis demonstrated that the LNM nomogram was clinically useful. This study presents a pre-operative nomogram incorporating a LNM signature and a genomic mutation, which can be conveniently utilized to facilitate pre-operative individualized prediction of LN metastasis in patients with bladder urothelial carcinoma.
Introduction
Bladder cancer is the 9th most prevalent cause of cancer worldwide and the 2nd most common genitourinary malignancy, with transitional cell carcinomas comprising about 90% of primary bladder tumors (1). In 2019, ~80,470 new cases and 17,670 deaths of bladder cancer were estimated to occur in the United States (2). Previous research has revealed that Lymph node (LN) involvement—which is frequently found in bladder cancer—possesses prognostic implications, and both the pathological stage of primary bladder tumor and the presence of LN metastasis are considered the most important determinants of survival in bladder cancer patients undergoing radical cystectomy (3). Early and accurate identification of LN metastasis holds significance in improving patient triage and management (4) and may suggest potential alteration of the lymphadenectomy template in patients who undergo surgery. In cases where local staging is equivocal, it also expedites care for patients, particularly when nodal disease can be definitively identified (5–7). Pre-operative knowledge of LN metastasis provides valuable information about the necessity of adjuvant therapy and the adequacy of surgical resection, thereby aiding pretreatment decision-making, but unfortunately, most histopathologic findings identified as predictors of LN metastasis cannot be observed pre-operatively. That is to say, the status of LN metastases plays a decisive role in the selection of surgical procedures and post-operative treatment. Reliable and robust methods for pre-operative assessment of LN status (8) have been continuously explored. Fine-needle aspiration lymphangiography has been evaluated in several investigations but failed to show reliability due to a high false negative rate (9). Only a few studies have appraised positron emission tomography (PET) and its ability to detect LN metastases in bladder cancer, but the conclusions have been largely disappointing (10). Additionally, computed tomography (CT) revealed a high false negative rate of 21% (11). Next-generation sequencing technology has brought massively high throughput sequencing data to bear on research questions with low cost, which enables us to decipher the difference of bladder cancer in terms of status of LN metastasis in a genomic level. Currently, the analysis strategy for multiple biomarkers has evolved from individual analyses to combined analysis of a panel of biomarkers that constitute a signature, which appears to be a most promising approach and powerful enough to innovate clinical management (12, 13). Therefore, this study aims to develop and validate a pre-operative nomogram that incorporates a LN-metastasis signature and genomic mutations for individualized pre-operative prediction of LN metastasis in patients with bladder cancer.
Materials and Methods
Patients and Samples
Molecular data were obtained from The Cancer Genome Atlas Project (TCGA) patients diagnosed with bladder urothelial carcinoma. Transcriptome HTSeq-counts data of TCGA-BLCA project was obtained from the Genomic Data Commons (https://portal.gdc.cancr.gov/) using the R package “TCGAbiolinks” (14). Somatic mutation profiling and detailed clinicopathological information were downloaded from cBioPortal (http://www.cbioportal.org/datasets). For the purpose of the present study, 196 samples were selected as the TCGA cohort including 49 samples with LN metastasis only (LN+) and 147 without any metastasis (LN–). Two independent cohorts were gathered for validation including one obtained from Gene Expression Omnibus (https://www/ncbi.nlm.nih.gov/geo/) (GEO cohort) by using R package “GEOquery” with a query of GSE106534 and another that is publicly available through the Memorial Sloan-Kettering Cancer Center (MSKCC cohort) cBioPortal for Cancer Genomics. The GEO cohort contains five LN+ and five LN– bladder tissues, of which RNA was extracted and hybridized on an Illumina Hiseq 2500 (13). The MSKCC cohort contains 58 tumor samples with Agilent microarray mRNA expression profiling (15). Survival information of the MSKCC cohort was obtained from the cBioPortal.
Data Preprocessing for Transcriptome HTSeq-Counts
Ensembl ID for genes (protein-coding mRNAs) was annotated in GENCODE27 to generate Gene Symbol name. Gene type of protein-coding was selected for mRNAs. We calculated the number of fragments per kilobase of non-overlapped exons per million fragments mapped (FPKM) first and subsequently transferred FPKM into transcripts per kilobase million (TPM) values, which are more similar to those resulting from microarrays and more comparable between samples (16). To reduce noise, only mRNAs with TPM value equal to or above one in at least 10% of the samples were kept for downstream analysis.
Differential Expression and Functional Enrichment Analysis
Differential expression analysis was performed by R package “DESeq2” with the standard comparison mode between the two experimental conditions (17). P-values were adjusted for multiple testing with an embedded Benjamini-Hochberg procedure in the package. Gene set enrichment analysis (GSEA) was performed by R package “clusterProfiler” (18, 19) to impute functional pathway enrichment for the LN+ and LN– groups by mRNA expression profile.
Genetic Analysis on Somatic Mutation
We used MutSigCV_v1.41 (20) (www.broadinstitute.org) to infer significant cancer mutated genes (q < 0.05) across the two classes currently identified with default parameters. Tumor mutation burden was computed by summing all kinds of non-silent mutation. Mutation landscape oncoprint was drawn by R package “ComplexHeatmap” (21). Significant frequent non-silent mutations were identified by independent test between the LN+ and LN– groups with a p < 0.05.
Feature Selection
The TCGA cohort of 196 samples was randomized into two sets based on 10-fold stratified sampling, where the training set included 9 folds of LN+ samples and LN− samples and the testing set included the rest, 1 fold with 5 LN+ samples and 15 LN− samples. Least absolute shrinkage and selection operator (LASSO) regression, which is often applied as a dimensionally reduction technique, was performed on the training set to select primary predicative features. Ten-fold cross validation was performed to tune the optimal value of lambda (λ) that gives the minimum mean cross-validated error. A score was calculated for each sample via a linear combination of the selected features, namely LNM signature, weighted by the corresponding coefficients. The potential association of the LNM signature with LN status was first assessed in the training set and then validated in the testing set by using the Mann-Whitney U-test.
Development of an Individualized Prediction Model
Multivariable logistic regression analysis on the training set began with the following candidate predictors: LNM signature and significant frequent mutations. Those with respective p < 0.05 were retained in the prognostic model. A LNM nomogram was built by R package “regplot” as a quantitative tool for clinicians for individualized prediction of LN metastasis probability.
Validation of the LNM Nomogram and LNM Signature
Internal validation was performed using the testing set of the TCGA cohort with 20 samples. The logistic regression formula formed in the training set was applied to all samples in the testing set, with total points for each sample calculated. Logistic regression in the testing cohort was then performed by using the total points as a factor. Finally, the receiver operating characteristic curve (ROC) with area under the curve (AUC) and calibration curve were derived based on the regression analysis by using R packages “pROC” and “rms”. Independent validation for LNM-score was tested in the GEO and MSKCC cohorts. Since the mutation data were absent and several genes of the LNM signature failed to be mapped in independent cohorts, we harnessed unsupervised clustering to determine if LNM signature could help distinguish LN metastasis status in the GEO cohort and whether it was associated with overall survival (OS) or progression-free survival (PFS) in the MKSCC cohort. Supervised hierarchical clustering based on mapped LNM signature was performed by using R function hclust() via the Ward.D clustering method 1-Pearson's correlation distance, with k = 2 as the number of clusters. Expression profiling of mRNAs was transformed by log2(x+1) and median-centered before clustering.
Statistical Analysis
All statistical tests were executed by R/3.5.2, with a χ2 or Fisher's exact test for categorical data when appropriate, a two-sample student's t-Test or Mann-Whitney U-test for continuous data when appropriate, a log-rank test Kaplan-Meier curve (22) and Cox regression (23) for survival analysis performed by R package “survival.” Survival of patients belonging to different defined groups was compared by the Kaplan-Meier Method, with p-value determined by the log-rank (Mantel-Cox) test. Fisher's exact test of independence was used to statistically test the association between categorical clinical information and LN metastasis status. For all statistical analysis, a two-sided p < 0.05 was considered statistically significant. Decision curve analysis was conducted to determine the clinical usefulness of the LNM nomogram by quantifying the net benefits at different threshold probabilities by using R package “rmda” (24, 25).
Results
Demographic Characteristics
The distributions of gender, age (dichotomized by median age of 69), BMI (trichotomized by WHO body mass index cut-off), pack-year of smoking history (dichotomized by median pack of 29), papillary type and histological grade were not different between LN+ and LN– samples. Race (p = 0.031), LN category (p = 1.30–13), metastasis category (p = 0.035), pathological stage (p = 7.04–11), lymph node examined number (dichotomized by median number of 27, p = 0.039), and tumor status (p = 0.0004) were significantly associated with LN metastasis status (Table 1). As expected, tumors with LN+ demonstrated poorer prognosis than LN– (p = 0.002, HR = 1.95, 95% CI = [1.18–3.23], Figure 1A) and a tendency could be observed where LN+ tumors presented a higher recurrence rate (p = 0.083, HR = 1.58, 95% CI = [0.88–2.82], Figure 1B).
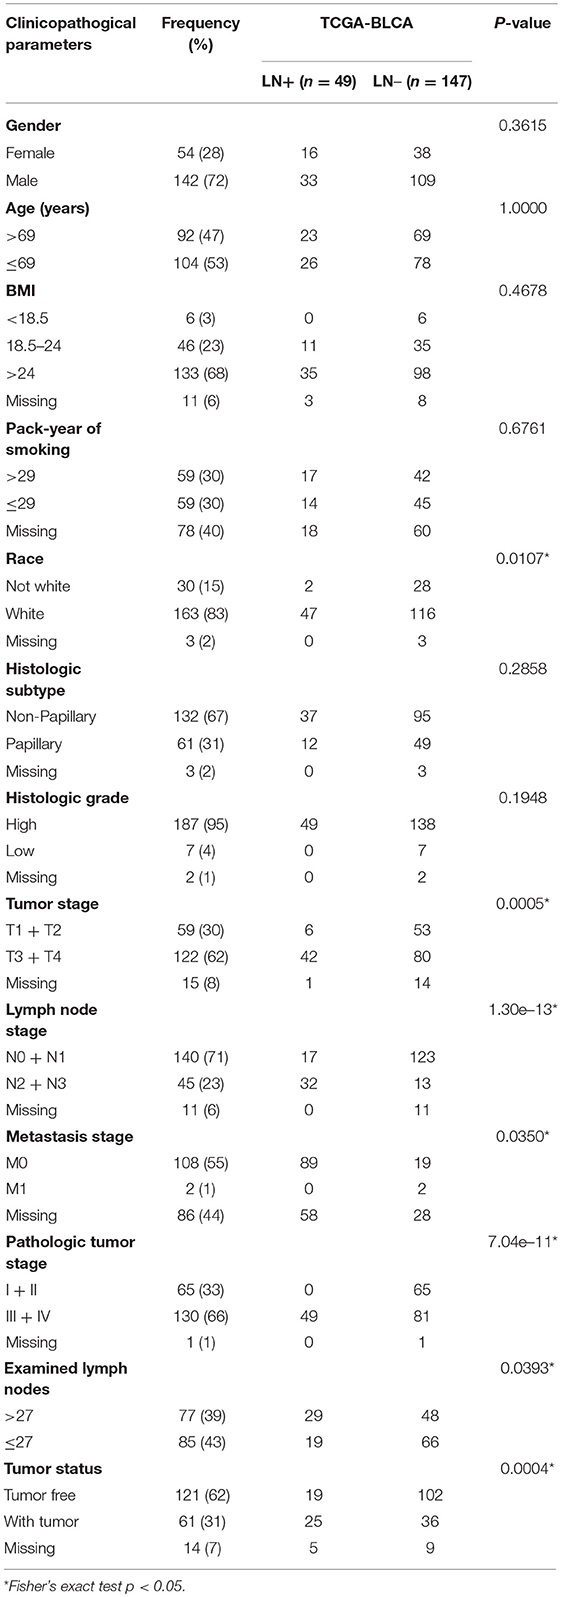
Table 1. Demographic and clinicopathological characteristics of patients with bladder urothelial carcinoma (TCGA cohort, n = 196) based on LN metastasis status.
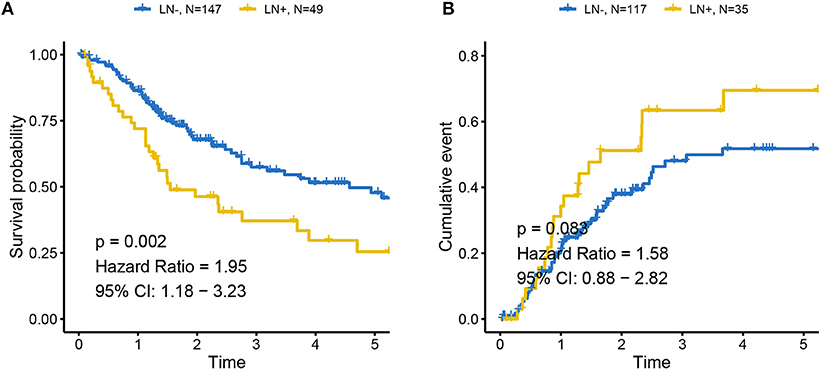
Figure 1. Association between LN metastasis status and patients' outcomes in TCGA cohort (A) for overall survival and (B) for progression-free survival. Tumors with LN+ demonstrated poor prognosis compared to LN– and a tendency could be observed where LN+ tumors presented higher recurrence rates. LN– was regarded as the reference for the calculation of HR.
Overview of Differential Expression Results From LN+ and LN– Tumors
Supervised differential expression analysis using LN metastasis status as the group variable identified 180 differentially expressed genes (p < 0.05, false discovery rate (FDR) <0.05, Figure 2A; Supplementary Table S1). GSEA manifested a universal down-regulation of immune-related pathways in LN+ tumors as compared to LN– tumors (Figure 2B; Supplementary Table S2).
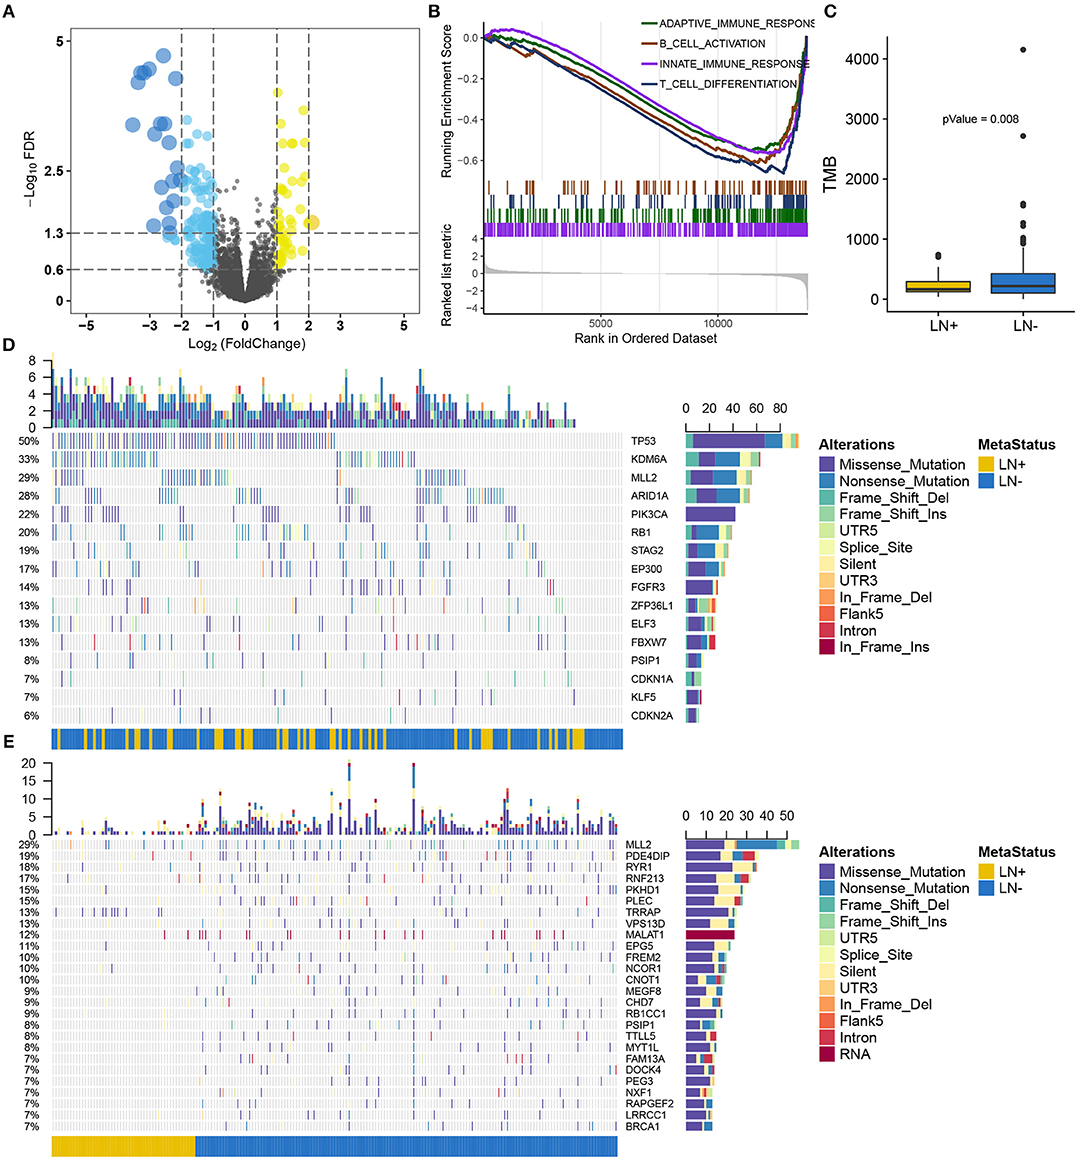
Figure 2. Overview of the molecular differences between LN+ and LN− tumors in the TCGA cohort. (A) Volcano plot for differentially expressed genes. (B) GSEA demonstrated down-regulated immune-related pathways in LN+ tumors. (C) Boxplot showed significantly lower TMB in LN+ tumors as compared to LN- tumors. Oncoprint for SMGs identified by MutSigCV shown in (D) and (E) depicted significantly differentially mutated genes based on LN metastasis status.
Somatic Mutation Landscape Between LN+ and LN– Tumors
After filtering out non-silent mutation, tumors with LN+ exhibited a significant lower burden of mutation load as compared to LN– tumors (p = 0.008) (Figure 2C). MutSigCV identified 16 significantly mutated genes (SMGs, q < 0.05) for the present 193 samples with available mutation data (Supplementary Table S3), all of which were reported from previous research (26) (Figure 2D). We identified 716 genes with a mutation rate >5%, among which 26 genes were found to be differentially mutated between LN+ and LN– tumors by independent test (Figure 2E; Supplementary Table S4). By intersecting with SMGs, mutation of MLL2 (also known as KMT2D) and PSIP1 were identified for constructing a predictive model.
Feature Selection and LNM Signature Building
Of 180 differentially expressed genes, 48 features were selected on the basis of the training set of the TCGA cohort (see Materials and methods for more details), including 22 up-regulated genes and 26 down-regulated genes, as they were features with non-zero coefficients in the LASSO logistic regression model (Figures 3A,B; Table 2). These features are presented in LNM signature calculation formula (Supplementary Table S5). LNM signature was significantly higher in LN+ tumors as compared to LN– tumors both in the training (p < 2.2–16) and testing sets (p = 0.005) of the TCGA cohort (Figures 3C,D) and appeared to be an independent predictor for OS (p = 0.0264, HR = 1.13, 95% CI = [1.01–1.27]) by multivariate Cox regression integrating LNM signature, gender, age and histological grade of the entire TCGA cohort.
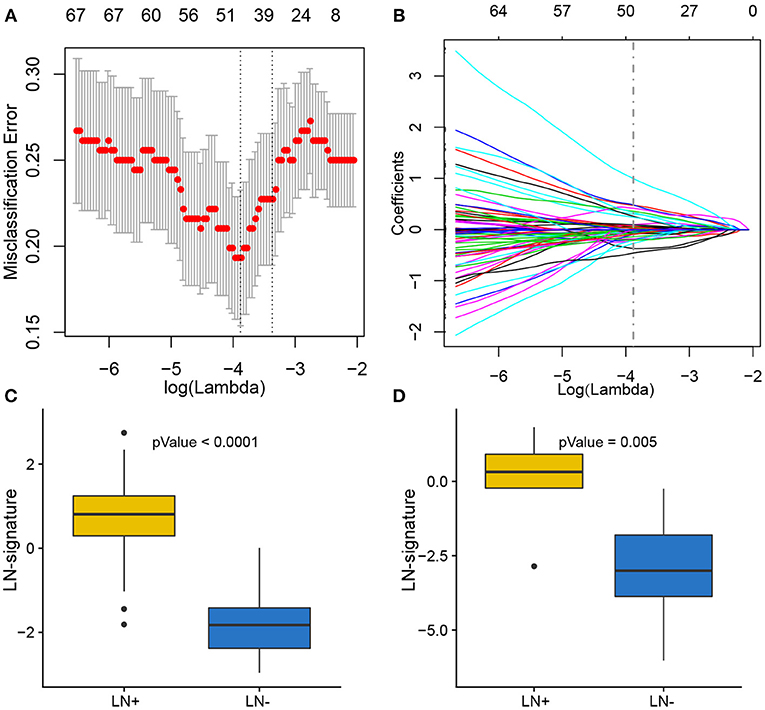
Figure 3. Feature selection using LASSO binary logistic regression model. (A) Tuning parameter λ (lambda) selection in the LASSO model used 10-fold cross-validation by minimum criteria. The misclassification error was plotted vs. log(λ). Dotted vertical lines were drawn at the optimal values by using the minimum criteria. A λ of 0.021 with log(λ) of −3.881 was chosen according to 10-fold cross-validation. (B) LASSO coefficient profiles of the 180 genes. A coefficient profile plot was produced against the log(λ) sequence. A vertical line was drawn at the value selecting by 10-fold cross-validation, where the optimal λ resulted in 48 non-zero coefficients. Distribution of calculated LNM signature vs. LN metastasis status for both training set and testing set were plotted by boxplot in (C) and (D), respectively.
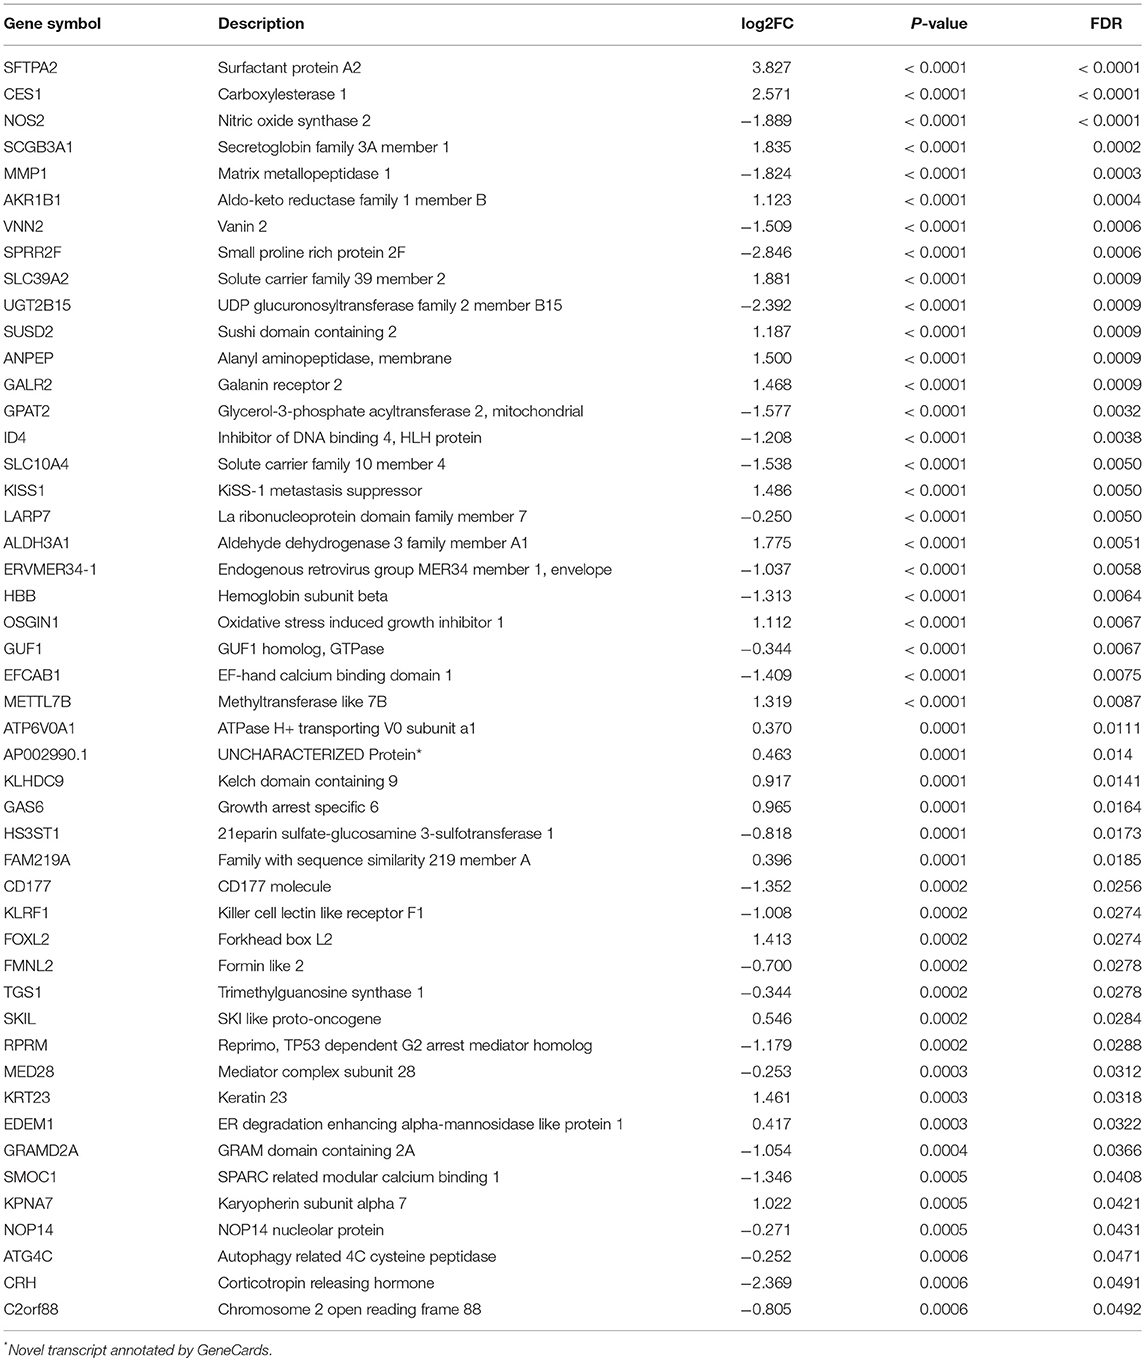
Table 2. Details of LASSO-selected genes in differential expression analysis.
Supervised Clustering by Using LNM Signature in Two Independent Cohorts
Independent validation for LNM signature was performed in the GEO (Figure 4A) and MSKCC cohorts (Figure 4B) by supervised hierarchical clustering where samples in the GEO cohort could be distinguished according to LN metastasis status (p = 0.048), and a tendency could be observed that LNM signature was associated with OS (p = 0.075) (Figure 4C) and PFS (p = 0.098) (Figure 4D) in the MSKCC cohort.
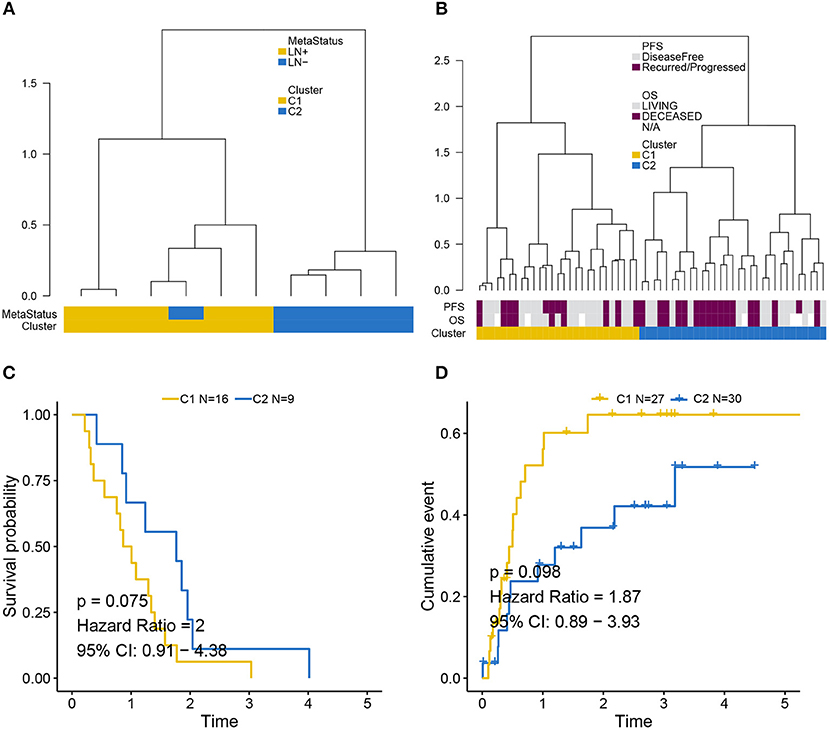
Figure 4. Validation of LNM signature via supervised clustering. (A) Dendrogram created by supervised hierarchical clustering using the GEO cohort significantly distinguished LN metastasis status (p = 0.048) and a dendrogram created for the MSKCC cohort in (B) identified two clusters with a tendency whereby LNM signature was associated with (C) OS (p = 0.075) and (D) PFS (p = 0.098). Cluster C2 was regarded as reference when calculating HR.
Development of an Individualized Prognostic Model
Logistic regression analysis identified the pre-operative features of LNM signature and MLL2 mutation as independent predictors (Table 3). We also considered other pre-operative clinical variables when designing the prognostic model, and interestingly, only LNM signature and MLL2 mutation survived in the full model with p < 0.05 in the logistic regression (Supplementary Table S6). Thus, we further removed these variables in this study not only due to the insignificance of other variables, but also because we hope that patients could accept the acquisition of these measurements relatively easily. For this reason, we considered that in most cases, pathologic stage and detailed TNM classification should be detected by biopsy, an invasive procedure that may be much less acceptable than pre-designed multi-gene assay that may only need a small amount of blood. Hence, a model incorporating these two features was developed and presented as a LNM nomogram (Figure 5). Predictions made by calibration curve of the nomogram for LN metastasis conformed well to observations in the training set, with a Hosmer-Lemeshow test suggesting no departure from perfect fit (p = 0.973).
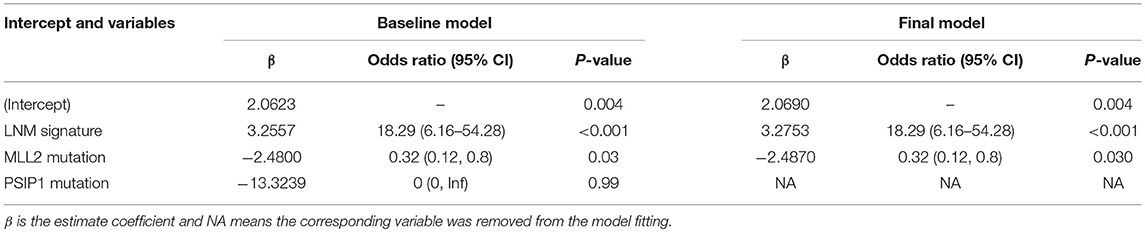
Table 3. Summary of logistic regression model integrating LNM signature and genomic mutations.
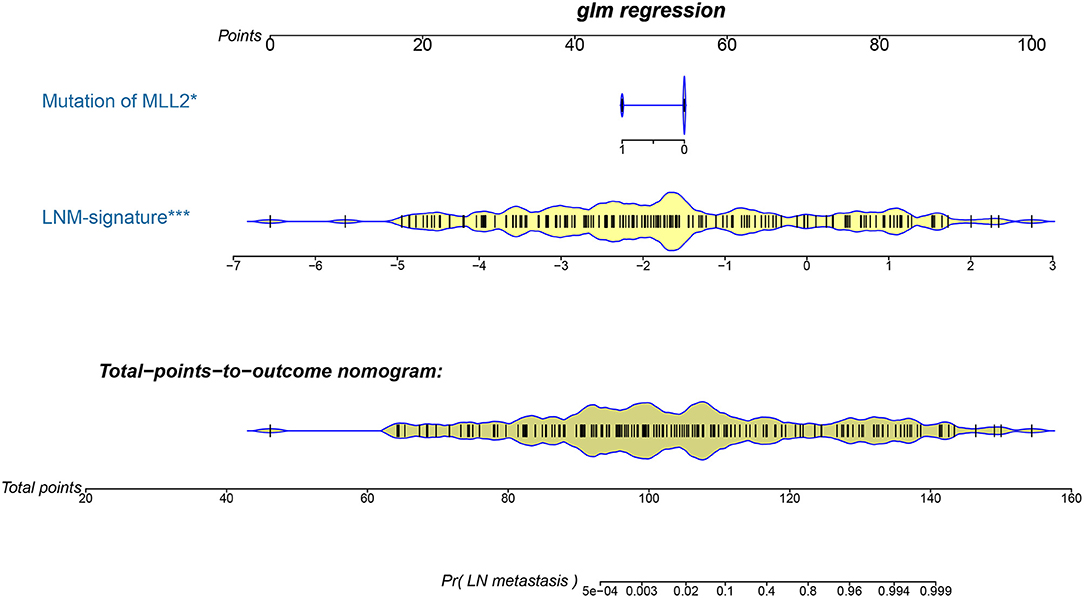
Figure 5. The developed pre-operative nomogram. The LNM nomogram was built in the training set of the TCGA cohort, with the LNM signature and genomic mutation of MLL2 incorporated.
Validation of the LNM Nomogram and Its Clinical Usefulness
Total points calculated by LNM nomogram for each sample in the testing set was determined to be a significant predictor when performing logistic regression (p = 0.032), and no departure from perfect fit was identified (p = 0.485) (Figure 6A, see Supplementary Figures S1A–T for total point of each testing sample). Internal validation obtained AUCs of 98.7 and 85.3% when deploying the LNM nomogram to the training set and the testing set (Figure 6B). The decision curve analysis showed that the LNM nomogram offered a net benefit over the “treat-all” or “treat-none” strategies at a really small threshold probability of a patient or doctor, which indicated that the LNM nomogram was clinically useful. For example, if the personal threshold probability of a patient is 60% (i.e., the patient would opt for treatment if his probability of LNM was >60%), then using the LNM nomogram to predict LN metastases could provide an added net benefit of 0.7386 compared to the “treat-all” or “treat-none” strategies (Figure 6C).
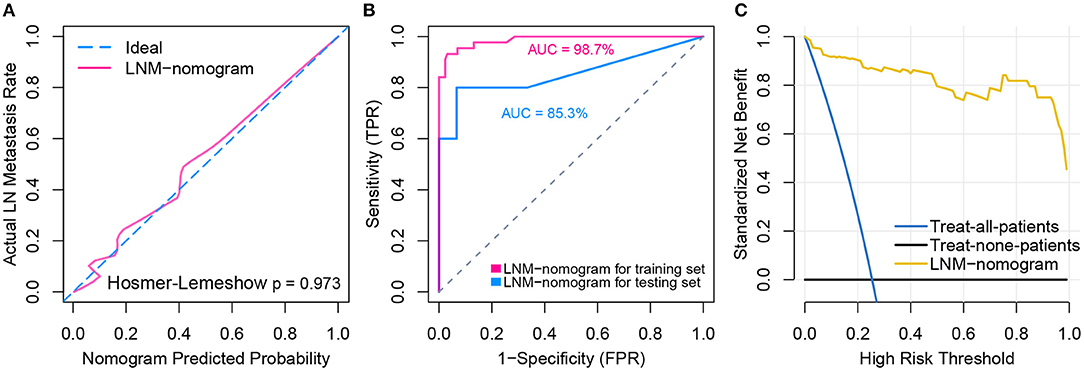
Figure 6. Model performance and clinical usefulness of the LNM-nomogram. (A) Calibration curve with Hosmer-Lemeshow test of the LNM-nomogram in the training set of TCGA-cohort. Calibration curve depicts the calibration of the fitted model in terms of the agreement between the predicted risk of LN metastasis and real observed outcomes. The x-axis represents the predicted LN metastasis risk and y-axis represents the actual LN metastasis rate. The pink solid line represents the performance of the LNM-nomogram, of which a closer fit to the diagonal dotted blue line represents an ideal prediction. The calibration curve was drawn by plotting on the x-axis and on the y-axis, where Pc is the actual probability, , is predicted probability, γ0 is corrected intercept, and γ1 is slope estimates. (B) ROCs are created by plotting the true positive rate (TPR) against the false positive rate (FPR) at various threshold settings with corresponding AUCs labeled around the curves. (C) Decision curve analysis for the LNM-nomogram. The y-axis measures the net benefit. The yellow line represents the LNM-nomogram, the blue line represents the assumption that all patients have LN metastases and the black line on the bottom represents the assumption that no patients have LN metastases. The net benefit was calculated by subtracting the proportion of all patients who are false positive from the proportion who are true positive, weighting by the relative harm of forgoing treatment compared with the negative consequences of an unnecessary treatment. The relative harm was computed by Pt/(1−Pt). The threshold probability Pt is where the expected benefit of treatment is equal to the expected benefit of avoiding treatment; at which time a patient will opt for treatment informs us of how a patient weighs the relative harms of false positive results and false negative results ([a–c]/[b–d] = [1–Pt]/Pt) where [a–c] is the harm from a false negative result and [b–d] is the harm from a false positive result. Parameters of a, b, c, and d give the value of true positive, false positive, false negative, and true negative, respectively. The decision curve indicated that even if the threshold probability of a patient or doctor is really small, using the LNM-nomogram in the present study to predict LN metastases brings more benefit than treating either all or no patients.
Discussion
Bladder cancer ranks fourth in men and eighth in women among the most common malignancies in terms of frequency (27). However, little progress was made in the past decades toward prolonged survival of high-grade bladder cancer, leaving it still a lethal disease (28). Since a considerable amount of research has recognized LN involvement as the strongest independent prognostic variable for patient outcomes, proper identification of LN metastasis is of paramount importance (29). To date, several histopathologic findings that are known to be predictors of LN metastasis are commonly available post-operatively. Medical imaging has made great strides in pre-operative diagnosis, but the results are not fully satisfactory due to substantial false positives. Therefore, we sought here to develop and validate a diagnostic, LNM signature-based nomogram for pre-operative individualized prediction of LN metastasis in patients with bladder cancer. The nomogram offers an easy-to-use tool for pre-operative individualized prediction of LN metastasis and incorporates only two pre-operative items, LNM signature which stratifies patients by their risk of LN metastasis, and mutation status of MLL2. For the construction of the LNM signature, 180 candidate genes were reduced to 48 potential predictors by examining the predictor–outcome association by shrinking the regression coefficients with the LASSO algorithm. Compared to predictor selection based on strength of univariable association between predictor and outcome, this method further enables the combination of all selected features and creates a single signature, i.e., marker panels. Marker panels have been embraced in recent studies for multi-marker analysis (30, 31), such as a novel 6-microRNA-based model that was proposed to improve prognosis prediction of breast cancer (32), and a 6-DNA methylation signature that was recognized as a novel prognostic biomarker in ovarian serous cystadenocarcinoma (32). Moreover, the Oncotype DX is a 21-gene assay that represents the first clinically validated multi-gene assay which can quantify the likelihood of breast cancer recurrence (33, 34). Another 70-gene assay, MammaPrint, was developed by the Netherlands Cancer Institute and was used to predict the risk of developing metastasis within 5 years for breast cancer (35). Similarly, the LNM signature that combined multiple genes demonstrated adequate discrimination in the training set of TCGA cohort (AUC = 98.7%) and was satisfactory in the testing set (AUC = 85.3%). LNM signature was also presented as an independent predictor for overall survival in the TCGA cohort. In addition, supervised clustering using LNM signature enabled us to distinguish LN metastasis status in an independent GEO cohort (p = 0.048) and associated with patients' outcomes to some extent (p < 0.1). Thus, the non-invasive LNM signature allows for more convenient prediction of LN metastasis.
Note that mutation of MLL2, which was differentially mutated between LN+ and LN– tumors (7:46, p = 0.0166), was also a significant variable in the predictive model (p = 0.012). MLL2, also known as KMT2D (Lysine Methyltransferase 2D), of which mutation is a driver in numerous different cancer types resulting in transcription stress and genome instability (36), and a recent study demonstrated that MLL2 could sustain prostate carcinogenesis and metastasis (37). Because the LNM signature and the mutation of MLL2 are available pre-operatively, our nomogram which generates individual probability by integrating the two factors provides clinicians and patients with a pre-operative individualized prediction of the LN metastasis risk, which is in line with the current trend toward personalized medicine (38).
Finally, and most importantly, the nomogram was designed to interpret individualized patient need for additional treatment or care. While the clinical consequences of a particular level of discrimination or degree of miscalibration could hardly be captured by risk prediction, discrimination, or calibration, a decision curve analysis assessing whether nomogram-assisted decision making improves patient outcomes was performed to justify the clinical usefulness of the LNM nomogram. This novel method offers insights into clinical consequences on the basis of threshold probability by deriving the net benefit (defined as the proportion of true positives minus the proportion of false positives weighted by relative harm of false-positive and false-negative results) (38, 39). Results showed that decisions based on the LNM nomogram yielded more favorable clinical consequences than the treat-all-patient scheme and the treat-none scheme, even given an extremely small threshold probability. However, our study harbored limitations, including the fact that radiomics characteristics and other pre-operative clinical features (e.g., hematuresis or not) were not considered under the existing framework. There has been tremendous growth in radiomics research in the past few years for assisting clinical diagnosis and improving predictive accuracy. An emerging field that is closely related to radiomics is radiogenomics, which integrates imaging and genomics data with the goal of improving patient stratification for precision medicine.
In short, this study presents a LNM nomogram incorporating a LNM signature and a genomic mutation, which can be conveniently used to facilitate pre-operative individualized prediction of LN metastasis in patients with bladder cancer.
Data Availability
The datasets used and analyzed during the current study are available from the corresponding author on reasonable request.
Author Contributions
XL and YW proposed the conception and design of this research. XL and LJ developed methodology. XL, BZ, and FY collected data and performed preprocessing. XL, WH, YZ, JW, XR, ZX, and XM analyzed and interpreted the data including statistical analysis, biostatistics, bioinformatics, and computational analysis. XL, JG, and YW were major contributors in writing the manuscript. All authors read and approved the final manuscript.
Funding
This work was supported by the Double First-Class University project (CPU2018GY09); the National Natural Science Foundation of China (81720108022, 91649116, 81571040); the social development project of science and technology project in Jiangsu Province (BE2016605, BE201707); key medical talents of the Jiangsu province, the 13th 5-Year health promotion project of the Jiangsu province (BZ.2016-2020); Jiangsu Provincial Key Medical Discipline (Laboratory) (ZDXKA2016020); the project of the sixth peak of talented people (WSN-138, BZ); and the National Key R&D Program of China (2016YFC0100100). The funders had no role in the study design, data collection, and analysis, decision to publish, or preparation of the manuscript.
Conflict of Interest Statement
The authors declare that the research was conducted in the absence of any commercial or financial relationships that could be construed as a potential conflict of interest.
Acknowledgments
The main results published here are based upon data generated by TCGA, managed by the NCI and NHGRI. We are grateful to TCGA for this source of data. Information about TCGA can be found at http://cancergenome.nih.gov. We also sincerely thank Sergio Chavez of the Department of Bioinformatics and Computational Biology (The University of Texas, MD Anderson Cancer Center) for editing the manuscript.
Supplementary Material
The Supplementary Material for this article can be found online at: https://www.frontiersin.org/articles/10.3389/fonc.2019.00488/full#supplementary-material
Abbreviations
LN, lymph node; LNM, lymph node metastasis; TPM, transcripts per kilobase million; FDR, false discovery rate; GSEA, gene set enrichment analysis; LASSO, Least absolute shrinkage and selection operator; OS, overall survival; PFS, progression-free survival; HR, hazard ratio; CI, confidence interval; ROC, operating characteristic curve; AUC, area under the curve.
References
1. Antoni S, Ferlay J, Soerjomataram I, Znaor A, Jemal A, Bray F. Bladder cancer incidence and mortality: a global overview and recent trends. Euro Urol. (2017) 71:96–108. doi: 10.1016/j.eururo.2016.06.010
2. Siegel RL, Miller KD, Jemal A. Cancer statistics, 2019. CA Cancer J Clin. (2019) 69:7–34. doi: 10.3322/caac.21551
3. Park WK, Kim YS. Pattern of lymph node metastasis correlates with tumor location in bladder cancer. Korean J Urol. (2012) 53:14–7. doi: 10.4111/kju.2012.53.1.14
4. Shankar PR, Barkmeier D, Hadjiiski L, Cohan RH. A pictorial review of bladder cancer nodal metastases. Transl Androl Urol. (2018) 7:804. doi: 10.21037/tau.2018.08.25
5. Pisani P, Bray F, Parkin DM. Estimates of the world-wide prevalence of cancer for 25 sites in the adult population. Int J Cancer. (2002) 97:72–81. doi: 10.1002/ijc.1571
6. Vikram R, Sandler CM, Ng CS. Imaging and staging of transitional cell carcinoma: part 1, lower urinary tract. Am J Roentgenol. (2009) 192:1481–7. doi: 10.2214/AJR.08.1318
7. Salminen AP, Jambor I, Syvanen KT, Bostrom PJ. Update on novel imaging techniques for the detection of lymph node metastases in bladder cancer. Ital J Urol Nephrol. (2016) 68:138–49. Retrieved from: https://www.minervamedica.it/
8. Liedberg F, Månsson W. Lymph node metastasis in bladder cancer. Euro Urol. (2006) 49:13–21. doi: 10.1016/j.eururo.2005.08.007
9. Chagnon S, Cochand-Priollet B, Gzaeil M, Jacquenod P, Roger B, Boccon-Gibod L, et al. Pelvic cancers: staging of 139 cases with lymphography and fine-needle aspiration biopsy. Radiology. (1989) 173:103–6. doi: 10.1148/radiology.173.1.2675176
10. Schöder H, Larson SM. Positron emission tomography for prostate, bladder, and renal cancer. Semin Nucl Med. (2004) 34:274–92. doi: 10.1053/j.semnuclmed.2004.06.004
11. Paik ML, Scolieri MJ, Brown SL, Spirnak JP, Resnick MI. Limitations of computerized tomography in staging invasive bladder cancer before radical cystectomy. J Urol. (2000) 163:1693–6. doi: 10.1016/S0022-5347(05)67522-2
12. Birkhahn M, Mitra AP, Cote RJ. Molecular markers for bladder cancer: the road to a multimarker approach. Expert Rev Anticancer Ther. (2007) 7:1717–27. doi: 10.1586/14737140.7.12.1717
13. Chen C, He W, Huang J, Wang B, Li H, Cai Q, et al. LNMAT1 promotes lymphatic metastasis of bladder cancer via CCL2 dependent macrophage recruitment. Nat Commun. (2018) 9:3826. doi: 10.1038/s41467-018-06152-x
14. Colaprico A, Silva TC, Olsen C, Garofano L, Cava C, Garolini D, et al. TCGAbiolinks: an R/Bioconductor package for integrative analysis of TCGA data. Nucl Acids Res. (2015) 44:e71. doi: 10.1093/nar/gkv1507
15. Iyer G, Al-Ahmadie H, Schultz N, Hanrahan AJ, Ostrovnaya I, Balar AV, et al. Prevalence and co-occurrence of actionable genomic alterations in high-grade bladder cancer. J Clin Oncol. (2013) 31:3133. doi: 10.1200/JCO.2012.46.5740
16. Wagner GP, Kin K, Lynch VJ. Measurement of mRNA abundance using RNA-seq data: RPKM measure is inconsistent among samples. Theory Biosciences. (2012) 131:281–5. doi: 10.1007/s12064-012-0162-3
17. Love MI, Huber W, Anders S. Moderated estimation of fold change and dispersion for RNA-seq data with DESeq2. Genome Biol. (2014) 15:550. doi: 10.1186/s13059-014-0550-8
18. Subramanian A, Tamayo P, Mootha VK, Mukherjee S, Ebert BL, Gillette MA, et al. Gene set enrichment analysis: a knowledge-based approach for interpreting genome-wide expression profiles. Proc. Natl Acad Sci USA. (2005) 102:15545–50. doi: 10.1073/pnas.0506580102
19. Yu G, Wang L-G, Han Y, He Q-Y. clusterProfiler: an R package for comparing biological themes among gene clusters. Omics J Integr Biol. (2012) 16:284–7. doi: 10.1089/omi.2011.0118
20. Lawrence MS, Stojanov P, Polak P, Kryukov GV, Cibulskis K, Sivachenko A, et al. Mutational heterogeneity in cancer and the search for new cancer-associated genes. Nature. (2013) 499:214. doi: 10.1038/nature12213
21. Gu Z, Eils R, Schlesner M. Complex heatmaps reveal patterns and correlations in multidimensional genomic data. Bioinformatics. (2016) 32:2847–9. doi: 10.1093/bioinformatics/btw313
22. Bland JM, Altman DG. Survival probabilities (the Kaplan-Meier method). BMJ. (1998) 317:1572–80. doi: 10.1136/bmj.317.7172.1572
23. Cox DR. Regression models and life-tables. J R Stat Soc Ser B Stat Methodol. (1972) 34:187–220. Retrieved from: http://www.jstor.org/stable/2985181
24. Vickers AJ, Elkin EB. Decision curve analysis: a novel method for evaluating prediction models. Med Dec Making. (2006) 26:565–74. doi: 10.1177/0272989X06295361
25. Rousson V, Zumbrunn T. Decision curve analysis revisited: overall net benefit, relationships to ROC curve analysis, and application to case-control studies. BMC Med Inform Decis Mak. (2011) 11:45. doi: 10.1186/1472-6947-11-45
26. Robertson AG, Kim J, Alahmadie H, Bellmunt J, Guo G, Cherniack AD, et al. Comprehensive molecular characterization of muscle-invasive bladder cancer. Cell. (2017) 1714: 540–56.e25. doi: 10.1016/j.cell.2017.09.007
27. Watts KL, Ristau BT, Yamase HT, Taylor Iii JA. Prognostic implications of lymph node involvement in bladder cancer: are we understaging using current methods? BJU Int. (2011) 108:484–92. doi: 10.1111/j.1464-410X.2011.10330.x
28. Yun SJ, Kim S-K, Kim W-J. How do we manage high-grade T1 bladder cancer? Conservative or aggressive therapy? Investig Clin Urol. (2016) 57:S44–51. doi: 10.4111/icu.2016.57.S1.S44
29. Kawada K, Taketo MM. Significance and mechanism of lymph node metastasis in cancer progression. Cancer Res. (2011) 71:1214–8. doi: 10.1158/0008-5472.CAN-10-3277
30. Paik S, Shak S, Tang G, Kim C, Baker J, Cronin M, et al. A multigene assay to predict recurrence of tamoxifen-treated, node-negative breast cancer. N Engl J Med. (2004) 351:2817–26. doi: 10.1056/NEJMoa041588
31. Van Calster B, Vickers AJ. Calibration of risk prediction models: impact on decision-analytic performance. Med Decis Mak. (2015) 35:162–9. doi: 10.1177/0272989X14547233
32. Lai J, Wang H, Pan Z, Su F. A novel six-microRNA-based model to improve prognosis prediction of breast cancer. Aging. (2019) 11:649. doi: 10.18632/aging.101767
33. Mcveigh TP, Hughes LM, Miller N, Sheehan M, Keane M, Sweeney KJ, et al. The impact of Oncotype DX testing on breast cancer management and chemotherapy prescribing patterns in a tertiary referral centre. Eur J Cancer. (2014) 50:2763–70. doi: 10.1016/j.ejca.2014.08.002
34. Mcveigh TP, Kerin MJ. Clinical use of the Oncotype DX genomic test to guide treatment decisions for patients with invasive breast cancer. Breast Cancer. (2017) 9:393. doi: 10.2147/BCTT.S109847
35. Güler EN. Gene expression profiling in breast cancer and its effect on therapy selection in early-stage breast cancer. Eur J Breast Health. (2017) 13:168. doi: 10.5152/ejbh.2017.3636
36. Kantidakis T, Saponaro M, Mitter R, Horswell S, Kranz A, Boeing S, et al. Mutation of cancer driver MLL2 results in transcription stress and genome instability. Genes Dev. (2016) 30:408–20. doi: 10.1101/gad.275453.115
37. Lv S, Ji L, Chen B, Liu S, Lei C, Liu X, et al. Histone methyltransferase KMT2D sustains prostate carcinogenesis and metastasis via epigenetically activating LIFR and KLF4. Oncogene. (2018) 37:1354. doi: 10.1038/s41388-017-0026-x
38. Balachandran VP, Gonen M, Smith JJ, Dematteo RP. Nomograms in oncology: more than meets the eye. Lancet Oncol. (2015) 16:e173–80. doi: 10.1016/S1470-2045(14)71116-7
Keywords: bladder cancer, lymph node metastasis, LNM signature, MLL2 mutation, pre-operative nomogram
Citation: Lu X, Wang Y, Jiang L, Gao J, Zhu Y, Hu W, Wang J, Ruan X, Xu Z, Meng X, Zhang B and Yan F (2019) A Pre-operative Nomogram for Prediction of Lymph Node Metastasis in Bladder Urothelial Carcinoma. Front. Oncol. 9:488. doi: 10.3389/fonc.2019.00488
Received: 21 March 2019; Accepted: 23 May 2019;
Published: 21 June 2019.
Edited by:
Ja Hyeon Ku, Seoul National University, South KoreaReviewed by:
Marco Roscigno, Ospedale Papa Giovanni XXIII, ItalyVadim S. Koshkin, University of California, San Francisco, United States
Copyright © 2019 Lu, Wang, Jiang, Gao, Zhu, Hu, Wang, Ruan, Xu, Meng, Zhang and Yan. This is an open-access article distributed under the terms of the Creative Commons Attribution License (CC BY). The use, distribution or reproduction in other forums is permitted, provided the original author(s) and the copyright owner(s) are credited and that the original publication in this journal is cited, in accordance with accepted academic practice. No use, distribution or reproduction is permitted which does not comply with these terms.
*Correspondence: Bing Zhang, emhhbmdiaW5nX25hbmppbmdAdmlwLjE2My5jb20=; Fangrong Yan, Zi5yLnlhbkAxNjMuY29t
†Joint first authors