 Yejinpeng Wang1†
 Liang Chen1†Lingao Ju2,3,4Kaiyu Qian2,3,4
 Xuefeng Liu5Xinghuan Wang1,6*
 Yu Xiao1,2,3,4,7*
- 1Department of Urology, Zhongnan Hospital of Wuhan University, Wuhan, China
- 2Department of Biological Repositories, Zhongnan Hospital of Wuhan University, Wuhan, China
- 3Human Genetics Resource Preservation Center of Hubei Province, Wuhan, China
- 4Human Genetics Resource Preservation Center of Wuhan University, Wuhan, China
- 5Department of Pathology, Lombardi Comprehensive Cancer Center, Georgetown University Medical School, Washington, DC, United States
- 6Laboratory of Urology, Medical Research Institute, Wuhan University, Wuhan, China
- 7Laboratory of Precision Medicine, Zhongnan Hospital of Wuhan University, Wuhan, China
Our study's goal was to screen novel biomarkers that could accurately predict the progression and prognosis of bladder cancer (BC). Firstly, we used the Gene Expression Omnibus (GEO) dataset GSE37815 to screen differentially expressed genes (DEGs). Secondly, we used the DEGs to construct a co-expression network by weighted gene co-expression network analysis (WGCNA) in GSE71576. We then screened the brown module, which was significantly correlated with the histologic grade (r = 0.85, p = 1e-12) of BC. We conducted functional annotation on all genes of the brown module and found that the genes of the brown module were mainly significantly enriched in “cell cycle” correlation pathways. Next, we screened out two real hub genes (ANLN, HMMR) by combining WGCNA, protein-protein interaction (PPI) network and survival analysis. Finally, we combined the GEO datasets (GSE13507, GSE37815, GSE31684, GSE71576). Oncomine, Human Protein Atlas (HPA), and The Cancer Genome Atlas (TCGA) dataset to confirm the predict value of the real hub genes for BC progression and prognosis. A gene-set enrichment analysis (GSEA) revealed that the real hub genes were mainly enriched in “bladder cancer” and “cell cycle” pathways. A survival analysis showed that they were of great significance in predicting the prognosis of BC. In summary, our study screened and confirmed that two biomarkers could accurately predict the progression and prognosis of BC, which is of great significance for both stratification therapy and the mechanism study of BC.
Introduction
BC is one of the most common malignancies of the urinary tract (1), and is a complex disease with high morbidity and mortality if not diagnosed timely and treated optimally (2). It is estimated that there are 429,000 new cases and 165,000 deaths worldwide each year (3). The most common symptom of BC is painless hematuria, which is seen in more than 80% of patients. At present, BC can be divided into two major categories according to tumor stage: non-muscle invasive bladder cancer (NMIBC) and muscle-invasive bladder cancer (MIBC) (4, 5). NMIBC is characterized by the co-activation of FGFR3 mutations, high recurrence rate (50–70%), and the 5-year survival rate > 90% (6). However, MIBC is characterized by frequent TP53 mutations, high metastasis and a 5-year survival rate < 50% (7). 70–80% of BC patients had non-muscle-invasive bladder cancer (NMIBC) (8), and 20–30% of these patients will progress to MIBC (9). Once BC progression is detected, the patient's prognosis decreases (10, 11); currently, there is a lack of effective biomarkers that can accurately predict the progress and prognosis of BC, so such biomarkers need to be discovered urgently.
With the rapid development of microarray and high-throughput sequencing technology, bioinformatics plays an important role in various fields (12–15). In the medical field, the most commonly used means of bioinformatics is to find biomarkers (16–18). However, at present, many studies only consider the differences in gene expression between different samples, and only look for biomarkers with differential expression as the limiting condition, while ignoring the underlying connection of each gene (19, 20).
Here, we constructed WGCNA co-expression network and incorporated genes with similar expression patterns into the same modules. After all the modules were related to the calculation of clinical phenotype data, the modules most related to the progression of BC were obtained. Finally, after a series of screening tests, we found the real hub genes (ANLN, HMMR) that could truly predict the progression and prognosis of BC. Our study fully considered the internal relationship between genes, rather than only considering differential expression genes. The GSEA analysis and functional annotation showed that the real hub genes played their role in BC through signaling pathways such as “bladder cancer” and “cell cycle.” We combined a large number of databases (GEO, TCGA, Oncomine, HPA, String, GEPIA, GSCALite) to verify the ability of real hub genes to predict the progression and prognosis of BC, ensuring the stability and reliability of the results.
Materials and Methods
Data Collection and Study Design
The microarray dataset GSE13507, GSE31684, GSE37815, GSE71576 and the corresponding clinical information data of these microarray datasets were downloaded from the Gene Expression Omnibus (GEO) database of the NCBI database (https://www.ncbi.nlm.nih.gov/). The datasets GSE37815 and GSE13507 both performed on the Illumina human-6 v2.0 platform, the former was used to screen for different expression genes (DEGs), the latter was used to verify the hub genes. The dataset GSE71576, which performed on the Affymetrix Human Gene 1.0 ST platform, was used to perform weighted co-expression network analysis. The dataset GSE31684, which performed on the Affymetrix Human Genome U133 Plus 2.0 platform, was also used to verify the hub genes. The level three RNA-seq data (Illumina RNASeqV2) and corresponding clinical information about BC were downloaded from The Cancer Genome Atlas (TCGA) database (http://cancergenome.nih.gov/). The dataset, which included 408 BC samples and 19 normal bladder samples, was used to verify the hub genes, perform GSEA, correlation analysis and survival analysis. The inclusion cohort was defined as a cohort containing microarray or RNA-seq data and clinical phenotypes and follow-up data. By consulting the literature, we took the cohorts without performed WGCNA as training sets and internal validation sets, and the cohorts that have undergone WGCNA research as external validation sets. Dataset GSE37815 contained 18 BC and 6 normal bladder samples, so we chose it for DEGs analysis. Furthermore, we chose datasets GSE37815 and GSE71576 as training and internal validation datasets, whereas the datasets GSE13507, GSE31684, and TCGA were set as external validation datasets. The detailed information of these datasets was listed in Table 1, and the flow chart of our entire experiment is presented in Figure 1.
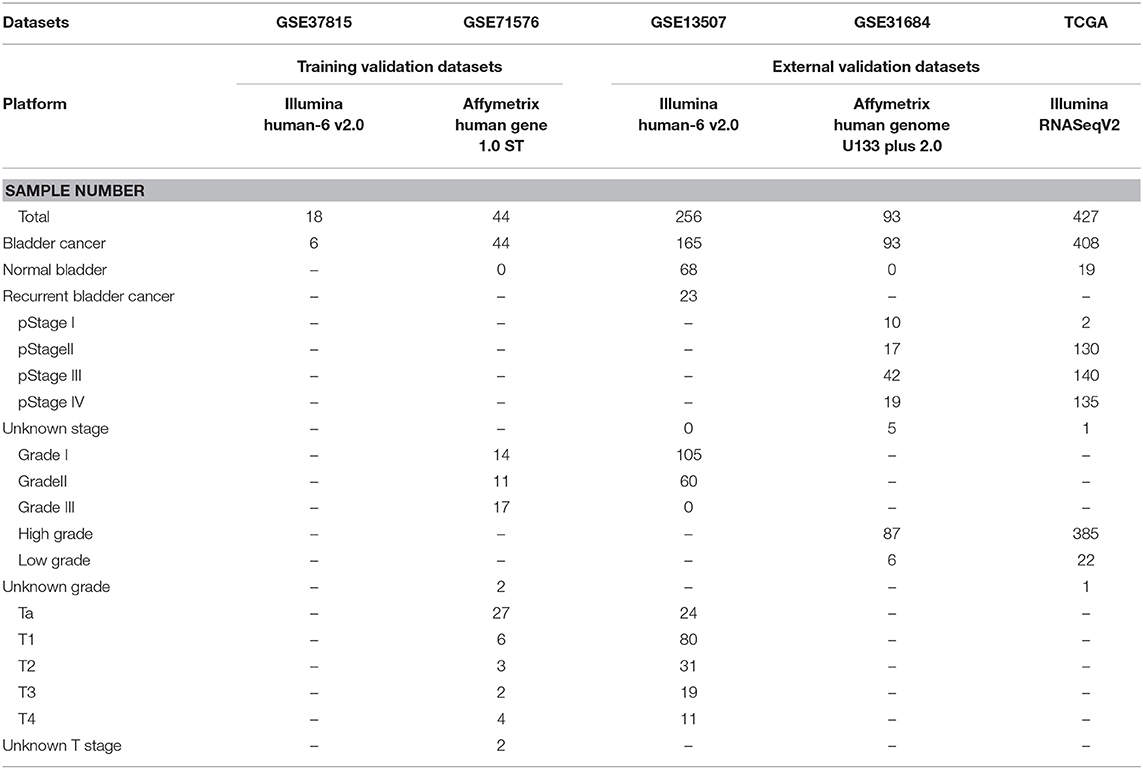
Table 1. Information of datasets used in this study.
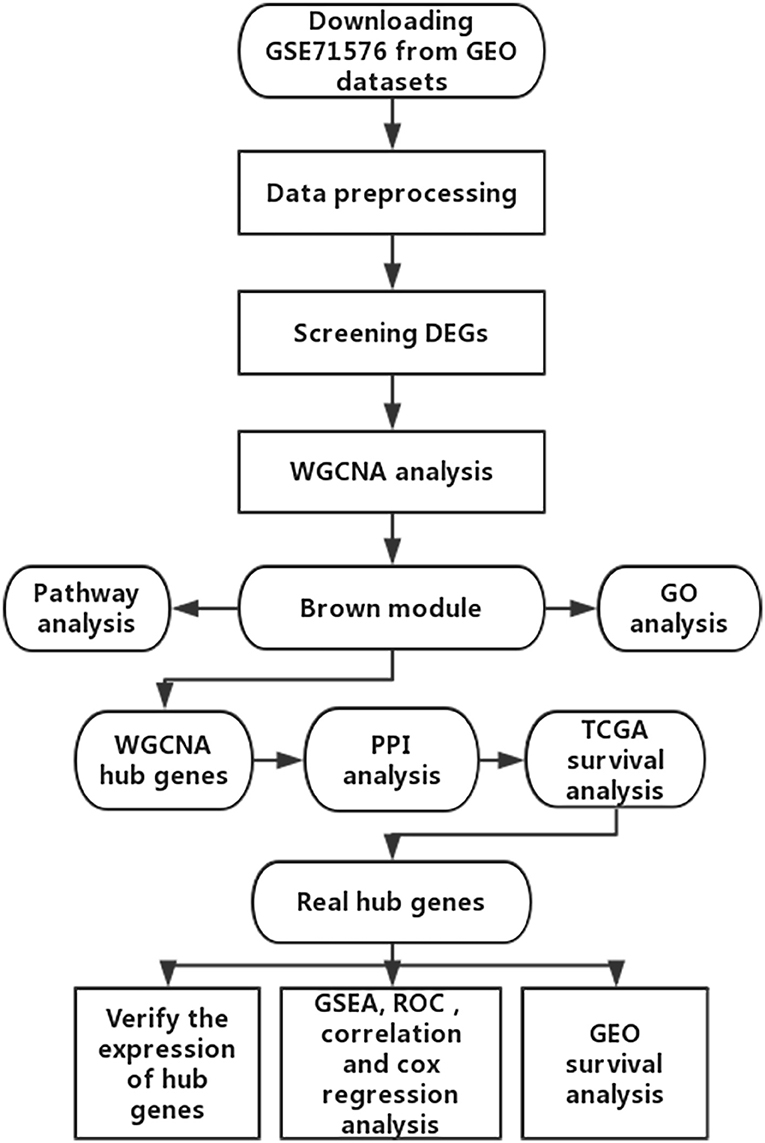
Figure 1. Flow diagram of the study.
Data Preprocessing and DEGs Screening
All the raw expression data were subject to quality control, background correction, normalization, logarithmic conversion and remove batch effects processing, using the R packages “affy” (21) or “limma” (22). After that, samples without clinical data were filtered out, and the resulting data were subsequently analyzed. The RNA-seq data of the TCGA dataset were normalized using the “DESeq2” (23) R package. The “limma” R package was used to screen the DEGs between eighteen BC and six normal bladder samples in dataset GSE37815. The false discovery rate (FDR) <0.05 and |log2FC| ≥1 were set as the threshold for screening DEGs.
Establishment of Weighted Co-expression Network
The DEGs were used to construct a weighted co-expression network by the R package “WGCNA” (24). Firstly, we used the function “goodSamplesGenes” in the “WGCNA” package checked to see if the input genes (DEGs) and input samples were good genes and good samples. Secondly, Pearson's correlation analysis of all pairs of genes was used to construct an adjacency matrix. After that, the adjacency matrix was used to construct a scale-free co-expression network based on a soft-thresholding parameter β (β was a soft-thresholding parameter that could enhance strong correlations between genes and penalize weak correlations) (25). The adjacency matrix was then turned into a topological overlap matrix (TOM). TOM could measure the network connectivity of a gene, which was defined as the sum of its adjacency with all other genes, and was used for network generation (26). At the same time, in order to classify genes with similar expression patterns into gene modules, average linkage hierarchical clustering was conducted according to the TOM-based dissimilarity measure with a minimum size (gene group) of 50 for the genes dendrogram.
Identify Significant Relevant Module and Module Functional Annotation
To investigate the biological function of the brown module, which significantly related to the histologic grade of BC, we uploaded the list of all genes in the brown module to the DAVID website (https://david.ncifcrf.gov) for functional annotation analysis. The threshold was the p < 0.05.
Real Hub Genes Identification by WGCNA, PPI, and Survival Analysis
By calculating the correlation between modules and clinical phenotypes by the module-trait relationship of WGCNA, we could screen the module most relevant to the clinical phenotype we were interested in. In our study, histologic grade (r = 0.85, p = 1e-12) was selected as interested clinical phenotype for subsequent analysis.
After the interesting module was chosen, same as in the past (27, 28), we defined the cor.geneModuleMembership > 0.8 (the correlation between the gene and a certain clinical phenotype) and cor.geneTraitSignificance > 0.2 (the correlation between the module eigengene and the gene expression profile) as the threshold for screening hub genes in a module.
To further target and screen more meaningful hub genes, we uploaded the list of 49 hub genes to the STRING database (https://string-db.org/) to construct a protein-protein interaction (PPI) network (29). The minimum interaction score of these genes was >0.4 and were defined as the threshold of the hub genes of the PPI network. The Cytoscape software (30) was used to visualize network diagrams for PPI analysis. Finally, we used the Gene Expression Profiling Interactive Analysis (GEPIA) database (31) (http://gepia.cancer-pku.cn/) to test the prognostic value of hub genes, and the hub genes with the ability to predict prognosis were the real hub genes. To verify the value of predicting prognosis of hub genes, a survival analysis of real hub genes was performed using the GSE13507 dataset from GEO datasets.
Gene Set Enrichment Analysis of Real Hub Genes
The GSEA software was downloaded from http://software.broadinstitute.org/gsea/index.jsp. The GSEA analysis was conducted with a small cohort GSE37815 and a large cohort TCGA dataset, respectively. We divided the samples into two groups according to the median expression of hub genes, and chose the C2 (c2.cp.kegg.v6.1.symbols.gmt) sub-collection downloaded from the Molecular Signatures Database (http://software.broadinstitute.org/gsea/msigdb/index.jsp) as the reference gene sets to perform GSEA analysis.
Verify the Expression Pattern and the Prognostic Value of Real Hub Genes
The datasets GSE37815 and GSE71576 were selected as internal validation datasets, the datasets GSE31684, GSE13507, and TCGA were set as external validation datasets. All of them were used to verify the real hub genes' mRNA expression pattern in different histologic grades or pathologic stage of BC. In addition, we used the Oncomine database (https://www.oncomine.org/resource/main.html) and the above dataset to verify the expression of real hub genes between BC tissues and adjacent tissues. We used the one-way analysis of variance (ANOVA) or Student's t-test to measure the statistical significance of the calculated results. After that, we performed a Kaplan-Meier survival analysis of hub genes in each cohort using the “survival” R package.
Results
Screening of Differentially Expressed Genes
The R package “limma” was used to screen DEGs between BC and normal bladder samples in GSE37815, where a total of 792 DEGs were screened (240 up-regulated and 552 down-regulated) under the threshold of FDR <0.05 and logFC (fold change) ≥1. The heatmap of DEGs is shown in Supplementary Figure S1, and all DEGs are listed in Supplementary Table S1.
Establishment of Co-expression Network
We used the R package of “WGCNA” to construct the weighted co-expression network. No outlier samples were found by Pearson correlation analysis (Figure 2A). We put 792 DEGs with similar expression patterns into modules by cluster analysis. In this study, the power of β = 6 (scale-free R2 = 0.95) was chosen for the soft-thresholding to ensure a scale-free network (Supplementary Figures S2A–D), and we got four modules for the next analysis (Supplementary Figure S2E).
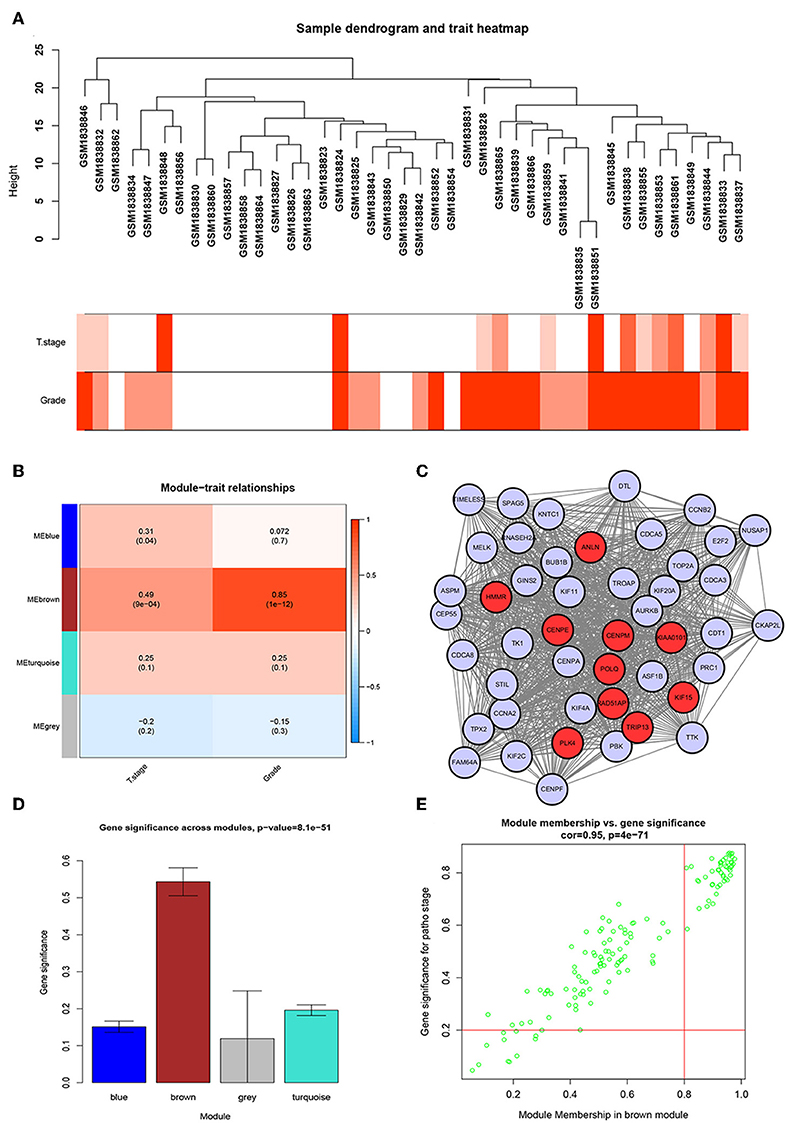
Figure 2. WGCNA and PPI network analysis. (A) Sample dendrogram and trait indicator. The clustering was a visual result of calculations based on Pearson correlation coefficients between samples. The color intensity was proportional to T stage and histologic grade of BC. (B) Identification of modules associated with the clinical traits of BC. (C) PPI network of WGCNA hub genes, the red nodes represent the hub genes in the PPI network. (D) Distribution of average gene significance and errors in the modules associated with histologic grade of BC. (E) Scatter plot of module eigengenes related to histologic grade in the brown module.
Identification of the Most Significant Modules
To identify genes associated with the progression of BC, we analyzed the association between modules and clinical phenotypes. The modules most significantly associated with tumor grade and T stage are of great value in predicting BC progression. Histologic grade (r = 0.85, p = 1e-12) and T stage (r = 0.49, p = 9e-04, Figure 2B) were significantly associated with brown module by Module-feature relationship analysis. Besides, the brown module had the highest gene significance in relation to histologic grade (Figure 2D). Therefore, we chose the brown module for further analysis.
Brown Module Functional Annotation
In order to study the function of the brown module, we uploaded the list of all genes in the brown module to the DAVID (https://david.ncifcrf.gov) website for a functional annotation analysis. The KEGG analysis revealed that the “cell cycle,” “FoxO signaling pathway,” “Tight junction,” “MicroRNAs in cancer,” and “p53 signaling pathway” were mainly enriched in the brown module (Figure 3A). The biological process of the brown module was mainly related to “microtubule-based movement,” “mitotic chromosome condensation,” “activation of protein kinase activity,” and so on (Figure 3B). The cell component of brown module was mainly enriched in “midbody,” “kinesin complex,” “spindle microtubule,” etc. (Figure 3C). And the molecular function was mainly enriched in “ATP binding,” “microtubule motor activity,” “protein kinase C binding,” etc. (Figure 3D). The threshold was the p < 0.05. The information of functional annotation is listed in Supplementary Table S2.
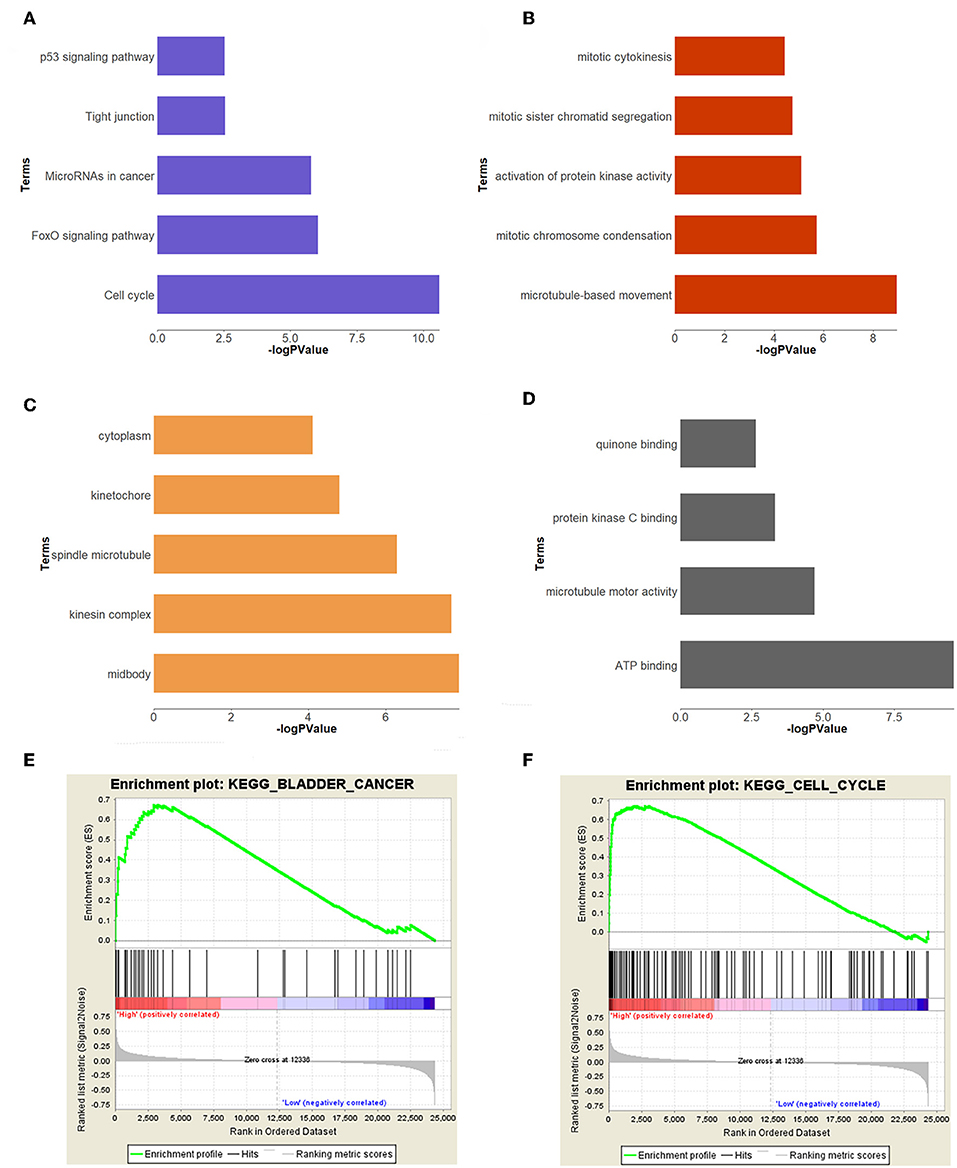
Figure 3. Functional annotation and GSEA analysis for brown module. (A) The signaling pathways, (B) biological process, (C) cellular components, (D) molecular composition of the brown module. (E,F) GSEA analysis revealed that the genes of brown module were mainly enriched in bladder cancer and cell cycle related pathways.
Identification of Real Hub Genes
To further screen for the most significant hub genes, we combined three methods (WGCNA, PPI, and survival analysis) to screen real hub genes together. First, 49 hub genes with high connectivity were screened out from the brown module (Figure 2E). Secondly, we uploaded these 49 hub genes to the STRING database for a PPI network analysis. Under the threshold of a minimum required interaction score > 0.4, 10 hub PPI genes were screened (Figure 2C, Supplementary Table S3). Finally, we used the GEPIA database for the survival analysis of these 10 hub genes, and the hub genes with the ability to predict prognosis were real hub genes (ANLN, HMMR, Supplementary Table S4). The results showed that both real hub genes were predictive of overall survival and disease-free survival in BC (Figures 4A–D, Supplementary Table S3). Meanwhile, the external validation dataset GSE13507 was used to confirm the prognostic value of real hub genes (Figures 4E,F).
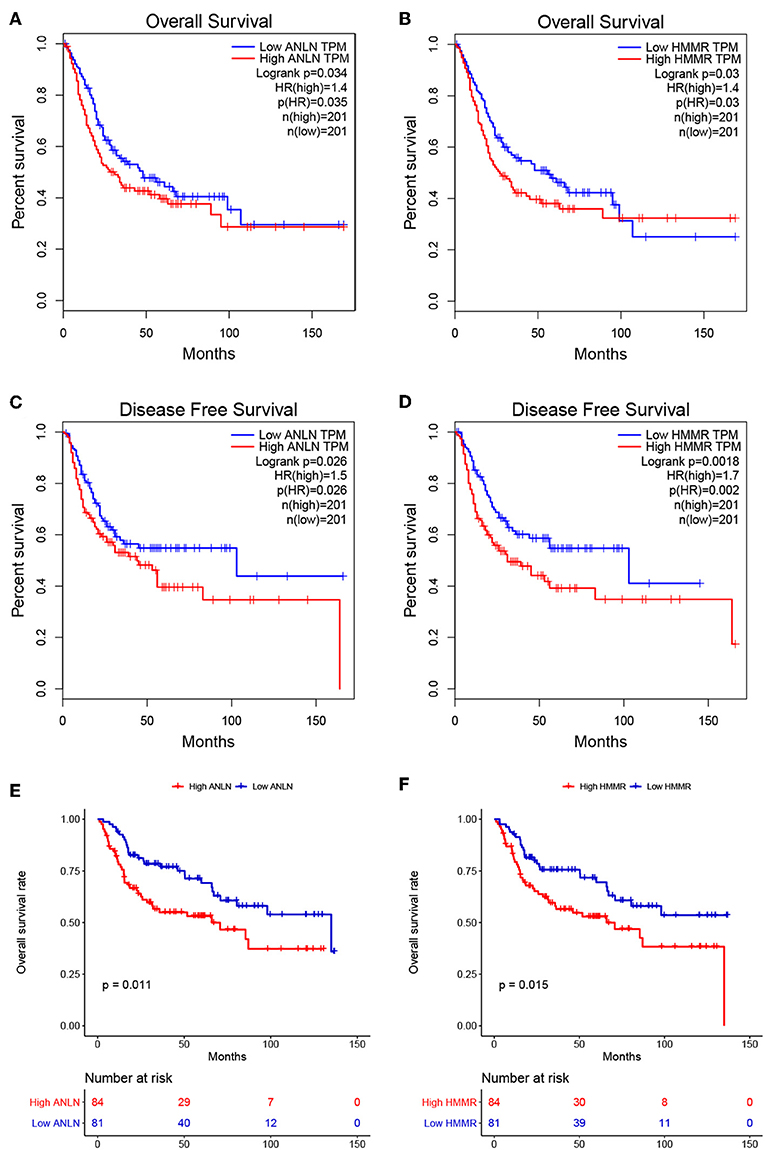
Figure 4. Survival analyses on real hub genes in the TCGA and GEO database. (A,B) Overall survival analysis related to ANLN (A) or HMMR (B) expression levels in the TCGA database. (C,D) Disease-free survival analyses related to ANLN (C) or HMMR (D) expression levels in the TCGA database. (E,F) Overall survival analysis related to ANLN (E) or HMMR (F) in the GEO database (GSE13507).
GSEA Analysis of Real Hub Genes
In order to explore the functions and pathways of these two hub genes, we conducted GSEA on these hub genes, respectively. The GSEA analysis of two hub genes in the GSE37815 dataset revealed that the samples of highly expressed real hub genes were mainly enriched in “bladder cancer,” “cell cycle,” and “ubiquitin mediated proteolysis” related pathways (Figures 3E,F, Table 2). Subsequently, our GSEA analysis in the TCGA database produced similar results (Supplementary Tables S7–S9).
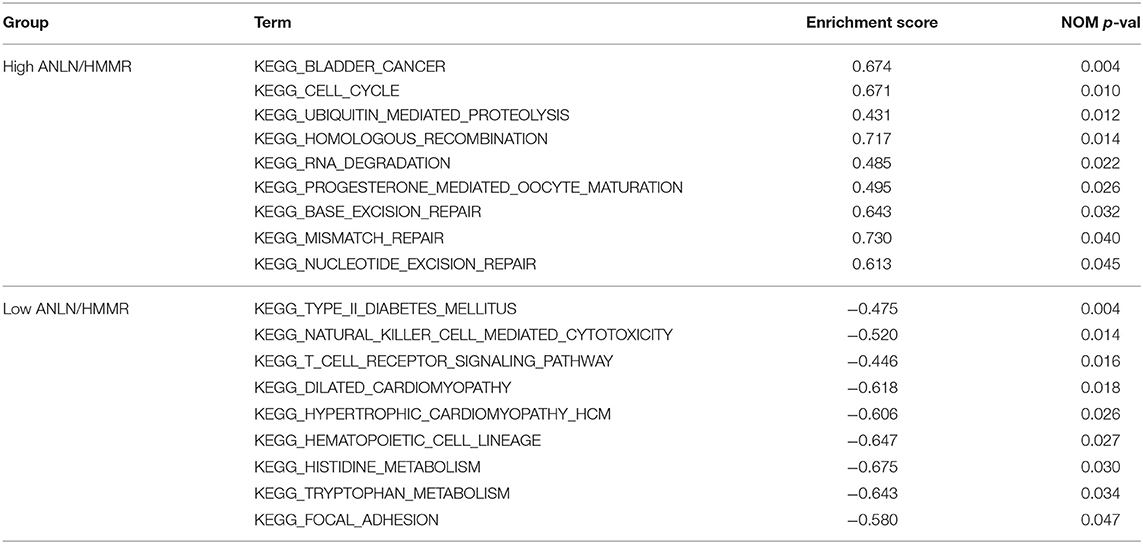
Table 2. Results of GSEA analysis based on the expression level of hub genes.
Verification of the Expression Pattern of Real Hub Genes
Since these real hub genes were screened out by DEGs, we first verified the expression pattern of real hub genes between BC and paracancerous. The results showed that the expression of real hub genes was up-regulated in BC (Supplementary Figure S3), and the results were consistent in multiple datasets (Oncomine dataset, GSE13507, GSE37815, and TCGA dataset). Secondly, since the real hub genes belong to the brown module, which was significantly related to the histological grade and pathological stage of BC, the expression pattern of ANLN (Figure 6) and HMMR (Figure 7) in different histological grade and pathological stage were verified in internal validation datasets (GSE71576) and external validation datasets (GSE13507, GSE31684, and TCGA dataset). The one-way analysis of variance (ANOVA) or Student's t-test was used to measure the statistical significance of the calculated results. The results of receiver operating characteristic curve (ROC) analysis showed that real hub genes could well distinguish cancer and paracancer, different grades, different stages, NMIBC and MIBC (Supplementary Table S5). In addition, we verified the expression patterns of the protein levels of ANLN and HMMR in tissues in the HPA database, and found that the higher the grade of BC, the higher the protein levels of these two genes were (Supplementary Figure S6).
Validation of Prognostic Value of Real Hub Genes
To further explore the prognostic value of hub genes in BC, we conducted a subgroup survival analysis of these two genes in the TCGA dataset. The results showed that these two genes showed significant prognostic value in different stages and grades, which could not only accurately predict the overall survival rate of BC, but also predict its progression-free interval (PFI) event (Figure 5).
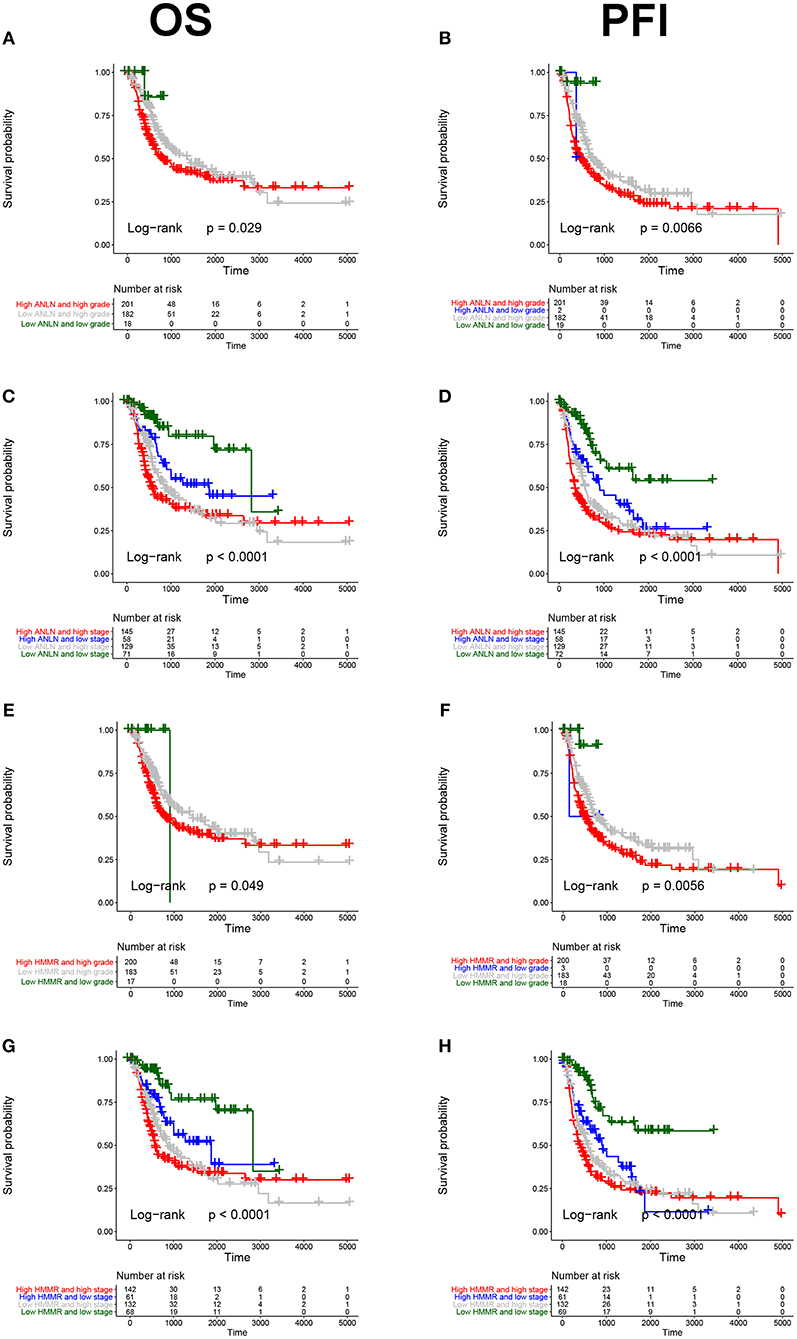
Figure 5. Subgroup survival analysis of hub genes. Overall survival (left panels) and Progression-free interval analyses (right panels) of ANLN were performed in different tumor grade subtypes (A,B); Again, we did the same analysis in tumor stage subtypes (C,D); Corresponding to the previous analysis, we did the same analysis for HMMR (E–H).
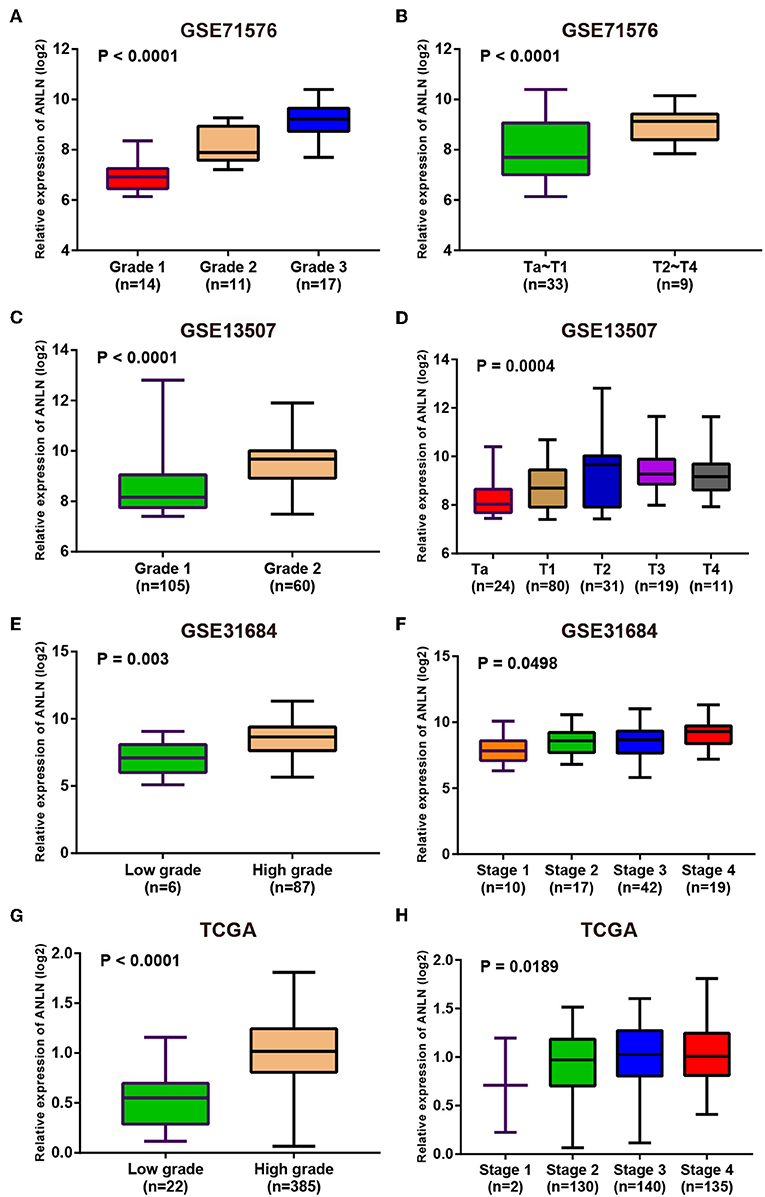
Figure 6. Expression pattern validation for ANLN. ANLN in GSE71576 (A,B) GSE13507 (C,D) GSE31684 (E,F), TCGA database (G,H) of different grade and stage of expressing validation. Statistical differences in these data were calculated using One-way analysis of variance (ANOVA) or Student's t-test.
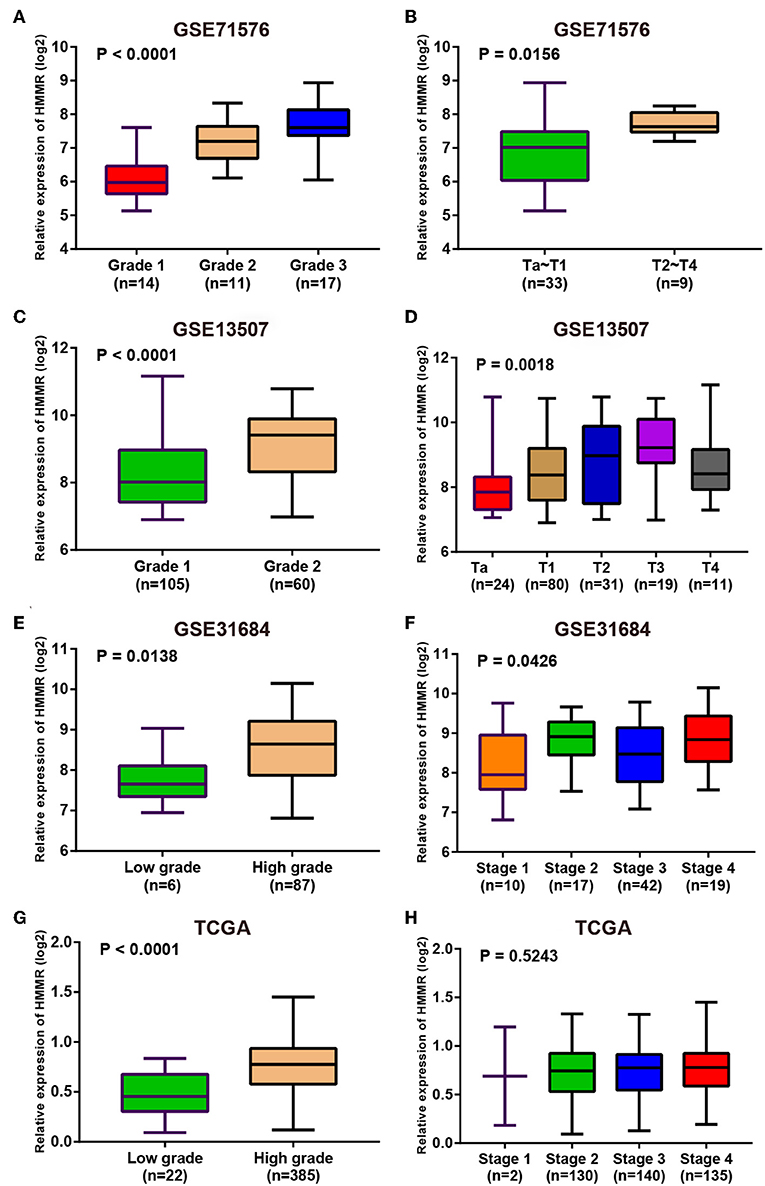
Figure 7. Expression pattern validation for HMMR. HMMR in GSE71576 (A,B) GSE13507 (C,D) GSE31684 (E,F), TCGA database (G,H) of different grade and stage of expressing validation. Statistical differences in these data were calculated using One-way analysis of variance (ANOVA) or Student's t-test.
Drug Sensitivity of Real Hub Genes
GSCALite (http://bioinfo.life.hust.edu.cn/web/GSCALite/) is a web-based analysis platform for gene set cancer analysis (32). We used this database to analyze drug sensitivity of real hub genes, which provides support for drug selection of real hub genes targeted therapy.
Finally, we explored the drug sensitivity of real hub genes using the GSCALite database, and the results were shown in Supplementary Figure S5, which provides support for drug targeted therapy of real hub genes.
Discussion
BC is one of the most common tumors of the urinary system. Currently, radical cystectomy is the most effective treatment for BC, but in most cases, this treatment will greatly reduce the quality of life of patients (33). Therefore, it is urgent to find biomarkers that can accurately predict the progression and prognosis of BC.
Through a series of rigorous screening, two real hub genes (ANLN, HMMR) that could accurately predict the progression and prognosis of BC were found. Similar studies have focused mostly on one clinical phenotype (34–36). Our study conducted correlation analysis of T staging and grading as both clinical phenotypes and modules are of interest to us, and the results revealed that the brown module was highly correlated with both T staging (r = 0.49, p = 9e-04) and grading (r = 0.85, p = 1e-12). We then used a lot of datasets to verify this, and it turned out that the real hub genes were actually significantly correlated with BC T stage, pathological stage, and histological grade. Moreover, we also hoped to find biomarkers that could accurately predict the prognosis of BC, so we used survival analysis as a screening condition, which was neglected in some similar studies (37, 38). In the following two hub genes, we analyzed the survival analysis of the two hub genes and analyzed them in different subgroups (stage, grade), and found that these two genes had a high prognostic value for BC.
The excessive proliferation of tumors is often accompanied by cell cycle disorders. We used GSEA analysis to explore the function of real hub genes, and we found that both ANLN and HMMR were significantly enriched in functions and pathways related to “cell cycle.” Correlation analysis also supports this result. These two genes were also enriched in the pathway related to “bladder cancer,” and we speculate that these two genes may play a key role in the pathogenesis of BC.
ANLN (Anillin) is an actin-binding protein and has reportedly been shown to be significantly upregulated in the BC, knockdown of ANLN results in G2/M phase block and reduces expression of cyclin B1 and D1, and it was also demonstrated that ANLN can promote the progression, migration, and invasion of BC (39). Other studies have found that ANLN could promote the progression of pancreatic cancer by inducing the up-regulation of EZH2 by mediating the mir-218-5p /LASP1 signaling axis (40). ANLN has also been found to play a key role in the development of human lung cancer (41). All these suggest that ANLN plays a very important role in the development and progression of tumors. We found a high correlation between ANLN and CIRBP (Supplementary Figure S4B, Supplementary Table S6), a gene that we studied before (42); therefore, we can further explore the interaction between ANLN and CIRBP in the pathogenesis of BC. We also found a strong correlation between ANLN and KIF23 (Supplementary Figure S4A, Supplementary Table S6), an independent prognostic target for glioma (43).
HMMR (Hyaluronan Mediated Motility Receptor) is widely expressed in many types of tumors, including prostate and breast cancer, and various forms of leukemia (44–46). Previously reported overexpression of HMMR is associated with the development of metastatic prostate cancer (PCa) and castration-resistant PCa (46). But HMMR has never been studied in human BC, so our study found a new potential biomarker for BC. We found a strong correlation between HMMR and KIF20A (Supplementary Figure S4C, Supplementary Table S6), and a recent study found that KIF20A affects the prognosis of BC by promoting the proliferation and metastasis of BC (47). These studies are very helpful for our future research on the pathogenesis of HMMR in BC.
Taken together, through the integrated analysis of multiple databases and the establishment of the co-expression network by WGCNA analysis, two hub genes that can accurately predict the progression and prognosis of BC were screened out layer by layer, providing potential targets for the pathogenesis and treatment selection of BC.
Data Availability Statement
Publicly available datasets were analyzed in this study. This data can be found here: https://www.ncbi.nlm.nih.gov/.
Author Contributions
YW, XW, and YX conceived and designed the study. YW and LC performed the analysis procedures. YW, LC, LJ, KQ, XL, and YX analyzed the results. YW, LC, and YX contributed analysis tools. YW, LC, XW, and YX contributed to the writing of the manuscript. All authors reviewed the manuscript.
Funding
This study was supported in part by the Zhongnan Hospital of Wuhan University Science, Technology and Innovation Seed Fund (grant number: cxpy2017028 and cxpy2017045), and Wuhan Clinical Cancer Research Center of Urology and Male Reproduction (grant number 303-230100055). The funders had no role in study design, data collection, and analysis, decision to publish, or preparation of the manuscript.
Conflict of Interest
The authors declare that the research was conducted in the absence of any commercial or financial relationships that could be construed as a potential conflict of interest.
Acknowledgments
The excellent technical assistance of Shanshan Zhang and Danni Shan is gratefully acknowledged.
Supplementary Material
The Supplementary Material for this article can be found online at: https://www.frontiersin.org/articles/10.3389/fonc.2019.01030/full#supplementary-material
References
1. Ferlay J, Shin HR, Bray F, Forman D, Mathers C, Parkin DM. Estimates of worldwide burden of cancer in 2008: GLOBOCAN 2008. Int J Cancer. (2010) 127:2893–917. doi: 10.1002/ijc.25516
2. Kamat AM, Hahn NM, Efstathiou JA, Lerner SP, Malmstrom PU, Choi W, et al. Bladder cancer. Lancet. (2016) 388:2796–810. doi: 10.1016/S0140-6736(16)30512-8
3. Ferlay J, Soerjomataram I, Dikshit R, Eser S, Mathers C, Rebelo M, et al. Cancer incidence and mortality worldwide: sources, methods and major patterns in GLOBOCAN 2012. Int J Cancer. (2015) 136:E359–86. doi: 10.1002/ijc.29210
4. Youssef RF, Lotan Y. Predictors of outcome of non-muscle-invasive and muscle-invasive bladder cancer. ScientificWorldJournal. (2011) 11:369–81. doi: 10.1100/tsw.2011.28
5. Humphrey PA, Moch H, Cubilla AL, Ulbright TM, Reuter VE. The 2016 WHO classification of tumours of the urinary system and male genital organs-part B: prostate and bladder tumours. Eur Urol. (2016) 70:106–19. doi: 10.1016/j.eururo.2016.02.028
6. Knowles MA, Hurst CD. Molecular biology of bladder cancer: new insights into pathogenesis and clinical diversity. Nat Rev Cancer. (2015) 15:25–41. doi: 10.1038/nrc3817
7. Alfred Witjes J, Lebret T, Comperat EM, Cowan NC, De Santis M, Bruins HM, et al. Updated 2016 EAU guidelines on muscle-invasive and metastatic bladder cancer. Eur Urol. (2017) 71:462–75. doi: 10.1016/j.eururo.2016.06.020
8. Lodewijk I, Duenas M, Rubio C, Munera-Maravilla E, Segovia C, Bernardini A, et al. Liquid biopsy biomarkers in bladder cancer: a current need for patient diagnosis and monitoring. Int J Mol Sci. (2018) 19:E2514. doi: 10.3390/ijms19092514
9. Chamie K, Litwin MS, Bassett JC, Daskivich TJ, Lai J, Hanley JM, et al. Recurrence of high-risk bladder cancer: a population-based analysis. Cancer. (2013) 119:3219–27. doi: 10.1002/cncr.28147
10. Wolff EM, Liang G, Jones PA. Mechanisms of disease: genetic and epigenetic alterations that drive bladder cancer. Nat Clin Pract Urol. (2005) 2:502–10. doi: 10.1038/ncpuro0318
11. Burger M, Catto JW, Dalbagni G, Grossman HB, Herr H, Karakiewicz P, et al. Epidemiology and risk factors of urothelial bladder cancer. Eur Urol. (2013) 63:234–41. doi: 10.1016/j.eururo.2012.07.033
12. Gu P, Chen H. Modern bioinformatics meets traditional Chinese medicine. Brief Bioinformatics. (2014) 15:984–1003. doi: 10.1093/bib/bbt063
13. Li Q, Eichten SR, Hermanson PJ, Zaunbrecher VM, Song J, Wendt J, et al. Genetic perturbation of the maize methylome. Plant Cell. (2014) 26:4602–16. doi: 10.1105/tpc.114.133140
14. Huang MD, Huang AH. Bioinformatics reveal five lineages of oleosins and the mechanism of lineage evolution related to structure/function from green algae to seed plants. Plant Physiol. (2015) 169:453–70. doi: 10.1104/pp.15.00634
15. Turei D, Foldvari-Nagy L, Fazekas D, Modos D, Kubisch J, Kadlecsik T, et al. Autophagy regulatory network - a systems-level bioinformatics resource for studying the mechanism and regulation of autophagy. Autophagy. (2015) 11:155–65. doi: 10.4161/15548627.2014.994346
16. Omura S, Kawai E, Sato F, Martinez NE, Chaitanya GV, Rollyson PA, et al. Bioinformatics multivariate analysis determined a set of phase-specific biomarker candidates in a novel mouse model for viral myocarditis. Circ Cardiovasc Genet. (2014) 7:444–54. doi: 10.1161/CIRCGENETICS.114.000505
17. Ren J, Zhao G, Sun X, Liu H, Jiang P, Chen J, et al. Identification of plasma biomarkers for distinguishing bipolar depression from major depressive disorder by iTRAQ-coupled LC-MS/MS and bioinformatics analysis. Psychoneuroendocrinology. (2017) 86:17–24. doi: 10.1016/j.psyneuen.2017.09.005
18. Rong L, Huang W, Tian S, Chi X, Zhao P, Liu F. COL1A2 is a novel biomarker to improve clinical prediction in human gastric cancer: integrating bioinformatics and meta-analysis. Pathol Oncol Res. (2018) 24:129–34. doi: 10.1007/s12253-017-0223-5
19. Song E, Song W, Ren M, Xing L, Ni W, Li Y, et al. Identification of potential crucial genes associated with carcinogenesis of clear cell renal cell carcinoma. J Cell Biochem. (2018) 119:5163–74. doi: 10.1002/jcb.26543
20. Zhu QN, Renaud H, Guo Y. Bioinformatics-based identification of miR-542-5p as a predictive biomarker in breast cancer therapy. Hereditas. (2018) 155:17. doi: 10.1186/s41065-018-0055-7
21. Gautier L, Cope L, Bolstad BM, Irizarry RA. affy–analysis of Affymetrix GeneChip data at the probe level. Bioinformatics. (2004) 20:307–15. doi: 10.1093/bioinformatics/btg405
22. Ritchie ME, Phipson B, Wu D, Hu Y, Law CW, Shi W, et al. limma powers differential expression analyses for RNA-sequencing and microarray studies. Nucleic Acids Res. (2015) 43:e47. doi: 10.1093/nar/gkv007
23. Love MI, Huber W, Anders S. Moderated estimation of fold change and dispersion for RNA-seq data with DESeq2. Genome Biol. (2014) 15:550. doi: 10.1186/s13059-014-0550-8
24. Langfelder P, Horvath S. WGCNA: an R package for weighted correlation network analysis. BMC Bioinformatics. (2008) 9:559. doi: 10.1186/1471-2105-9-559
25. Chen L, Yuan L, Qian K, Qian G, Zhu Y, Wu CL, et al. Identification of biomarkers associated with pathological stage and prognosis of clear cell renal cell carcinoma by co-expression network analysis. Front Physiol. (2018) 9:399. doi: 10.3389/fphys.2018.00399
26. Botia JA, Vandrovcova J, Forabosco P, Guelfi S, D'Sa K, United Kingdom Brain Expression Consortium, et al. An additional k-means clustering step improves the biological features of WGCNA gene co-expression networks. BMC Syst Biol. (2017) 11:47. doi: 10.1186/s12918-017-0420-6
27. Chen L, Yuan L, Wang Y, Wang G, Zhu Y, Cao R, et al. Co-expression network analysis identified FCER1G in association with progression and prognosis in human clear cell renal cell carcinoma. Int J Biol Sci. (2017) 13:1361–72. doi: 10.7150/ijbs.21657
28. Yuan L, Zeng G, Chen L, Wang G, Wang X, Cao X, et al. Identification of key genes and pathways in human clear cell renal cell carcinoma (ccRCC) by co-expression analysis. Int J Biol Sci. (2018) 14:266–79. doi: 10.7150/ijbs.23574
29. Szklarczyk D, Franceschini A, Wyder S, Forslund K, Heller D, Huerta-Cepas J, et al. STRING v10: protein-protein interaction networks, integrated over the tree of life. Nucleic Acids Res. (2015) 43:D447–52. doi: 10.1093/nar/gku1003
30. Su G, Morris JH, Demchak B, Bader GD. Biological network exploration with Cytoscape 3. Curr Protoc Bioinformatics. (2014) 47, 11–24. doi: 10.1002/0471250953.bi0813s47
31. Tang Z, Li C, Kang B, Gao G, Li C, Zhang Z. GEPIA: a web server for cancer and normal gene expression profiling and interactive analyses. Nucleic Acids Res. (2017) 45:W98–102. doi: 10.1093/nar/gkx247
32. Liu CJ, Hu FF, Xia M, Han L, Zhang Q, Guo AY. GSCALite: a web server for gene set cancer analysis. Bioinformatics. (2018) 34:3771–2. doi: 10.1093/bioinformatics/bty411
33. Stein JP, Lieskovsky G, Cote R, Groshen S, Feng AC, Boyd S, et al. Radical cystectomy in the treatment of invasive bladder cancer: long-term results in 1,054 patients. J Clin Oncol. (2001) 19:666–75. doi: 10.1200/JCO.2001.19.3.666
34. He Z, Sun M, Ke Y, Lin R, Xiao Y, Zhou S, et al. Identifying biomarkers of papillary renal cell carcinoma associated with pathological stage by weighted gene co-expression network analysis. Oncotarget. (2017) 8:27904–14. doi: 10.18632/oncotarget.15842
35. Huang H, Zhang Q, Ye C, Lv JM, Liu X, Chen L, et al. Identification of prognostic markers of high grade prostate cancer through an integrated bioinformatics approach. J Cancer Res Clin Oncol. (2017) 143:2571–9. doi: 10.1007/s00432-017-2497-0
36. Tian H, Guan D, Li J. Identifying osteosarcoma metastasis associated genes by weighted gene co-expression network analysis (WGCNA). Medicine. (2018) 97:e10781. doi: 10.1097/MD.0000000000010781
37. Yuan L, Shu B, Chen L, Qian K, Wang Y, Qian G, et al. Overexpression of COL3A1 confers a poor prognosis in human bladder cancer identified by co-expression analysis. Oncotarget. (2017) 8:70508–20. doi: 10.18632/oncotarget.19733
38. Zhou XG, Huang XL, Liang SY, Tang SM, Wu SK, Huang TT, et al. Identifying miRNA and gene modules of colon cancer associated with pathological stage by weighted gene co-expression network analysis. Onco Targets Ther. (2018) 11:2815–30. doi: 10.2147/OTT.S163891
39. Zeng S, Yu X, Ma C, Song R, Zhang Z, Zi X, et al. Transcriptome sequencing identifies ANLN as a promising prognostic biomarker in bladder urothelial carcinoma. Sci Rep. (2017) 7:3151. doi: 10.1038/s41598-017-02990-9
40. Wang A, Dai H, Gong Y, Zhang C, Shu J, Luo Y, et al. ANLN-induced EZH2 upregulation promotes pancreatic cancer progression by mediating miR-218-5p/LASP1 signaling axis. J Exp Clin Cancer Res. (2019) 38:347. doi: 10.1186/s13046-019-1340-7
41. Suzuki C, Daigo Y, Ishikawa N, Kato T, Hayama S, Ito T, et al. ANLN plays a critical role in human lung carcinogenesis through the activation of RHOA and by involvement in the phosphoinositide 3-kinase/AKT pathway. Cancer Res. (2005) 65:11314–25. doi: 10.1158/0008-5472.CAN-05-1507
42. Lu M, Ge Q, Wang G, Luo Y, Wang X, Jiang W, et al. CIRBP is a novel oncogene in human bladder cancer inducing expression of HIF-1alpha. Cell Death Dis. (2018) 9:1046. doi: 10.1038/s41419-018-1109-5
43. Sun L, Zhang C, Yang Z, Wu Y, Wang H, Bao Z, et al. KIF23 is an independent prognostic biomarker in glioma, transcriptionally regulated by TCF-4. Oncotarget. (2016) 7:24646–55. doi: 10.18632/oncotarget.8261
44. Greiner J, Schmitt M, Li L, Giannopoulos K, Bosch K, Schmitt A, et al. Expression of tumor-associated antigens in acute myeloid leukemia: implications for specific immunotherapeutic approaches. Blood. (2006) 108:4109–17. doi: 10.1182/blood-2006-01-023127
45. Kalmyrzaev B, Pharoah PD, Easton DF, Ponder BA, Dunning AM, Team S. Hyaluronan-mediated motility receptor gene single nucleotide polymorphisms and risk of breast cancer. Cancer Epidemiol Biomarkers Prev. (2008) 17:3618–20. doi: 10.1158/1055-9965.EPI-08-0216
46. Gust KM, Hofer MD, Perner SR, Kim R, Chinnaiyan AM, Varambally S, et al. RHAMM (CD168) is overexpressed at the protein level and may constitute an immunogenic antigen in advanced prostate cancer disease. Neoplasia. (2009) 11:956–63. doi: 10.1593/neo.09694
Keywords: bladder cancer (BC), gene-set enrichment analysis (GSEA), protein-protein interaction (PPI), weighted co-expression network analysis (WGCNA), The Cancer Genome Atlas (TCGA) dataset
Citation: Wang Y, Chen L, Ju L, Qian K, Liu X, Wang X and Xiao Y (2019) Novel Biomarkers Associated With Progression and Prognosis of Bladder Cancer Identified by Co-expression Analysis. Front. Oncol. 9:1030. doi: 10.3389/fonc.2019.01030
Received: 07 March 2019; Accepted: 23 September 2019;
Published: 11 October 2019.
Edited by:
Barbara Karen Dunn, National Institutes of Health (NIH), United StatesReviewed by:
Hiroshi Miyamoto, University of Rochester, United StatesShan Yan, University of North Carolina at Charlotte, United States
Copyright © 2019 Wang, Chen, Ju, Qian, Liu, Wang and Xiao. This is an open-access article distributed under the terms of the Creative Commons Attribution License (CC BY). The use, distribution or reproduction in other forums is permitted, provided the original author(s) and the copyright owner(s) are credited and that the original publication in this journal is cited, in accordance with accepted academic practice. No use, distribution or reproduction is permitted which does not comply with these terms.
*Correspondence: Xinghuan Wang, d2FuZ3hpbmdodWFuQHdodS5lZHUuY24=; Yu Xiao, eXUueGlhb0B3aHUuZWR1LmNu
†These authors have contributed equally to this work as co-first authors