 Xi Zhong
 Hongsheng Tang2†
 Bingui Lu
 Jiansheng Li
- 1Department of Radiology, Affiliated Cancer Hospital & Institute of Guangzhou Medical University, Guangzhou, China
- 2Department of Abdominal Surgery, Affiliated Cancer Hospital & Institute of Guangzhou Medical University, Guangzhou, China
- 3Department of Pathology, Affiliated Cancer Hospital & Institute of Guangzhou Medical University, Guangzhou, China
Background: Accurate characterization of small (3 cm) hepatocellular carcinoma (sHCC) and dysplastic nodules (DNs) in cirrhotic liver is challenging. We aimed to investigate whether texture analysis (TA) based on T2-weighted images (T2WI) is superior to qualitative diagnosis using gadoxetic acid-enhanced MR imaging (Gd-EOB-MRI) and diffusion-weighted imaging (DWI) for distinguishing sHCC from DNs in cirrhosis.
Materials and methods: Sixty-eight patients with 73 liver nodules (46 HCCs, 27 DNs) pathologically confirmed by operation were included. For imaging diagnosis, three sets of images were reviewed by two experienced radiologists in consensus: a Gd-EOB-MRI set, a DWI set, and a combined set (combination of Gd-EOB-MRI and DWI). For TA, 279 texture features resulting from T2WI were extracted for each lesion. The performance of each approach was evaluated by a receiver operating characteristic analysis. The area under the receiver operating characteristic curve (Az), sensitivity, specificity, and accuracy were determined.
Results: The performance of TA (Az = 0.96) was significantly higher than that of imaging diagnosis using Gd-EOB-MRI set (Az = 0.86) or DWI set (Az = 0.80) alone in differentiation of sHCC from DNs (P = 0.008 and 0.025, respectively). The combination of Gd-EOB-MRI and DWI showed a greater sensitivity (95.6%) but reduced specificity (66.7%). The specificity of TA (92.6%) was significantly higher than that of the combined set (P < 0.001), but no significant difference was observed in sensitivity (97.8 vs. 95.6%, P = 0.559).
Conclusion: TA-based T2WI showed a better classification performance than that of qualitative diagnosis using Gd-EOB-MRI and DW imaging in differentiation of sHCCs from DNs in cirrhotic liver. TA-based MRI may become a potential imaging biomarker for the early differentiation HCCs from DNs in cirrhosis.
Introduction
Hepatocellular carcinoma (HCC) is one of the most common malignancies; almost 80% of HCC occurs in patients with cirrhosis (1, 2). Hepatocarcinogenesis in cirrhosis usually shows a multistep progression from benign nodules, early HCC, and progressive HCC (3). Early detection of HCC, differentiation from benign cirrhotic nodules, provides the greatest chance for long-term survival (4). However, a complete characterization of these nodules still remains a difficult diagnostic dilemma due to the overlap of imaging features (5, 6).
Based on the criteria of the American Association for the Study of Liver Diseases, arterial enhancement followed by later (portal or equilibrium phase) washout is defined as a conclusive diagnosis for HCC (7). However, this typical enhancement pattern is not always presented, especially for some well-differentiated or small HCCs (8, 9). Diffusion-weighted imaging (DWI) can provide additional value to routine dynamic MRI by improving the diagnostic sensitivity (10, 11). The restricted diffusion facilitates HCC diagnosis by reflecting tissue hypercellularity (12). Nevertheless, some small HCCs may not show restricted diffusion (13, 14).
Recently, as a hepatocyte-specific intake agent MR imaging, gadoxetic acid-enhanced MR imaging (Gd-EOB-MRI) provides both early dynamic vascular phase and delayed hepatobiliary phase (HBP) information, which has been increasingly applied in the characterization of liver nodules. Gd-EOB-MRI has been demonstrated a higher sensitivity for detecting HCCs than conventional dynamic MRI due to hypointensity on HBP images (5, 15, 16). However, some small HCCs may not show hypointensity on HBP images; in contrast, some DNs are hypointensity (5, 17, 18).
Texture analysis (TA) based on medical images is a postprocessing approach in differential diagnosis of benign and malignant diseases (19). TA based on MRI has been used for distinguishing breast cancer from normal tissue and classifying histological types (20), e.g., differentiating prostate cancer from normal tissue and classifying prostate cancers with different Gleason scores (21). In liver assessments, texture-based MRI can be used to differentiate different single liver lesions (22, 23), evaluate hepatic fibrosis and cirrhosis grades (24), and predict the HCC histological grade (25).
The value of TA-based MRI for discriminating cirrhotic nodules remains unclear; we hypothesized that MRI-based TA may be helpful to distinguish HCCs from DNs. Thus, we performed this study to estimate the feasibility of TA-based T2-weighted images in the differentiation of sHCC from DNs in cirrhotic liver.
Materials and Methods
Patient Samples
This retrospective study was approved by the institutional review board of our hospital, and patient's informed consent was waived. We reviewed 455 consecutive patients with cirrhosis who underwent liver MRI to exclude HCC between January 2015 and October 2018. The inclusion criteria were as follows: (1) pathologically proven HCCs or DNs by surgical resection, (2) nodule diameter smaller than 3 cm and larger than 1 cm, (3) underwent both DW and Gd-EOB-MRI, and (4) received no treatment before MRI. Based on the inclusion criteria, ultimately a total of 68 patients [42 men, 26 women; median, 56 years (range, 30–73 years)] with 73 liver nodules (46 HCCs, 27 DNs) were enrolled. The patient inclusion flowchart is shown in Figure 1.
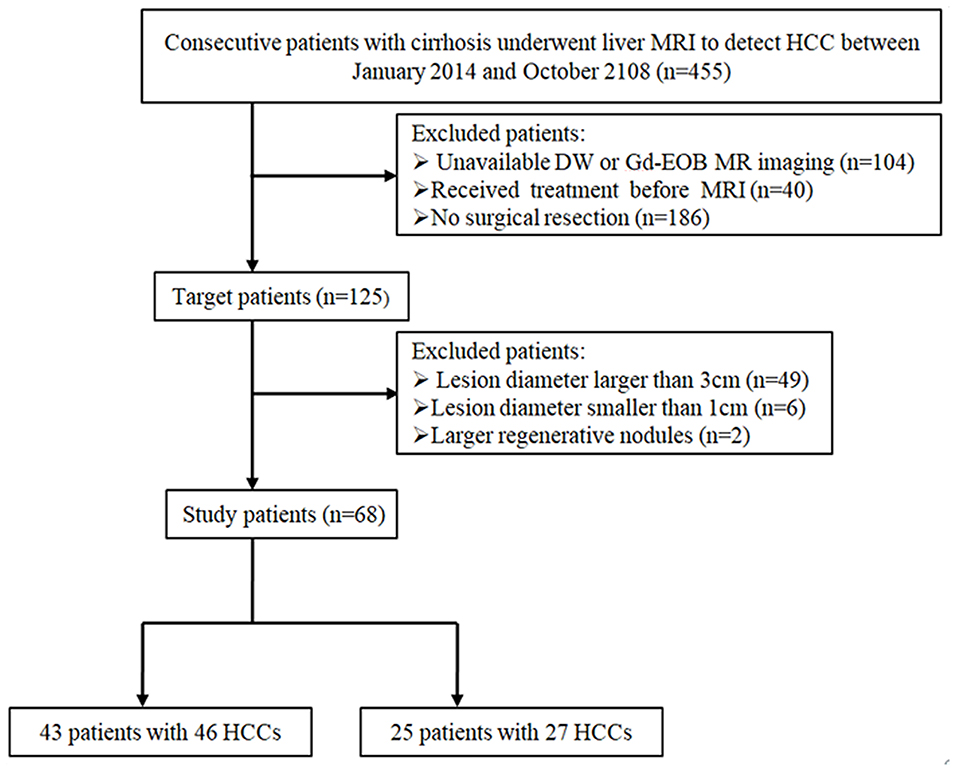
Figure 1. Flowchart of the study population.
MRI Acquisition
MR imaging was performed in a 3.0-T whole-body MR system (Achieva; Philips Healthcare, Best, Netherlands) with a 16-channel phased-array coil. The MRI protocol consisted of a respiratory-triggered T1-weighted turbo field-echo in-phase and opposed sequence [TR/first echo TE and second echo TE, 10/2.5 ms (in-phase) and 3.55 ms (opposed-phase); flip angle, 10°; matrix, 256 × 224; bandwidth, 434.3 Hz/pixel] and a breath-hold fat-saturated T2-weighted fast spin-echo sequence (TR/TE, 2,096/72 ms; flip angle, 90°; matrix size, 324 × 256; bandwidth, 258.4 Hz/pixel) with a 5-mm section thickness and a field of view (FOV) of 30–38 cm. DWI was performed using a respiratory triggering single-shot echo planar imaging sequence with b values of 0 and 800 s/mm2, spectral presaturation with inversion recovery for fat suppression, using a TR/TE of 1,600/70, matrix size of 100 × 100, acceleration factor of SENSE of 4.0, FOV of 30–35 cm, slice thickness of 5 mm, slice gap of 1 mm, and 33 axial slices. For Gd-EOB-MRI, unenhanced, arterial-phase (20–35 s), portal-phase (60 s), late-phase (3 min), and 20-min delayed HBP images were obtained using a T1-weighted three-dimensional (3D) turbo-field-echo sequence (T1 high-resolution isotropic volume examination; Philips Healthcare) (3.1/1.5; flip angle, 10°; matrix size, 228 × 211; bandwidth, 724.1 Hz/pixel) with a 2-mm section thickness and an FOV of 32–38 cm. The contrast agent was automatically administered intravenously at a rate of 1 ml/s for a dose of 0.025 mmol/kg body weight using a power injector, followed by a 20-ml saline flush.
Image Analysis
All images were analyzed separately and independently reviewed by two radiologists (B.G.L and P.Y.Y, with 15 and 10 years' experience of liver MR imaging, respectively) who were blinded to the patients' clinical data and the pathological diagnosis. Three image sets were reviewed, respectively: a Gd-EOB-MRI set (precontrast T1- and T2-weighted images and arterial, portal, equilibrium, and HBP images), a DWI set (precontrast T1- and T2-weighted images and DW images), and combined sets. Four-week interval between image reviews was performed for the three reviewing sessions to avert any recall bias. The signal intensity (SI) of each lesion was evaluated on Gd-EOB-MR and DW images. The SI features were classified into three groups: hypointensity, isointensity, or hyperintensity compared to the surrounding liver parenchyma.
As described in previous studies (5, 15, 26), in Gd-EOB-MRI set, the diagnostic criteria for HCC were defined as follows: (a) a nodule showed typical enhancement pattern (arterial enhancement and late portal or equilibrium washout); (b) a nodule with arterial enhancement without later washout, but hypointensity on HBP images, or peripheral rim enhancement on the late dynamic phase images (capsular appearance); and (c) a nodule without arterial enhancement, but larger than 1.5 cm and showed hypointensity on HBP images. In the DW set, if a lesion showed hyperintensity on DW images, it was interpreted as an HCC (14). In combined sets, if a lesion satisfied the HCC criteria of Gd-EOB-MRI or DWI, it would be identified as an HCC.
Texture Analysis
Texture Calculation
The axial FS T2-weighted images were exported in “.dicom” format from the PACS for texture analysis. One of the radiologists (X.Z) manually segmented images for each lesion using a free open-source software package MaZda 4.6 (URL: http://www.eletel.p.lodz.pl/programy/mazda/), and a single region of interest (ROI) was defined and delineated on the image section depicting the maximum lesion diameter (Figure 2A). Seven lesions (two HCCs and five DNs) were isointense on FS-T2-WI, in this case, T1-weighted or gadoxetic acid-enhanced images were used for accurate ROI placement. Refer to previous studies (20, 23), ROI gray-level normalization was performed by adjusting image intensities in the range of u ± 3σ (where u is the gray-level mean and σ is the gray-level standard deviation). A total of 279 texture parameters that derived from six statistical image descriptors were computed for each ROI (Table 1).
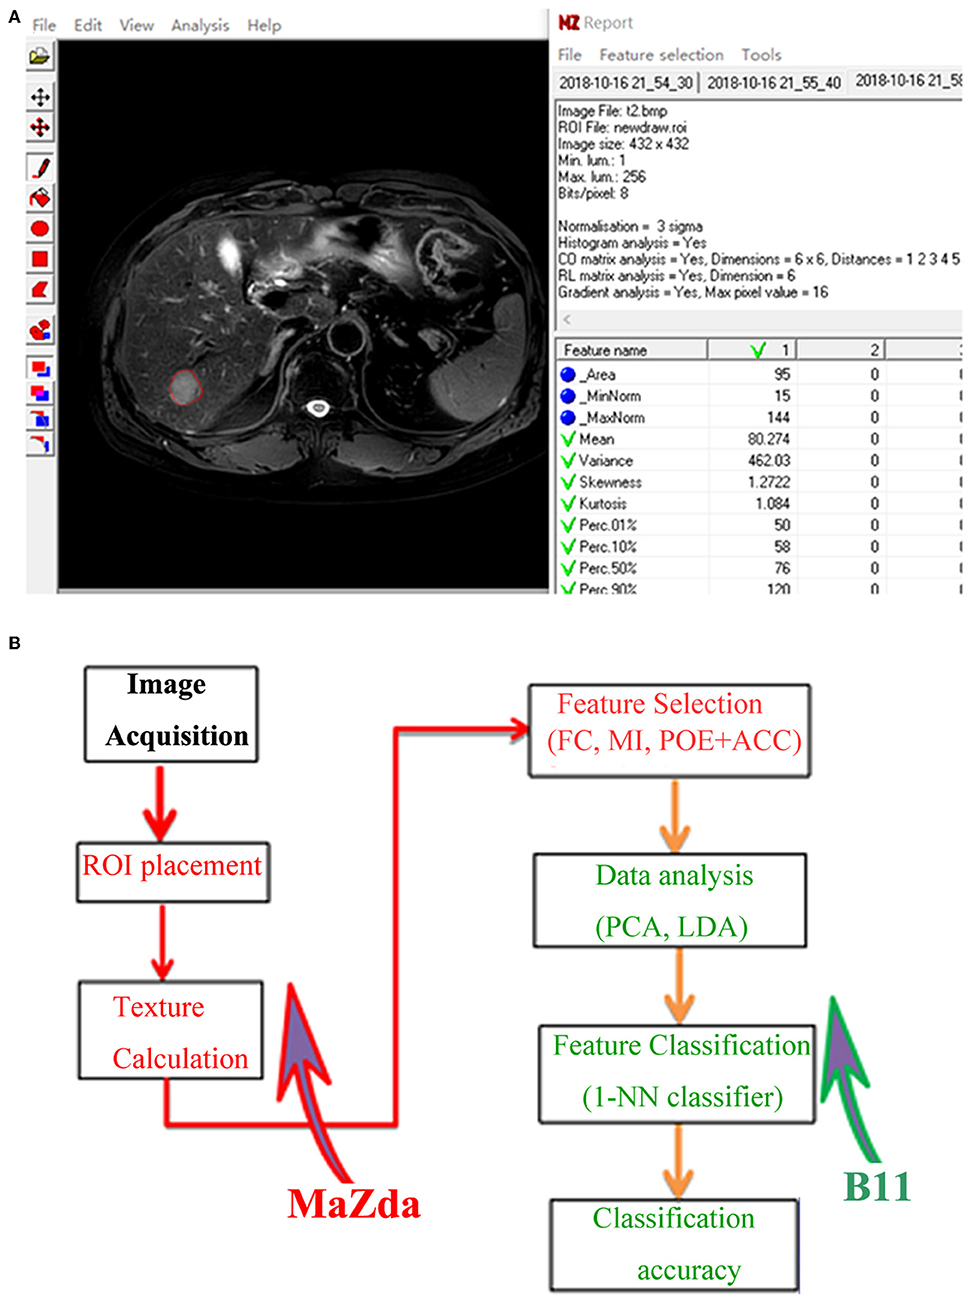
Figure 2. (A) Texture calculation for a 63-year-old man with a pathologically proven hepatocellular carcinoma (HCC) on fat-saturated T2-weighted images by using MaZda. A single region of interest (ROI) was defined and delineated on the image section depicting the maximum lesion diameter. (B) Procedure of texture analysis: texture calculation and feature selection were performed using MaZda; data analysis and classification were performed using program B11. ROI, region of interest; FC, Fisher coefficients; MI, mutual information; POE + ACC, minimization of both classification error probability and average correlation coefficients; PCA, principal component analysis; LDA, linear discriminant analysis; 1-NN, first nearest neighbor.
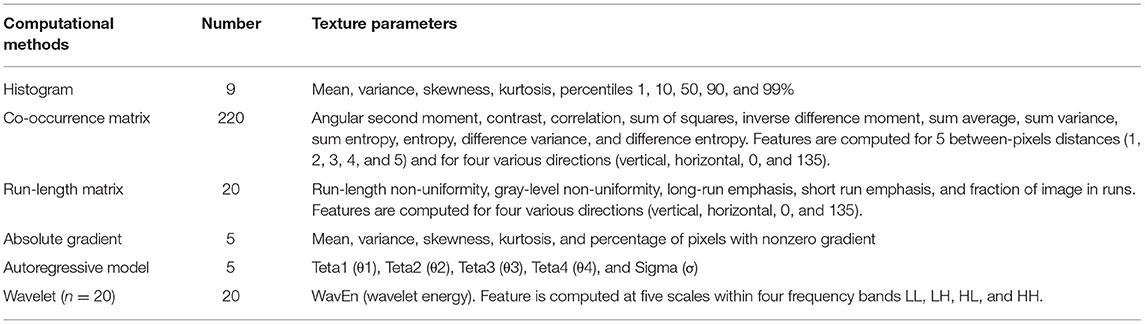
Table 1. Texture parameters calculated in MaZda.
Feature Selection
To determine the most discriminative texture features for differentiating sHCCs from DNs, as mentioned previously (23), we used three texture feature selection methods, including Fisher coefficients, minimization of both classification error probability and average correlation coefficients (POE + ACC), and mutual information (MI), respectively.
Feature Classification
Feature classification was performed in a statistical program B11 (version 4.6). As described in a previous study (27), principal component analysis (PCA) and linear discriminant analysis (LDA) were used for reducing the feature vector dimension and increasing the discriminative power. Then, the first nearest neighbor (1-NN) classifier with feature vector standardization was applied to determine classification accuracy (23, 24). The procedure of TA is shown in Figure 2B.
Histopathology Evaluation
International Working Party criteria was used for the evaluation of hepatocellular nodular (28). DNs were defined as a lesion with hepatocytes dysplasia but no definite histological features of malignancy, which were classified as low- or high-grade based on the cytological and architectural atypia (29).
Statistical Analysis
The sensitivity and specificity for differentiation of sHCCs from DNs were calculated for qualitative diagnosis and TA. The overall diagnostic efficiency was evaluated by calculating area under the receiver operating characteristic (ROC) curve (Az), and the ROC curves were plotted based on the dichotomous classification results of each diagnostic approach, and the diagonal segments are produced by ties. Mann–Whitney and chi-square test (or Fisher test) were performed for quantitative and categorical variables, respectively. All the statistical tests were performed using SPSS 16.0 (SPSS Inc., Chicago, IL, USA) package, and statistical significance was accepted for P < 0.05.
Result
Patient Characteristics
Patients' characteristics are summarized in Table 2. Of the 68 patients, 63.2% (43/68) with 46 lesions were diagnosed with HCCs (diameter range, 1.2–3.0 cm; mean, 1.9 cm), and 36.8% (25/68) of patients with 27 nodules were diagnosed with DNs (diameter range, 1.0–2.9 cm; mean, 1.7 cm). Of the 27 DNs, 13 were high-grade DNs (HGDNs) and 14 were low-grade DNs (LGDNs).
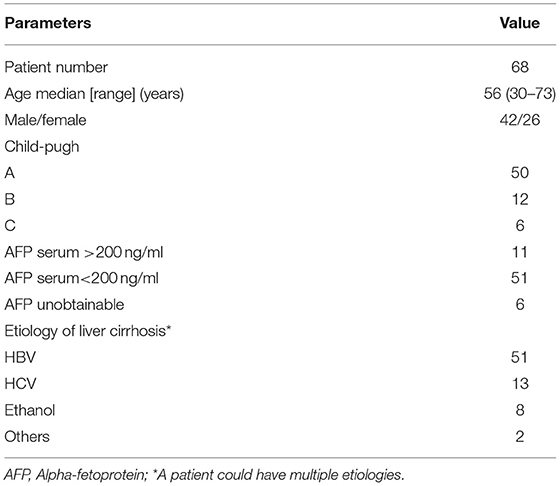
Table 2. Patients' characteristics.
Diagnostic Performance of Qualitative MRI Diagnosis
The SI features of HCCs and DNs on Gd-EOB-MRI and DWI are shown in Table 3. The diagnostic performance of each imaging set for differentiating sHCCs from DNs are shown in Table 4.
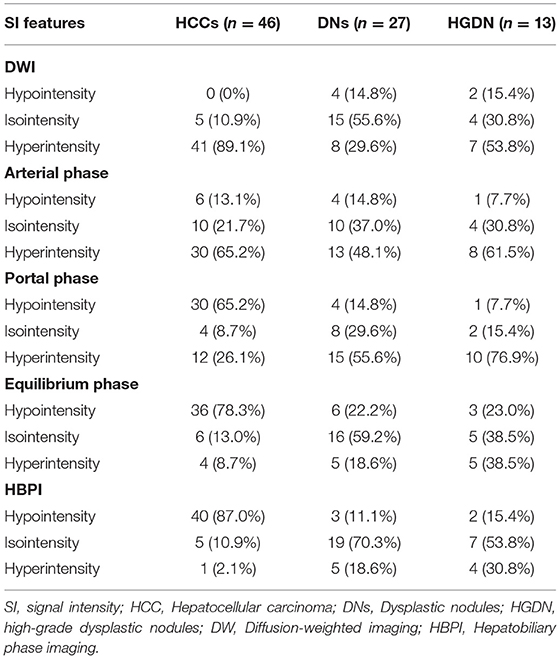
Table 3. Signal features of hepatocellular nodules.
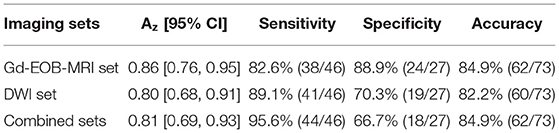
Table 4. Diagnostic performance of DW and gadoxetic acid-enhanced imaging.
In Gd-EOB-MRI set, among the 46 sHCCs, 50% (23/46) of lesions showed typical enhancement patterns (Figure 3): 13 lesions showed arterial enhancement without late washout but hypointensity on HBP images (Supplementary Figure 1), 2 nodules showed hypovascular on dynamic study, but larger than 1.5 cm and showed hypointensity on HBP images (Figure 4), and the other 8 nodules satisfied none of the Gd-EOB-MRI criteria for HCC (Supplementary Figure 2). Of the 27 DNs, no nodule showed atypical enhancement patterns, 24 nodules (11 HGDNs, 13 LGDNs) showed iso/hyperintensity on HBP images (Figure 5), and 3 lesions (2 HGDNs, 1 LGDN) showed arterial enhancement and hypointensity on HBP images. The sensitivity and specificity for differentiating sHCCs from DNs in Gd-EOB-MRI set were 82.6% (38/46) and 88.9% (24/27), respectively.
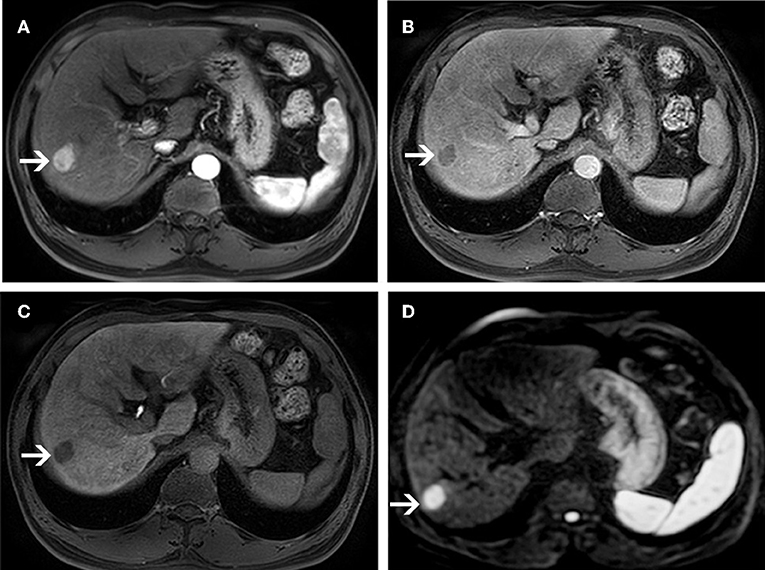
Figure 3. MR images of a 58-year-old man with a pathologically proven HCC (white arrows) and a history of hepatitis B virus infection. An arterial-phase image (A) shows an enhancing nodule in segment VI of the liver. An equilibrium phase MR image (B) shows a nodule demonstrating washout of contrast material, and showing capsular appearance. At the hepatobiliary phase (C), the lesion is hypointensity compared to the surrounding liver parenchyma. On diffusion-weighted image (D), the lesion is hyperintensity compared to the surrounding liver parenchyma.
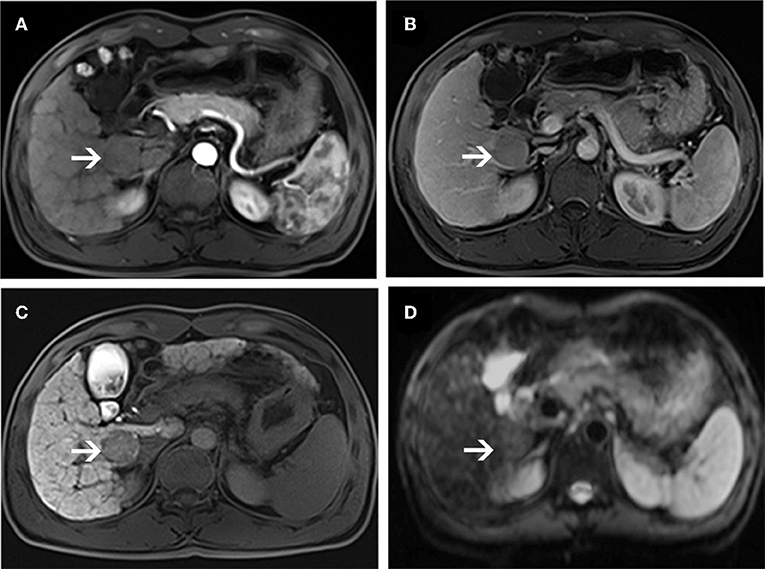
Figure 4. MR images of a 66-year-old woman with a pathologically proven HCC (white arrows) and a history of hepatitis C virus infection. An arterial-phase image (A) shows a hypovascular nodule in segment I of the liver. An equilibrium phase MR image (B) shows a slightly hypointensity nodule compared to the surrounding liver parenchyma. A hepatobiliary phase image (C) shows a hypointensity lesion compared to the surrounding liver parenchyma. On diffusion-weighted image (D), the lesion is nearly isointensity compared to the surrounding liver parenchyma.
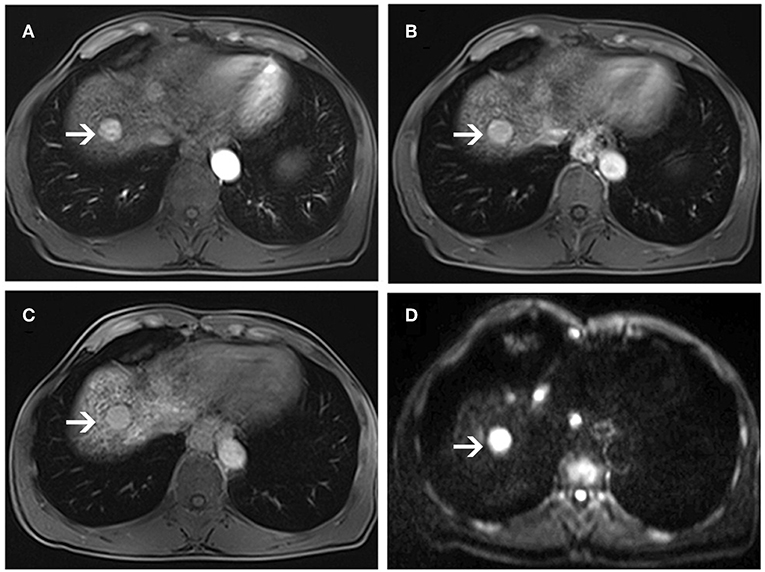
Figure 5. MR images of a 56-year-old man with a pathologically proven high-grade dysplastic nodule (white arrows) and a history of hepatitis B virus infection. Arterial-phase image (A) shows an enhancing nodule in segment VIII of the liver. Equilibrium-phase MR image (B) shows a nodule not demonstrating washout of the contrast material. A hepatobiliary phase image (C) shows nearly isointensity compared to the surrounding liver parenchyma. On diffusion-weighted image (D), the lesion shows hyperintensity compared to the surrounding liver parenchyma.
In DWI set, 41 nodules among the 46 sHCCs showed hyperintensity on DWI (Figure 3), and 5 nodules showed iso/hypointensity on DWI (Figure 4). Of the 27 DNs, 19 nodules (6 HGDNs, 13 LGDNs) showed iso/hypointensity on DWI (Supplementary Figure 3), and 8 nodules (6 HGDNs, 2 LGDNs) showed hyperintensity on DWI (Figure 5). The sensitivity and specificity for identifying sHCCs from DNs in DWI set were 89.1% (41/46) and 70.3% (19/27), respectively.
In combined sets, of the 46 sHCCs, only 2 nodules were mistaken for DNs. Among the 27 DNs, 18 nodules (7 HGDNs, 11 LGDNs) were diagnosed accurately. Consequently, the sensitivity and specificity for differentiating sHCCs from DNs in combined sets was 95.6% (44/46) and 66.7% (18/27), respectively.
TA Results
Texture subsets based on MI and Fisher coefficients were frequently derived from the co-occurrence matrix, whereas texture features created using the POE + ACC method were frequently derived from wavelet (Table 5).
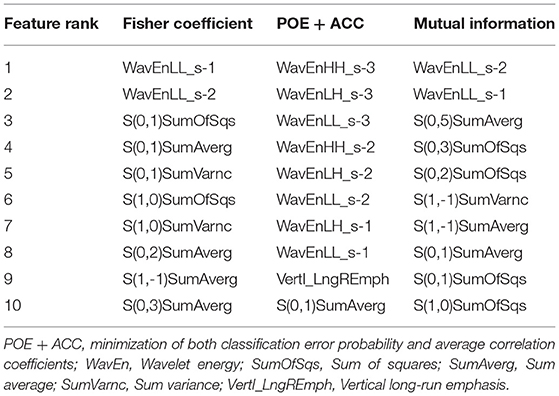
Table 5. Texture feature subsets best-suited for the discrimination of w-HCCs and DNs on T2-W images, according to Fisher coefficient, the PEO+ACC, and Mutual information.
Fisher coefficients, POE + ACC, and MI methods resulted in a similar misclassification rate of 4.1–6.8, 4.1–6.8, and 4.1–5.5%, respectively (Table 6). In terms of feature classification, PCA and LDA resulted in an equivalent misclassification rate of 4.1–6.8 and 4.1–5.5%, respectively (Table 6).
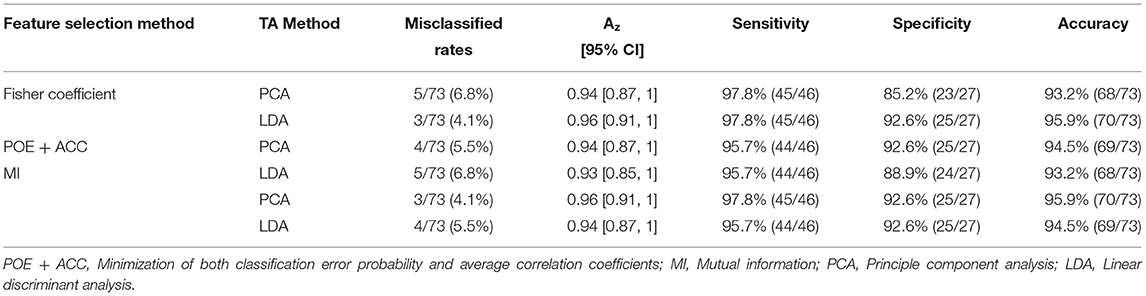
Table 6. Diagnostic performance of texture analysis.
Both LDA combining Fisher coefficients and PCA combining MI Fisher showed the lowest misclassification rate of 4.1% (3/73). Only one HCC was misclassified as a DN, and two DNs were misclassified as HCCs (Figures 6A,B). With regard to the ROC analysis, TA demonstrated an Az, sensitivity, specificity, and accuracy of 0.96 (95% CI: 0.91, 1), 97.8% (45/46), 92.6% (25/27), and 95.9% (70/73), respectively (Table 5).
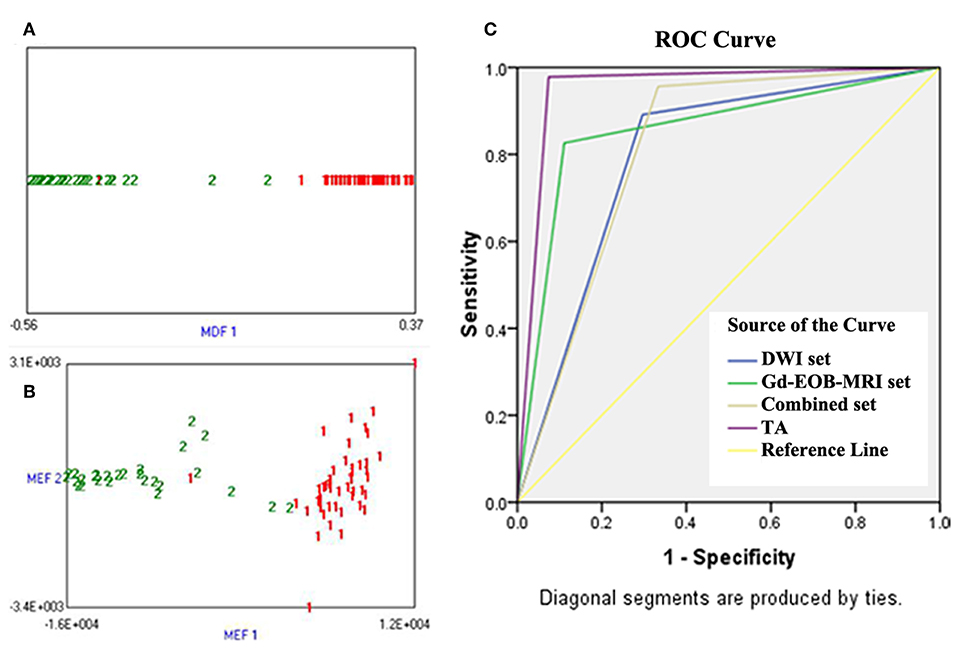
Figure 6. (A) Linear discriminant analysis (LDA) combining Fisher coefficient for classifying small hepatocellular carcinoma (sHCC) and dysplastic nodules (DNs), 1 (red) represents sHCC and 2 (green) represents DNs; it shows that one sHCC was misclassified as a DN, and two DNs were misclassified as sHCC. (B) Principal component analysis (PCA) combining MI for classifying sHCC and DNs, 1 (red) represents sHCC and 2 (green) represents DNs; it shows that one sHCC was misclassified as a DN, and two DNs were misclassified as sHCC. (C) Receiver operating characteristic (ROC) curves of imaging sets and TA for the differentiation of sHCC from DNs, the ROC curves were plotted based on the dichotomous classification results of each diagnostic approach, and the diagonal segments are produced by ties. The position of the “kink” of curves represented diagnostic efficacy; Y-axis represented sensitivity, and X-axis represented 1-specificity.
Comparison of Diagnostic Performance
The ROC curve of each diagnostic method is shown in Figure 6C. The diagnostic performance of TA (Az = 0.96, 95% CI: 0.91, 1) was significantly higher than that of imaging diagnosis with DWI (Az = 0.80, 95% CI: 0.68, 0.91) or Gd-EOB-MRI (Az = 0.86, 95% CI: 0.76, 0.95) alone (P = 0.008 and 0.025, respectively). The specificity of TA (92.6%) was significantly higher than that of DWI and Gd-EOB-MRI combined (66.7%) (P < 0.001), but no significant difference was observed in sensitivity (97.8 vs. 95.6%; P = 0.559).
Discussion
This study aimed to identify whether MRI-based TA can be used to distinguish sHCC from DNs in cirrhotic liver. We also compared the performance of TA with DWI and Gd-EOB-MRI. The findings showed that TA-based T2WI had a satisfactory diagnostic value. The diagnostic efficacy of TA was significantly higher than that of qualitative diagnosis with DWI or Gd-EOB-MRI alone. Although the combination of DWI and Gd-EOB-MRI showed sensitivity equivalent to that of TA, TA showed significantly higher specificity than that of the combination qualitative diagnosis.
In the present study, we found that only 50% of sHCCs fit the American Association for the Study of Liver Diseases criteria, but HBP imaging improved the detection of sHCC; up to 15 sHCCs with atypical enhancement were detected by hypointensity on HBP images. In Gd-EOB-MRI set, the sensitivity and specificity were 82.6 and 88.9%, respectively, which is similar to the 85% sensitivity but significantly higher than the 42% specificity on imaging using gadoxetic acid disodium (14), and is similar to the 92% specificity but higher than the 71% sensitivity on imaging using gadobenate dimeglumine (30). Furthermore, Gd-EOB-MRI yields a better specificity than that of DWI set, with a specificity 18.6% greater than that of DWI, which is inconsistent with one study (14) in which Gd-EOB-MRI showed lower specificity than DWI for differentiating HCC from benign hepatic nodules. Nevertheless, we still found that 13.4% of sHCCs did not show hypointensity on 20-mine HBP images, which may be related to the overexpression of organic anionic transporting polypeptide 8 (OATP-8) in tumors; about 5–12% of small HCCs overexpress organic anionic transporting polypeptide 8 (18).
In DWI set, we found that the overall sensitivity in the identification of sHCCs and DNs was almost 89.1%, which was supported by previous reports showing that 81–88% of sHCCs showed hyperintensity on DW images (14, 31). Nevertheless, our study showed a relatively low specificity of 70.3% compared with some previous studies that reported specificity values of 79.0–94.4% (32, 33), which may be attributed to six HGDNs that showed some imaging features supporting HCC, such as hyperintensity on arterial phase without washout, hypointensity on HBP images, and/or hyperintensity on DWI.
In our study, the combination DW and Gd-EOB-MRI demonstrated an increase in the sensitivity for diagnosing sHCC compared with each imaging modality alone. Thus, the results are concordant with the previous data reported by Park et al. (34). However, our study resulted in a lower specificity of only 66.7%. Other than the expected variation between observers and institutions, the difference might be attributable to the fact that the benign hepatic nodules included in our study were all DNs.
The feasibility of TA in the classification of liver lesions has been widely discussed in CT and MRI (22, 23, 25, 35, 36). It is well-known that ROI placement plays a key role for TA; if a lesion shows isointensity, it may be difficult to place an ROI accurately. In this study, relatively large number of liver nodules showed isointensity on both DWI and dynamic Gd-EOB-MRI. Thus, this study analyzed the value of TA based on T2W-MRI images in discrimination of sHCC from DNs in cirrhosis. To our knowledge, this is the first study to assess whether HCCs and DNs in cirrhosis can be fully classified using TA. In comparison with previous studies that used T2WI-based TA for classification of liver lesions, the misclassification rate by TA was 4.1%, which was lower than the 9.7% misclassification rate for distinguishing HCC from hepatic hemangioma and metastases (22) and the 12% misclassification rate for distinguishing liver cysts and hemangiomas (23). Furthermore, the primary advantage of our study was that we compared the diagnostic efficacy of TA with imaging diagnosis and found that TA showed better performance than that shown by imaging diagnosis with DW and gadoxetic acid-enhanced imaging alone. Although combined imaging strategy showed similar sensitivity as TA (95.6 vs. 97.8%) for identification of sHCC and DNs, the specificity of TA (92.6%) was significantly higher than that of the combined approach (63.0%).
In terms of misclassification rates, the performances of these feature selection methods (Fisher, POE + ACC, or MI) showed no clear superiority, supporting the results of previous studies (20, 23). For the MI and Fisher methods, the texture parameters resulting from the co-occurrence matrix were more frequently assigned to the feature subsets than parameters of any other category, thus supporting findings of previous studies. Interestingly, for POE + ACC selection, texture parameters resulting from the wavelet were more frequently assigned to the feature subsets than parameters of any other category.
This study had some limitations. First, we could not divide the study population into training and test datasets due to the relatively small size and because we were primarily interested in the feasibility of texture-based classification for identification of sHCCs and DNs in cirrhosis. Second, we did not assess the lesions that were not detected on MRI because the TA and imaging diagnosis is quite difficult to perform in those lesions, so it might cause the possibility of a bias at inclusion. Third, the performance of TA combined with qualitative diagnosis was not assessed because TA has showed significantly higher performance than qualitative imaging diagnosis. Actually, the combination of TA and qualitative diagnosis may improve performance, and it needs further researches to confirm the additional value of combination diagnosis.
In conclusion, this preliminary study demonstrates that MRI-based TA shows better classification performance than imaging diagnosis for discriminating sHCC from DNs in cirrhotic liver. Although promising, these results are preliminary and require verification using a larger and independent dataset to appraise their potential for clinical translation. After validation, texture-based MRI may become a potential imaging biomarker for early differentiating HCCs from DNs in cirrhosis.
Data Availability Statement
All datasets generated for this study are included in the article/Supplementary Material.
Ethics Statement
This retrospective study was approved by the institutional review board at Affiliated Cancer Hospital & Institute of Guangzhou Medical University, and the requirement of patients' informed consent was waived.
Author Contributions
XZ and JL: conception and design. XZ and HT: manuscript writing. JY, JP, and PY: provision of study materials or patients. JY and JP: collection and assembly of data. BL and JL: MRI analysis and interpretation. XZ and HT: statistical analysis. XZ and JL: final approval of manuscript.
Conflict of Interest
The authors declare that the research was conducted in the absence of any commercial or financial relationships that could be construed as a potential conflict of interest.
Supplementary Material
The Supplementary Material for this article can be found online at: https://www.frontiersin.org/articles/10.3389/fonc.2019.01382/full#supplementary-material
References
1. El-Serag HB, Davila JA, Petersen NJ, McGlynn KA. The continuing increase in the incidence of hepatocellular carcinoma in the United States: an update. Ann Intern Med. (2003) 139:817–23. doi: 10.7326/0003-4819-139-10-200311180-00009
2. McGlynn KA, London WT. Epidemiology and natural history of hepatocellular carcinoma. Best Pract Res Clin Gastroenterol. (2005) 19:3–23. doi: 10.1016/j.bpg.2004.10.004
3. Choi BI, Takayasu K, Han MC. Small hepatocellular carcinomas and associated nodular lesions of the liver: pathology, pathogenesis, and imaging findings. AJR Am J Roentgenol. (1993) 160:1177–87. doi: 10.2214/ajr.160.6.8388618
4. Mazzaferro V, Regalia E, Doci R, Andreola S, Pulvirenti A, Bozzetti F, et al. Liver transplantation for the treatment of small hepatocellular carcinomas in patients with cirrhosis. N Engl J Med. (1996) 334:693–9. doi: 10.1056/NEJM199603143341104
5. Di Martino M, Anzidei M, Zaccagna F, Saba L, Bosco S, Rossi M, et al. Qualitative analysis of small (< / = 2 cm) regenerative nodules, dysplastic nodules and well-differentiated HCCs with gadoxetic acid MRI. BMC Med Imaging. (2016) 16:62. doi: 10.1186/s12880-016-0165-5
6. Park HJ, Choi BI, Lee ES, Park SB, Lee JB. How to differentiate borderline hepatic nodules in hepatocarcinogenesis: emphasis on imaging diagnosis. Liver Cancer. (2017) 6:189–203. doi: 10.1159/000455949
7. Bruix J, Sherman M. Management of hepatocellular carcinoma: an update. Hepatology. (2011) 53:1020–2. doi: 10.1002/hep.24199
8. Jang HJ, Kim TK, Burns PN, Wilson SR. Enhancement patterns of hepatocellular carcinoma at contrast-enhanced US: comparison with histologic differentiation. Radiology. (2007) 244:898–906. doi: 10.1148/radiol.2443061520
9. Li CS, Chen RC, Tu HY, Shih LS, Zhang TA, Lii JM, et al. Imaging well-differentiated hepatocellular carcinoma with dynamic triple-phase helical computed tomography. Br J Radiol. (2006) 79:659–65. doi: 10.1259/bjr/12699987
10. Park MS, Kim S, Patel J, Hajdu CH, Do RK, Mannelli L, et al. Hepatocellular carcinoma: detection with diffusion-weighted versus contrast-enhanced magnetic resonance imaging in pretransplant patients. Hepatology. (2012) 56:140–8. doi: 10.1002/hep.25681
11. Vandecaveye V, De Keyzer F, Verslype C, Op de Beeck K, Komuta M, Topal B, et al. Diffusion-weighted MRI provides additional value to conventional dynamic contrast-enhanced MRI for detection of hepatocellular carcinoma. Eur Radiol. (2009) 19:2456–66. doi: 10.1007/s00330-009-1431-5
12. Taouli B, Koh DM. Diffusion-weighted MR imaging of the liver. Radiology. (2010) 254:47–66. doi: 10.1148/radiol.09090021
13. Kim YK, Kim CS, Han YM, Lee YH. Detection of liver malignancy with gadoxetic acid-enhanced MRI: is addition of diffusion-weighted MRI beneficial? Clin Radiol. (2011) 66:489–96. doi: 10.1016/j.crad.2010.09.007
14. Lee MH, Kim SH, Park MJ, Park CK, Rhim H. Gadoxetic acid-enhanced hepatobiliary phase MRI and high-b-value diffusion-weighted imaging to distinguish well-differentiated hepatocellular carcinomas from benign nodules in patients with chronic liver disease. AJR Am J Roentgenol. (2011) 197:W868–75. doi: 10.2214/AJR.10.6237
15. Ahn SS, Kim MJ, Lim JS, Hong HS, Chung YE, Choi JY. Added value of gadoxetic acid-enhanced hepatobiliary phase MR imaging in the diagnosis of hepatocellular carcinoma. Radiology. (2010) 255:459–66. doi: 10.1148/radiol.10091388
16. Kawada N, Ohkawa K, Tanaka S, Matsunaga T, Uehara H, Ioka T, et al. Improved diagnosis of well-differentiated hepatocellular carcinoma with gadolinium ethoxybenzyl diethylene triamine pentaacetic acid-enhanced magnetic resonance imaging and Sonazoid contrast-enhanced ultrasonography. Hepatol Res. (2010) 40:930–6. doi: 10.1111/j.1872-034X.2010.00697.x
17. Kogita S, Imai Y, Okada M, Kim T, Onishi H, Takamura M, et al. Gd-EOB-DTPA-enhanced magnetic resonance images of hepatocellular carcinoma: correlation with histological grading and portal blood flow. Eur Radiol. (2010) 20:2405–13. doi: 10.1007/s00330-010-1812-9
18. Kitao A, Matsui O, Yoneda N, Kozaka K, Shinmura R, Koda W, et al. The uptake transporter OATP8 expression decreases during multistep hepatocarcinogenesis: correlation with gadoxetic acid enhanced MR imaging. Eur Radiol. (2011) 21:2056–66. doi: 10.1007/s00330-011-2165-8
19. Castellano G, Bonilha L, Li LM, Cendes F. Texture analysis of medical images. Clin Radiol. (2004) 59:1061–9. doi: 10.1016/j.crad.2004.07.008
20. Holli K, Laaperi AL, Harrison L, Luukkaala T, Toivonen T, Ryymin P, et al. Characterization of breast cancer types by texture analysis of magnetic resonance images. Acad Radiol. (2010) 17:135–41. doi: 10.1016/j.acra.2009.08.012
21. Wibmer A, Hricak H, Gondo T, Matsumoto K, Veeraraghavan H, Fehr D, et al. Haralick texture analysis of prostate MRI: utility for differentiating non-cancerous prostate from prostate cancer and differentiating prostate cancers with different Gleason scores. Eur Radiol. (2015) 25:2840–50. doi: 10.1007/s00330-015-3701-8
22. Li Z, Mao Y, Huang W, Li H, Zhu J, Li W, et al. Texture-based classification of different single liver lesion based on SPAIR T2W MRI images. BMC Med Imaging. (2017) 17:42. doi: 10.1186/s12880-017-0212-x
23. Mayerhoefer ME, Schima W, Trattnig S, Pinker K, Berger-Kulemann V, Ba-Ssalamah A. Texture-based classification of focal liver lesions on MRI at 3.0 Tesla: a feasibility study in cysts and hemangiomas. J Magn Reson Imaging. (2010) 32:352–9. doi: 10.1002/jmri.22268
24. Jirak D, Dezortova M, Taimr P, Hajek M. Texture analysis of human liver. J Magn Reson Imaging. (2002) 15:68–74. doi: 10.1002/jmri.10042
25. Zhou W, Zhang L, Wang K, Chen S, Wang G, Liu Z, et al. Malignancy characterization of hepatocellular carcinomas based on texture analysis of contrast-enhanced MR images. J Magn Reson Imaging. (2017) 45:1476–84. doi: 10.1002/jmri.25454
26. Choi SH, Lee JM, Yu NC, Suh KS, Jang JJ, Kim SH, et al. Hepatocellular carcinoma in liver transplantation candidates: detection with gadobenate dimeglumine-enhanced MRI. AJR Am J Roentgenol. (2008) 191:529–36. doi: 10.2214/AJR.07.2565
27. Abbasian Ardakani A, Gharbali A, Saniei Y, Mosarrezaii A, Nazarbaghi S. Application of texture analysis in diagnosis of multiple sclerosis by magnetic resonance imaging. Glob J Health Sci. (2015) 7:68–78. doi: 10.5539/gjhs.v7n6p68
28. International Working Party. Terminology of nodular hepatocellular lesions. Hepatology. (1995) 22:983–93 doi: 10.1016/0270-9139(95)90324-0
29. International Consensus Group for Hepatocellular Neoplasia The International Consensus Group for Hepatocellular Neoplasia. Pathologic diagnosis of early hepatocellular carcinoma: a report of the international consensus group for hepatocellular neoplasia. Hepatology. (2009) 49:658–64. doi: 10.1002/hep.22709
30. Kim JI, Lee JM, Choi JY, Kim YK, Kim SH, Lee JY, et al. The value of gadobenate dimeglumine-enhanced delayed phase MR imaging for characterization of hepatocellular nodules in the cirrhotic liver. Invest Radiol. (2008) 43:202–10. doi: 10.1097/RLI.0b013e31815d6929
31. Nasu K, Kuroki Y, Tsukamoto T, Nakajima H, Mori K, Minami M. Diffusion-weighted imaging of surgically resected hepatocellular carcinoma: imaging characteristics and relationship among signal intensity, apparent diffusion coefficient, and histopathologic grade. AJR Am J Roentgenol. (2009) 193:438–44. doi: 10.2214/AJR.08.1424
32. Xu PJ, Yan FH, Wang JH, Shan Y, Ji Y, Chen CZ. Contribution of diffusion-weighted magnetic resonance imaging in the characterization of hepatocellular carcinomas and dysplastic nodules in cirrhotic liver. J Comput Assist Tomogr. (2010) 34:506–12. doi: 10.1097/RCT.0b013e3181da3671
33. Shin SK, Kim YS, Choi SJ, Shim YS, Jung DH, Kwon OS, et al. Characterization of small (< / = 3 cm) hepatic lesions with atypical enhancement feature and hypointensity in hepatobiliary phase of gadoxetic acid-enhanced MRI in cirrhosis: a STARD-compliant article. Medicine. (2017) 96:e7278. doi: 10.1097/MD.0000000000007278
34. Park MJ, Kim YK, Lee MW, Lee WJ, Kim YS, Kim SH, et al. Small hepatocellular carcinomas: improved sensitivity by combining gadoxetic acid-enhanced and diffusion-weighted MR imaging patterns. Radiology. (2012) 264:761–70. doi: 10.1148/radiol.12112517
35. Raman SP, Schroeder JL, Huang P, Chen Y, Coquia SF, Kawamoto S, et al. Preliminary data using computed tomography texture analysis for the classification of hypervascular liver lesions: generation of a predictive model on the basis of quantitative spatial frequency measurements–a work in progress. J Comput Assist Tomogr. (2015) 39:383–95. doi: 10.1097/RCT.0000000000000217
Keywords: hepatocellular carcinoma, liver cirrhosis, diffusion magnetic resonance imaging, gadoxetic acid, texture analysis
Citation: Zhong X, Tang H, Lu B, You J, Piao J, Yang P and Li J (2020) Differentiation of Small Hepatocellular Carcinoma From Dysplastic Nodules in Cirrhotic Liver: Texture Analysis Based on MRI Improved Performance in Comparison Over Gadoxetic Acid-Enhanced MR and Diffusion-Weighted Imaging. Front. Oncol. 9:1382. doi: 10.3389/fonc.2019.01382
Received: 23 May 2019; Accepted: 22 November 2019;
Published: 10 January 2020.
Edited by:
Xuelei Ma, Sichuan University, ChinaReviewed by:
Andre Bongers, University of New South Wales, AustraliaGuolin Ma, China-Japan Friendship Hospital, China
Copyright © 2020 Zhong, Tang, Lu, You, Piao, Yang and Li. This is an open-access article distributed under the terms of the Creative Commons Attribution License (CC BY). The use, distribution or reproduction in other forums is permitted, provided the original author(s) and the copyright owner(s) are credited and that the original publication in this journal is cited, in accordance with accepted academic practice. No use, distribution or reproduction is permitted which does not comply with these terms.
*Correspondence: Jiansheng Li, bGlqaWFuc2hlbmdAZ3pobXUuZWR1LmNu
†These authors have contributed equally to this work