 Manuela Ceccarelli
 Giorgio D'Andrea
 Laura Micheli
 Felice Tirone
- Institute of Biochemistry and Cell Biology, National Research Council (IBBC-CNR), Rome, Italy
About 30% of medulloblastomas (MBs), a tumor of the cerebellum, arise from cerebellar granule cell precursors (GCPs) undergoing transformation following activation of the Sonic hedgehog (Shh) pathway. To study this process, we generated a new MB model by crossing Patched1 heterozygous (Ptch1+/−) mice, which develop spontaneous Shh-type MBs, with mice lacking B-cell translocation gene 1 (Btg1), a regulator of cerebellar development. In MBs developing in Ptch1+/− mice, deletion of Btg1 does not alter tumor and lesion frequencies, nor affect the proliferation of neoplastic precursor cells. However, in both tumors and lesions arising in Ptch1+/− mice, ablation of Btg1 increases by about 25% the apoptotic neoplastic precursor cells, as judged by positivity to activated caspase-3. Moreover, although Btg1 ablation in early postnatal GCPs, developing in the external granule cell layer, leads to a significant increase of proliferation, and decrease of differentiation, relative to wild-type, no synergy occurs with the Ptch1+/− mutation. However, Btg1 deletion greatly increases apoptosis in postnatal GCPs, with strong synergy between Btg1-null and Ptch1+/− mutations. That pronounced increase of apoptosis observed in Ptch1+/−/Btg1 knockout young or neoplastic GCPs may be responsible for the lack of effect of Btg1 ablation on tumorigenesis. This increased apoptosis may be a consequence of increased expression of protein arginine methyltransferase 1 (Prmt1) protein that we observe in Btg1 knockout/Ptch1+/− MBs. In fact, apoptotic genes, such as BAD, are targets of Prmt1. Moreover, in Btg1-null MBs, we observed a two-fold increase of cells positive to CD15, which labels tumor stem cells, raising the possibility of activation of quiescent tumor cells, known for their role in long-term resistance to treatment and relapses. Thus, Btg1 appears to play a role in cerebellar tumorigenesis by regulating the balance between apoptosis and proliferation during MB development, also influencing the number of tumor stem cells.
Introduction
B-cell translocation gene 1 (Btg1) belongs to the Btg/Tob gene family, comprising six genes endowed with antiproliferative properties; it shares about 65% homology with the founding member of this gene family PC3TIS21/BTG2 (1, 2).
Btg1 encodes a regulatory cofactor, which interacts with various cellular targets and modulates their activity. These molecular partners include the protein arginine methyltransferase 1 (PRMT1) (3), the transcription factor HoxB9 (4), several nuclear receptors and transcription factors involved in the myoblast differentiation (5), and the Ccr4-associated factor 1 (CAF1), subunit of the CCR4–NOT complex (6). The Btg1 protein functions as a cell cycle inhibitor, with a range of effects on various cellular processes, such as proliferation, differentiation, and apoptosis, in multiple cell types. Btg1 negatively regulates cell proliferation in several cell types, such as NIH3T3 murine fibroblasts (1), macrophages (7), erythroid colonies (8), microglia (9), myoblasts (10), and brain cells (see below) (11, 12). Such a growth arrest may be accompanied by increased apoptotic frequency, as seen in NIH3T3 cells (13) and in microglia (9), or, more frequently, by stimulation of terminal differentiation, as in myoblasts (10) and in erythroid progenitors (8).
Genetic aberrations in Btg1 are common in B-cell malignancies (14), but this gene is also implicated in different types of solid tumors. In fact, deregulated expression of Btg1 is involved in gastric (15), kidney (16), liver (17), thyroid (18), nasopharyngeal (19), ovarian (20), breast (21, 22), and non-small-cell lung cancers (23), and is frequently associated with disease severity. Notably, although Btg1 is expressed in the developing and adult brain (11, 24–26), its involvement in brain tumors has been investigated only in gliomas (27, 28).
In the adult neurogenic niches, i.e., the dentate gyrus of the hippocampus and the subventricular zone, Btg1 is required for the physiological maintenance of the stem/progenitor cells quiescence and self-renewal (11, 29). In the cerebellum, Btg1 negatively controls the proliferation of the cerebellar granule cell precursors (GCPs), playing a critical role for cerebellar development and function (12). In this report, we tested whether Btg1 is also involved in tumorigenesis of the cerebellum.
During postnatal cerebellar morphogenesis, the GCPs intensely proliferate at the surface of the cerebellar primordia to form the external granule layer (EGL): this transient amplification—which in the mouse continues until the second week after birth—is triggered by the diffusible factor Sonic hedgehog (Shh), secreted by the neighboring Purkinje neurons (30–32). Once post-mitotic, the GCPs migrate inward to the molecular and internal granule layers (ML and IGL, respectively) and differentiate in mature granule neurons (33, 34). Thus, a misregulation in these processes may prolong and/or affect the mitotic activity of GCPs at the cerebellar surface, and promote cellular transformation (35), with consequent formation of medulloblastoma (MB). MB is the most common childhood brain tumor and arises in about 30% of cases from GCPs (36–39).
A recent study by us demonstrated that, during the development of the cerebellum, Btg1 is required for the negative control of GCP proliferation, with secondary effects on cellular differentiation, survival, and migration—the latter being essentially dependent on the family-related gene PC3TIS21/BTG2 (12). The cell cycle control by Btg1 takes place at the G1/S transition, by selective regulation of cyclin D1. We found that in mice, Btg1 ablation causes hyperproliferation of GCPs and increase of EGL thickness, which remains hyperplastic for a longer period, instead of being progressively reduced. Moreover, we observed in vitro that the overexpression of Btg1 is able to inhibit the proliferation of the MB cell line DAOY (12), thus highlighting Btg1 as an MB suppressor and as an obvious candidate for MB pathogenesis.
Furthermore, the family-related gene PC3TIS21/BTG2 is an MB suppressor, as its overexpression inhibits the proliferation and facilitates the differentiation of neoplastic GCPs (40, 41). In fact, we found that in a mouse model of spontaneous MB, PC3TIS21/BTG2 deletion causes a great increase of tumor frequency due to a deficit of GCP migration (42, 43).
Thus, in this study, we tested if the loss of the Btg1-dependent control of GCP proliferation is able to increase the spontaneous tumor incidence in an Shh-MB model, crossing Btg1 knockout mice to Patched1 heterozygous (Ptch1+/−) mice.
Surprisingly, we found that genetic ablation of Btg1 in Ptch1+/− mice does not result in an enhancement of the MB frequency, neither in the preneoplastic stages nor in the established tumors, as it does not affect the proliferation of neoplastic GCPs but significantly increases their apoptosis. This induction of apoptosis in Btg1-null GCPs, also observed during cerebellar development, could be due to an increase in Prmt1-mediated arginine methylation of Bcl-2 antagonist of cell death (BAD), which is known to inhibit Akt-dependent BAD phosphorylation, thus promoting its mitochondrial localization and leading to an increase of apoptosis (44). Interestingly, in MBs, the augmented cell death could make a selection of quiescent CD15+ tumor stem cells, which are increased in MBs lacking the Btg1 gene.
Materials and Methods
Mouse Lines
Ptch1+/− mice were obtained in CD1 background through ablation of exons 6 and 7 (45). The Btg1 knockout mice were generated in the C57BL/6 strain by replacing the exon I of the gene with the neomycin resistance cassette, as previously described (11).
The crossing of Ptch1+/− with Btg1−/− mice generated Ptch1/Btg1 double-mutant mice, which were interbred for at least six generations to obtain an isogenic progeny of the different genotypes under study. To identify the preneoplastic lesions, Ptch1/Btg1 double-mutant mice were crossed with Math1-GFP transgenic mice, which express the green fluorescent protein (GFP) driven by the Math1 enhancer in proliferating GCPs (46, 47), kindly provided by Jane Johnson (UT Southwestern Medical School, Dallas, TX, USA); the Ptch1/Btg1/Math1-GFP mice were then interbred four or more times before starting any analysis.
The Ptch1/Btg1 pups were routinely genotyped by PCR analysis using genomic DNA extracted from tail tips, as described (12, 40, 42, 45); the mice which carry the transgene Math1-GFP have been previously identified using a “GFP flashlight” (Nightsea) that made the GFP+ pups glow.
All animal experiments were performed with mice of both sexes, in accordance with the current European Ethical Committee guidelines (directive 2010/63/EU) and with the protocol approved by the Italian Ministry of Health (authorization 193/2015-PR).
Treatment of Mice and Sample Preparation
Mice were observed daily for MB formation for 12 months after birth. On the appearance of tumor symptoms, such as head doming, ruffling of fur, hunched posture, impaired balance, severe weight loss, posterior paralysis, or lethargy, they were euthanized under anesthesia and autopsied. MBs were either snap frozen in liquid nitrogen for analyses of mRNAs and proteins or fixed in 4% paraformaldehyde (PFA) in phosphate buffered saline (PBS) by overnight immersion.
For quantification of the lesions, asymptomatic Ptch1+/−/Btg1+/+/Math1-GFP+ and Ptch1+/−/Btg1−/−/Math1-GFP+ mice were killed at different times (2 or 6 weeks of age), and their cerebella were fixed by immersion overnight in 4% PFA in PBS. For the EGL studies, cerebella of postnatal day 7 (P7) mice were dissected out and kept overnight in 4% PFA in PBS.
The mice at P7, 2 and 6 weeks of age were intraperitoneally injected with 5-bromo-2′-deoxyuridine (BrdU) (95 mg/kg; Sigma Aldrich, St. Louis, MO, USA) 1 h before sacrifice to visualize the GCPs entering in S-phase, according to existing protocols (48, 49).
All the samples (with the exception of MBs employed for analyses of mRNAs and proteins) were cryoprotected in 30% sucrose in PBS and frozen at −80°C until use.
Immunohistochemistry
Samples were embedded in Tissue-Tek OCT (Sakura Finetek, Torrance, CA, USA) and cut in free-floating 40-μm-thick sagittal sections at −25°C on a rotary cryostat.
To detect the BrdU incorporated into cellular DNA during cell proliferation, the sections were treated with 2N HCl for 45 min at 37°C to denature the nucleic acid, then with 0.1 M sodium borate buffer, pH 8.5, for 10 min. All the slices were permeabilized with 0.3% Triton X-100 in PBS and incubated overnight at 4°C with primary antibodies diluted in 3% normal donkey serum in PBS. The following primary antibodies were used: rat monoclonal antibody against BrdU (AbD Serotech, Raleigh, NC, USA; MCA2060; 1:400); rabbit monoclonal antibody against Ki67 (LabVision Corporation, Fremont, CA; clone SP6; 1:150); rabbit polyclonal antibody against cleaved (activated) caspase-3 (Cell Signaling Technology, Danvers, MA, USA; 9661; 1:100); mouse monoclonal antibodies raised against NeuN (Millipore, Temecula, CA, USA; MAB377; 1:300) or CD15 (Santa Cruz Biotechnology, Santa Cruz, CA, USA; sc-19648; 1:100); goat polyclonal antibody against NeuroD1 (R&D Systems, Minneapolis, MN, USA; AF2746; 1:200). To visualize the antigens, the samples were reacted with the appropriate secondary antibodies, all from Jackson ImmunoResearch (West Grove, PA, USA; 1:200): a donkey anti-rat TRITC-conjugated (BrdU), a donkey anti-rabbit Cy3-conjugated (Ki67, caspase-3), a donkey anti-mouse TRITC-conjugated (CD15) or conjugated to Alexa-488 (NeuN), a donkey anti-goat Cy3-conjugated (NeuroD1).
The samples were counterstained by Hoechst 33258 (Sigma-Aldrich; 1 mg/ml in PBS) to visualize the nuclei.
Digital images of the immunostained sections were collected with a TCS SP5 confocal laser scanning microscope (Leica Microsystems, Wetzlar, Germany). The CD15 immunolabeled MB slices were examined with an Olympus FV1200 laser scanning confocal microscope using a PlanApoN 60× Oil SC (NA = 1.40) Olympus objective. All the digital pictures were analyzed by the IAS software (Delta Sistemi, Rome, Italy).
Quantification of Lesions and Cell Numbers
To evaluate the presence of preneoplastic lesions in mice of 2 or 6 weeks of age, we have examined for each cerebellum 12 sections, at 400 μm of distance, in order to allow a representative sampling. The lesions were identified by visualizing the GFP-positive GCPs.
The images of the lesions in cerebellar sagittal sections (Figures 2A,B) were obtained by an Olympus Optical (Tokyo, Japan) BX53 fluorescence microscope connected to a Spot RT3 camera (Diagnostic Instruments Inc., Sterling Heights, MI, USA).
BrdU+ or cleaved caspase-3+ cells in lesions were counted in the whole lesion area on at least five non-adjacent midsagittal sections per lesion. Planimetric measurements of lesion area were performed for the total extension of the lesion in each photomicrograph field by tracing the outline of the whole lesion on the digital picture and were measured with the IAS software. We analyzed the lesions present in all lesioned mice whose number for each genotype and time point is indicated in Figure 2C.
The proliferating (BrdU+), differentiating (NeuroD1+ or NeuN+), and apoptotic (cleaved caspase-3+) cells in the EGL of mice at P7 were measured on at least five non-adjacent midsagittal sections per mouse at the midpoint of the fifth, seventh, and ninth folia of each section, according to published protocols (12, 42); three mice for each genotype were analyzed. The EGL cell numbers were expressed as percentage ratio of proliferating, differentiating, or apoptotic cells to the total number of cells (labeled by Hoechst 33258), counted for the entire length of the EGL in each photomicrograph field.
Also in MBs, the proliferating (Ki67+), apoptotic (cleaved caspase-3+), or CD15-positive cell numbers were expressed as a percentage ratio to the total number of cells, labeled by Hoechst 33258. The cell counts were performed on about 40 randomly representative images, collected under the same parameters from five different tumors for each genotype.
RNA Extraction, qRT-PCR
Total cellular RNA was extracted from Ptch1+/−/Btg1+/+ (n = 4) and Ptch1+/−/Btg1−/− (n = 4) tumors with Trizol Reagent (Invitrogen, San Diego, CA, USA) and reverse-transcribed, as previously described (42). Real-time qPCR was carried out with a 7900HT System (Applied Biosystems, Foster City, CA, USA) using SYBR Green I dye chemistry in duplicate samples. The mRNA relative expression values, obtained by the comparative cycle threshold method (50), were normalized to expression levels of the TATA-binding protein gene, used as endogenous control. Specific qRT-PCR primers were designed by the Beacon Designer 7.1 software (Premier Biosoft International, Palo Alto, CA, USA) or by the BLAST software (Primer Blast NCBI: http://www.ncbi.nlm.nih.gov/tools/primer-blast) (51); their sequence is available on request.
Western Blot Analysis
The Ptch1+/−/Btg1+/+ (n = 3) and Ptch1+/−/Btg1−/− (n = 3) tumors were lysed into lysis buffer [50 mM Tris–HCl (pH 7.5), sodium deoxycholate 0.1%, 150 mM NaCl, 5 mM EDTA (pH 8.0), 10% glycerol, 1% NP40], containing 1 mM phenylmethylsulfonyl fluoride (PMSF), 10 μg/ml of leupeptin and aprotinin, 10 mM β-glycerophosphate, 4 mM NaF, 0.1 mM Na3VO4, 5 mM Na(C3H7COO), and sonicated. Proteins (80 μg per MB) were electrophoretically analyzed by sodium dodecyl sulfate (SDS)−10% polyacrylamide gel electrophoresis (PAGE) and transferred to nitrocellulose membranes; these were incubated for 2 h in blocking buffer {TBS [10 mM Tris–HCl (pH 8), 150 mM NaCl]−0.05% Tween−5% powdered milk} and then incubated overnight in the same buffer with the indicated primary antibodies.
The antibodies used for immunoblots were as follows: the rabbit polyclonal antibody anti-Prmt1 (07–404; Millipore; 1:500); the mouse monoclonal antibody anti-cyclin D1 (sc-20044; Santa Cruz Biotechnology; 1:200); the mouse monoclonal antibody anti-phospho-BAD (Ser99, sc-271963; Santa Cruz Biotechnology; 1:50); and the mouse monoclonal antibody DM1A anti-αTubulin (T6199; Sigma Aldrich; 1:10,000).
The densitometric analysis was performed using the Scan Analysis software (Biosoft, Cambridge, UK). Mean ± SEM densitometric values were obtained by averaging the percentage change of each MB relative to the control sample (one Ptch1+/−/Btg1+/+ tumor) and normalizing each sample value to the corresponding α-tubulin densitometric value, used as an endogenous control.
Statistical Analysis
All statistical analyses were performed using StatView 5.0 software (SAS Institute, Cary, NC, USA).
The χ2-test was used to compare the MB incidence (Table 1) and the percentage of positivity for preneoplastic lesions (Figure 2) in mice of the different genotypes studied.
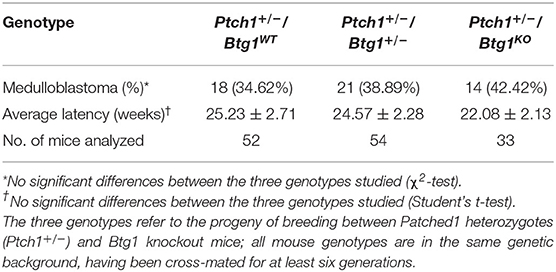
Table 1. Statistical analysis of medulloblastoma incidence and latency.
Data of MB time latency (Table 1) and number of lesions per cerebellum (Figure 2) were analyzed as average ± SEM and analyzed by the Student's t-test. Also the statistical analyses of mRNA and protein expression values were performed by Student's t-test.
The immunohistochemistry data of cell proliferation, differentiation, and apoptosis, as well as of CD15-positive cells (shown in Figures 1, 4–7, respectively) were presented as mean% of total cells ± SEM. The experiments where the data were calculated as percentage of total cells were tested for the equality of variance between groups by the Levene's test; if equality was not satisfied, the data were analyzed with non-parametric tests, namely, Kruskal–Wallis test to analyze the main effects and Mann–Whitney U-test to analyze the simple effects (as for measurements of MB proliferation and apoptosis in Figure 1, of NeuN-positive cells in Figure 5, caspase-3-positive cells in Figure 6, and of CD15-positive cells in Figure 7). Data with equality of variance (i.e., proliferating cells in Figure 4 and NeuroD1-positive cells in Figure 5) were analyzed using two-way ANOVA to test the main effects of the two genotypes (Btg1 and Ptch1) on cell numbers. Individual between-group comparisons to test simple effects were carried out by Fisher's protected least significant difference (PLSD) ANOVA post-hoc test.
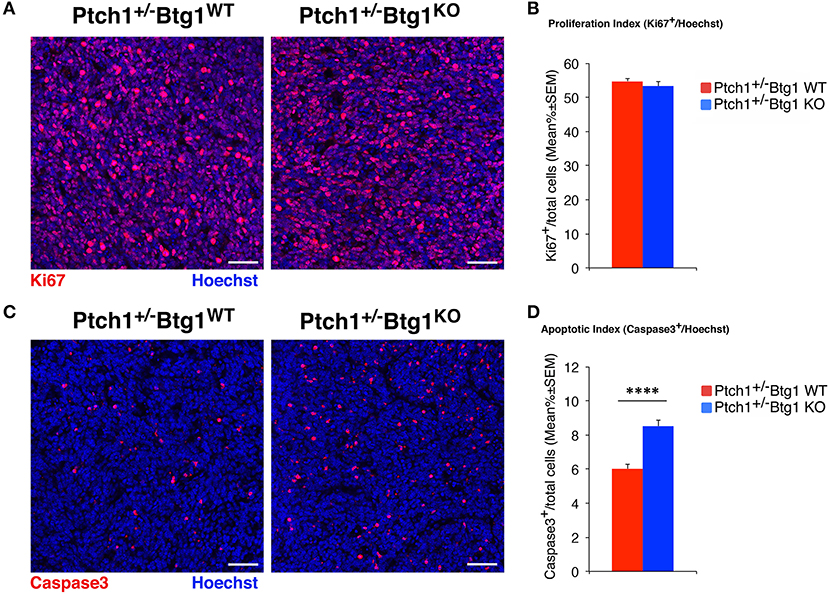
Figure 1. B-cell translocation gene 1 (Btg1) ablation in Patched1 heterozygous (Ptch1+/−) mice does not affect the proliferation of neoplastic cerebellar granule cell precursors (GCPs) but significantly increases their apoptosis. (A) Representative images by confocal microscopy showing the cycling cells (Ki67+, in red) in medulloblastomas (MBs) from Ptch1+/−/Btg1WT and Ptch1+/−/Btg1KO mice. Sections are counterstained with Hoechst 33258 to visualize the nuclei. Scale bar, 50 μm. (B) Analysis in Ptch1+/−/Btg1WT and Ptch1+/−/Btg1KO tumors of the number of proliferating GCPs, measured as mean ± SEM percentage ratio between number of Ki67+ cells and total number of cells (visualized by Hoechst 33258; proliferation index). Simple effects analysis: p = 0.8003, Mann–Whitney U-test. MBs analyzed: n = 5 for each genotype; total fields analyzed: n = 396. (C) Representative confocal images of Ptch1+/−/Btg1WT and Ptch1+/−/Btg1KO MBs stained for the apoptotic marker activated caspase-3 (red) and for the nuclei dye Hoechst (blue). Scale bars: 50 μm. (D) Quantification of mean ± SEM percentage ratio of cells positive for cleaved caspase-3 to the total number of cells (Hoechst-positive; apoptotic index) in MBs from Ptch1+/−/Btg1WT and Ptch1+/−/Btg1KO mice. Simple effects analysis: ****p < 0.0001, Mann–Whitney U-test. MBs analyzed: n = 5 for each genotype; total fields analyzed: n = 392.
Moreover, the quantification by immunohistochemical analysis of apoptotic cells in preneoplastic lesions was obtained as mean ± SEM/mm2 of lesion and was statistically analyzed by Student's t-test (Figure 3).
All statistical tests were considered significant with p < 0.05.
Results
B-Cell Translocation Gene 1 Ablation Does Not Enhance the Medulloblastoma Formation
It is known that the Ptch1+/− mice develop spontaneous MBs arising from GCPs within 10 months of birth, with an incidence that is background-dependent (52). Moreover, we have observed that the ablation of Btg1 increases the proliferation of GCPs, with consequent formation of a hyperplastic EGL (12).
Thus, we tested whether the Btg1 deletion could affect the tumorigenic potential of GCPs. For this, we crossed the Ptch1+/− mice with the Btg1 knockout mice and analyzed the frequency of MB development in double-mutant mice during 1 year of life. Unexpectedly, we observed that in Ptch1+/− background, the ablation of one or both alleles of Btg1 did not significantly favor tumorigenesis, although in the double-mutant mice there was a trend to increase the MB incidence relative to the Ptch1+/−/Btg1+/+ mice (referred throughout this report to as Ptch1+/−/Btg1WT). In fact, the Ptch1+/−/Btg1+/− and Ptch1+/−/Btg1−/− (the latter hereafter referred to as Ptch1+/−/Btg1KO) mice developed MB with a frequency of 38.89 and 42.42%, respectively, relative to the MB incidence of Ptch1+/−/Btg1WT mice (the latter incidence was 34.62%; Ptch1+/−/Btg1+/− vs. Ptch1+/−/Btg1WT p = 0.648; Ptch1+/−/Btg1KO vs. Ptch1+/−/Btg1WT p = 0.469; χ2-test; Table 1). Also the tumor latency in double-mutant mice, either Ptch1+/−/Btg1+/− or Ptch1+/−/Btg1KO, did not significantly differ from that of control Ptch1+/−/Btg1WT mice (Ptch1+/−/Btg1+/− vs. Ptch1+/−/Btg1WT p = 0.852; Ptch1+/−/Btg1KO vs. Ptch1+/−/Btg1WT p = 0.386; Student's t-test; Table 1).
To assess the effect of Btg1 ablation on proliferation and apoptosis of neoplastic GCPs within the tumors, we carried out an immunohistochemical analysis of MB sections with the antibodies for Ki67, a protein expressed by cycling cells (53) or for the active proteolytic fragment of caspase-3, indicator of the apoptotic process (Figures 1A,C). Surprisingly, we found that the percentage of mitotic cells to the total number of cells (detected by Hoechst 33258; proliferation index) in MBs of Ptch1+/−/Btg1KO mice was equivalent to that in tumors of Ptch1+/−/Btg1WT mice (p = 0.8003; Mann–Whitney U-test; Figures 1A,B). Conversely, we observed in the Ptch1+/−/Btg1KO MBs a highly significant increase in the percentage of caspase-3-positive cells to the total number of cells (apoptotic index), with respect to the Ptch1+/−/Btg1WT tumors (p < 0.0001 and 42% increase; Mann–Whitney U-test; Figures 1C,D).
Next, we examined the effect of Btg1 absence on the earliest stages of tumorigenesis by analyzing the premalignant lesions in the cerebella of Ptch1+/−/Btg1+/+/Math1-GFP+ and Ptch1+/−/Btg1−/−/Math1-GFP+ mice (referred throughout this report to as Ptch1+/−/Btg1WT/Math1-GFP+ and Ptch1+/−/Btg1KO/Math1-GFP+, respectively) sacrificed at different times, i.e., at 2 or 6 weeks. Two weeks of age is a stage corresponding to the end of proliferative development of GCPs within the EGL, when the lesions become morphologically detectable and are quite frequent (about 75%) (54); at 6 weeks of age, the EGL has disappeared but the lesions remain frequent, although only a limited number will develop into MB (47). The mouse model Ptch1+/− is a powerful tool to identify the early stages in the MB development because within 2–6 months of birth, more than 50% of mice present at the surface of the cerebellum regions of ectopic cells, which represent a preneoplastic stage of tumorigenesis. These regions are usually nodular formations, extended into the fissures between the cerebellar lobules, and contain highly proliferating preneoplastic GCPs (pGCPs) (47, 55, 56). The pGCPs inside the lesions express the transcription factor Math-1, and then they can be identified in Math1-GFP+ mice by GFP expression (47, 56).
The screening of the cerebella of the asymptomatic Ptch1+/−/Btg1WT/Math1-GFP+ and Ptch1+/−/Btg1KO/Math1-GFP+ mice did not reveal differences between the two genotypes under study in the incidence of MB lesions (i.e., number of mice with lesions) or in the number of lesions per cerebellum neither at 2 weeks nor at 6 weeks of age (Figure 2). In particular, the ablation of the Btg1 gene did not influence the expected frequency of GFP+ lesions in Ptch1+/− mice at 6 weeks (Ptch1+/−/Btg1KO/Math1-GFP+ 70% frequency, and Ptch1+/−/Btg1WT/Math1-GFP+ 80% frequency, p = 0.6056, χ2-test; Figures 2B,C), which resulted in agreement with previous data (56).
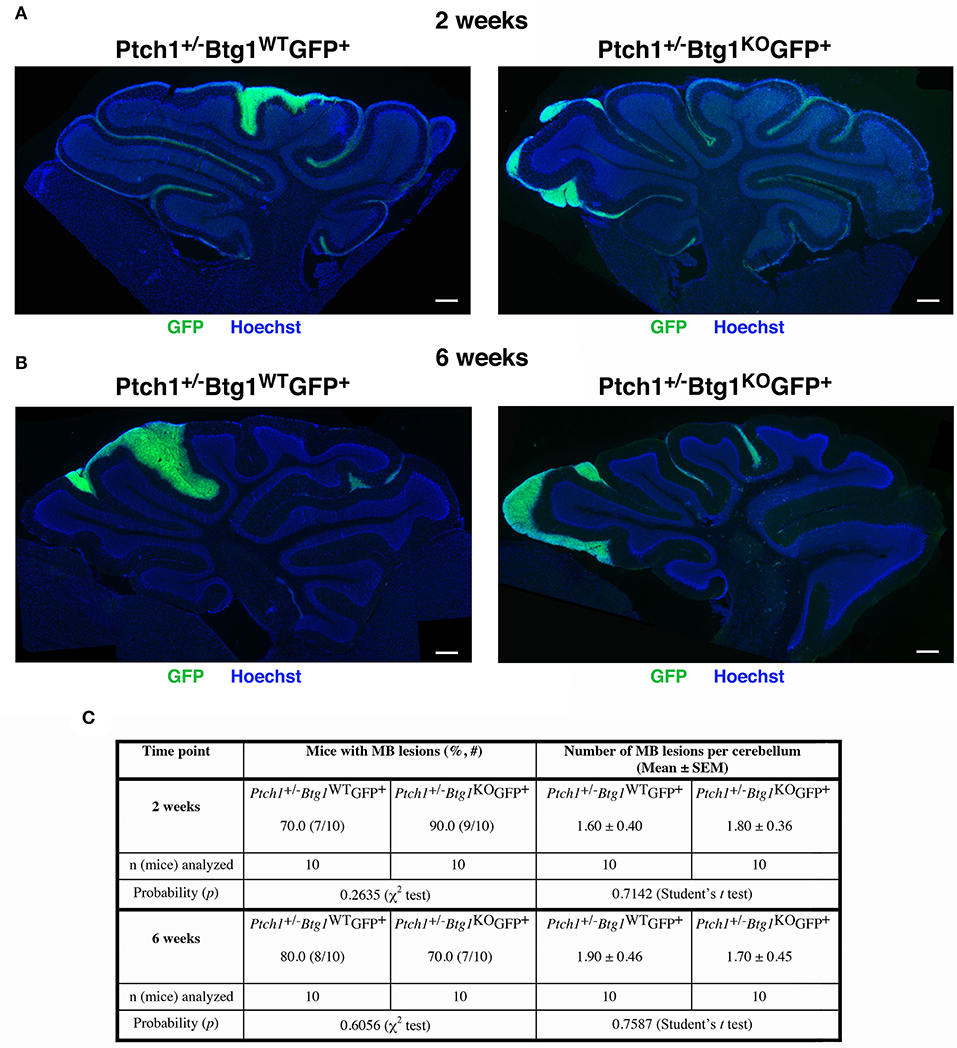
Figure 2. Deletion of the B-cell translocation gene 1 (Btg1) gene in Patched1 heterozygous (Ptch1+/−) background does not result in an enhancement of the frequency of mice with preneoplastic lesions nor does it affect the number of lesions per cerebellum. (A,B) Representative images of lesions in cerebellar sagittal sections from Ptch1+/−/Btg1WT/Math1-GFP+ and Ptch1+/−/Btg1KO/Math1-GFP+ mice at 2 (A) and 6 (B) weeks of age. Sections were stained with Hoechst 33258, and lesions were identified by the presence of green fluorescent protein (GFP)-positive preneoplastic cerebellar granule cell precursors (pGCPs). Scale bar, 300 μm. (C) Percentage of mice with lesions, frequency of lesions per cerebellum (obtained as average number in lesioned and non-lesioned mice) and number of mice analyzed for each genotype and time point; statistical analyses are indicated.
Then, we analyzed by immunohistochemistry the proliferation (after a 1-h pulse of BrdU) and the survival of pGCPs within the lesions. Similar to the MBs, no differences were detected between Ptch1+/−/Btg1WT/Math1-GFP+ and Ptch1+/−/Btg1KO/Math1-GFP+ mice at 2 and 6 weeks of age in the proliferative rate of pGCPs, expressed as the number of BrdU+ cells present in the GFP+ lesion area (data not shown). On the other hand, we observed a significant increase of apoptosis, measured as cleaved caspase-3+ cell number per lesion area, in Ptch1+/−/Btg1KO/Math1-GFP+ mice, relative to Ptch1+/−/Btg1WT/Math1-GFP+ mice, either at 2 weeks (p = 0.008 and 38% increase; Student's t-test; Figures 3A,C) or at 6 weeks of age (p = 0.0003 and 49% increase; Student's t-test; Figures 3B,C).
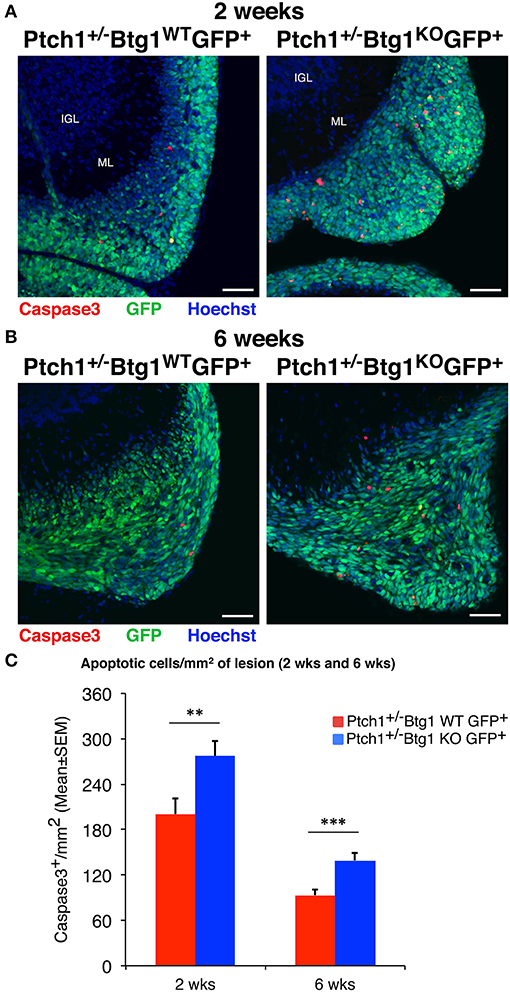
Figure 3. Ablation of B-cell translocation gene 1 (Btg1) in Patched1 heterozygous (Ptch1+/−) mice increases the apoptosis of preneoplastic cerebellar granule cell precursors (pGCPs). (A,B) Representative confocal images of apoptotic pGCPs, identified as cleaved caspase-3+ cells (in red), in preneoplastic lesions from Ptch1+/−/Btg1WT/Math1-green fluorescent protein (GFP)+ and Ptch1+/−/Btg1KO/Math1-GFP+ mice at 2 (A) and 6 (B) weeks of age. The pGCPs in the lesions are GFP+; the internal granule layer (IGL) and the molecular layer (ML) are visualized by Hoechst 33258 staining. Scale bar, 50 μm. (C) Apoptotic pGCPs were quantified as mean ± SEM/mm2 of cleaved caspase-3+ cells in the whole lesion area, defined by the presence of GFP+ cells. The lesions present in all lesioned mice were analyzed, whose number for each genotype and time point is indicated in Figure 2C. **p < 0.01 or ***p < 0.001, Student's t-test. Total fields analyzed: n = 196 for 2 weeks, n = 151 for 6 weeks.
Together, these results indicate that the Btg1 deletion in Ptch1+/− mice did not enhance the neoplastic transformation of pGCPs and, then, the MB incidence, and suggest that this might be a consequence of a significant increase of apoptosis.
B-Cell Translocation Gene 1 Ablation Increases the Apoptosis of Granule Cell Precursors
Subsequently, we sought to assess the effects of the genetic ablation of Btg1 in background Ptch1+/− during the cerebellar development. To this aim, we measured the proliferation, differentiation, and survival of the GCPs within the EGL at P7, a stage corresponding to the age of highest expansion of GCPs.
At P7, the percentage of proliferating GCPs to the total number of cells, identified by incorporation of BrdU after 1-h pulse, was significantly higher in Ptch1+/+/Btg1KO mice than in Ptch1+/+/Btg1WT mice (hereafter referred to as Btg1KO and Btg1WT, respectively; 27.2% increase, p < 0.0001, Fisher's PLSD ANOVA post-hoc test; Figures 4A,B), as expected (12). Also in Ptch1+/−/Btg1WT mice, the GCP proliferation was increased by constitutive activation of the Shh pathway (Ptch1+/−/Btg1WT vs. Btg1WT p = 0.0012, 11.1% increase, Fisher's PLSD ANOVA post-hoc test; Figures 4A,B). The latter increase of proliferation agrees with previous observations (42) and is significantly lower than that induced by Btg1 deletion alone (Ptch1+/−/Btg1WT vs. Btg1KO p < 0. 0001, Fisher's PLSD ANOVA post-hoc test; Figures 4A,B). Notably, no positive synergy was observed between the Btg1 and Shh pathways since the ablation of Btg1 did not increase the percentage of proliferating GCPs above the level induced by the constitutively activated Shh signaling pathway (Ptch1+/−/Btg1KO vs. Ptch1+/−/Btg1WT p = 0.5737, Fisher's PLSD ANOVA post-hoc test; Figures 4A,B).
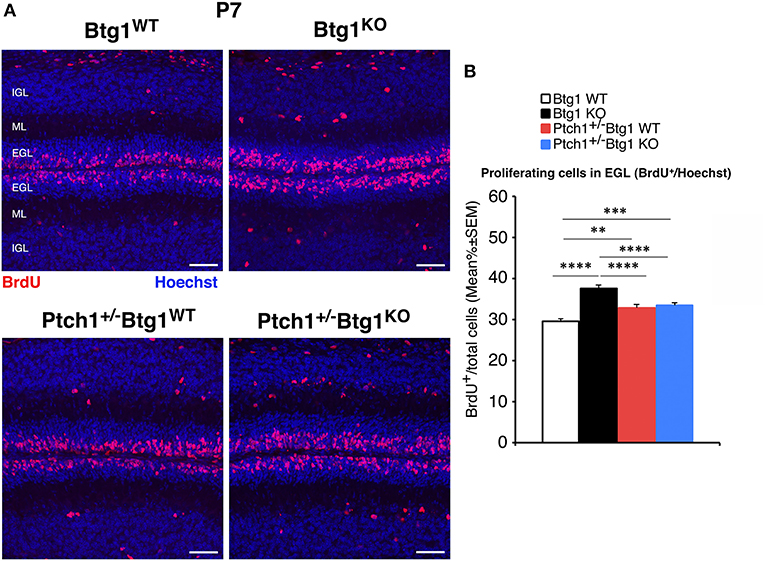
Figure 4. Genetic ablation of the B-cell translocation gene 1 (Btg1) gene in Patched1 heterozygous (Ptch1+/−) or in wild-type mice influences the proliferation of cerebellar granule cell precursors (GCPs) in the external granule layer (EGL) at postnatal day 7 (P7). (A) Representative confocal images of GCPs that have entered the cell cycle S-phase within the EGL of P7 mice of the four genotypes under study, identified as 5-bromo-2'-deoxyuridine (BrdU)-positive cells after a short pulse of BrdU (1 h). Sections are counterstained with Hoechst 33258 to visualize the EGL, the molecular layer (ML), and the internal granule layer (IGL). Scale bar, 50 μm. (B) Quantification of GCPs entering in the S-phase of cell cycle in the EGL of P7 mice with the indicated genotype, measured as mean ± SEM percentage ratio between the number of BrdU+ cells and the total number of cells (labeled by Hoechst 33258). The proliferative effect of Btg1 deletion is more marked in wild-type than in Ptch1+/− background [two-way ANOVA, Btg1 ablation effect, F(1,428) = 36.900, p < 0.0001; Ptch1 ablation effect, F(1,428) = 0.395, p = 0.5300, followed by analysis of simple effects: **p < 0.01, ***p < 0.001, or ****p < 0.0001, Fisher's protected least significant difference (PLSD) ANOVA post-hoc test]. Three mice for each genotype were analyzed.
Next, we measured the differentiation of GCPs by labeling these cells with the neural markers NeuroD1 and NeuN (Figure 5). NeuroD1 is highly expressed in early post-mitotic GCPs and is implicated in their differentiation (57), while NeuN labels fully differentiated granule neurons (58). At P7, we observed a significant decrease in the percentage of NeuroD1+ GCPs in all conditions of augmented proliferation (Btg1WT vs. Btg1KO p = 0.0001; Btg1WT vs. Ptch1+/−/Btg1WT p = 0.0063; Btg1WT vs. Ptch1+/−/Btg1KO p = 0.0002; Fisher's PLSD ANOVA post-hoc test; Figures 5A,B). Furthermore, no difference was observed in NeuroD1 expression between mice with the genetic ablation of Btg1 alone or combined with the deletion of the Ptch1 allele, indicating that no evident synergy occurred between the Btg1-null and the Ptch1+/− background (Figures 5A,B). Similarly, the percentage of NeuN-positive GCPs was significantly lower in all groups relative to the Btg1WT mice, with a slightly more pronounced decrease in the Btg1KO mice (Btg1WT vs. Btg1KO p < 0.0001; Btg1WT vs. Ptch1+/−/Btg1WT p = 0.0200; Btg1WT vs. Ptch1+/−/Btg1KO p = 0.0117; Mann–Whitney U-test; Figures 5A,C). Ptch1+/−/Btg1WT and Ptch1+/−/Btg1KO mice presented equivalent percentages of NeuN+ GCPs, significantly higher than that in Btg1KO mice (Ptch1+/−/Btg1WT vs. Btg1KO p = 0.0048; Ptch1+/−/Btg1KO vs. Btg1KO p = 0.0154; Mann–Whitney U-test; Figures 5A,C). All this indicates that the ablation of Btg1, although associated to a decrease of differentiation, did not interfere with the inhibition of differentiation exerted by the Ptch1+/− genotype.
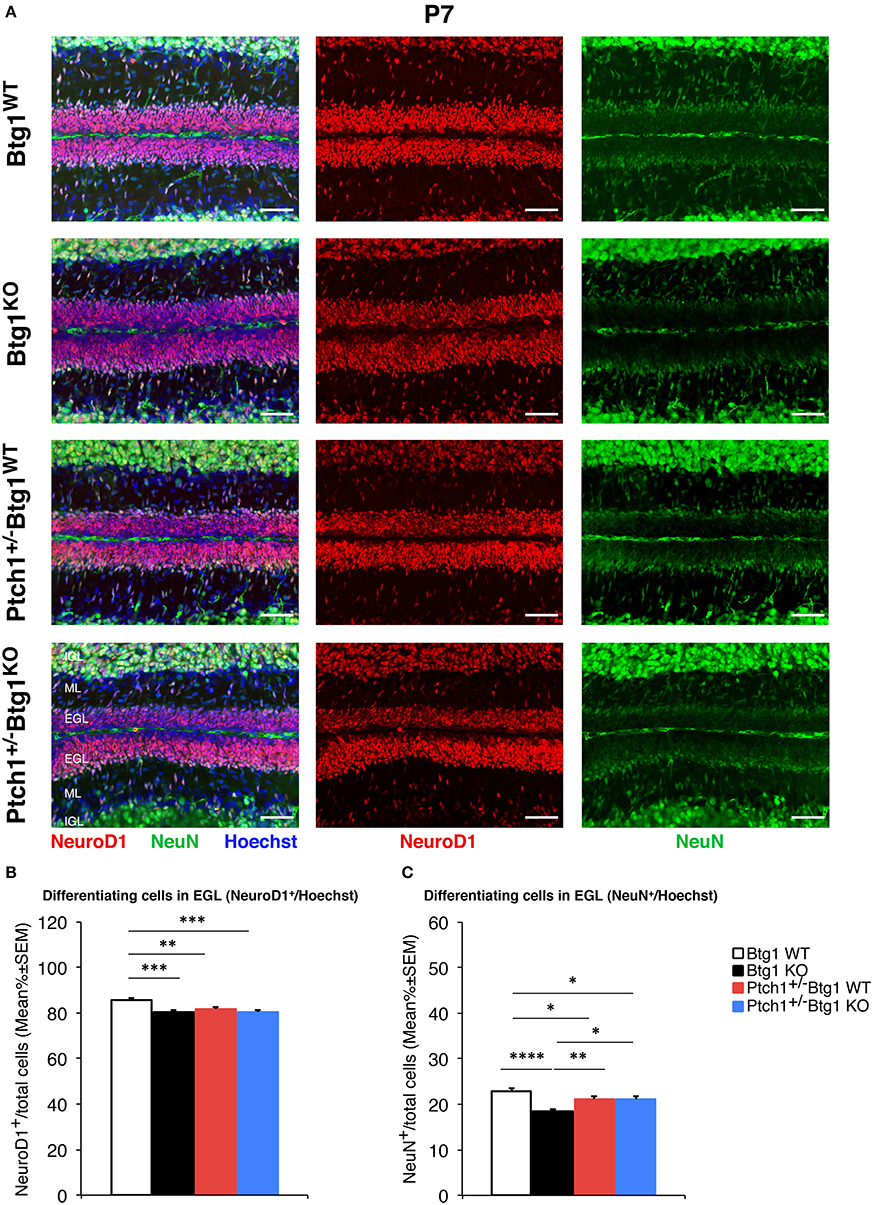
Figure 5. B-cell translocation gene 1 (Btg1) ablation in Patched1 heterozygous (Ptch1+/−) or wild-type mice reduces the differentiation of cerebellar granule cell precursors (GCPs) in the external granule layer (EGL) at postnatal day 7 (P7). (A) Representative images by confocal microscopy showing the GCPs in the EGL of P7 mice of the four genotypes indicated, labeled with the early and the late differentiation markers NeuroD1 (red) and NeuN (green), respectively. Sections are counterstained with Hoechst 33258 to visualize the EGL and the molecular layer (ML) and internal granule layer (IGL). Scale bar, 50 μm. (B,C) Quantitative analysis of GCPs expressing NeuroD1 (B) or NeuN (C) in the EGL of P7 mice of the four genotypes under study. Data are mean ± SEM percentage ratio between the number of NeuroD1+ or NeuN+ GCPs and the total number of GCPs within the EGL, labeled by Hoechst 33258. (B) Two-way ANOVA: Btg1 ablation effect, F(1,352) = 11.434, p = 0.0008; Ptch1 ablation effect, F(1,352) = 3.908, p = 0.0488. Simple effects analysis: **p < 0.01 or ***p < 0.001, Fisher's protected least significant difference (PLSD) ANOVA post-hoc test. Three mice for each genotype were analyzed. (C) Main effect analysis by Kruskal-Wallis [d.f. 3] H = 26.444, p < 0.0001, followed by analysis of simple effects: *p < 0.05, **p < 0.01, or ****p < 0.0001, Mann–Whitney U-test. Mice analyzed: n = 3 for each genotype; total fields analyzed: n = 356.
Then, we analyzed the survival of GCPs by detection of cleaved caspase-3+ cells in the EGL. At P7, Btg1 knockout significantly increased the percentage of GCPs undergoing apoptosis either in Ptch1 wild-type mice (Btg1KO vs. Btg1WT p = 0.0011 and 55% increase; Mann–Whitney U-test; Figures 6A,B), as expected (12), or in Ptch1+/− mice (Ptch1+/−/Btg1KO vs. Btg1WT p < 0.0001 and 122% increase; Mann–Whitney U-test; Figures 6A,B). Interestingly, although the ablation of one Ptch1 allele alone did not affect the apoptosis of the GCPs (Ptch1+/−/Btg1WT vs. Btg1WT p = 0.3723; Mann–Whitney U-test; Figures 6A,B), the combined genetic deletion of Btg1 gene significantly augmented the percentage of caspase-3+ GCPs (Ptch1+/−/Btg1KO vs. Ptch1+/−/Btg1WT p < 0.0001; Mann–Whitney U-test; Figures 6A,B), far above the level induced by Btg1 deletion alone (Ptch1+/−/Btg1KO vs. Btg1KO p = 0.0002; Mann–Whitney U-test; Figures 6A,B).
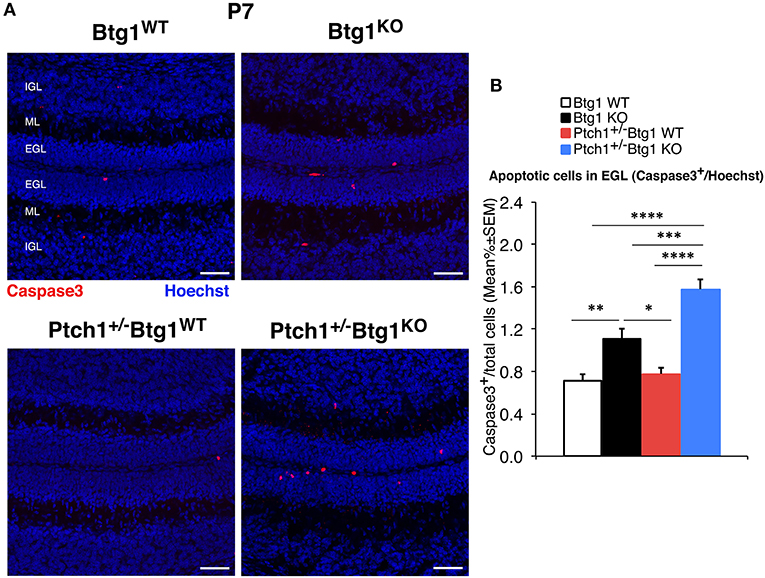
Figure 6. Deletion of the B-cell translocation gene 1 (Btg1) gene promotes the apoptosis of cerebellar granule cell precursors (GCPs) within the external granule layer (EGL) in postnatal day 7 (P7) Patched1 heterozygous (Ptch1+/−) mice more than in wild-type mice. (A) Representative confocal images of apoptotic GCPs, identified as cleaved caspase-3+ cells, in the EGL of P7 mice of the four genotypes indicated. Sections were stained with Hoechst 33258 to visualize the EGL, the molecular layer (ML) and the internal granule layer (IGL). Scale bar, 50 μm. (B) Apoptotic GCPs in the EGL of P7 mice of the four genotypes under study were quantified as mean ± SEM percentage ratio between the number of cleaved caspase-3+ GCPs (in red) and the total number of GCPs within the EGL (Hoechst-positive). Btg1 knockout significantly increases the percentage of GCPs undergoing apoptosis either in Ptch1+/− or in wild-type mice, with a greater fraction of apoptotic GCPs in double-mutant mice (main effect analysis by Kruskal–Wallis [d.f. 3] H = 62.761, p < 0.0001, followed by analysis of simple effects: *p < 0.05, **p < 0.01, ***p < 0.001, or ****p < 0.0001, Mann–Whitney U-test). Mice analyzed: n = 3 for each genotype; total fields analyzed: n = 462.
Overall, this indicates that during cerebellar development, the ablation of Btg1 in Ptch1 heterozygous mice does not influence the proliferation and differentiation processes, which are only dependent on the constitutive activation of the Shh pathway, but significantly increases the percentage of caspase-3-positive GCPs, suggesting the existence of a synergy between the Btg1 and Shh pathways in the apoptotic process.
B-Cell Translocation Gene 1 Ablation Induces Prmt1-Mediated Apoptosis and Increases Stemness of Tumor Cells
To investigate the molecular mechanisms of increased apoptosis following the genetic ablation of Btg1, we first analyzed by qRT-PCR the expression levels of three components of the apoptotic pathway, namely, B-cell lymphoma 2 (Bcl-2), which is an antiapoptotic protein, p53 upregulated modulator of apoptosis (Puma), and Bcl-2-associated X protein (Bax), identified as apoptotic inducers. No significant changes of these mRNAs were detected in Ptch1+/−/Btg1KO tumors with respect to Ptch1+/−/Btg1WT tumors (data not shown). Very recently, the involvement of Prmt1 in the apoptosis of tumor cells has been demonstrated, although with opposite roles in different types of cancer (59, 60). Since Prmt1 is a known molecular partner of Btg1, we investigated the Prmt1 level in the MBs and we observed a significant increase of its expression in Ptch1+/−/Btg1KO tumors relative to Ptch1+/−/Btg1WT tumors (54.4% increase, p = 0.0021; Student's t-test; Figure 7A). Moreover, we analyzed the mRNA level of cyclin D1, target gene of Btg1, and we found that in Ptch1+/−/Btg1KO MBs the cyclin D1 expression was significantly higher than in Ptch1+/−/Btg1WT MBs (p = 0.0117; Student's t-test; Figure 7A). In our experience, this increase should be associated to great changes in cellular proliferation (12); however, Ptch1+/−/Btg1KO MBs show a proliferation index equivalent to that of Ptch1+/−/Btg1WT MBs (see Figures 1A,B). Yet, we also observed an increased p53 expression within the tumors lacking the Btg1 gene (Ptch1+/−/Btg1KO vs. Ptch1+/−/Btg1WT p = 0.0070; Student's t-test; Figure 7A), which, given the proapoptotic action of p53, may explain the lack of increase of proliferation in MBs.
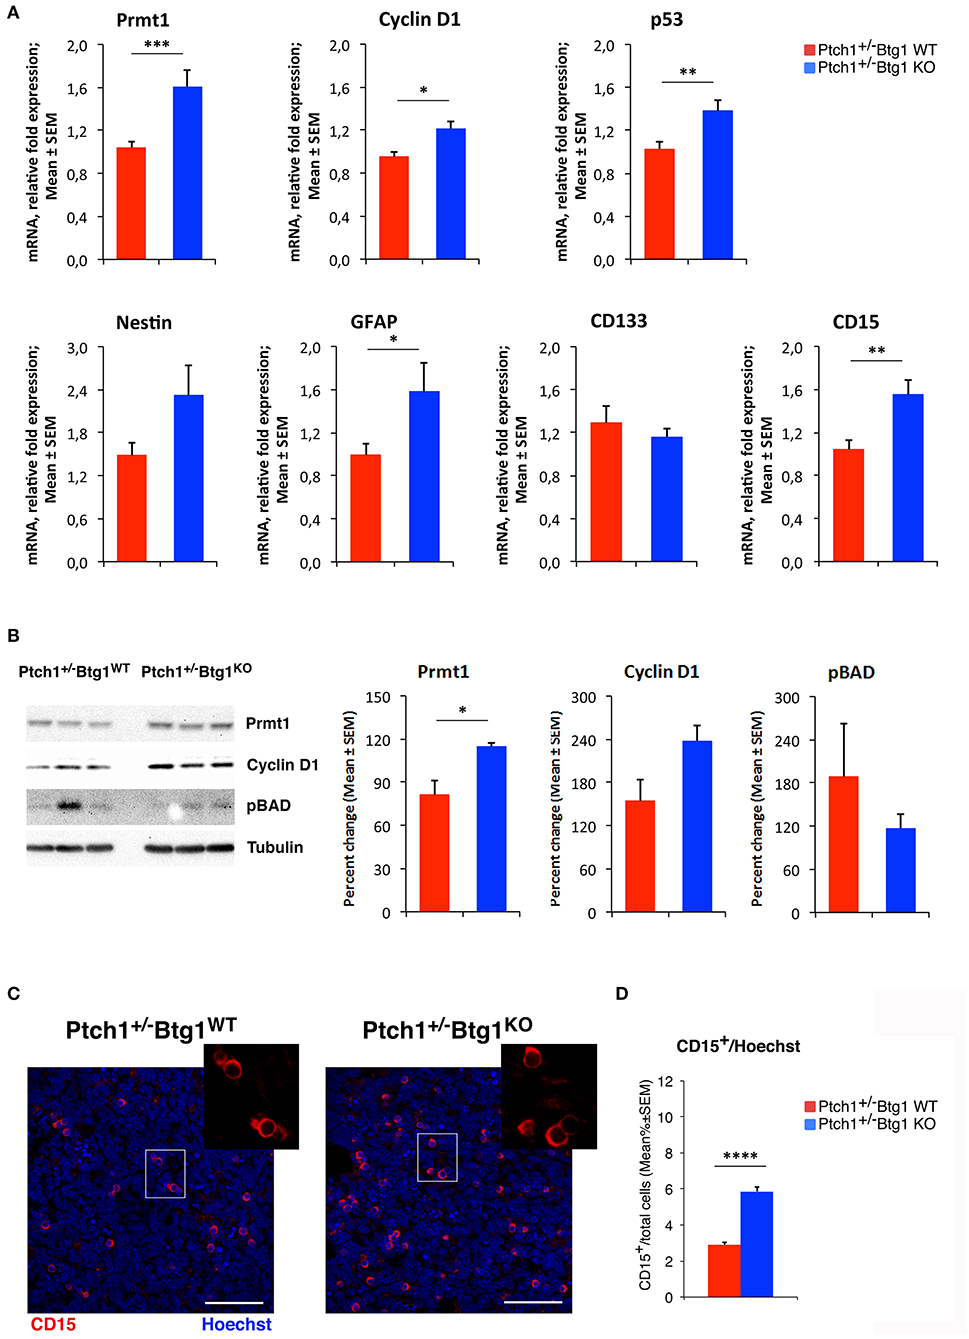
Figure 7. B-cell translocation gene 1 (Btg1) ablation in Patched1 heterozygous (Ptch1+/−) mice induces protein arginine methyltransferase 1 (Prmt1) expression and increases stemness in medulloblastoma (MB) cells. (A) Real-time PCR analysis of mRNA obtained from Ptch1+/−/Btg1WT and Ptch1+/−/Btg1KO MBs. Four tumors per genotype were analyzed. Average ± SEM values are from three to four independent analyses of each tumor and are shown as fold change relative to the control sample (one Ptch1+/−/Btg1WT MB), which was set to unit. TBP mRNA was used to normalize data. *p < 0.05, **p < 0.01, or ***p < 0.001, Student's t-test. (B) Immunoblotting and densitometry analysis with anti-Prmt1, anti-cyclin D1, or anti-phospho-BAD antibodies in Ptch1+/−/Btg1WT and Ptch1+/−/Btg1KO MBs. Three tumors per genotype were analyzed. Mean ± SEM densitometric values were obtained by averaging the percentage change of each MB relative to the control sample (one Ptch1+/−/Btg1WT MB) and normalizing each sample value to the corresponding α-tubulin densitometric value, used as endogenous control. *p < 0.05, Student's t-test. (C) Representative images by confocal microscopy showing the tumor stem cells (CD15+, in red) in MBs from Ptch1+/−/Btg1WT and Ptch1+/−/Btg1KO mice. Nuclei were stained with Hoechst 33258. Scale bar, 50 μm. The white box area is shown with 2.2× magnification. (D) Quantification of mean ± SEM percentage ratio of cells positive for CD15 to the total number of cells, labeled by Hoechst 33258, in Ptch1+/−/Btg1WT, and Ptch1+/−/Btg1KO MBs. Simple effects analysis: ****p < 0.0001, Mann–Whitney U-test. MBs analyzed: n = 5 for each genotype; total fields analyzed: n = 400.
We have previously demonstrated that in the neurogenic niches, Btg1 controls the quiescence and self-renewal of the stem cells (11, 29), then by qRT-PCR, we also evaluated in the MBs the mRNA levels of some markers of brain tumor stem cells, such as nestin, glial fibrillary acidic protein (GFAP), CD133, and CD15 (38, 61–68). In Ptch1+/−/Btg1KO MBs, we observed an increase of the levels of nestin and GFAP mRNAs relative to the Ptch1+/−/Btg1WT MBs, with the GFAP expression attaining statistical significance (p = 0.0467; Student's t-test; Figure 7A). Furthermore, we recorded a statistically significant increase of CD15 expression in Ptch1+/−/Btg1KO tumors with respect to Ptch1+/−/Btg1WT tumors (p = 0.0057; Student's t-test; Figure 7A), while no changes in mRNA level of CD133 were detected between the tumors of the two different genotypes under study (p = 0.2455; Student's t-test; Figure 7A).
Finally, no significant differences were observed for the main downstream Shh-responsive genes, namely, Gli1, Gli2, Ptch1, and N-Myc, in Ptch1+/−/Btg1KO MBs relative to Ptch1+/−/Btg1WT MBs (data not shown), indicating that the deletion of Btg1 does not interfere with Shh signaling in cerebellar tumors.
Also, at the protein level, we found a significant increase of Prmt1 in Ptch1+/−/Btg1KO MBs with respect to Ptch1+/−/Btg1WT MBs (p = 0.028; Student's t-test; Figure 7B). Moreover, we observed an increase of the level of cyclin D1 protein in Ptch1+/−/Btg1KO tumors relative to the Ptch1+/−/Btg1WT tumors, without attaining statistical significance (p = 0.089; Student's t-test; Figure 7B).
It is known that the methylation of the proapoptotic BAD protein at Arg-94 and Arg-96 catalyzed by Prmt1 inhibits Akt-mediated BAD phosphorylation at Ser-99, thus counteracting the Akt-dependent survival signaling and inducing the apoptotic process with concomitant activation of caspase-3 (44). Then, we analyzed the protein level of BAD phosphorylated at Ser-99 (pBAD) in MBs of Ptch1+/−/Btg1KO and Ptch1+/−/Btg1WT mice and we observed a decrease, although not significant, in BAD phosphorylation in tumors lacking the Btg1 gene (p = 0.397; Student's t-test; Figure 7B). This suggests that the Btg1 ablation could increase the apoptotic process by inducing the Prmt1-dependent methylation of the BAD protein.
We also analyzed the expression of GFAP protein in the MBs of both genotypes by measuring the area of GFAP staining detected by immunohistochemistry (see Supplementary Material); consistently with the mRNA expression, we observed a significant increase of GFAP protein in Ptch1+/−/Btg1KO vs. Ptch1+/−/Btg1WT MBs (p = 0.0074; Mann–Whitney U-test; Figure S1).
The increase of expression of CD15, a marker of brain tumor stem cells, detected by qRT-PCR in the Ptch1+/−/Btg1KO MBs compared with Ptch1+/−/Btg1WT MBs (Figure 7A), was confirmed at protein level by immunohistochemical analysis of tumor sections from MBs of the two different genotypes under study (Figures 7C,D). In MBs lacking the Btg1 gene, we observed a two-fold increase of the percentage of CD15-positive cells with respect to Ptch1+/−/Btg1WT tumors (p < 0.0001; Mann–Whitney U-test; Figures 7C,D), with a greater tendency of CD15+ cells to aggregate into clusters.
Noteworthy, by immunohistochemical analysis, we also evaluated in tumors and preneoplastic lesions of Ptch1+/−/Btg1WT and Ptch1+/−/Btg1KO mice the expression of Sox2, a marker for tumor stem cells in Shh-induced MB (69), without finding any difference (data not shown).
Discussion
In childhood, the primary cause of cancer-related death is brain tumors. Among these, MB, a highly malignant neoplasia developing in the cerebellum, is the most common, representing about 20% of all pediatric cerebral tumors (70, 71). The standard therapy for MB, which includes preliminary surgery followed by radiation and chemotherapy, allows a 5-years survival rate of 60% due to the frequent recurrences with a fatal outcome (72). Moreover, the toxicity of the chemotherapeutic drugs and the non-specificity of the radiation cause permanent neurocognitive damages to the young patients (73). So, it is necessary to develop innovative treatment strategies based on the use of more specific and less toxic molecules.
In this regard, we have already identified two molecules that act as tumor suppressors of MB, PC3TIS21/BTG2 (40, 41) and Cxcl3 (74). Then, in this report, we investigated the role in the MB pathogenesis of the PC3TIS21/BTG2-related gene Btg1, which we have previously shown to be required for the development and function of the cerebellum by operating basically as a negative regulator of the proliferation of cerebellar cell precursors (GCPs) through inhibition of cyclin D1 (12).
In this report, however, we observe that no significant change in tumor frequency of Ptch1+/− mice occurs after deletion of Btg1. This is quite surprising given the increase of proliferation of cerebellar GCPs caused by the ablation of Btg1 in Patched1 wild-type background; moreover, Btg1 has been shown to act as oncosuppressor in MB cells which strongly inhibits the proliferation (12) and also in several types of tumors (14, 29).
We expected that the increase of proliferation of GCPs observed in the EGL of Ptch1+/+/Btg1KO mice at P7 caused by Btg1 deletion would lead in Ptch1+/−/Btg1KO cerebella to an increase of Ptch1+/− cells, which are prone to tumor development. Consequently, we would have expected an increase of tumor frequency. However, surprisingly, in GCPs at P7, no proliferative synergy occurs in double-mutant Ptch1+/−/Btg1KO vs. single mutant Ptch1+/−/Btg1WT cells—although either the Patched1 or the Btg1 mutation alone is able to significantly increase proliferation—suggesting that the two proliferative pathways are independent. No increase of proliferation is observed also in Ptch1+/−/Btg1KO vs. Ptch1+/−/Btg1WT tumor cells. However, as we have previously shown that Btg1 inhibits selectively cyclin D1 (12), we observe here that the ablation of Btg1 is associated to an increase of cyclin D1 expression (though attaining statistical significance only for the transcript) in MB tumor cells, indicating that the proliferative system is activated, despite the lack of increased proliferation of Ptch1+/−/Btg1KO GCPs or tumor cells.
A possibility that may explain the lack of increase of proliferation and tumorigenesis is that the concomitant great increase of apoptosis occurring in Ptch1+/−/Btg1KO double-mutant precursor cells, relative to single mutant cells, may prevent their expansion and thus prevent an increase of tumor frequency in double-mutant cerebella.
Moreover, the Btg1 deletion, but not the Patched1 mutation alone, leads to a significant increase of apoptosis, relative to Btg1WT, while the two mutations together (Ptch1+/−/Btg1KO) synergize significantly, relative to Btg1 deletion alone, given that the Btg1KO apoptotic GCPs are significantly more in Ptch1+/− background than in Patched1 wild-type background. Consistently, we have previously shown that in Ptch1+/− mice, no change in apoptosis occurs (42). Also in MB lesions and in tumor cells, i.e., in Ptch1+/− background, the deletion of Btg1 highly increases apoptosis.
Such synergy of the Btg1 mutation with the Patched1 mutation may depend on the fact that each mutation could drive the cell into a permissive state for apoptosis, which is fully activated only when both mutations are present. In fact, although the activation of the Shh pathway has been associated to greater survival, nevertheless, an active pathway induces the transition of the proapoptotic protein Bax to a potentially active state ready to be triggered by an apoptotic stimulus (75). This may not be in contrast with our data, considering that the inactivation of Btg1 leads to a condition of greater and/or deregulated proliferation that may perturb or revert the prosurvival action of the Shh pathway. In fact, it is known that the loss of a negative regulator of proliferation, as for instance pRb (76), causes misregulation of the proliferative pathways, leading to apoptosis. Moreover, we have previously observed that the knockout of Btg1 increases the fraction of p53-positive as well as of caspase-3-positive cells in the dentate gyrus (11). Consistently, here we observe that p53 expression increases also in MB tumor cells ablated of Btg1, relative to MB tumor cells with Btg1 gene, which is compatible with an increase of apoptosis [see (77) for a review of the proapoptotic role of p53], suggesting that an increase of p53 is a cause for reduced survival. Thus, the loss of Btg1 may synergize with the Shh/Patched1 pathway to enhance apoptosis and may have targets either in common or distinct from this pathway.
In molecular terms, we also find that the deletion of Btg1 increases the expression of Prmt1. It is known that Prmt1 activates the proapoptotic BAD gene by methylating the BAD protein, in this way maintaining the BAD protein in a dephosphorylated active state, which enables it to bind Bcl-XL and to prevent its antiapoptotic function (44). In fact, we observe a decrease of the levels of phosphorylated BAD protein in MBs with Btg1KO background, though not attaining statistical significance, probably because of the variability between tumors. Further analyses will be necessary to examine this mechanism.
Notably, we observe an increase in Btg1 knockout MBs of cells positive for CD15 that labels tumor stem cells in brain tumors as well as in MBs (64–67). These tumor cells are known to remain in a quiescent state that reduces the possibility of successful therapy with antiproliferative strategies (78). We observed an increase also of GFAP, which labels about 5% of precursor cells in Ptch1+/− MBs (67) and is a transcriptional target of Prmt1 (79). This finding in MB is in line with what is observed in the adult neurogenic niches, i.e., in the dentate gyrus of the hippocampus and the subventricular zone, where the loss of cell cycle control consequent to the absence of Btg1 acutely elicits an uncontrolled proliferation of stem/progenitor cells, followed by an age-dependent decrease of their proliferative capacity and by quiescence (11). Thus, we can speculate that such an increase of CD15+ cells in the Ptch1+/−/Btg1KO model may be ascribed to an activation of existing tumor stem cells—possibly triggered by the high level of apoptosis of tumor cells—followed by their entry into quiescence. Future analyses will be necessary to evaluate whether this increase of tumor stem cells may cause a greater resistance to therapy of the Btg1-null MBs, especially in consideration of the data by Ward et al. (67), indicating a stronger tumor-initiating ability of CD15+ tumor cells orthotopically transplanted from Shh-type MBs.
In conclusion, our findings, although showing that the ablation of Btg1 does not increase MB frequency in a Ptch1+/− model, do not exclude that Btg1 acts as an MB suppressor, given the large increase of apoptosis following deletion of Btg1 that may counteract and hide any increase of proliferation and tumorigenesis. In fact, Btg1 expression appears to regulate the balance between proliferation and apoptosis in MB tumor formation. Btg1 is also deregulated in many tumor types (see Introduction); in human MB there is, on average, no significant change of Btg1 expression relative to control cerebellum samples, but, remarkably, some MB samples show ample deregulation of expression (up to 40%; ONCOMINE database: www.oncomine.org) (80). Additionally, mutations of Btg1 in human tumors are frequent (COSMIC database: http://cancer.sanger.ac.uk) (81); this aspect should be further tested in human as well as in mouse MB. Moreover, in view of the strong increase observed in our Btg1-null MB mouse model of CD15+ tumor stem cells, which can be at the origin of tumor regrowth after years, future investigation may evaluate whether the Btg1 gene is implicated in MB relapse.
Data Availability Statement
The datasets generated for this study are available on request to the corresponding authors.
Ethics Statement
This animal study was reviewed and approved by Italian Ministry of Health that approved these experiments on mice with authorization 193/2015-PR.
Author Contributions
MC and FT designed the research, analyzed the data, and wrote the paper. MC, GD'A, and LM performed the research. All authors read and approved the final version of the manuscript.
Funding
This work was supported by Consiglio Nazionale delle Ricerche (CNR) project DSB.AD004.093 and from Lazio Innova grant number 85-2017-14785 (CNR project DSB.AD001.121) to FT. MC was a recipient of a postdoctoral fellowship from the Fondazione Giovanni Celeghin and from Lazio Innova grants. GD'A was supported by a Ph.D. fellowship from the University of Tuscia (Viterbo).
Conflict of Interest
The authors declare that the research was conducted in the absence of any commercial or financial relationships that could be construed as a potential conflict of interest.
Supplementary Material
The Supplementary Material for this article can be found online at: https://www.frontiersin.org/articles/10.3389/fonc.2020.00226/full#supplementary-material
Abbreviations
ANOVA, analysis of variance; BAD, Bcl-2 antagonist of cell death; BrdU, 5-bromo-2′-deoxyuridine; Btg1, B-cell translocation gene 1; CD15, cluster of differentiation 15; EGL, external granule layer; GCPs, cerebellar granule cell precursors; GFAP, glial fibrillary acidic protein; GFP, green fluorescent protein; IGL, internal granule layer; KO, knockout; Math1, mouse atonal homolog 1; MB, medulloblastoma; ML, molecular layer; NeuN, neuronal nuclei; pGCPs, preneoplastic cerebellar granule cell precursors; PLSD, protected least significant difference; P7, postnatal day 7; Prmt1, protein arginine methyltransferase 1; Ptch1, Patched1 gene; SEM, standard error of the mean; Shh, Sonic hedgehog; TRITC, tetramethylrhodamine; WT, wild-type.
References
1. Rouault JP, Rimokh R, Tessa C, Paranhos G, Ffrench M, Duret L, et al. BTG1, a member of a new family of antiproliferative genes. EMBO J. (1992) 11:1663–70. doi: 10.1002/j.1460-2075.1992.tb05213.x
2. Tirone F. The gene PC3(TIS21/BTG2), prototype member of the PC3/BTG/TOB family: regulator in control of cell growth, differentiation, and DNA repair? J Cell Physiol. (2001) 187:155–65. doi: 10.1002/jcp.1062
3. Lin WJ, Gary JD, Yang MC, Clarke S, Herschman HR. The mammalian immediate-early TIS21 protein and the leukemia-associated BTG1 protein interact with a protein-arginine N-methyltransferase. J Biol Chem. (1996) 271:15034–44. doi: 10.1074/jbc.271.25.15034
4. Prévôt D, Voeltzel T, Birot AM, Morel AP, Rostan MC, Magaud JP, et al. The leukemia-associated protein Btg1 and the p53-regulated protein Btg2 interact with the homeoprotein Hoxb9 and enhance its transcriptional activation. J Biol Chem. (2000) 275:147–53. doi: 10.1074/jbc.275.1.147
5. Busson M, Carazo A, Seyer P, Grandemange S, Casas F, Pessemesse L, et al. Coactivation of nuclear receptors and myogenic factors induces the major BTG1 influence on muscle differentiation. Oncogene. (2005) 24:1698–710. doi: 10.1038/sj.onc.1208373
6. Rouault JP, Prévôt D, Berthet C, Birot AM, Billaud M, Magaud JP, et al. Interaction of BTG1 and p53-regulated BTG2 gene products with mCaf1, the murine homolog of a component of the yeast CCR4 transcriptional regulatory complex. J Biol Chem. (1998) 273:22563–9. doi: 10.1074/jbc.273.35.22563
7. Suk K, Sipes DG, Erickson KL. Enhancement of B-cell translocation gene-1 expression by prostaglandin E2 in macrophages and the relationship to proliferation. Immunology. (1997) 91:121–9. doi: 10.1046/j.1365-2567.1997.00235.x
8. Bakker WJ, Blázquez-Domingo M, Kolbus A, Besooyen J, Steinlein P, Beug H, et al. FoxO3a regulates erythroid differentiation and induces BTG1, an activator of protein arginine methyltransferase 1. J Cell Biol. (2004) 164:175–84. doi: 10.1083/jcb.200307056
9. Lee H, Cha S, Lee MS, Cho GJ, Choi WS, Suk K. Role of antiproliferative B cell translocation gene-1 as an apoptotic sensitizer in activation-induced cell death of brain microglia. J Immunol. (2003) 171:5802–11. doi: 10.4049/jimmunol.171.11.5802
10. Rodier A, Marchal-Victorion S, Rochard P, Casas F, Cassar-Malek I, Rouault JP, et al. BTG1: a triiodothyronine target involved in the myogenic influence of the hormone. Exp Cell Res. (1999) 249:337–48. doi: 10.1006/excr.1999.4486
11. Farioli-Vecchioli S, Micheli L, Saraulli D, Ceccarelli M, Cannas S, Scardigli R, et al. Btg1 is required to maintain the pool of stem and progenitor cells of the dentate gyrus and subventricular zone. Front Neurosci. (2012) 6:124. doi: 10.3389/fnins.2012.00124
12. Ceccarelli M, Micheli L, D'Andrea G, De Bardi M, Scheijen B, Ciotti M, et al. Altered cerebellum development and impaired motor coordination in mice lacking the Btg1 gene: Involvement of cyclin D1. Dev Biol. (2015) 408:109–25. doi: 10.1016/j.ydbio.2015.10.007
13. Corjay MH, Kearney MA, Munzer DA, Diamond SM, Stoltenborg JK. Antiproliferative gene BTG1 is highly expressed in apoptotic cells in macrophage-rich areas of advanced lesions in Watanabe heritable hyperlipidemic rabbit and human. Lab Invest. (1998) 78:847–58.
14. Yuniati L, Scheijen B, van der Meer LT, van Leeuwen FN. Tumor suppressors BTG1 and BTG2: Beyond growth control. J Cell Physiol. (2018) 234:5379–89. doi: 10.1002/jcp.27407
15. Zheng HC, Li J, Shen DF, Yang XF, Zhao S, Wu YZ, et al. BTG1 expression correlates with pathogenesis, aggressive behaviors and prognosis of gastric cancer: a potential target for gene therapy. Oncotarget. (2015) 6:19685–705. doi: 10.18632/oncotarget.4081
16. Sun G, Liu Q, Cheng Y, Hu W. B cell translocation gene 1 reduces the biological outcome of kidney cancer through induction of cell proliferation, cell cycle arrest, cell apoptosis and cell metastasis. Int J Mol Med. (2015) 35:777–83. doi: 10.3892/ijmm.2014.2058
17. Sun GG, Lu YF, Cheng YJ, Yang CR, Liu Q, Jing SW, et al. Expression of BTG1 in hepatocellular carcinoma and its correlation with cell cycles, cell apoptosis, and cell metastasis. Tumour Biol. (2014) 35:11771–9. doi: 10.1007/s13277-014-2298-x
18. Lu YF, Sun GG, Liu Q, Yang CR, Cheng YJ. BTG1 expression in thyroid carcinoma: diagnostic indicator and prognostic marker. Int J Oncol. (2014) 45:1574–82. doi: 10.3892/ijo.2014.2543
19. Sun GG, Wang YD, Cheng YJ, Hu WN. The expression of BTG1 is downregulated in nasopharyngeal carcinoma and possibly associated with tumour metastasis. Mol Biol Rep. (2014) 41:5979–88. doi: 10.1007/s11033-014-3475-0
20. Zhao Y, Gou WF, Chen S, Takano Y, Xiu YL, Zheng HC. BTG1 expression correlates with the pathogenesis and progression of ovarian carcinomas. Int J Mol Sci. (2013) 14:19670–80. doi: 10.3390/ijms141019670
21. Zhu R, Zou ST, Wan JM, Li W, Li XL, Zhu W. BTG1 inhibits breast cancer cell growth through induction of cell cycle arrest and apoptosis. Oncol Rep. (2013) 30:2137–44. doi: 10.3892/or.2013.2697
22. Li W, Zou ST, Zhu R, Wan JM, Xu Y, Wu HR. B-cell translocation 1 gene inhibits cellular metastasis-associated behavior in breast cancer. Mol Med Rep. (2014) 9:2374–80. doi: 10.3892/mmr.2014.2118
23. Sun GG, Lu YF, Cheng YJ, Hu WN. The expression of BTG1 is downregulated in NSCLC and possibly associated with tumor metastasis. Tumour Biol. (2014) 35:2949–57. doi: 10.1007/s13277-013-1379-6
24. Su AI, Wiltshire T, Batalov S, Lapp H, Ching KA, Block D, et al. A gene atlas of the mouse and human protein-encoding transcriptomes. Proc Natl Acad Sci USA. (2004) 101:6062–7. doi: 10.1073/pnas.0400782101
25. Kamaid A, Giráldez F. Btg1 and Btg2 gene expression during early chick development. Dev Dyn. (2008) 237:2158–69. doi: 10.1002/dvdy.21616
26. Farioli-Vecchioli S, Mattera A, Micheli L, Ceccarelli M, Leonardi L, Saraulli D, et al. Running rescues defective adult neurogenesis by shortening the length of the cell cycle of neural stem and progenitor cells. Stem Cells. (2014) 32:1968–82. doi: 10.1002/stem.1679
27. Qian Y, Lu X, Li Q, Zhao S, Fang D. The treatment effects and the underlying mechanism of B cell translocation gene 1 on the oncogenesis of brain glioma. J Cell Biochem. (2019) 120:13310–20. doi: 10.1002/jcb.28605
28. Wang Y, Sun W, Yang J, Yang L, Li C, Liu H, et al. PUM2 Promotes glioblastoma cell proliferation and migration via repressing BTG1 expression. Cell Struct Funct. (2019) 44:29–39. doi: 10.1247/csf.18030
29. Micheli L, Ceccarelli M, Farioli-Vecchioli S, Tirone F. Control of the normal and pathological development of neural stem and progenitor cells by the PC3/Tis21/Btg2 and Btg1 genes. J Cell Physiol. (2015) 230:2881–90. doi: 10.1002/jcp.25038
30. Dahmane N, Ruiz i Altaba A. Sonic hedgehog regulates the growth and patterning of the cerebellum. Development. (1999) 126:3089–100.
31. Wallace VA. Purkinje-cell-derived sonic hedgehog regulates granule neuron precursor cell proliferation in the developing mouse cerebellum. Curr Biol. (1999) 9:445–8. doi: 10.1016/S0960-9822(99)80195-X
32. Wechsler-Reya RJ, Scott MP. Control of neuronal precursor proliferation in the cerebellum by Sonic Hedgehog. Neuron. (1999) 22:103–14. doi: 10.1016/S0896-6273(00)80682-0
33. Fujita S, Shimada M, Nakamura T. H3-thymidine autoradiographic studies on the cell proliferation and differentiation in the external and the internal granular layers of the mouse cerebellum. J Comp Neurol. (1966) 128:191–208. doi: 10.1002/cne.901280206
34. Rakic P. Neuron-glia relationship during granule cell migration in developing cerebellar cortex. a Golgi and electron microscopic study in Macacus Rhesus. J Comp Neurol. (1971) 141:283–312. doi: 10.1002/cne.901410303
35. Wang VY, Zoghbi HY. Genetic regulation of cerebellar development. Nat Rev Neurosci. (2001) 2:484–91. doi: 10.1038/35081558
36. Kadin ME, Rubinstein LJ, Nelson JS. Neonatal cerebellar medulloblastoma originating from the fetal external granular layer. J Neuropathol Exp Neurol. (1970) 29:583–600. doi: 10.1097/00005072-197010000-00005
37. Schüller U, Heine VM, Mao J, Kho AT, Dillon AK, Han YG, et al. Acquisition of granule neuron precursor identity is a critical determinant of progenitor cell competence to form Shh-induced medulloblastoma. Cancer Cell. (2008) 14:123–34. doi: 10.1016/j.ccr.2008.07.005
38. Yang ZJ, Ellis T, Markant SL, Read TA, Kessler JD, Bourboulas M, et al. Medulloblastoma can be initiated by deletion of Patched in lineage-restricted progenitors or stem cells. Cancer Cell. (2008) 14:135–45. doi: 10.1016/j.ccr.2008.07.003
39. Gibson P, Tong Y, Robinson G, Thompson MC, Currle DS, Eden C, et al. Subtypes of medulloblastoma have distinct developmental origins. Nature. (2010) 468:1095–9. doi: 10.1038/nature09587
40. Farioli-Vecchioli S, Tanori M, Micheli L, Mancuso M, Leonardi L, Saran A, et al. Inhibition of medulloblastoma tumorigenesis by the antiproliferative and pro-differentiative gene PC3. FASEB J. (2007) 21:2215–25. doi: 10.1096/fj.06-7548com
41. Presutti D, Ceccarelli M, Micheli L, Papoff G, Santini S, Samperna S, et al. Tis21-gene therapy inhibits medulloblastoma growth in a murine allograft model. PLoS ONE. (2018) 13:e0194206. doi: 10.1371/journal.pone.0194206
42. Farioli-Vecchioli S, Cinà I, Ceccarelli M, Micheli L, Leonardi L, Ciotti MT, et al. Tis21 knock-out enhances the frequency of medulloblastoma in Patched1 heterozygous mice by inhibiting the Cxcl3-dependent migration of cerebellar neurons. J Neurosci. (2012) 32:15547–64. doi: 10.1523/JNEUROSCI.0412-12.2012
43. Farioli-Vecchioli S, Micheli L, Leonardi L, Ceccarelli M, Cavallaro S, Tirone F. Medulloblastoma or not? Crucial role in tumorigenesis of the timing of migration of cerebellar granule precursor cells, regulated by Nos2 and Tis21. Front Neurosci. (2013) 6:198. doi: 10.3389/fnins.2012.00198
44. Sakamaki J, Daitoku H, Ueno K, Hagiwara A, Yamagata K, Fukamizu A. Arginine methylation of BCL-2 antagonist of cell death (BAD) counteracts its phosphorylation and inactivation by Akt. Proc Natl Acad Sci USA. (2011) 108:6085–90. doi: 10.1073/pnas.1015328108
45. Hahn H, Wojnowski L, Zimmer AM, Hall J, Miller G, Zimmer A. Rhabdomyosarcomas and radiation hypersensitivity in a mouse model of Gorlin syndrome. Nat Med. (1998) 4:619–22. doi: 10.1038/nm0598-619
46. Lumpkin EA, Collisson T, Parab P, Omer-Abdalla A, Haeberle H, Chen P, et al. Math1-driven GFP expression in the developing nervous system of transgenic mice. Gene Exp Patterns. (2003) 3:389–95. doi: 10.1016/S1567-133X(03)00089-9
47. Oliver TG, Read TA, Kessler JD, Mehmeti A, Wells JF, Huynh TT, et al. Loss of patched and disruption of granule cell development in a pre-neoplastic stage of medulloblastoma. Development. (2005) 132:2425–39. doi: 10.1242/dev.01793
48. Canzoniere D, Farioli-Vecchioli S, Conti F, Ciotti MT, Tata AM, Augusti-Tocco G, et al. Dual control of neurogenesis by PC3 through cell cycle inhibition and induction of Math1. J Neurosci. (2004) 24:3355–69. doi: 10.1523/JNEUROSCI.3860-03.2004
49. Qiu Z, Cang Y, Goff SP. Abl family tyrosine kinases are essential for basement membrane integrity and cortical lamination in the cerebellum. J Neurosci. (2010) 30:14430–9. doi: 10.1523/JNEUROSCI.2861-10.2010
50. Livak KJ, Schmittgen TD. Analysis of relative gene expression data using real-time quantitative PCR and the 2[-Delta Delta C(T)] Method. Methods. (2001) 25:402–8. doi: 10.1006/meth.2001.1262
51. Ye J, Coulouris G, Zaretskaya I, Cutcutache I, Rozen S, Madden T. Primer-BLAST: a tool to design target-specific primers for polymerase chain reaction. BMC Bioinform. (2012) 13:134. doi: 10.1186/1471-2105-13-134
52. Pazzaglia S, Mancuso M, Atkinson MJ, Tanori M, Rebessi S, Majo VD, et al. High incidence of medulloblastoma following X-ray-irradiation of newborn Ptc1 heterozygous mice. Oncogene. (2002) 21:7580–4. doi: 10.1038/sj.onc.1205973
53. Scholzen T, Gerdes J. The Ki-67 protein: from the known and the unknown. J Cell Physiol. (2000) 182:311–22. doi: 10.1002/(SICI)1097-4652(200003)182:3<311::AID-JCP1>3.0.CO;2-9
54. Matsuo S, Takahashi M, Inoue K, Tamura K, Irie K, Kodama Y, et al. Thickened area of external granular layer and Ki-67 positive focus are early events of medulloblastoma in Ptch1(+/–) mice. Exp Toxicol Pathol. (2013) 65:863–79. doi: 10.1016/j.etp.2012.12.005
55. Goodrich LV, Milenković L, Higgins KM, Scott MP. Altered neural cell fates and medulloblastoma in mouse patched mutants. Science. (1997) 277:1109–13. doi: 10.1126/science.277.5329.1109
56. Kessler JD, Hasegawa H, Brun SN, Emmenegger BA, Yang ZJ, Dutton JW, et al. N-myc alters the fate of preneoplastic cells in a mouse model of medulloblastoma. Genes Dev. (2009) 23:157–70. doi: 10.1101/gad.1759909
57. Miyata T, Maeda T, Lee JE. NeuroD is required for differentiation of the granule cells in the cerebellum and hippocampus. Genes Dev. (1999) 13:1647–52. doi: 10.1101/gad.13.13.1647
58. Weyer A, Schilling K. Developmental and cell type-specific expression of the neuronal marker NeuN in the murine cerebellum. J Neurosci Res. (2003) 73:400–9. doi: 10.1002/jnr.10655
59. Li M, An W, Xu L, Lin Y, Su L, Liu X. The arginine methyltransferase PRMT5 and PRMT1 distinctly regulate the degradation of anti-apoptotic protein CFLAR(L) in human lung cancer cells. J Exp Clin Cancer Res. (2019) 38:64. doi: 10.1186/s13046-019-1064-8
60. Ryu TY, Kim K, Son MY, Min JK, Kim J, Han TS, et al. Downregulation of PRMT1, a histone arginine methyltransferase, by sodium propionate induces cell apoptosis in colon cancer. Oncol Rep. (2019) 41:1691–9. doi: 10.3892/or.2018.6938
61. Singh SK, Clarke ID, Terasaki M, Bonn VE, Hawkins C, Squire J, et al. Identification of a cancer stem cell in human brain tumors. Cancer Res. (2003) 63:5821–8.
62. Singh SK, Hawkins C, Clarke ID, Squire JA, Bayani J, Hide T, et al. Identification of human brain tumour initiating cells. Nature. (2004) 432:396–401. doi: 10.1038/nature03128
63. Rao G, Pedone CA, Del Valle L, Reiss K, Holland EC, Fults DW. Sonic hedgehog and insulin-like growth factor signaling synergize to induce medulloblastoma formation from nestin-expressing neural progenitors in mice. Oncogene. (2004) 23:6156–62. doi: 10.1038/sj.onc.1207818
64. Mao XG, Zhang X, Xue XY, Guo G, Wang P, Zhang W, et al. Brain tumor stem-like cells identified by neural stem cell marker CD15. Transl Oncol. (2009) 2:247–57. doi: 10.1593/tlo.09136
65. Read TA, Fogarty MP, Markant SL, McLendon RE, Wei Z, Ellison DW, et al. Identification of CD15 as a marker for tumor-propagating cells in a mouse model of medulloblastoma. Cancer Cell. (2009) 15:135–47. doi: 10.1016/j.ccr.2008.12.016
66. Son MJ, Woolard K, Nam DH, Lee J, Fine HA. SSEA-1 is an enrichment marker for tumor-initiating cells in human glioblastoma. Cell Stem Cell. (2009) 4:440–52. doi: 10.1016/j.stem.2009.03.003
67. Ward RJ, Lee L, Graham K, Satkunendran T, Yoshikawa K, Ling E, et al. Multipotent CD15+ cancer stem cells in patched-1-deficient mouse medulloblastoma. Cancer Res. (2009) 69:4682–90. doi: 10.1158/0008-5472.CAN-09-0342
68. Dirks PB. Brain tumor stem cells: the cancer stem cell hypothesis writ large. Mol Oncol. (2010) 4:420–30. doi: 10.1016/j.molonc.2010.08.001
69. Vanner RJ, Remke M, Gallo M, Selvadurai HJ, Coutinho F, Lee L, et al. Quiescent sox2(+) cells drive hierarchical growth and relapse in sonic hedgehog subgroup medulloblastoma. Cancer Cell. (2014) 26:33–47. doi: 10.1016/j.ccr.2014.05.005
70. Massimino M, Biassoni V, Gandola L, Garrè ML, Gatta G, Giangaspero F, et al. Childhood medulloblastoma. Crit Rev Oncol Hematol. (2016) 105:35–51. doi: 10.1016/j.critrevonc.2016.05.012
71. Brandão LA, Young Poussaint T. Posterior Fossa tumors. Neuroimaging Clin N Am. (2017) 27:1–37. doi: 10.1016/j.nic.2016.08.001
72. Louis DN, Ohgaki H, Wiestler OD, Cavenee WK. WHO Classification of Tumors of the Central Nervous System. Lyon: IARC Press (2007). p. 312.
73. Gottardo NG, Gajjar A. Chemotherapy for malignant brain tumors of childhood. J Child Neurol. (2008) 23:1149–59. doi: 10.1177/0883073808321765
74. Ceccarelli M, Micheli L, Tirone F. Suppression of Medulloblastoma lesions by forced migration of preneoplastic precursor cells with intracerebellar administration of the Chemokine Cxcl3. Front Pharmacol. (2016) 7:484. doi: 10.3389/fphar.2016.00484
75. Noguchi KK, Cabrera OH, Swiney BS, Salinas-Contreras P, Smith JK, Farber NB. Hedgehog regulates cerebellar progenitor cell and medulloblastoma apoptosis. Neurobiol Dis. (2015) 83:35–43. doi: 10.1016/j.nbd.2015.08.020
76. Lee EY, Hu N, Yuan SS, Cox LA, Bradley A, Lee WH, et al. Dual roles of the retinoblastoma protein in cell cycle regulation and neuron differentiation. Genes Dev. (1994) 8:2008–21. doi: 10.1101/gad.8.17.2008
77. Speidel D. Transcription-independent p53 apoptosis: an alternative route to death. Trends Cell Biol. (2010) 20:14–24. doi: 10.1016/j.tcb.2009.10.002
78. Aguirre-Ghiso JA. Models, mechanisms and clinical evidence for cancer dormancy. Nat Rev Cancer. (2007) 7:834–46. doi: 10.1038/nrc2256
79. Honda M, Nakashima K, Katada S. PRMT1 regulates astrocytic differentiation of embryonic neural stem/precursor cells. J Neurochem. (2017) 142:901–7. doi: 10.1111/jnc.14123
80. Rhodes DR, Yu J, Shanker K, Deshpande N, Varambally R, Ghosh D, et al. ONCOMINE: a cancer microarray database and integrated data-mining platform. Neoplasia. (2004) 6:1–6. doi: 10.1016/S1476-5586(04)80047-2
Keywords: cerebellum neurogenesis, medulloblastoma, neoplastic granule cell precursors, apoptosis, proliferation, protein arginine methyltransferase 1 (Prmt1), B-cell translocation gene 1 (Btg1), Sonic hedgehog (Shh)
Citation: Ceccarelli M, D'Andrea G, Micheli L and Tirone F (2020) Deletion of Btg1 Induces Prmt1-Dependent Apoptosis and Increased Stemness in Shh-Type Medulloblastoma Cells Without Affecting Tumor Frequency. Front. Oncol. 10:226. doi: 10.3389/fonc.2020.00226
Received: 01 November 2019; Accepted: 10 February 2020;
Published: 13 March 2020.
Edited by:
Vidya Gopalakrishnan, University of Texas MD Anderson Cancer Center, United StatesReviewed by:
Donghang Cheng, University of Texas MD Anderson Cancer Center, United StatesRajeev Vibhakar, University of Colorado, United States
Copyright © 2020 Ceccarelli, D'Andrea, Micheli and Tirone. This is an open-access article distributed under the terms of the Creative Commons Attribution License (CC BY). The use, distribution or reproduction in other forums is permitted, provided the original author(s) and the copyright owner(s) are credited and that the original publication in this journal is cited, in accordance with accepted academic practice. No use, distribution or reproduction is permitted which does not comply with these terms.
*Correspondence: Manuela Ceccarelli, bWFudS5jZWNjYXJlbGxpQGdtYWlsLmNvbQ==; Felice Tirone, ZmVsaWNlLnRpcm9uZUBjbnIuaXQ=