 Ying Zhang
 Yuqing Liu
 Hanjie Liu
 Zheng Zhao
 Fan Wu
 Fan Zeng
- 1Department of Molecular Neuropathology, Beijing Neurosurgical Institute, Capital Medical University, Beijing, China
- 2Chinese Glioma Genome Atlas Network (CGGA) and Asian Glioma Genome Atlas Network (AGGA), Beijing, China
Methylation of DNA, RNA or protein is a reversible modification. The proteins and genes that regulate this modification can be a candidate target for tumor therapy. However, the characteristics of methyltransferase related genes in glioma remain obscure. In this study, we systematically analyzed the relationship between methyltransferase-related genes expression profiles and outcomes in glioma patients based on The Cancer Genome Atlas and Chinese Glioma Genome Atlas RNA sequencing datasets. Consensus clustering identified two robust groups with significantly different pathological features and prognosis. Then a methyltransferase-related risk signature was built by a Cox proportional hazards model with elastic net penalty. Moreover, the risk score is associated with patients' clinical and molecular features and can be used as an independent prognostic indicator for patients with glioma. Furthermore, genes associated with the high-risk group were involved in various aspects of the malignant progression of glioma via Gene Ontology analysis and Gene Set Enrichment Analysis. In summary, our study identified a methyltransferase-related risk signature for predicting the prognosis of gliomas.
Introduction
In the central dogma of molecular biology, genetic information flows from DNA, RNA to proteins (1). Reversible epigenetic modifications can influence gene expression without altering the DNA sequence, and thus determine cell differentiation and development. DNA modifications, RNA modifications, protein modifications, and nucleosome remodeling are all in the field of epigenetics. These modifications comprise methylation, acetylation, phosphorylation, ribosylation, sumoylation, parylation, citrullination, ubiquitylation, etc (2). Among them, methylation is widely studied and is defined as an important and extensive epigenetic modification. Depending on the substrate, this modification can be divided into DNA, RNA or protein methylation, which are mediated by corresponding methyltransferase.
In mammals, DNA methyltransferases (DNMTs) maintain DNA methylation via transferring methyl group to cytosines of CpG dinucleotide islands. Aberant DNA hypermethylation of tumor suppressor gene promoter region results in gene silencing, which subsequently leads to dysregulation of diverse signaling pathways associated with human malignancies (3). O-6-methylguanine-DNA methyltransferase (MGMT) is involved in cellular defense against the toxicity of alkylating agents such as temozolomide (TMZ) (4). Patients with glioblastoma (GBM) containing a methylated MGMT promoter can benefited from TMZ therapy (5). MGMT promoter status has been identified as a biomarker for TMZ response in GBM patients.
Approximately 150 chemical modifications have been identified in eukaryotic cellular RNAs. The spectrum of major physiological mRNA methylation marks comprises methylations of adenosine to form N6-methyladenosine (m6A), N1-Methyladenosine (m1A) and N6, 2′-O-dimethyladenosine (m6Am), as well as cytosine methylation to 5-methylcytosine (m5C) and its oxidation product 5-hydroxymethylcytosine (hm5C) (6, 7). Among them, m6A is the most prevalent form of internal mRNA methylation. RNA methylation has diverse effects on RNA metabolism, including RNA processing, RNA splicing, mRNA export, mRNA translation, and decay (7). The m6A mRNA modification is critical for glioblastoma stem cells (GSCs) self-renewal and tumorigenesis (8). Knockdown of METTL3 or METTL14, key components of the RNA methyltransferase complex, dramatically promotes human GSC growth, self-renewal, and tumorigenesis (8). In contrast, overexpression of METTL3 or inhibition of the RNA demethylase FTO suppresses GSC growth and self-renewal (8). Moreover, the m6A demethylase ALKBH5 is highly expressed in GSCs, and silencing ALKBH5 suppresses the proliferation of patient-derived GSCs (9).
In eukaryotes, most protein methylation is implemented by two widely defined enzyme families: lysine methyltransferases (KMTs) and protein arginine methyltransferases (PRMTs), which modify the ε amino group of lysine (K) and the guanidinium group of arginine (R), respectively (10). In humans, over 4,000 K and R methylation sites have been identified, but the biological consequence of most is unknown (10). Histone proteins are a major and well-studied substrate of protein methyltransferases (PMTs). It is believed that methylation of K or R residues in the tail of histones largely decides the chromatin configurations, thus determining gene expression, cell fate and genomic stability (11). EZH2 is a catalytic component of polycomb repressive complex 2 (PRC2), which is responsible for the trimethylation of histone 3 on lysine 27 (H3K27me3) and induces gene silencing (12). EZH2 is a negative independent prognostic factor and exhibits tumor promoting activity in GBM (13). Meanwhile, methylation of several non-histone proteins participated in tumor-associated signaling pathways, including p53 (14, 15), RB1 (16, 17), NF-κB (18, 19), STAT3 (20), etc. EZH2 binds to and methylates STAT3, leading to enhanced STAT3 activity by increased tyrosine phosphorylation of STAT3 (20). The EZH2-STAT3 interaction preferentially occurs in GSCs and promotes its tumorigenicity (20).
Glioma is the most common primary malignant brain tumors, characterized by high recurrence rates, short survival time, high mortality, and treatment difficulties (21). Currently, the clinical outcomes for glioma patients are still poor even after standard treatments, including surgery, chemotherapy and radiation (22). An in-depth understanding of the molecular landscape of diffuse glioma reveals its characteristic genetic and epigenetic features and clarifies their pathogenic evolution (23–26). In 2016 WHO classification, mutations in the epigenetic modulator genes isocitrate dehydrogenase 1 or 2 (IDH1 or IDH2) and codeletion of chromosomal arms 1p/19q (1p/19q codel) have become key biomarkers for glioma classification (27, 28). It emphasized the role of genetic and epigenetic alterations as a driving force for glioma evolution. Methyltransferase-related genes play an important role in epigenetic regulation, including DNA, RNA, histone methylation. Some of striking members, such as EZH2 (13), FTO (8) and ALKBH5 (9), have been reported to play oncogenic roles in glioma genesis. However, the expression pattern of methyltransferase complex genes in glioma patients and its prognostic value remain to be further elucidated.
In this study, we systematically analyzed the characteristics of the methyltransferase-related genes in glioma based on TCGA (n = 601) and CGGA (n = 309) RNA sequencing datasets. We found that the methyltransferase genes could classify the glioma patients with significantly different clinical and molecular characteristics. And a risk signature with twelve methyltransferase-related genes was designed to predict prognosis of glioma patients.
Materials and Methods
Data Collection
The TCGA RNA sequencing (RNA-seq) dataset and corresponding clinical and molecular information, such as gender, age, grade, subtype, IDH status, 1p/19q status, MGMT promoter status, EGFR status, and survival information, were downloaded from TCGA database (http://www.cancergenome.nih.gov/) as training cohort. Similarly, the CGGA RNA-seq database (http://www.cgga.org.cn) with 309 glioma samples were obtained as validation cohort.
Consensus Clustering
Methyltransferase-related genes (GO_METHYLOSOME and GO_METHYLTRANSFERASE_COMPLEX) were obtained from Molecular Signature Database v5.1 (MSigDB) (http://www.broad.mit.edu/gsea/msigdb/) (29). After overlapping with genes in the TCGA and CGGA RNA-seq data sets, 89 and 84 methyltransferase-related genes, respectively, remained. Then we carried out consensus clustering with the R package “ConsensusClusterPlus.” The optimal number of subgroups was evaluated using cumulative distribution function (CDF) and consensus matrices (30).
Gene Signature Identification and Risk Score Construction
The prognostic value of methyltransferase-related genes in TCGA training cohort was computed by a univariate Cox regression analysis. P ≤ 0.05 is considered statistically significant. After that, the least absolute shrinkage and selection operator (LASSO) method was used to identify gene signature and obtain their respective coefficients (Coeff) value. According to the following formula, the risk score for each patient was calculated in TCGA training and CGGA validation cohorts.
Statistical Analysis
Patients in TCGA training and CGGA validation cohorts were separated into high-risk and low-risk groups by using the median risk score as a threshold. Kaplan–Meier survival analysis and 2-sided log-rank test were used to calculate the overall survival (OS) differences between stratified groups. Univariate and multivariate Cox regression analysis were used to determine independent prognostic factors, including gender, age at diagnosis, WHO grade, IDH status, 1p/19q status, MGMT promoter status, EGFR status, and risk score. ROC curve analysis was used to predict OS with R package “pROC.” Student's t-test and chi-square test were adopted to detect differences in pathology and molecular characteristics between different patient groups. All statistical analyses were conducted by SPSS 16.0 (Armonk, NY, USA) or R software, and P ≤ 0.05 was regarded as statistically significant.
Gene Ontology (GO) and Gene Set Enrichment Analysis (GSEA)
Biological process, cell component and protein-protein interactions among genes in the risk signature were analyzed by the STRING database (https://string-db.org/) (31). Pearson correlation analysis using R language to calculate genes that are positively and negatively correlated with risk scores in TCGA and CGGA datasets (|R| > 0.5, P < 0.0001). GO and KEGG pathway analysis were performed for functional annotation of the significantly correlated genes via the online Database for Annotation, Visualization and Integrated Discovery (DAVID, https://david.ncifcrf.gov/). Gene set enrichment analysis (GSEA, http://software.broadinstitute.org/gsea/index.jsp) was performed to identify gene sets of statistical difference between low-risk and high-risk groups.
Results
Classification of Gliomas Based on Methyltransferase-Related Genes
We obtained the methyltransferase-related gene expression profiling of 601 samples from the TCGA RNA-seq dataset, and the top 50 variable expression genes have been selected. Consensus clustering of the 601 samples could divided patients into two significantly different clusters (Figures 1A–C), and the heatmap of the two clusters has been shown in Figure 1D. We found that consensus clustering could make significant differences in the clinical and molecular characteristics of the two glioma clusters (Table 1). Cluster 1 patients were strikingly correlated with older age at diagnosis (64.24%, P < 0.0001), high grade (49.01%, P < 0.0001), classical or mesenchymal subtypes (56.95%, P < 0.0001), IDH wildtype (68.87%, P < 0.0001), 1p/19q non-codel (91.40%, P < 0.0001), MGMT promoter unmethylation (44.07%, P < 0.0001), and EGFR amplification (34.34%, P < 0.0001) by Chi-square test. Compared with patients in cluster 2, glioma patients in cluster 1 showed a shorter survival time (Log-rank, P < 0.0001, Figure 1E). Then, the similar results were shown in Figure S1 and Table S1 based on the CGGA RNA-seq dataset (n = 309). These results demonstrated that methyltransferase-related genes were associated with the malignancy and prognosis of diffuse gliomas.
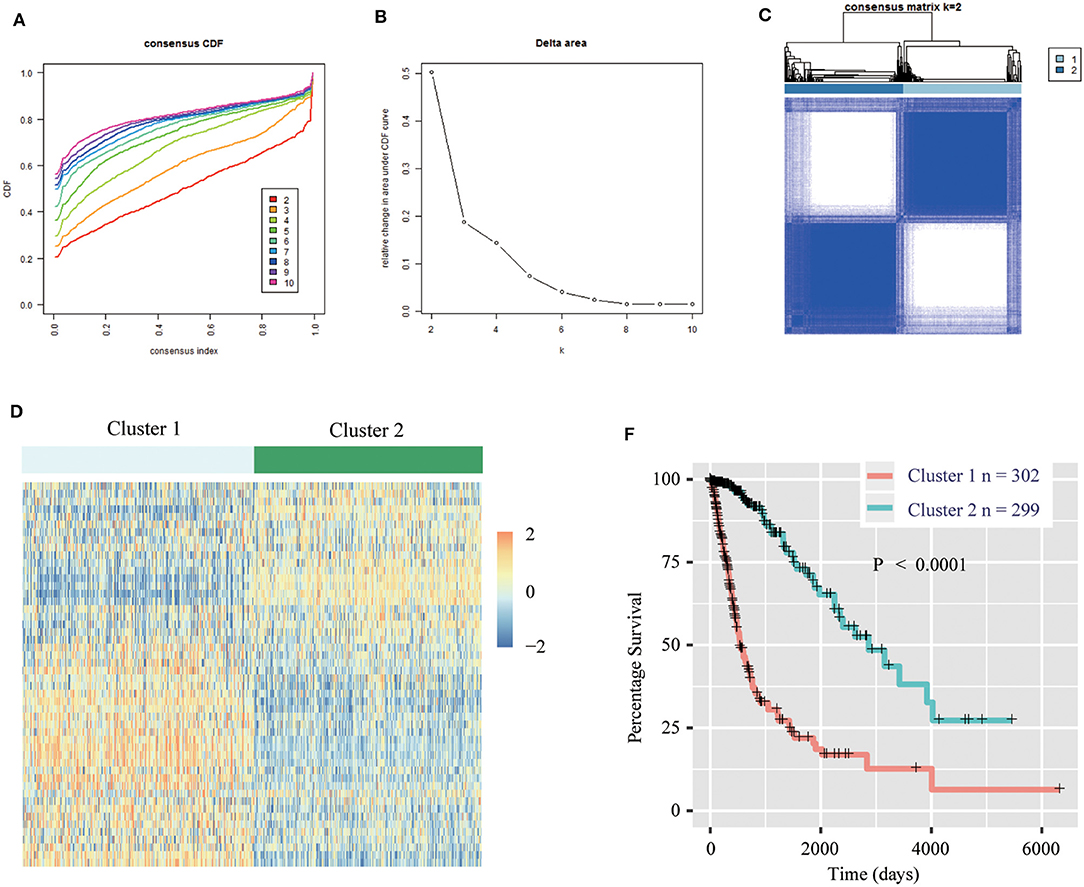
Figure 1. Methyltransferase-related genes could classify the clinical and molecular features of gliomas. (A) Consensus clustering cumulative distribution function (CDF) for k = 2 to k = 10. (B) Relative change in area under CDF curve according to various k values. (C) Consensus clustering matrix of 601 samples from TCGA dataset for k = 2. (D) Heat map of two clusters defined by the top 50 variable expression genes. (E) Survival analysis of patients in Cluster 1 and 2 in TCGA cohort.
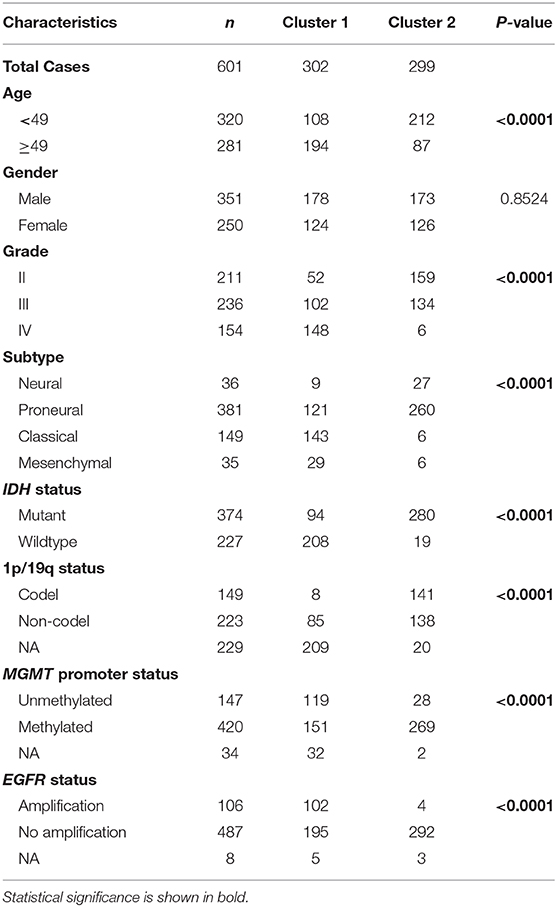
Table 1. Characteristics of patients in cluster 1 and 2 in TCGA cohort.
Construction of Prognostic Gene Signature Related to Methyltransferase Complex in Diffuse Glioma
First, we identified 65 genes that were statistically related with OS of glioma patients in TCGA training cohort via univariate Cox regression analysis (P < 0.05). Then, a 12-gene signature was identified by LASSO regression algorithm (Figures 2A,B), and their enrichment components, biological function and protein-protein interaction have been annotated by STRING (Figure S2). The risk scores for patients were calculated with their expression level and regression coefficients (Figures 2B,C). Patients were separated into high-risk and low-risk group by using the median risk score as a threshold. As shown in Figure 2C and Table 2, patients in high-risk group were mainly older, high grade, classical or mesenchymal subtype, IDH wildtype, 1p/19q non-codel, MGMT promoter unmethylated and EGFR amplification (P < 0.0001), while patients in low-risk group represented younger, lower grade, proneural or neural subtype, IDH mutant, 1p/19q codel, MGMT promoter methylated and without EGFR amplification (P < 0.0001). The same regression coefficients were applied in CGGA validation cohort to calculate risk scores of patients. Consistently, the similar difference between the two groups have been shown in Table S2.
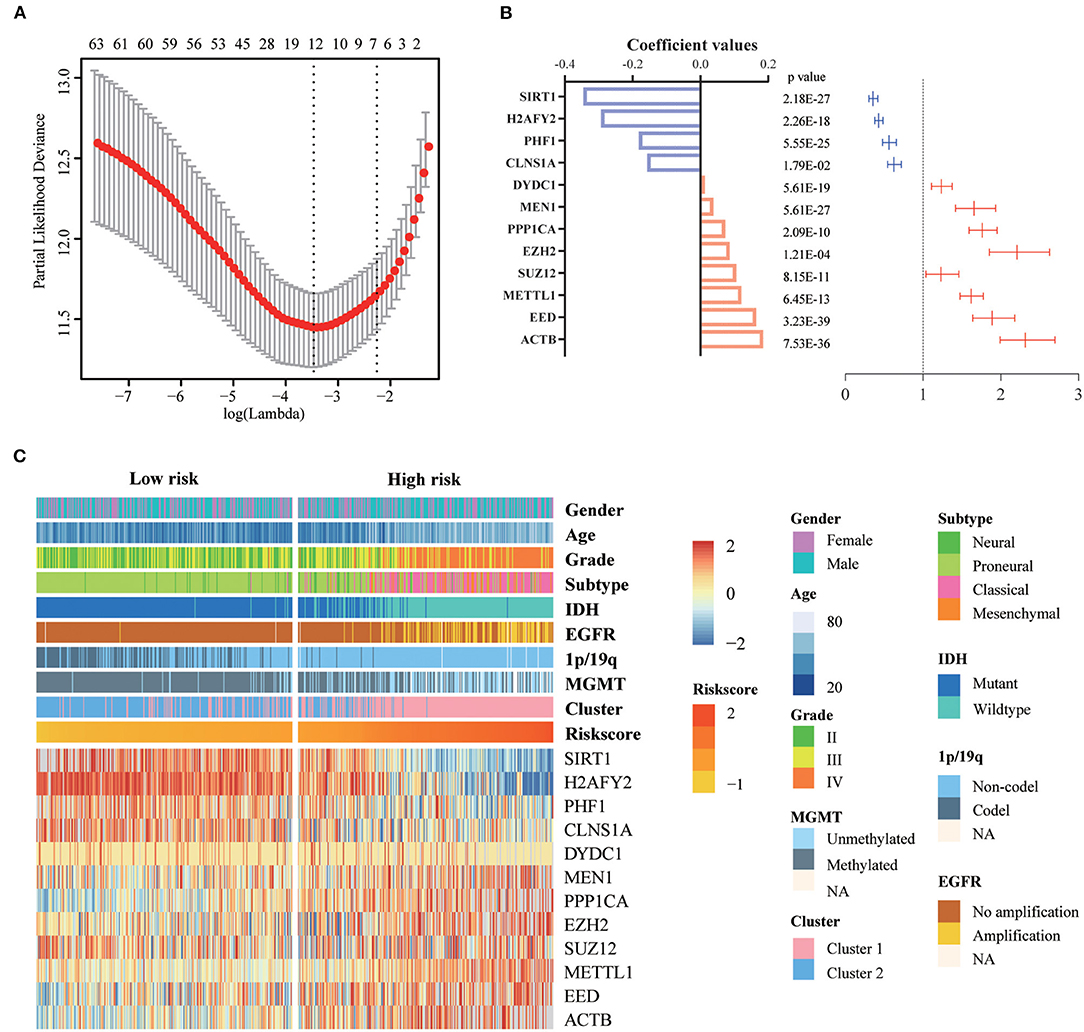
Figure 2. Identification of a 12-gene risk signature for OS by LASSO regression analysis in TCGA cohort. (A) Cross-validation for tuning parameter selection in the proportional hazards model. (B) Coefficient values and univariate Cox regression results for the 12 selected genes by LASSO. (C) Heatmap shows the association of risk scores and clinic pathological features based on the 12-gene risk signature. LASSO, Least Absolute Shrinkage and Selection Operator.
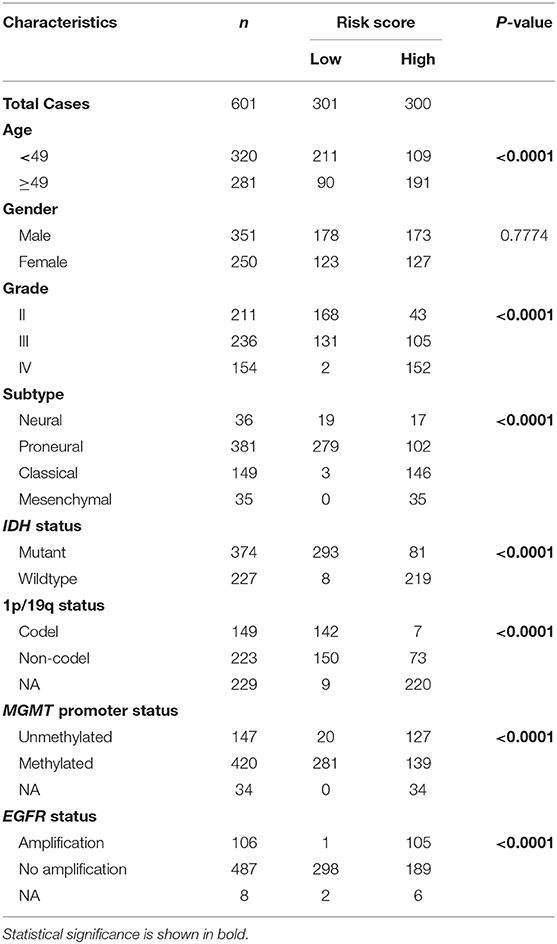
Table 2. Characteristics of patients in low and high risk scores in TCGA cohort.
Prognostic Risk Scores of the 12-Gene Signature Is Related With Pathological Characteristics in Glioma
We investigated the relationship between the risk scores of the 12-gene signature and the patients' pathological features. We observed that risk scores are significantly different between patients classified by age at diagnosis (P < 0.0001), WHO grade (P < 0.0001), IDH status (P < 0.0001), 1p/19q status (P < 0.0001), MGMT promoter status (P < 0.0001), EGFR status (P < 0.0001), different pathological features (P < 0.0001), TCGA subtype (P < 0.0001), and Cluster 1/2 (P < 0.0001), but not by gender in TCGA dataset (Figures 3A–J). The similar results were shown in CGGA dataset (Figures S3A–E,G–J), except EGFR status (Figure S3F). This is because the information of EGFR status in CGGA dataset is incomplete. Subsequently, we used the ROC curve to assess the specificity and sensitivity of risk scores in the prediction of pathological features by calculating the area under the curve (AUC) of risk score, age and grade. The risk score can perfectly predict Cluster 1/2 subgroups (AUC = 0.903 or 0.924), IDH mutant status (AUC = 0.979 or 0.925) and 1p/19q codel status (AUC = 0.816 or 0.723) in TCGA and CGGA datasets, which were higher than age and grade (Figures 3K–M, Figures S3K–M).
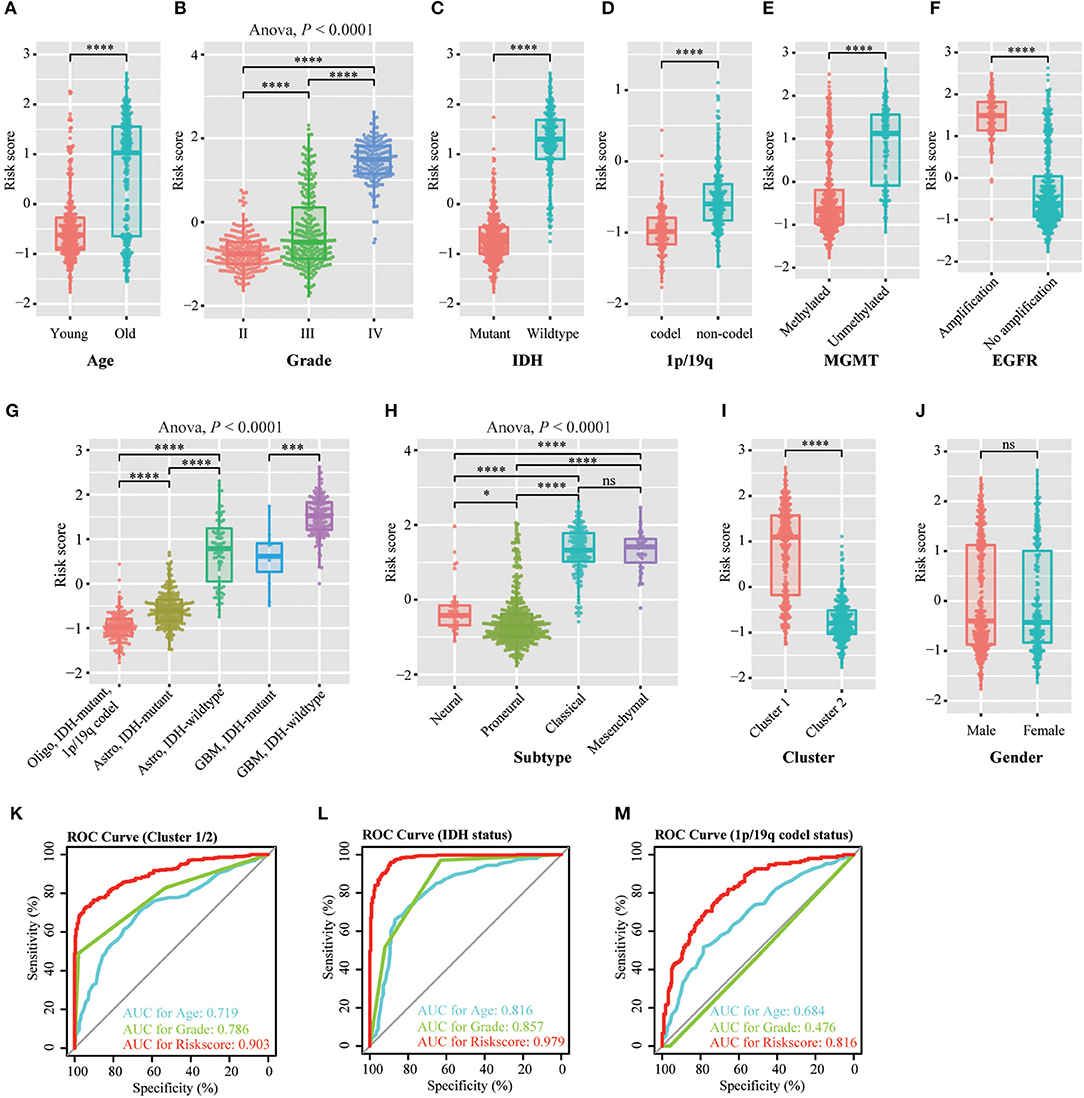
Figure 3. Association between the methyltransferase-related signature and other pathological features in TCGA cohort. (A–J) Distribution of the risk score in patients stratified by age (A), WHO grade (B), IDH status (C), 1p/19q status (D), MGMT promoter status (E), EGFR status (F), different pathological features (G), TCGA subtype (H), cluster (I) and gender (J). (K–M) ROC curves showed the predictive efficiency of the risk signature, Cluster 1/2 subgroups (K), IDH status (L) and 1p/19q status (M). ****P < 0.0001; ***P < 0.001; *P < 0.05; ns, no significant.
Assessment of the Prognostic Value of the 12-Gene Signature
To evaluate the prognostic value of the signature, patients were separated into high-risk and low-risk group by using the median risk score as a threshold. By Kaplan–Meier survival analysis, the overall survival time of patients in the low-risk group were statistically longer than that in the high-risk group in the TCGA RNA-seq cohort (P < 0.0001, Figure 4A). Then, we explored the prognostic value of the 12-gene signature in patients with lower-grade glioma (LGG, WHO grade II and III) and GBM (WHO grade IV), respectively. High-risk scores in patients with LGG and GBM were significantly associated with lower overall survival time (P < 0.0001, P = 1e-4, Figures 4B,C). Then, we separately stratified patients by IDH status, MGMT promoter status and EGFR status, and investigated the prognostic value of this signature in subgroups. The comparable results were demonstrated in stratified patients (all P < 0.01, Figures 4D–I). Consistently, the prognostic significance of this 12-gene signature was verified in CGGA validation cohort (all P < 0.05, Figures S4A–G, I), except EGFR amplification group which only contain four samples (P = 0.3173, Figure S4H). In further analysis, the results showed that high risk score had a worse prognosis in LGG with IDH-mutant subgroup in both cohorts (P = 0.01 and 0.0026, Figure 4J, Figure S4J), but no significant difference in GBM IDH-mutant subgroup (P > 0.05, Figure 4L, Figure S4L). In LGG IDH-wildtype (Figure 4K, Figure S4K) and GBM IDH-wildtype (Figure 4M, Figure S4M) subgroups, we did not get consensus results in TCGA and CGGA RNA-seq datasets, which probably due to the small sample size or racial differences.
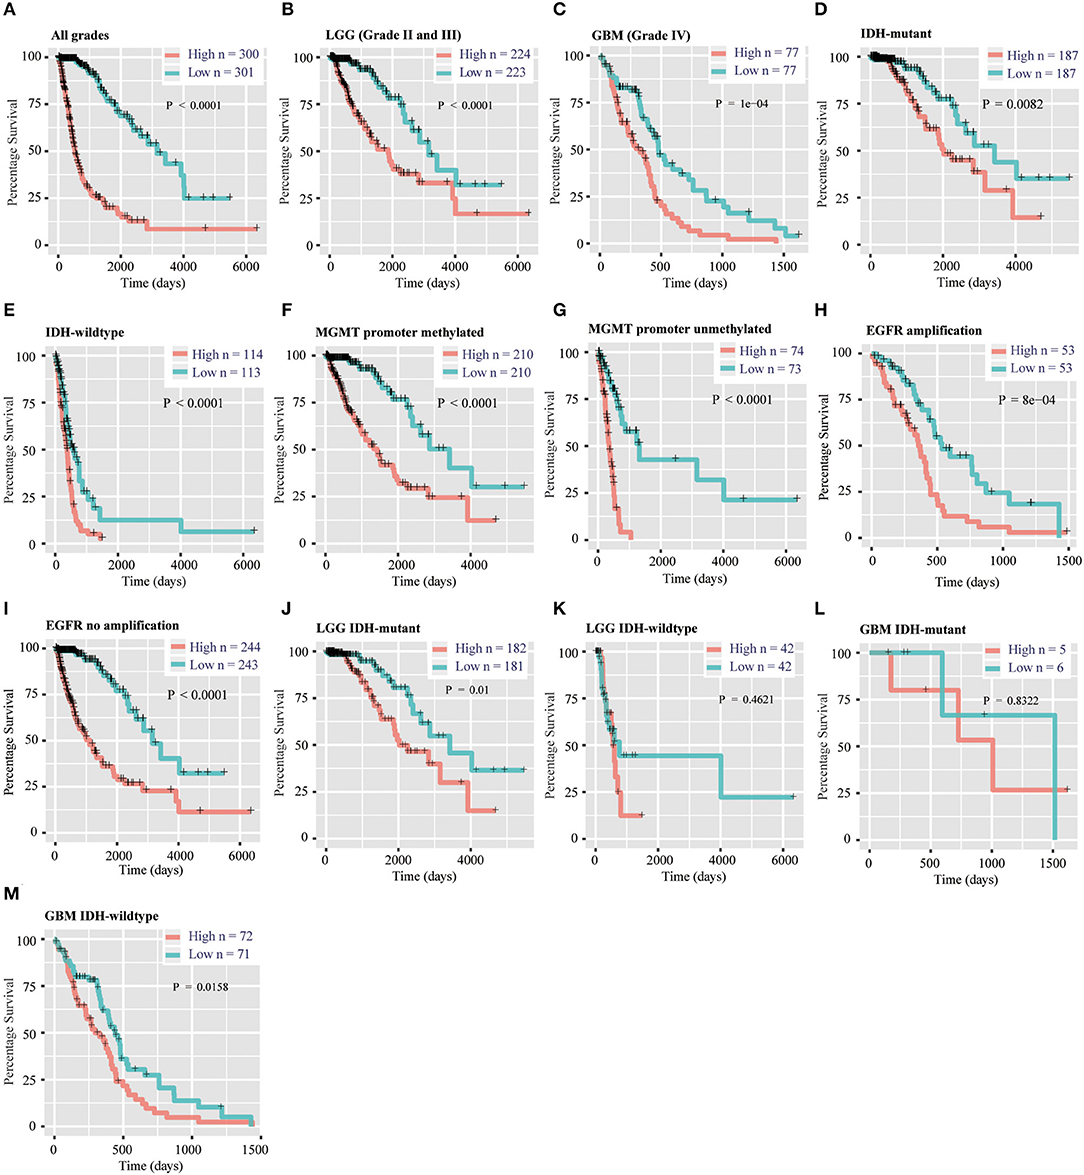
Figure 4. Prognostic significance of the 12-gene signature derived risk scores in TCGA cohort. (A–C) Prognosis efficiency of the 12-gene risk signature in all grades (A), LGG (B) and GBM (C) in TCGA cohort. (D–I) Outcome prediction of the 12-gene signature in patients stratified by IDH status (D,E), MGMT promoter status (F,G) and EGFR status (H,I) in TCGA cohort. (J–K) Kaplan–Meier survival curves for LGG patients with IDH-mutant (J) and IDH-wildtype (K), classified into two groups based on 12-gene signature derived risk scores. (L–M) Kaplan–Meier survival curves for GBM patients with IDH-mutant (L) and IDH-wildtype (M), classified into two groups based on 12-gene signature derived risk scores. LGG, lower-grade glioma; GBM, glioblastoma; OS, overall survival.
The Risk Score of 12-Gene Signature Is an Independent Prognostic Indicator
Then, we used uni- and multi-variate Cox analysis to evaluate whether the risk score is an independent prognostic indicator. As shown in Table 3 and Figure 5A, factors including age at diagnosis, WHO grade, IDH status, MGMT promoter status, EGFR status and risk score were statistically related with the overall survival (OS) of glioma patients. Among them, age at diagnosis (HR, 1.053; 95% CI, 1.037–1.069; P = 3.60E-11) and risk score (HR, 2.684; 95% CI, 1.935–3.722; P = 3.28E-09) were independent prognostic indicators for OS in patients with gliomas in TCGA dataset (Table 3, Figure 5A). Similar results were found in the CGGA validation dataset; WHO grade (HR, 2.335; 95% CI, 1.412–3.861; P = 9.51E-04) and the risk score (HR, 1.936; 95% CI, 1.365–2.745; P = 2.12E-04) were independent prognostic indicators for OS in patients with gliomas (Table S3, Figure S5A). Compared to the traditional factors age (AUC = 0.804 or 0.771) and grade (AUC = 0.829 or 0.808), the risk score (AUC = 0.872 or 0.842) showed striking prognostic predictive efficiency for 3 and 5 years survival rates in TCGA dataset (Figures 5B,C). Consistently, The AUC of risk score (AUC = 0.789 or 0.778) was substantially higher than that of age (AUC = 0.654 or 0.635) and grade (AUC = 0.778 or 0.751) in CGGA validation cohort (Figures S5B,C). Taken together, the above results indicated that the risk score of 12-gene signature was an independent prognostic indicator for OS in diffuse glioma patients.
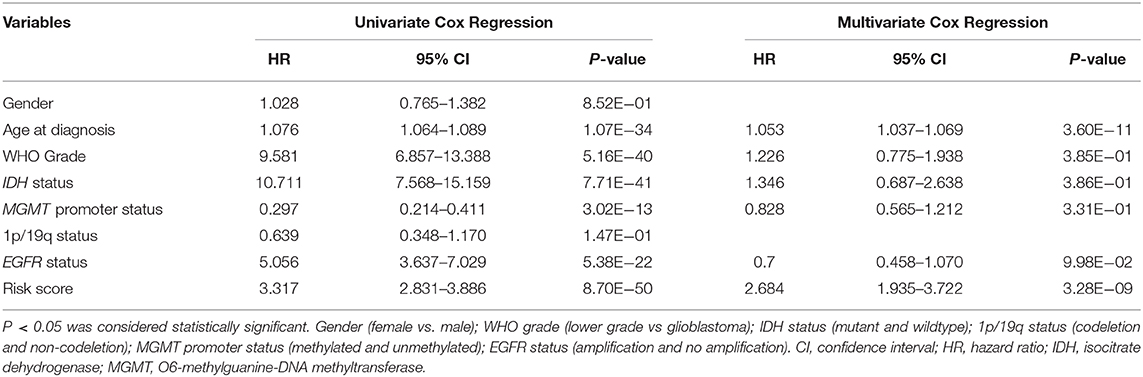
Table 3. Univariate and multivariate Cox regression analysis of clinical pathologic features for OS in TCGA cohort.
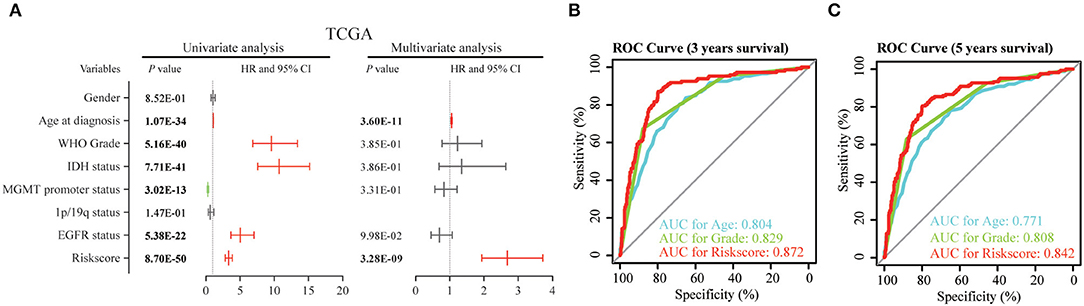
Figure 5. Univariate and multivariate analysis shows prognostic value of 12-gene signature in the TCGA dataset. (A) Univariate and multivariate Cox regression analyses of the association between clinic pathological factors and OS of patients in the TCGA dataset. (B,C) The receiver operator characteristic (ROC) curves to predict the sensitivity and specificity of 3 and 5 years survival according to the 12-gene signature derived risk scores in TCGA cohort. OS, overall survival.
Biological Characteristics and Pathway Analysis of 12-Gene Signature
To explore the potential function of 12 gene signature, we first used Pearson correlation analysis to determine genes that were statistically positively (R > 0.5, P < 0.0001) or negatively (R < – 0.5, P < 0.0001) related with the risk sore of gene signature in TCGA and CGGA datasets. Totally, 867 positively and 787 negatively correlated genes were identified in these two data sets. Then their biological characteristics and pathway were annotated by GO terms and KEGG pathway (P < 0.05, Benjamini and Hochberg method). Positively related genes were mainly involved in biological process (BP), including immune response (such as inflammatory response, interferon-gamma-mediated signaling pathway, response to interferon-gamma), extracellular matrix organization, cell adhesion, angiogenesis (Figure 6A). The most enriched cellular component (CC) terms were extracellular component (extracellular exosome, extracellular space, extracellular matrix), membrane system (membrane, cell surface, membrane raft) and focal adhesion (Figure 6B). The most enriched molecular function (MF) terms were protein binding (Figure 6C). The most enriched pathways were focal adhesion, phagosome, ECM-receptor interaction, leukocyte transendothelial migration, complement and coagulation cascades by KEGG pathway analysis (Figure 6D).
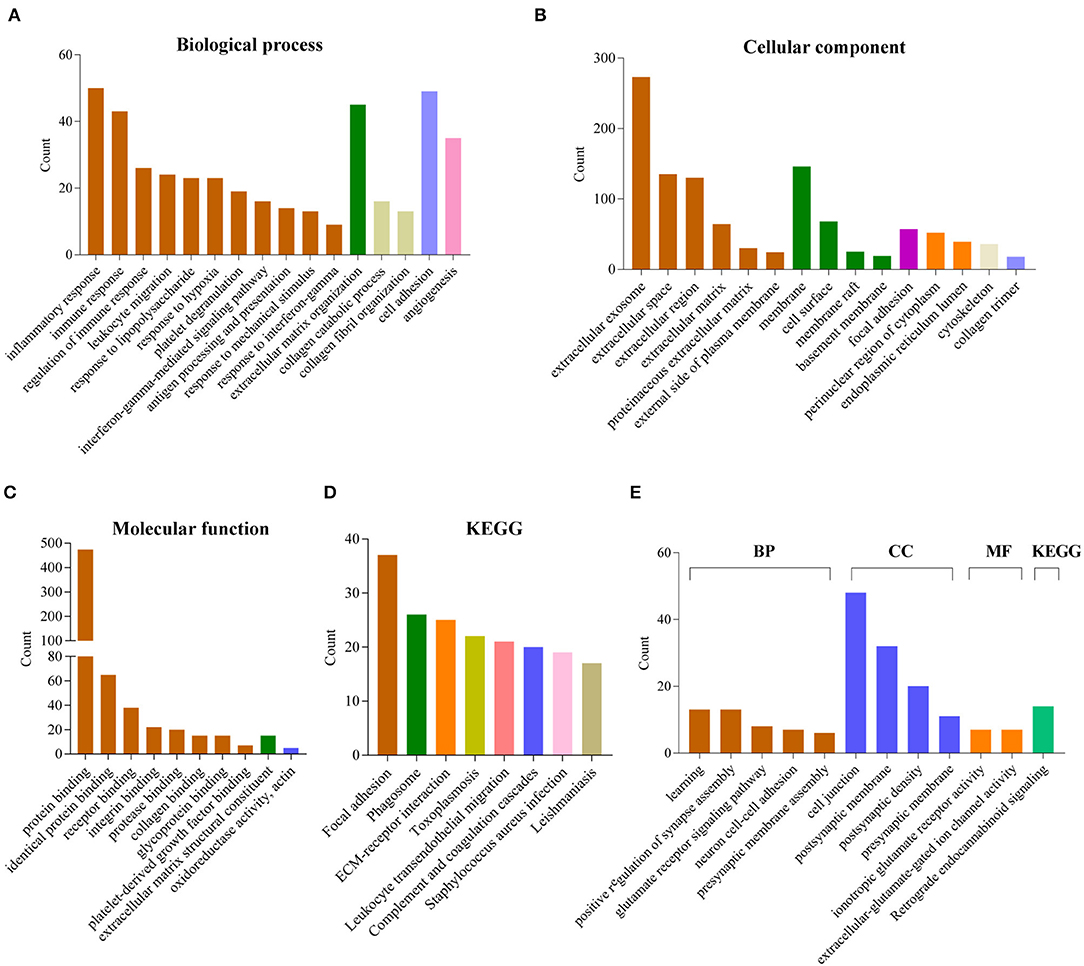
Figure 6. Functional annotation related to the 12-gene signature. (A–D) Functional annotation of genes positively correlated with the risk score using GO terms of biological process (A), cellular component (B), molecular function (C) and KEGG pathway (D) by DAVID. (E) Functional annotation of genes negatively correlated with the risk score using GO terms and KEGG pathway by DAVID.
In contrast, negatively related genes were mainly involved in BP terms, including learning, positive regulation of synapse assembly, glutamate receptor signaling pathway, neuron cell-cell adhesion, presynaptic membrane assembly. The enriched CC terms were cell junction, postsynaptic membrane, postsynaptic density, presynaptic membrane. The enriched MF terms were ionotropic glutamate receptor activity, extracellular-glutamate-gated ion channel activity. The enriched KEGG pathway was retrograde endocannabinoid signaling (Figure 6E).
Moreover, the GSEA analyses showed consistent results. The high-risk groups were enriched in immune response (such as adaptive immune response based on somatic recombination of immune receptors built from immunoglobulin superfamily domains, lymphocyte mediated immunity, complement and coagulation cascades), extracellular structure organization, ECM-receptor interaction, focal adhesion (Figure S6).
Discussion
In this study, for the first time, we found methyltransferase-related genes could distinguish glioma patients into two clusters which showed significant differences in clinical and molecular features. Then, we built a methyltransferase-related gene signature that could classify patients into high and low-risk group by an elastic net regression Cox model (32). Most of the genes in the signature are mainly enriched in methyltransferase complex and nucleoplasm (Figure S2A). And they can bind with DNA or/and protein (Figure S2B). Protein-protein interaction analysis showed that five genes (EZH2, SUZ12, EED, PHF1 and SIRT1) are core components of PRC2 complex, which execute transcriptional inhibition via catalyzing H3K27me3 (Figure S2C). EZH2 protein expression is significantly higher in GBM, and it is a negative prognostic factor in GBM (13, 33, 34). EZH2 has been reported as an oncogene and is involved in several glioma cell processes, including cell cycle, invasion, GSC maintenance, drug and radiotherapy resistance, etc (35). The expression of SUZ12 protein was significantly upregulated in tumor compared with its adjacent brain tissue by western blot and immunohistochemistry analysis (36). miR-128, miR-105 and miR-767-5p are suppressors for glioma cell malignancy by targeting SUZ12 (36–38). The function of SIRT1 in glioma is complicated. On the one hand, SIRT1 knockdown significantly inhibited glioma cell proliferation, migration, invasion, promoted its apoptosis and potentiated TMZ toxicity (39–41). On the other hand, the expression of SIRT1 in GBM is significantly lower than normal brain tissue (42, 43). Up-regulation of SIRT1 by genetic modification or treatment of melatonin significantly attenuated the adhesion molecular VCAM-1 and ICAM-1 expression in GBM, which modulated the monocytes interaction with GBM (43). SIRT1 activator SRT2183 suppresses glioma cell growth and destroyed neurospheres in vitro (44). The effect of SIRT1 on glioma progression still needs more in vivo experiments to verify. MEN1 expression was activated in 44.4% of adult gliomas and predicted poor prognosis of patients with glioma (45). Importantly, MEN1 inhibitors significantly decreased the proliferation of adult glioma cells (45). CLNS1A is a co-factor of methyltransferase PRMT5. They are components of methylosome, a multi-subunit complex which modifies specific Sm-proteins to facilitate small ribonucleoprotein (snRNP) assembly (46, 47). CLNS1A knockdown increased sensitivity to PRMT5 inhibitor EPZ015666 in malignant glioma, which may due to the reducing of splicing capacity (48). The protein expression of PPP1CA is high in GBM, but it showed no correlation with prognosis in all GBMs or on stratification based on IDH1 or ATRX expression (49). However, PPP1CA expression is associated with poor prognosis in p53 expressing GBMs (49). METTL1 mediated tRNA and microRNA processing via N7-methylguanosine (m7G) methylation (50, 51). In addition to the essential role of METTL1 in embryonic stem cell self-renewal and differentiation (52), it is elevated in hepatocellular carcinoma (HCC) and shows carcinogenic activity through PTEN/AKT signaling pathway (53). DYDC1 is a component of MLL3/4 complex, which can methylate lysine-4 of histone H3. Collectively, the expression of EZH2 (33), SUZ12 (36), SIRT1 (42, 43), MEN1 (45) and PPP1CA (49) at RNA levels are consistent with protein levels in previous reports, indicating that analysis based on RNA sequencing data can be verified by other techniques. Fifty percentage (6/12) of genes in this signature have been reported to participate the progression of glioma, which verified the value of methyltransferase-related signature.
Based on TCGA training set and CGGA validation set, we observed that the risk scores are much higher in WHO grade IV, IDH wildtype, 1p/19q non-codel, MGMT promoter unmethylated, EGFR amplification and worse TCGA subtypes (classical and mesenchymal). It implies that this methyltransferase-related gene signature may predict the prognosis of patients with glioma. Next, we evaluated the 12-gene risk signature prognostic value in patients with glioma. This methyltransferase-related signature was a mighty prognostic indicator regardless of WHO grade, IDH status, MGMT promoter status and EGFR status in both datasets. After stratified patients into four subgroups by WHO grade and IDH status, it only predicted the prognosis of LGG IDH-mutant diffuse glioma patients, which may due to the small sample size of other groups. Moreover, we found the risk score of methyltransferase-related signature was an independent prognostic indicator for OS in diffuse glioma patients when considering several clinical and molecular characteristics. And it is could better predict the prognosis of glioma than the traditional factors “age” and “grade.” These analysis indicated that this signature is a mighty prognostic indicator, and it might be used to classify patients and guide targeted therapy in the future.
For biological characteristics and pathway analysis of 12-gene signature, the significantly correlated genes (|R| > 0.5, P < 0.0001) were performed GO and KEGG analysis. Results showed that positively correlated genes are significantly enriched in BP, such as immune response, extracellular matrix organization, cell adhesion and angiogenesis. For KEGG, these genes were enriched in focal adhesion, phagosome, ECM-receptor interaction, leukocyte transendothelial migration, complement and coagulation cascades. These results indicated that the high risk score group may affect the glioma progression by affecting these biological processes or pathways. Meanwhile, the negatively correlated genes were closely related to GO terms of the normal nervous system, such as learning, positive regulation of synapse assembly, glutamate receptor signaling pathway, neuron cell-cell adhesion, presynaptic membrane assembly, ionotropic glutamate receptor activity, extracellular-glutamate-gated ion channel activity. It indicated that the low risk score group were more similar to the normal nervous system. GSEA analyses is consistent with the above results.
Conclusions
We identified that the methyltransferase genes could classify the glioma patients with different clinical and molecular characteristics. We then built a 12-gene risk signature, which was strongly associated with pathological features in glioma. Moreover, the risk score of this signature was an independent prognostic indicator. Furthermore, the biological process and pathway related with this risk signature had been annotated. Our study provides new understanding of methyltransferase in the carcinogenesis and development of glioma. It provided important evidence for future application of methyltransferase inhibitor in glioma therapies. However, our study is based on RNA sequencing technology for large-scale detection of gene expression at the RNA level. Therefore, the ability of this signature to predict prognosis should be retested in further research by other techniques or validated in pathological sections, primary gliomas cells before clinical application.
Data Availability Statement
Publicly available datasets were analyzed in this study. These data can be found here: http://www.cgga.org.cn/; https://cancergenome.nih.gov/.
Author Contributions
YZ and YL provided equal contributions to research design, data analysis and article writing. HL, ZZ and FW participated in data downloading and preliminary analysis. FZ revised the manuscript. The final manuscript has been read and approved by all authors.
Funding
This study was supported by funds from the National Nature Science Foundation of China (81802994 and 81761168038); Beijing Municipal Administration of Hospitals' Mission Plan (SML20180501); The National Key Research and Development Plan (2016YFC0902500); Capital Medical Development Research Fund (2016-1-1072).
Conflict of Interest
The authors declare that the research was conducted in the absence of any commercial or financial relationships that could be construed as a potential conflict of interest.
Acknowledgments
We appreciate the patients who have participated in CGGA and AGGA.
Supplementary Material
The Supplementary Material for this article can be found online at: https://www.frontiersin.org/articles/10.3389/fonc.2020.00508/full#supplementary-material
References
1. Lian H, Wang QH, Zhu CB, Ma J, Jin WL. Deciphering the epitranscriptome in cancer. Trends Cancer. (2018) 4: 207–21. doi: 10.1016/j.trecan.2018.01.006
2. Patnaik S, Anupriya. Drugs targeting epigenetic modifications and plausible therapeutic strategies against colorectal cancer. Front Pharmacol. (2019) 10:588. doi: 10.3389/fphar.2019.00588
4. Gerson SL. MGMT: its role in cancer aetiology and cancer therapeutics. Nat Rev Cancer. (2004) 4 296–307. doi: 10.1038/nrc1319
5. Hegi ME, Diserens AC, Gorlia T, Hamou MF, de Tribolet N, Weller M, et al. MGMT gene silencing and benefit from temozolomide in glioblastoma. N Engl J Med. (2005) 352:997–1003. doi: 10.1056/NEJMoa043331
6. Roundtree IA, Evans ME, Pan T, He C. Dynamic RNA modifications in gene expression regulation. Cell. (2017) 169:1187–200. doi: 10.1016/j.cell.2017.05.045
7. Thapar R, Bacolla A, Oyeniran C, Brickner JR, Chinnam NB, Mosammaparast N, et al. RNA modifications: reversal mechanisms and cancer. Biochemistry. (2019) 58:312–29. doi: 10.1021/acs.biochem.8b00949
8. Cui Q, Shi H, Ye P, Li L, Qu Q, Sun G, et al. m(6)A RNA Methylation Regulates The Self-Renewal And Tumorigenesis Of Glioblastoma Stem Cells. Cell Rep. (2017) 18:2622–34. doi: 10.1016/j.celrep.2017.02.059
9. Zhang S, Zhao BS, Zhou A, Lin K, Zheng S, Lu Z, et al. m(6)A Demethylase ALKBH5 maintains tumorigenicity of glioblastoma stem-like cells by sustaining FOXM1 expression and cell proliferation program. Cancer Cell. (2017) 31:591–606 e596. doi: 10.1016/j.ccell.2017.02.013
10. Dilworth D, Barsyte-Lovejoy D. Targeting protein methylation: from chemical tools to precision medicines. Cell Mol Life Sci. (2019) 76:2967–85. doi: 10.1007/s00018-019-03147-9
11. Audia JE, Campbell RM. Histone modifications and cancer. Cold Spring Harb Perspect Biol. (2016) 8:a019521. doi: 10.1101/cshperspect.a019521
12. Cao R, Wang L, Wang H, Xia L, Erdjument-Bromage H, Tempst P, et al. Role of histone H3 lysine 27 methylation in Polycomb-group silencing. Science. (2002) 298:1039–43. doi: 10.1126/science.1076997
13. Zhang J, Chen L, Han L, Shi Z, Zhang J, Pu P, et al. EZH2 is a negative prognostic factor and exhibits pro-oncogenic activity in glioblastoma. Cancer Lett. (2015) 356:929–36. doi: 10.1016/j.canlet.2014.11.003
14. Huang J, Perez-Burgos L, Placek BJ, Sengupta R, Richter M, Dorsey JA, et al. Repression of p53 activity by Smyd2-mediated methylation. Nature. (2006) 444:629–32. doi: 10.1038/nature05287
15. Chuikov S, Kurash JK, Wilson JR, Xiao B, Justin N, Ivanov GS, et al. Regulation of p53 activity through lysine methylation. Nature. (2004) 432:353–60. doi: 10.1038/nature03117
16. Saddic LA, West LE, Aslanian A, Yates JR, 3rd, Rubin SM, Gozani O, et al. Methylation of the retinoblastoma tumor suppressor by SMYD2. J Biol Chem. (2010) 285:37733–40. doi: 10.1074/jbc.M110.137612
17. Carr SM, Munro S, Kessler B, Oppermann U, La Thangue NB. Interplay between lysine methylation and Cdk phosphorylation in growth control by the retinoblastoma protein. EMBO J. (2011) 30:317–27. doi: 10.1038/emboj.2010.311
18. Levy D, Kuo AJ, Chang Y, Schaefer U, Kitson C, Cheung P, et al. Lysine methylation of the NF-kappaB subunit RelA by SETD6 couples activity of the histone methyltransferase GLP at chromatin to tonic repression of NF-kappaB signaling. Nat Immunol. (2011) 12:29–36. doi: 10.1038/ni.1968
19. Ea CK, Baltimore D. Regulation of NF-kappaB activity through lysine monomethylation of p65. Proc Natl Acad Sci USA. (2009) 106:18972–7. doi: 10.1073/pnas.0910439106
20. Kim E, Kim M, Woo DH, Shin Y, Shin J, Chang N, et al. Phosphorylation of EZH2 activates STAT3 signaling via STAT3 methylation and promotes tumorigenicity of glioblastoma stem-like cells. Cancer Cell. (2013) 23:839–52. doi: 10.1016/j.ccr.2013.04.008
21. Ostrom QT, Gittleman H, Xu J, Kromer C, Wolinsky Y, Kruchko C, et al. CBTRUS statistical report: primary brain and other central nervous system tumors diagnosed in the United States in 2009-2013. Neuro Oncol. (2016) 18:v1–75. doi: 10.1093/neuonc/now207
22. Zang L, Kondengaden SM, Che F, Wang L, Heng X. Potential epigenetic-based therapeutic targets for glioma. Front Mol Neurosci. (2018) 11:408. doi: 10.3389/fnmol.2018.00408
23. Suzuki H, Aoki K, Chiba K, Sato Y, Shiozawa Y, Shiraishi Y, et al. Mutational landscape and clonal architecture in grade II and III gliomas. Nat Genet. (2015) 47: 458–68. doi: 10.1038/ng.3273
24. Ceccarelli M, Barthel FP, Malta TM, Sabedot TS, Salama SR, Murray BA, et al. Molecular profiling reveals biologically discrete subsets and pathways of progression in diffuse glioma. Cell. (2016) 164:550–63. doi: 10.1016/j.cell.2015.12.028
25. Cancer Genome Atlas Research N, Brat DJ, Verhaak RG, Aldape KD, Yung WK, Salama SR, et al. Comprehensive, integrative genomic analysis of diffuse lower-grade gliomas. N Engl J Med. (2015) 372:2481–98. doi: 10.1056/NEJMoa1402121
26. Brennan CW, Verhaak RG, McKenna A, Campos B, Noushmehr H, Salama SR, et al. The somatic genomic landscape of glioblastoma. Cell. (2013) 155:462–77. doi: 10.1016/j.cell.2013.09.034
27. Reifenberger G, Wirsching HG, Knobbe-Thomsen CB, Weller M. Advances in the molecular genetics of gliomas - implications for classification and therapy. Nat Rev Clin Oncol. (2017) 14:434–52. doi: 10.1038/nrclinonc.2016.204
28. Gusyatiner O, Hegi ME. Glioma epigenetics: From subclassification to novel treatment options. Semin Cancer Biol. (2018) 51:50–8. doi: 10.1016/j.semcancer.2017.11.010
29. Subramanian A, Tamayo P, Mootha VK, Mukherjee S, Ebert BL, Gillette MA, et al. Gene set enrichment analysis: a knowledge-based approach for interpreting genome-wide expression profiles. Proc Natl Acad Sci USA. (2005) 102:15545–50. doi: 10.1073/pnas.0506580102
30. Li R, Qian J, Wang YY, Zhang JX, You YP. Long noncoding RNA profiles reveal three molecular subtypes in glioma. CNS Neurosci Ther. (2014) 20:339–43. doi: 10.1111/cns.12220
31. Szklarczyk D, Gable AL, Lyon D, Junge A, Wyder S, Huerta-Cepas J, et al. STRING v11: protein-protein association networks with increased coverage, supporting functional discovery in genome-wide experimental datasets. Nucleic Acids Res. (2019) 47:D607–13. doi: 10.1093/nar/gky1131
32. Hughey JJ, Butte AJ. Robust meta-analysis of gene expression using the elastic net. Nucleic Acids Res. (2015) 43:e79. doi: 10.1093/nar/gkv229
33. Purkait S, Sharma V, Kumar A, Pathak P, Mallick S, Jha P, et al. Expression of DNA methyltransferases 1 and 3B correlates with EZH2 and this 3-marker epigenetic signature predicts outcome in glioblastomas. Exp Mol Pathol. (2016) 100:312–20. doi: 10.1016/j.yexmp.2016.02.002
34. Karlowee V, Amatya VJ, Takayasu T, Takano M, Yonezawa U, Takeshima Y, et al. Immunostaining of increased expression of enhancer of zeste homolog 2 (EZH2) in diffuse midline glioma H3K27M-mutant patients with poor survival. Pathobiology. (2019) 86:152–61. doi: 10.1159/000496691
35. Yin Y, Qiu S, Peng Y. Functional roles of enhancer of zeste homolog 2 in gliomas. Gene. (2016) 576:189–94. doi: 10.1016/j.gene.2015.09.080
36. Peruzzi P, Bronisz A, Nowicki MO, Wang Y, Ogawa D, Price R, et al. MicroRNA-128 coordinately targets polycomb repressor complexes in glioma stem cells. Neuro Oncol. (2013) 15:1212–24. doi: 10.1093/neuonc/not055
37. Zhang J, Wu W, Xu S, Zhang J, Zhang J, Yu Q, et al. MicroRNA-105 inhibits human glioma cell malignancy by directly targeting SUZ12. Tumour Biol. (2017) 39:1010428317705766. doi: 10.1177/1010428317705766
38. Zhang J, Xu S, Xu J, Li Y, Zhang J, Zhang J, et al. miR7675p inhibits glioma proliferation and metastasis by targeting SUZ12. Oncol Rep. (2019) 42:55–66. doi: 10.3892/or.2019.7156
39. Qu Y, Zhang J, Wu S, Li B, Liu S, Cheng J. SIRT1 promotes proliferation and inhibits apoptosis of human malignant glioma cell lines. Neurosci Lett. (2012) 525:168–72. doi: 10.1016/j.neulet.2012.07.025
40. Li Y, Chen X, Cui Y, Wei Q, Chen S, Wang X. Effects of SIRT1 silencing on viability, invasion and metastasis of human glioma cell lines. Oncol Lett. (2019) 17:3701–8. doi: 10.3892/ol.2019.10063
41. Chen H, Lin R, Zhang Z, Wei Q, Zhong Z, Huang J, et al. Sirtuin 1 knockdown inhibits glioma cell proliferation and potentiates temozolomide toxicity via facilitation of reactive oxygen species generation. Oncol Lett. (2019) 17:5343–50. doi: 10.3892/ol.2019.10235
42. Wang RH, Sengupta K, Li C, Kim HS, Cao L, Xiao C, et al. Impaired DNA damage response, genome instability, and tumorigenesis in SIRT1 mutant mice. Cancer Cell. (2008) 14:312–23. doi: 10.1016/j.ccr.2008.09.001
43. Lai SW, Liu YS, Lu DY, Tsai CF. Melatonin modulates the microenvironment of glioblastoma multiforme by targeting sirtuin 1. Nutrients. (2019) 11:1343. doi: 10.3390/nu11061343
44. Ye T, Wei L, Shi J, Jiang K, Xu H, Hu L, et al. Sirtuin1 activator SRT2183 suppresses glioma cell growth involving activation of endoplasmic reticulum stress pathway. BMC Cancer. (2019) 19:706. doi: 10.1186/s12885-019-5852-5
45. Wang ZF, Hong XY, Zhu LY, Zhang L, Qiu H, Zhang YY, et al. Abnormal expression of menin predicts the pathogenesis and poor prognosis of adult gliomas. Cancer Gene Ther. (2019). doi: 10.1038/s41417-019-0127-5. [Epub ahead of print].
46. Battle DJ, Kasim M, Yong J, Lotti F, Lau CK, Mouaikel J, et al. The SMN complex: an assembly machine for RNPs. Cold Spring Harb Symp Quant Biol. (2006) 71:313–20. doi: 10.1101/sqb.2006.71.001
47. Chari A, Golas MM, Klingenhager M, Neuenkirchen N, Sander B, Englbrecht C, et al. An assembly chaperone collaborates with the SMN complex to generate spliceosomal SnRNPs. Cell. (2008) 135:497–509. doi: 10.1016/j.cell.2008.09.020
48. Braun CJ, Stanciu M, Boutz PL, Patterson JC, Calligaris D, Higuchi F, et al. Coordinated splicing of regulatory detained introns within oncogenic transcripts creates an exploitable vulnerability in malignant glioma. Cancer Cell. (2017) 32:411–26 e411. doi: 10.1016/j.ccell.2017.08.018
49. Shastry AH, Thota B, Srividya MR, Arivazhagan A, Santosh V. Nuclear protein phosphatase 1 alpha (PP1A) expression is associated with poor prognosis in p53 expressing glioblastomas. Pathol Oncol Res. (2016) 22:287–92. doi: 10.1007/s12253-015-9928-5
50. Okamoto M, Fujiwara M, Hori M, Okada K, Yazama F, Konishi H, et al. tRNA modifying enzymes, NSUN2 and METTL1, determine sensitivity to 5-fluorouracil in HeLa cells. PLoS Genet. (2014) 10:e1004639. doi: 10.1371/journal.pgen.1004639
51. Pandolfini L, Barbieri I, Bannister AJ, Hendrick A, Andrews B, Webster N, et al. METTL1 promotes let-7 MicroRNA processing via m7G Methylation. Mol Cell. (2019) 74:1278–90.e1279. doi: 10.1016/j.molcel.2019.03.040
52. Lin S, Liu Q, Lelyveld VS, Choe J, Szostak JW, Gregory RI. Mettl1/Wdr4-Mediated m(7)G tRNA Methylome is required for normal mRNA translation and embryonic stem cell self-renewal and differentiation. Mol Cell. (2018) 71:244–55.e245. doi: 10.1016/j.molcel.2018.06.001
Keywords: glioma, methyltransferase, signature, prognosis, risk score
Citation: Zhang Y, Liu Y, Liu H, Zhao Z, Wu F and Zeng F (2020) Clinical and Biological Significances of a Methyltransferase-Related Signature in Diffuse Glioma. Front. Oncol. 10:508. doi: 10.3389/fonc.2020.00508
Received: 26 September 2019; Accepted: 20 March 2020;
Published: 20 April 2020.
Edited by:
Liam Chen, Johns Hopkins University, United StatesReviewed by:
Shweta Tiwary, National Institutes of Health (NIH), United StatesQing Liu, Central South University, China
Dalia Barsyte-Lovejoy, University of Toronto, Canada
Copyright © 2020 Zhang, Liu, Liu, Zhao, Wu and Zeng. This is an open-access article distributed under the terms of the Creative Commons Attribution License (CC BY). The use, distribution or reproduction in other forums is permitted, provided the original author(s) and the copyright owner(s) are credited and that the original publication in this journal is cited, in accordance with accepted academic practice. No use, distribution or reproduction is permitted which does not comply with these terms.
*Correspondence: Fan Zeng, emVuZ2ZhbmpveWNlQHNpbmEuY29t
†These authors have contributed equally to this work