Abstract
Dysplasia and proliferation are histological properties that can be used to diagnose and categorize myeloid tumors in myelodysplastic syndromes (MDS) and myeloproliferative neoplasms (MPN). However, these conditions are not exclusive, and overlap between them leads to another classification, MDS/MPN. As well as phenotype continuity, these three conditions may have genetic relationships that have not yet been identified. This study aimed to obtain their mutational profiles by meta-analysis and explore possible similarities and differences. We reviewed screening studies of gene mutations, published from January 2000 to March 2020, from PubMed and Web of Science. Fifty-three articles were eligible for the meta-analysis, and at most 9,809 cases were involved for any gene. The top mutant genes and their pooled mutation rates were as follows: SF3B1 (20.2% [95% CI 11.6–30.5%]) in MDS, TET2 (39.2% [95% CI 21.7–52.0%]) in MDS/MPN, and JAK2 (67.9% [95% CI 64.1–71.6%]) in MPN. Subgroup analysis revealed that leukemic transformation-related genes were more commonly mutated in high-risk MDS (MDS with multilineage dysplasia and MDS with excess blasts) than that in other MDS entities. Thirteen genes including ASXL1, U2AF1, SRSF2, SF3B1, and ZRSR2 had significantly higher mutation frequencies in primary myelofibrosis (PMF) compared with essential thrombocythemia and polycythemia vera; this difference distinguished PMF from MPN and likened it to MDS. Chronic myelomonocytic leukemia and atypical chronic myeloid leukemia were similar entities but showed several mutational differences. A heat map demonstrated that juvenile myelomonocytic leukemia and MDS/MPN with ring sideroblasts and thrombocytosis were two distinct entities, whereas MDS/MPN-unclassifiable was closest to high-risk MDS. Such genetic closeness or difference reflected features in the pathogenesis, diagnosis, treatment, and progression of these conditions, and could inspire future genetic studies.
Introduction
Myelodysplastic syndromes (MDS), myeloproliferative neoplasms (MPN), and myelodysplastic/myeloproliferative neoplasms (MDS/MPN) are heterogeneous groups of myeloid tumors, all of which can progress into acute myeloid leukemia (AML) (1). Some distinct entities possess driver genes with more than 90% (or nearly 100%) mutation frequency in total cases. SF3B1, for example, is frequently associated with MDS/MPN with ring sideroblasts and thrombocytosis (MDS/MPN-RS-T) (2), and JAK2 mutation occurs in almost all polycythemia vera (PV) patients (3). However, the mutational profiles of the other entities are less distinct and show different mutation rates within a pool of genes, suggesting both differences and similarities between them. Numerous studies have reported the genetic landscapes of these entities using next-generation sequencing technology, and a handful of literature reviews have summarized each of the three myeloid tumor types separately. However, to the best of our knowledge, no meta-analysis has been conducted to compare their mutational profiles. Therefore, the aim of this study was to determine the gene mutation frequencies of the three myeloid tumor types by meta-analysis, to analyze differences between them, and to gain insight into their relationships and risk factors.
Methods
This study followed the guidelines for Meta-analysis of Observational Studies (4).
Systematic Search
Two databases, PubMed and Web of Science, were searched for articles published between January 2000 and March 2020, using the terms “myelodysplastic-myeloproliferative diseases/genetics” in MeSH terms or topic terms; “myelodysplastic syndromes/genetics,” “myeloproliferative disorders/genetics” in MeSH major topic or topic terms; and “sequence analysis” or “sequencing” in titles, abstracts, or topic terms. Keywords “aplastic anemia,” “acute myeloid leukemia,” “paroxysmal nocturnal hemoglobinuria,” “sideroblastic anemia,” “mitochondri*,” “drug resistance,” or “drug therapy” in titles and “RNA,” “tool,” “method,” “transplantation,” and “anemia” in topic terms were excluded when searching Web of Science, and the research area was restricted to “hematology.” These restrictions were intended to exclude publications not related to our focus, such as other diseases, tools or method evaluations, drug assessments, and transplantation effects. A manual search was also performed.
Duplicate publications were removed after the initial database search. Case reports, meta-analyses, books, patents, commentaries, reviews, animal studies, and conference-only posters were excluded. Keywords related to transplantation or drug regimens were removed. The remaining articles were then screened by title and abstract, or by full-text review. Studies on single-gene analysis, technique evaluations, other diseases, and other unrelated topics were excluded. Studies involving pediatric patients were excluded to eliminate the potential influence of age. Owing to the distinct Ph+ chromosomal pattern, studies on BCR-ABL1-positive chronic myeloid leukemia (CML) were also excluded from this analysis.
Two reviewers (ZW and BH) independently assessed studies for inclusion and extracted the data described below. Disagreements between investigators were resolved by discussion.
Inclusion Criteria
As randomized controlled trials are not suitable for studying mutational landscapes, we included cohort studies about MDS, MPN, and MDS/MPN or their entities. Inclusion criteria for this meta-analysis were as follows: (1) non-randomized controlled studies; (2) patients diagnosed with MDS, BCR-ABL1-negative MPN, MDS/MPN, or their entities; (3) at least six genes sequenced; (4) patient sample size >10; (5) adult patients except for those with juvenile myelomonocytic leukemia (JMML); (6) DNA samples; (7) published between January 2000 and March 2020; (8) contained extractable data, including the names of gene mutations and mutation status of tested patient samples.
If more than one publication involved the same patient population, the most recent study or the one with the largest sample size was selected as the primary study for data extraction. As some studies focused only on triple-negative (JAK2, CALR, MPL) patients, which would certainly introduce biases with respect to gene frequencies, such publications were not included in this analysis. To reduce the impact of age on the analysis, adult patient samples were selected, which consequently excluded studies on pediatric patients, although JMML studies were retained in order to obtain a full picture of MDS/MPN. Considering the classification changes to World Health Organization (WHO) criteria in 2008 (5) and 2016 (6), articles about mastocytes and therapy-related myeloid neoplasm were excluded, and chronic myelomonocytic leukemia (CMML) and MDS/MPN-RS-T (formerly known as refractory anemia with ring sideroblasts with thrombocytosis in 2008) were re-classified as MDS/MPN rather than MDS. Genes for which there were fewer than 150 total test cases were excluded from the general myeloid tumor analysis to avoid a false high mutation rate resulting from small sample size.
Data Extraction
The following data were collected: (1) basic characteristics of the study (first author, publication time, study type, myeloid tumor type and entity, sequencing method, diagnosis criteria); (2) patient characteristics (screened genes, diagnosis, sample sources, ethnicity); and (3) mutation status (gene symbols, mutation numbers, screened gene numbers). To reduce the impact of evolution, we specifically excluded sample data for secondary AML.
We did not use quality scoring for evaluation of the quality of articles, as it is controversial, but conducted subgroup and sensitivity analysis as recommended (4).
Statistical Analysis
Mutation frequencies, that is, the number of patients carrying mutants as a proportion of all cases screened, were calculated. We ignored different variants of the same gene, recording them as the same gene mutation. Therefore, if one patient carried two or more variants of one gene, we would record this as one mutation. As the mutation frequencies were distributed binomially, rather than following a normal distribution, we applied arcsine transformation to the mutation frequencies to normalize the proportional data. Heterogeneity among studies was examined using Cochrane's Q-test and I2 measure of inconsistency. Significant heterogeneity was defined as I2 ≥ 50%. If heterogeneity was considered to be significant, a random-effects model was chosen to obtain the pooled proportions. Otherwise, a fixed-effects model was used to combine the frequencies. The corresponding effect sizes and 95% confidence intervals (CIs) were calculated.
Subgroup analyses were conducted by grouping into specific entities. MDS was separated into low-risk MDS (lMDS) and high-risk MDS (hMDS) groups (7). The lMDS group included MDS with single lineage dysplasia, MDS with ring sideroblasts (MDS-RS), MDS with isolated del(5q) according to the WHO-2016 criteria or refractory cytopenia with unilineage dysplasia, refractory anemia with ring sideroblasts, and MDS with isolated del(5q) according to the WHO-2008 criteria. The hMDS group was composed of MDS with excess blasts and MDS with multilineage dysplasia according to the WHO-2016 criteria, or refractory anemia with excess blasts 1/2 and refractory cytopenia with multilineage dysplasia according to the WHO-2008 criteria. For MDS/MPN, the WHO-2016 classification criteria were adopted, including CMML, JMML, atypical CML (aCML), MDS/MPN-RS-T, and myelodysplastic/myeloproliferative neoplasm-unclassifiable (MDS/MPN-U). MPN was divided into essential thrombocythemia (ET), PV, primary myelofibrosis (PMF), and secondary myelofibrosis (SMF). Two studies (8, 9) have shown that the mutational profile of PMF differs from that of SMF (post-ET MF and post-PV MF). Thus, we excluded data compounding PMF and SMF from the subgroup analysis.
To determine the similarity between entities, clustering analysis was conducted using a 32-gene array. The meta-analyzed mutation frequency was centered and scaled in the aspect of mutation frequency. The distance or dissimilarity was calculated by the Euclidean method. Hierarchical clustering was adopted to obtain possible similarities between entities.
Sensitivity analysis was used to determine the impact of each study on the pooled outcome. Publication bias for genes reported by at least 10 studies was evaluated by Egger's test (significance was defined as p < 0.05). All statistical analyses were conducted using the meta-analysis R program (version x64 3.6.3 for Windows).
Results
Selection of Studies
In total, 2,417 publications were identified through database searching and 148 duplicate studies were removed. The remaining 2,269 articles were subjected to keyword assessment to remove inappropriate publication types (e.g., case reports, reviews, editorials), incorrect types of study (e.g., animal studies), or articles on unrelated topics (e.g., therapeutic use, drug resistance, transplantation). The 1,428 articles obtained from the database search and 11 studies from the manual search underwent further reviews of title and abstract; 1,358 records were excluded according to the criteria above, and 81 articles were retrieved for full-text evaluation. A total of 53 articles were included in our final analysis after in-depth review (Supplementary Figure 1). The characteristics of the studies are summarized in Supplementary Table 1.
Among these 53 publications, 13, 28, and 14 described studies of patients with MDS, MDS/MPN, and MPN, respectively. Two studies involved both MDS and MDS/MPN, and 47 of the 53 articles considered specific entities.
Gene Mutation Profiles of MDS, MDS/MPN, and MPN
After removing genes that were reported by only one study, the mutation profiles of MDS, MDS/MPN, and MPN were analyzed. Collectively, pooled frequencies of 216 genes in MDS, 56 genes in MDS/MPN, and 58 genes in MPN were obtained. These results are presented partially in Figure 1A. SF3B1, TET2, ASXL1, and DNMT3A were the four genes most often mutated in MDS, with frequencies of 20.2% (95% CI 11.6–30.5%), 19.7% (95% CI 14.9–25.0%), 13.1% (95% CI 8.9–7.9%), and 11.9% [95% CI 10.8–13.1], respectively. In the landscape of MDS/MPN, TET2, SRSF2, ASXL1, SF3B1 were the four most commonly mutated genes, with frequencies of 39.2% (95% CI 21.7–52.0%), 27.9% (95% CI 20.4–36.2%), 24.6% (16.7–33.1%), and 15.5% (95% CI 5.2–30.1%), respectively. In MPN, the top four genes with their pooled frequencies were: JAK2 (67.9% [95% CI 64.1–71.6%]), CALR (20.9% [95% CI 17.3–24.6%]), ASXL1 (19.0% [95% CI 12.5–26.4%]), and TET2 (15.1% [95% CI 12.7–17.8%]). The odds ratios of the mutation frequencies obtained by the meta-analysis are shown in Figures 1B,C: MLL, TP53, DNMT3A, IDH1, NPM1, and WT1 mutations were at least twice as likely to be found in MDS, whereas genes involved in RAS signaling, as well as SRSF2, JAK2, SETBP1, TET2, NF1, and ASXL1, were found twice as often in MDS/MPN. Three major driver gene mutations, JAK2, CALR, and MPL, had high frequencies in MPN; however, genes involved in RNA splicing, transcription, and RAS signaling had higher risk of mutation in MDS/MPN compared with MPN.
Figure 1
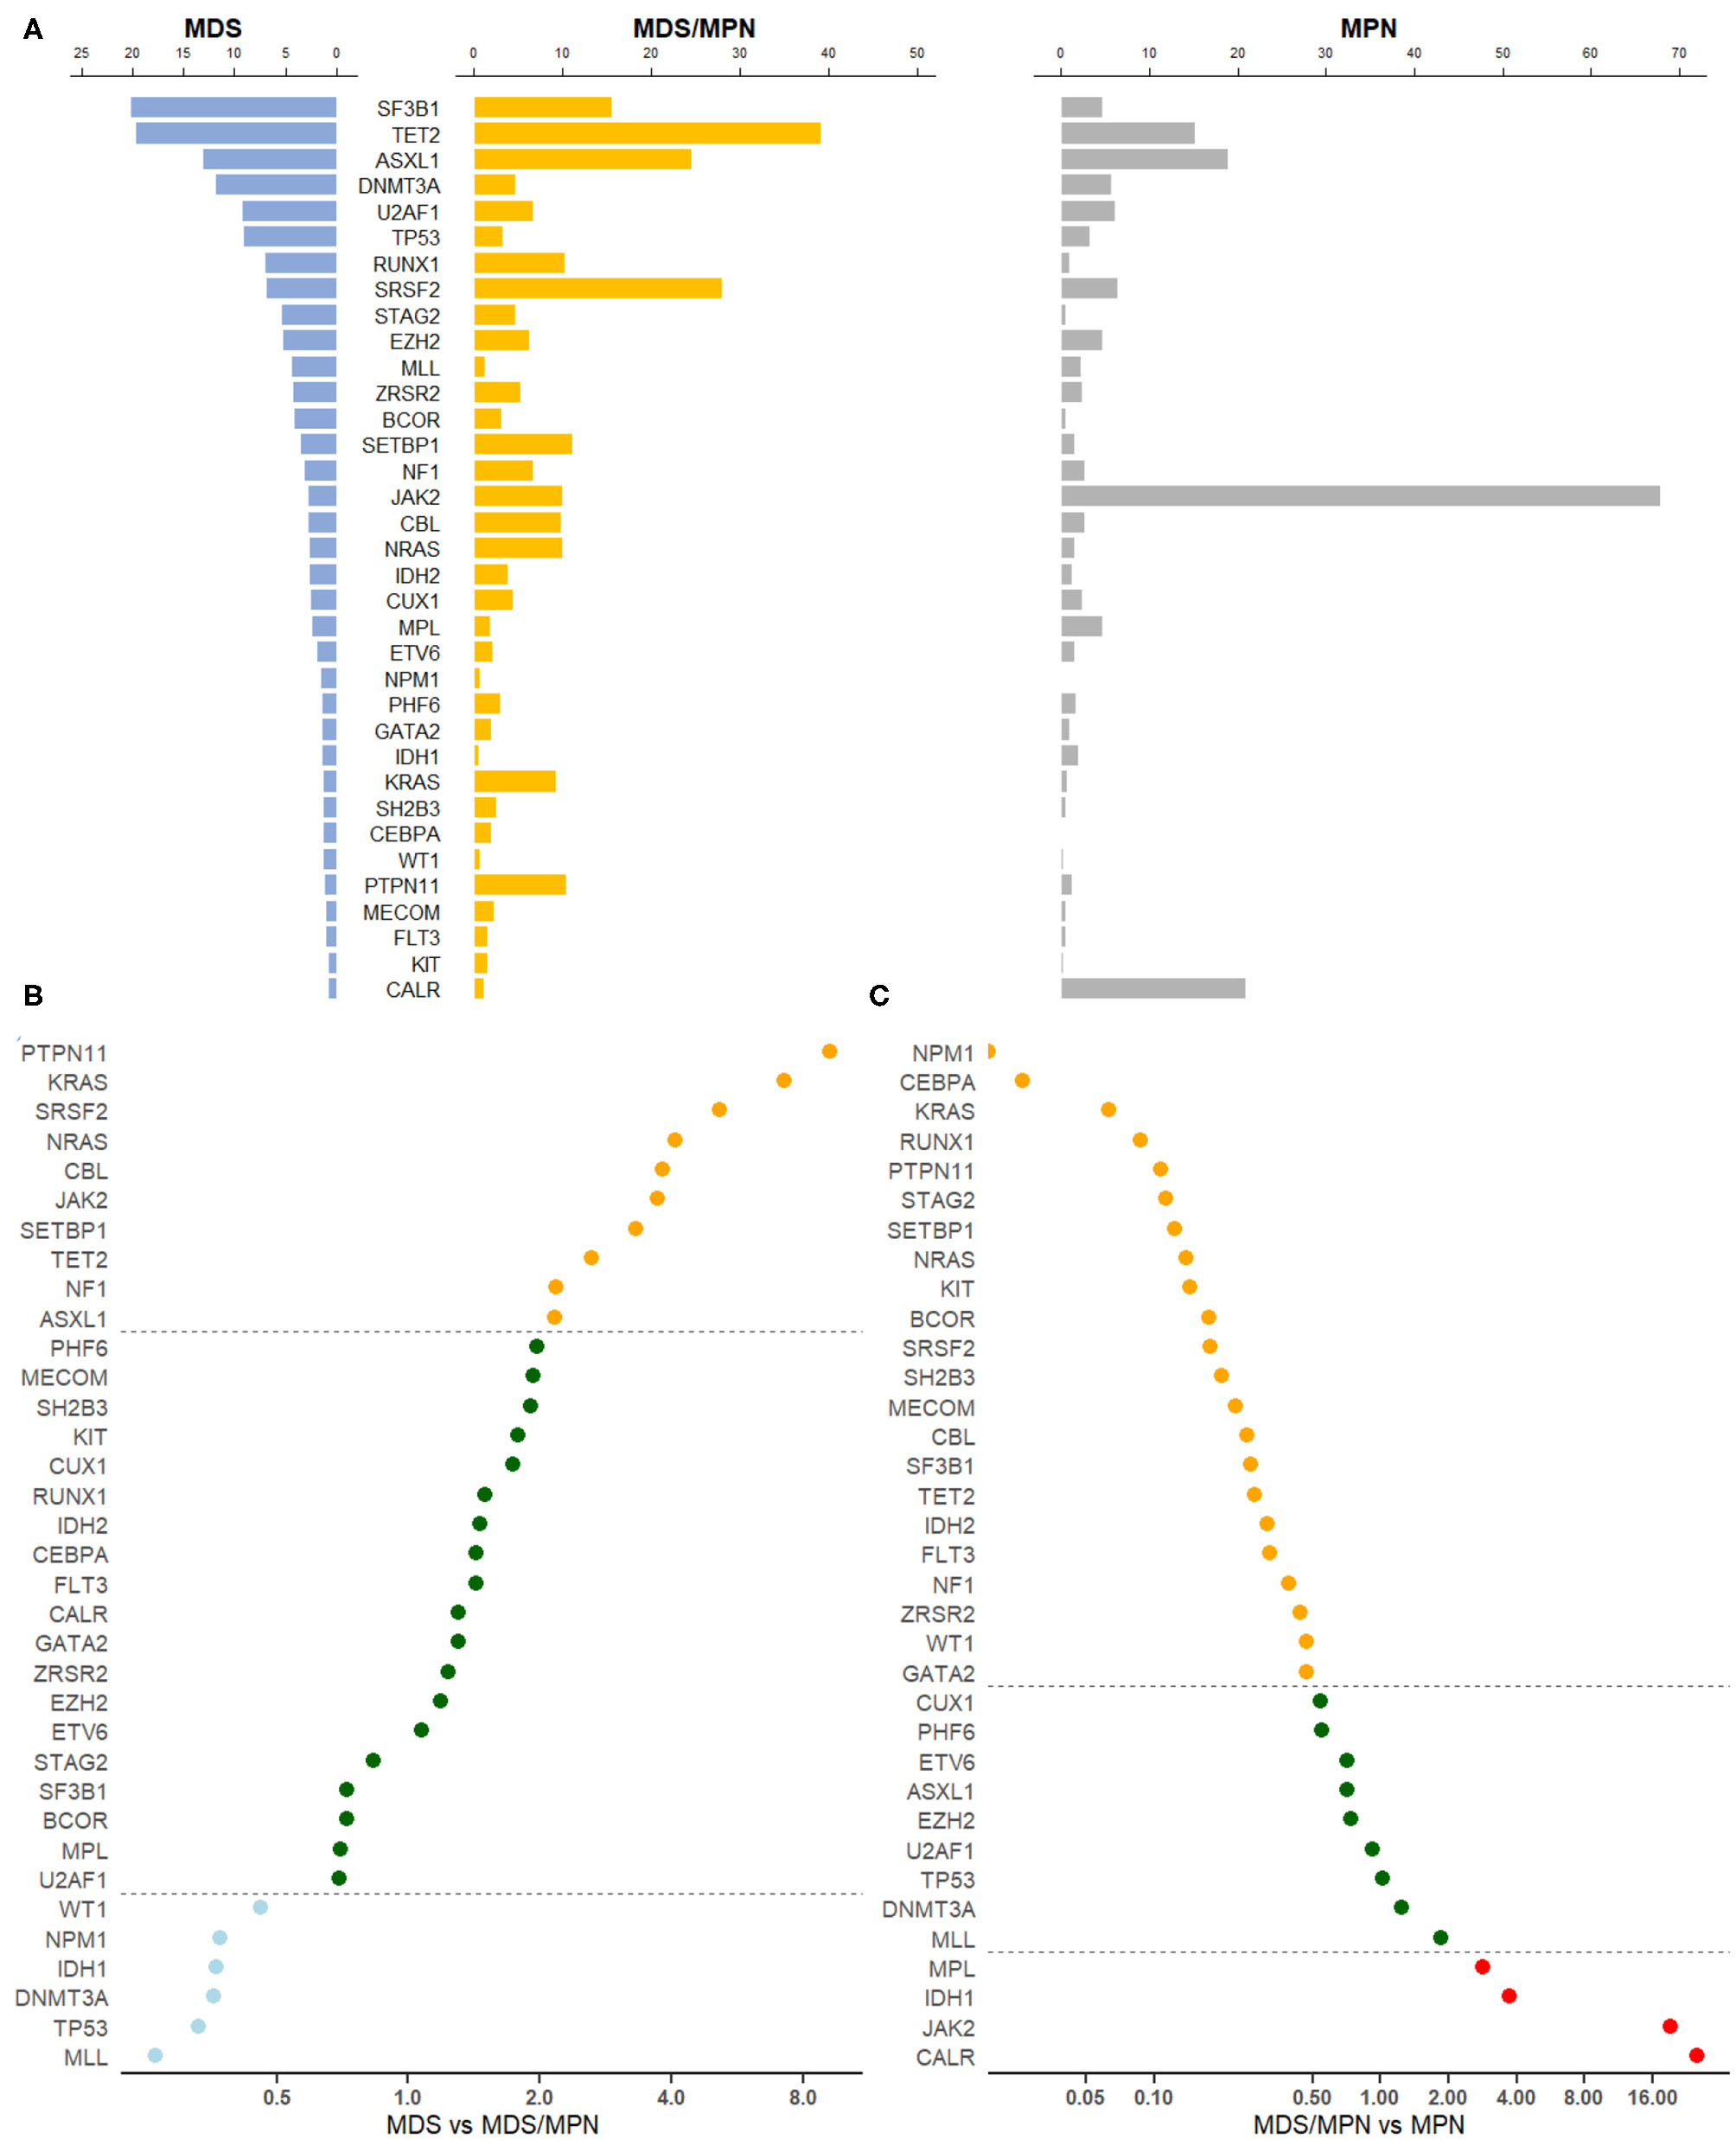
Gene mutation profiles for MDS, MDS/MPN, and MPN. (A) Pooled frequencies (%) of major mutations in all three myeloid tumors were plotted. The mutation frequency was obtained by meta-analysis. If heterogeneity was considered to be significant, i.e., I2 ≥ 50%, a random-effects proportion was used, otherwise a fixed-effects model was adopted to combine the frequencies. Bars in light blue represented mutation frequencies in MDS, orange for MDS/MPN and gray for MPN. (B) Odds ratio of meta-mutation-frequency between MDS and MDS/MPN were presented in scatter plots. X-axis was presented in the scale of log2. Dots in light blue stood for genes whose odds ratios were <0.5, suggesting higher risk toward MDS, whereas orange dots were representing genes whose odds ratios were more than 2.0, suggesting higher risk toward MDS/MPN. If the odds ratio was in the middle of 0.5 and 2.0, the correspondent gene would be green. The line of ratios, 0.5 and 2.0, were shown horizontally. (C) Odds ratio of meta-mutation-frequency between MDS/MPN and MPN are presented in scatter plots. X-axis was presented in the scale of log2. Dots in orange stood for genes whose odds ratios were <0.5, suggesting higher risk toward MDS/MPN, whereas red dots were representing genes whose odds ratios were more than 2.0, suggesting higher risk toward MPN. If the odds ratio was in the middle of 0.5 and 2.0, the correspondent gene would be green. The line of ratios, 0.5 and 2.0, were shown horizontally.
We further categorized genes by their pathways or functions, based on the classification of Ogawa [(7); Table 1]. RNA splicing gene mutations occurred frequently in MDS and MDS/MPN but less often in MPN. The most significant difference was observed for SF3B1 mutation, with p < 0.0001 for comparisons of both MDS and MDS/MPN with MPN. Although the mutation frequency of SF3B1 was calculated to be 89.2% (95% CI 84.6–3.1%) in MDS/MPN-RS-T, its proportion in analyzed MDS/MPN cases was low (15%; 202/1319); thus, the mutation rate of SF3B1 in MDS/MPN was only 15.5% owing to the low mutation frequency in other MDS/MPN entities with low heterogeneity (5.4% [95% CI 4.2–6.8%], I2 = 26.8%). TET2, which is involved in DNA methylation, had a significantly higher mutation frequency in MDS/MPN than in the other two myeloid tumor types (39.2% in MDS/MPN vs. 19.7% in MDS, p = 0.0032; 15.1% in MPN, p < 0.0001). Genes encoding transcription factors including BCOR, CEBPA, CUX1, ETV6, GATA2, and RUNX1 showed similar profiles in MDS and MDS/MPN but had higher mutation frequencies compared with those in MPN. Notably, RUNX1 mutation was significantly more frequent in MDS (7.0%, p = 0.0001) and MDS/MPN (10.2% p < 0.0001) than in MPN, with no significant difference between MDS and MDS/MPN (p = 0.1453). MPN was characterized by a high rate of mutations of JAK2, CALR, and MPL; this group of genes showed similar mutation patterns in MDS and MDS/MPN, except that JAK2 had a significantly higher mutation frequency in MDS/MPN (9.9 vs. 2.9%, p = 0.0059). The ASXL1 gene, which functions in chromatin modification, was mutated in 24.6% cases of MDS/MPN, significantly higher than the rate of 13.1% in MDS (p = 0.0032). The mutation frequencies of genes in the RAS signaling pathway, including CBL, KRAS, NF1, NRAS, and PTPN11, were all higher in MDS/MPN than in MDS or MPN. The mutation frequency of TP53 was significantly higher in MDS than in the other tumor types (both p < 0.0001), and that of SETBP1 was significantly higher in MDS/MPN (p < 0.0001 for MDS, p = 0.0005 for MPN). Cohesion complex gene STAG2 also showed similar mutation rates in MDS and MDS/MPN, significantly higher than those in MPN (both p < 0.0001).
Table 1
| Pathway/Function | Genes | MDS | MDS/MPN | MPN |
|---|---|---|---|---|
| RNA splicing | SF3B1 | 20.22 (3,207)* | 15.52 (1,319) | 4.66 (3,003) |
| U2AF1 | 9.24 (3,085) | 6.62 (1,307) | 6.17 (2,832) | |
| SRSF2 | 6.99 (3,164) | 27.94 (1,546) | 6.39 (4,083) | |
| ZRSR2 | 4.26 (2,703) | 5.19 (1,160) | 2.35 (2,350) | |
| DNA methylation | TET2 | 19.71 (3,423) | 39.21 (1,512) | 15.14 (3,516) |
| DNMT3A | 11.91 (2,986) | 4.62 (1,386) | 5.67 (3,516) | |
| IDH2 | 2.66 (3,062) | 3.84 (1,032) | 1.25 (2,952) | |
| IDH1 | 1.47 (3,061) | 0.54 (834) | 1.98 (2,817) | |
| WT1 | 1.32 (2,526) | 0.61 (249) | 0.29 (411) | |
| Transcription | RUNX1 | 7.02 (3,424) | 10.18 (1,694) | 0.98 (2,451) |
| BCOR | 4.14 (2,605) | 3.02 (372) | 0.54 (2,348) | |
| CUX1 | 2.61 (613) | 4.44 (492) | 2.46 (2,510) | |
| ETV6 | 1.93 (2,882) | 2.07 (425) | 1.49 (449) | |
| GATA2 | 1.48 (2,482) | 1.92 (156) | 0.92 (2,545) | |
| CEBPA | 1.32 (2,389) | 1.88 (439) | 0.05 (2,067) | |
| Cytokine receptor/ | JAK2 | 2.88 (3,100) | 9.93 (1,613) | 67.90 (4,089) |
| tyrosine kinase | MPL | 2.45 (2,013) | 1.73 (768) | 4.75 (3,874) |
| FLT3 | 1.05 (2,341) | 1.49 (747) | 0.49 (2,168) | |
| KIT | 0.89 (2,055) | 1.57 (743) | 0.23 (2,306) | |
| CALR | 0.80 (620) | 1.04 (641) | 20.86 (3,133) | |
| Chromatin | ASXL1 | 13.08 (3,425) | 24.58 (1,961) | 18.95 (4,423) |
| modification | EZH2 | 5.27 (3,381) | 6.17 (1,560) | 4.62 (4,246) |
| RAS signaling | NF1 | 3.16 (2,162) | 6.64 (1,050) | 2.71 (2,419) |
| CBL | 2.77 (3,105) | 9.79 (1,964) | 2.71 (3,447) | |
| NRAS | 2.66 (2,761) | 10.00 (1,777) | 1.52 (2,585) | |
| KRAS | 1.39 (2,452) | 9.29 (1,675) | 0.64 (2,649) | |
| PTPN11 | 1.25 (2,451) | 10.42 (1,233) | 1.23 (2,287) | |
| Others | TP53 | 9.18 (3,425) | 3.24 (553) | 3.30 (2,687) |
| STAG2 | 5.50 (2,482) | 4.63 (378) | 0.54 (2,248) | |
| MLL | 4.40 (613) | 1.20 (243) | 2.21 (311) | |
| SETBP1 | 3.61 (1,104) | 11.05 (1,415) | 1.51 (2,450) | |
| NPM1 | 1.60 (2,602) | 0.60 (1,179) | 0.00 (203) | |
| PHF6 | 1.52 (2,026) | 2.95 (420) | 1.64 (2,451) | |
| SH2B3 | 1.32 (946) | 2.48 (229) | 0.50 (2,560) | |
| MECOM | 1.14 (613) | 2.18 (261) | 0.51 (197) |
Gene mutation frequencies (%) and screened cases in MDS, MDS/MPN, and MPN and pathways or functions of genes.
Data was presented in the form of gene frequency (%) (cases screened in total).
Subgroup Analysis
Given that MDS, MDS/MPN, and MPN are all heterogenous myeloid tumors, we conducted subgroup analyses according to their individual entities. The mutational profiles of the various entities are shown in Figure 2. JAK2 was prominently mutated in PV, with a mutational frequency of 98.9% (95% CI 95.3–100.0%). High frequencies of JAK2 mutations (>30%) were also seen in MDS/MPN-RS-T, ET, PMF, and SMF. The nine least frequently mutated genes, IDH2, ETV6, KIT, BRAF, FLT3, WT1, GATA2, NPM1, and IDH1, were all related to AML transformation. Their mutation frequencies in these entities were all lower than 5%.
Figure 2
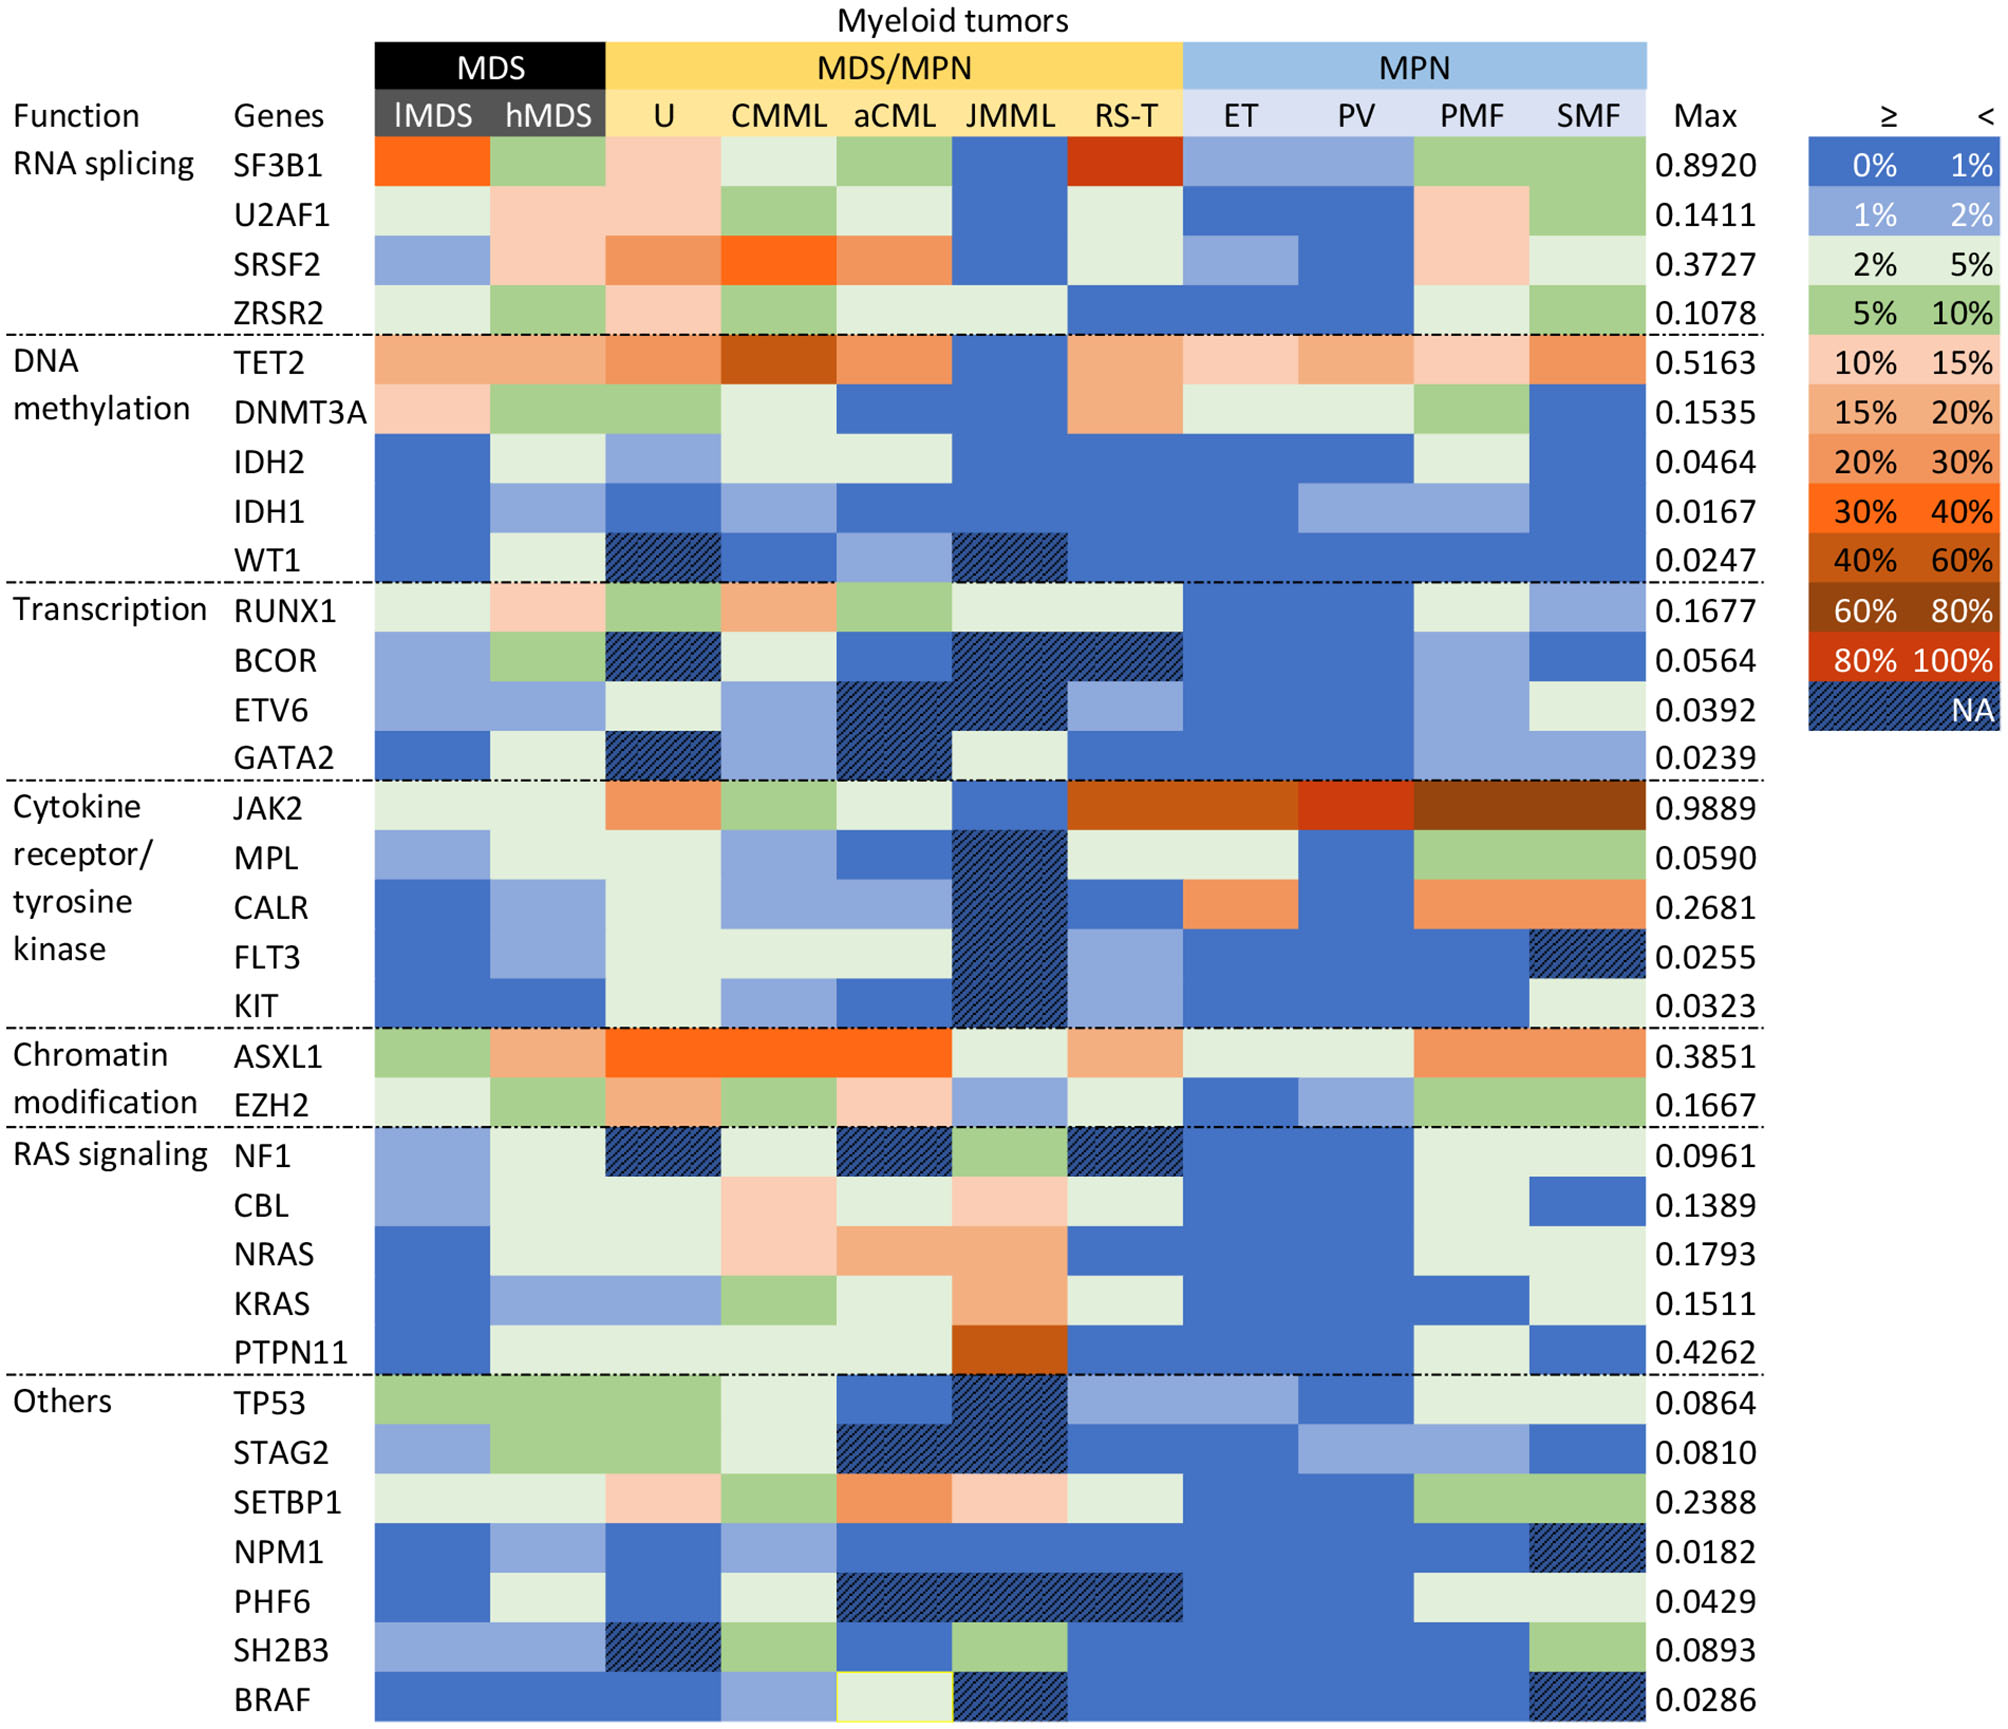
Gene mutational profiles for entities. Genes were clustered according to their functions. Different colors represented different mutation frequency ranges, as shown in the right-hand side. The maximum mutation rate was presented. MDS was subgrouped into low-risk (lMDS) and high-risk (hMDS); MDS/MPN groups were classified depended on WHO-2016 criteria; MPN included ET, PV, PMF, and SMF.
Within MDS, hMDS had more frequent mutations than lMDS in genes encoding transcription factors (RUNX1, BCOR, GATA2), those involved in chromatin modification (ASXL1, EZH2) and RAS signaling, and two splicing factor genes (SRSF2, U2AF1). On the other hand, SF3B1 was significantly more likely to be mutated in lMDS, largely because of the 80–90% SF3B1 mutation rate in MDS-RS. This gene was mutated in 12.7% (95% CI 9.6–16.1%) of cases of other lMDS entities, around twice the rate of the hMDS group (6.6%, 95% CI 5.0–8.5%). Mutation frequencies of DNA methylation genes TET2 and DNMT3A were similar between the two risk groups, but hMDS had more IDH1, IDH2, and WT1 mutations.
Among the MPN entities, TET2 and NFE2 were more commonly mutated in PV and SMF than in ET and PMF. The pooled mutation frequency of TET2 (17.7% [95% CI 14.5–21.1%]) was similar to that in lMDS (17.5% [95% CI 10.1–26.3%]). ASXL1 had significantly higher mutation frequencies in PMF and SMF than in ET or PV (28.0 and 23.9% vs. 4.0 and 3.3%, all p < 0.001; see forest plots in Supplementary Figure 2), with no significant difference between either PMF and SMF (p = 0.27) or ET and PV (p = 0.56). Splicing genes U2AF1, SRSF2, SF3B1, and ZRSR2 were also significantly highly mutated in PMF, with frequencies of 12.8, 12.4, 7.3, and 3.5%, respectively. PMF also had high mutation rates of genes including GNAS, EZH2, SETBP1, NF1, NRAS, MLL3, PHF6, and RUNX1. If the data for three MPN driver genes (JAK2, CALR, and MPL) were excluded, the mutational landscape of PMF was distinct from those of PV and ET. SMF cases showed the highest mutation rates for TET2, EZH2, and ZRSR2 across the four entities, whereas ASXL1, SF3B1, GNAS, SETBP1, TP53, NRAS, and PHF6 had the second highest mutation frequencies in SMF, close to those of PMF. Rates of MPN driver mutations in SMF resembled those in PMF. All these results suggest that PMF and SMF are distinct from PV and ET, although SMF is less so. Data for several genes are listed in Table 2.
Table 2
| Genes | ET | PV | PMF | SMF |
|---|---|---|---|---|
| ASXL1 | 3.96 | 3.25 | * | 23.86 |
| U2AF1 | 0.73 | 0.00 | 12.82 | 6.67 |
| SRSF2 | 1.83 | 0.24 | 12.36 | 2.28 |
| TET2 | 10.75 | 17.71 | 11.84 | 23.41 |
| SF3B1 | 1.71 | 1.03 | 7.31 | 5.74 |
| GNAS | 0.15 | 0.56 | 7.14 | 6.45 |
| EZH2 | 0.88 | 1.56 | 5.79 | 6.78 |
| DNMT3A | 3.48 | 4.26 | 5.78 | 0.58 |
| SETBP1 | 0.00 | 0.00 | 5.54 | 5.21 |
| NF1 | 0.48 | 0.89 | 4.99 | 2.05 |
| TP53 | 1.81 | 0.78 | 4.96 | 4.16 |
| NRAS | 0.00 | 0.04 | 4.68 | 3.39 |
| MLL3 | 1.21 | 0.56 | 4.65 | 0.00 |
| PHF6 | 0.14 | 0.40 | 4.29 | 3.33 |
| ZRSR2 | 0.23 | 0.28 | 3.47 | 6.40 |
| CBL | 0.75 | 0.89 | 3.17 | 0.90 |
| CUX1 | 0.26 | 0.18 | 3.06 | 5.21 |
| RUNX1 | 0.14 | 0.24 | 3.05 | 1.06 |
| NFE2 | 1.22 | 4.42 | 1.41 | 5.08 |
Gene mutation frequencies (%) among MPN entities.
Numbers in red referred to their potential features of a specific gene in a given entity.
Within MDS/MPN, JMML was distinguished by specific mutations in RAS signaling genes with an overall rate of 97.5%. An exception was SETBP1, which was mutated in about 10% of JMML cases. In MDS/MPN-RS-T, SF3B1 had a mutation frequency of 89.2% (95% CI 84.6–93.1%). Otherwise, the pooled mutation proportions for the five DNA methylation genes in MDS/MPN-RS-T were similar to those in lMDS. JAK2 and MPL mutation proportions, however, were similar to those in ET. As shown in the heat map in Figure 3, JMML and MDS/MPN-RS-T were distinct entities, and were clearly different from the other three MDS/MPN entities. CMML had high rates of mutation of TET2 (51.6% [95% CI 45.0–58.3%]), SRSF2 (37.3% [95% CI 31.3–43.4%]), ASXL1 (34.5% [95% CI 28.9–40.3%]), RUNX1 (16.8% [95% CI 12.6–21.4%]), and CBL (13.9% [95% CI 11.8–16.1%]), whereas aCML cases had high rates of mutation of ASXL1 (38.5% [95% CI 13.0–68.1%]), TET2 (27.7% [95% CI 14.9–40.3%]), SRSF2 (25.2% [95% CI 4.2–56.1%]), and SETBP1 (23.9% [95% CI 14.1–35.3%]). Both CMML and aCML had high mutation rates of TET2, SRSF2, and ASXL1, partially suggesting the similarity between CMML and aCML. CMML was calculated to be the least dissimilar to aCML; thus, these two entities were plotted in one tree (Figure 3). The frequencies of MPN driver gene mutations were similar in CMML and aCML; however, CMML had higher mutation rates of TET2, SRSF2, RUNX1, CBL, and KRAS, whereas aCML had more SETBP1 and CEBPA mutations. MDS/MPN-U was found to be closer to hMDS, showing a profile of genes more commonly mutated in hMDS than in lMDS.
Figure 3
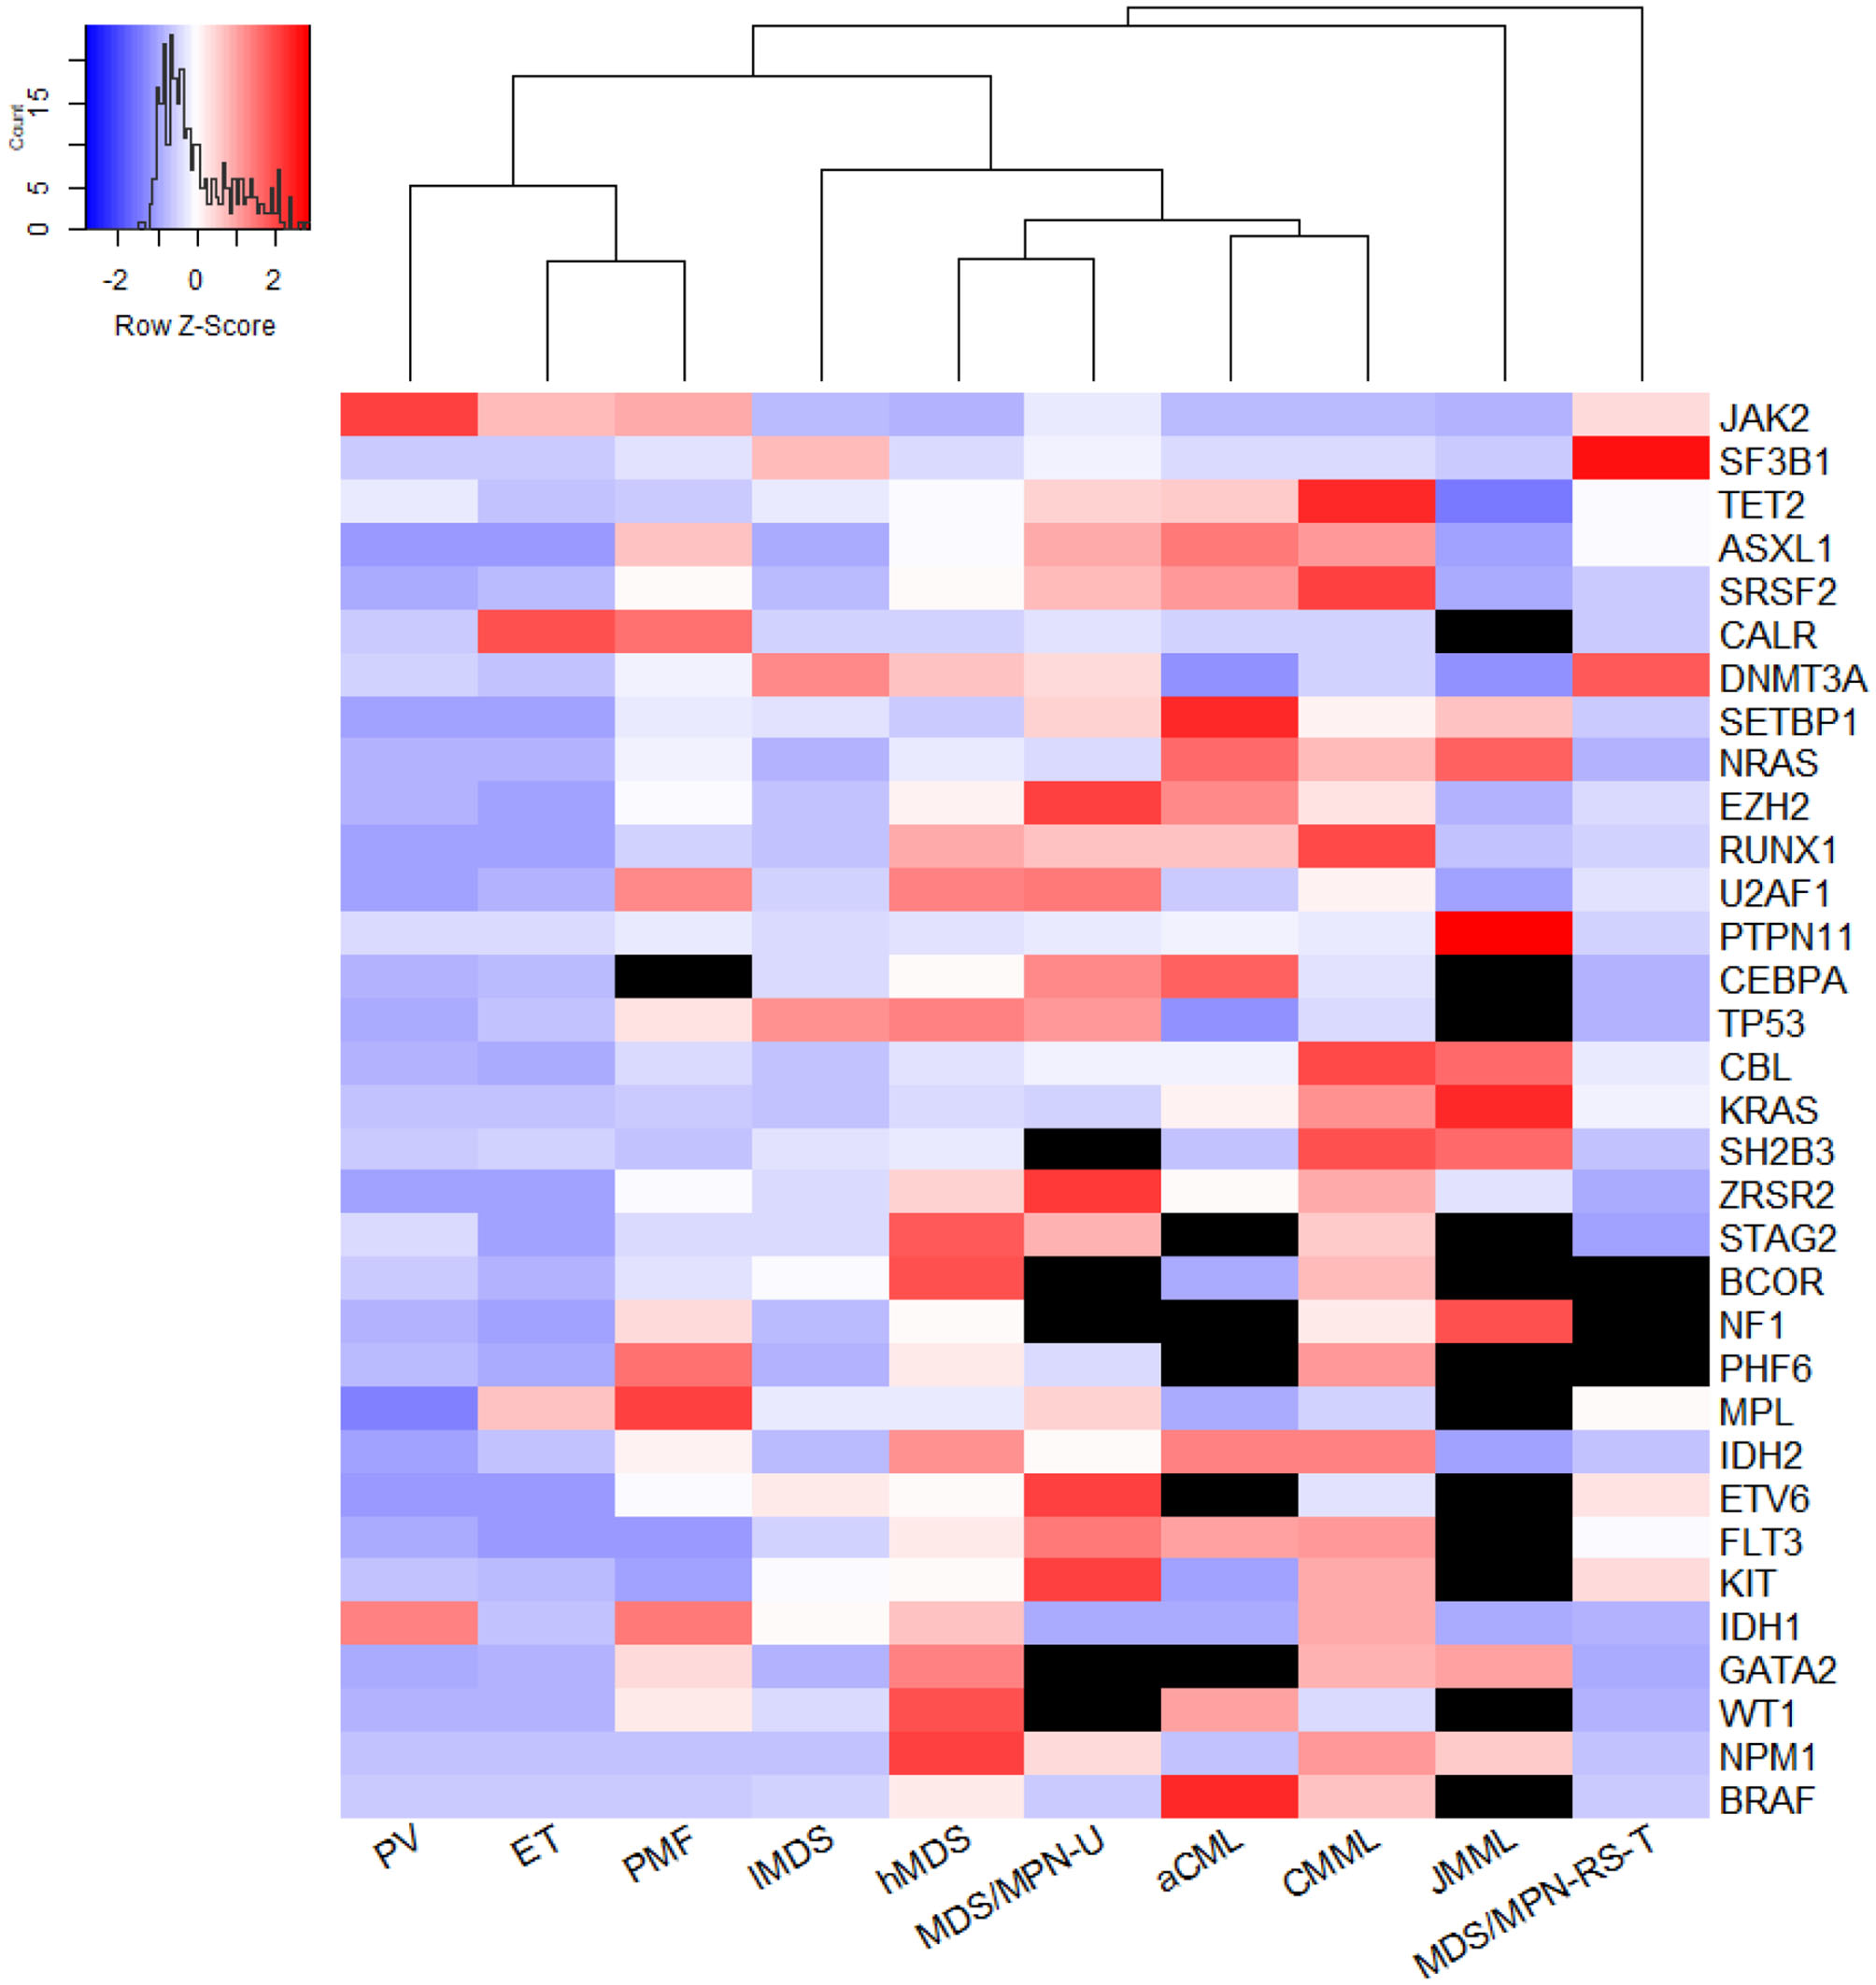
The genetic relationship across entities. The heatmap was plotted using Euclidean distance and hieratical clustering and generated by the method of average agglomeration, using a 32-gene array. The meta-analyzed mutation frequency was centered and scaled in row. Black units stand for unavailable data; redder units represent higher mutation rates while more purple ones mean lower mutation frequency. From this figure, PMF was close to ET. But if excluded the data of three MPN driver genes JAK2, CALR, and MPL, the mutational landscape of PMF was more distinct from PV and ET (not shown). MDS/MPN-U was computed to be least farther away from high-risk MDS. CMML and aCML were plotted in one tree, which meant CMML was calculated to be least dissimilar from aCML. JMML and MDS/MPN-RS-T were two distinct entities distant from the other three MDS/MPN entities.
Heterogeneity
Heterogeneity (I2 ≥ 50%) existed in 86 units (where a unit is one gene mutation in a specific entity) among the 328 units analyzed. Notably, regarding studies screening SF3B1 mutations in lMDS to omit MDS-RS cases substantially reduced the heterogeneity from 97 to 35%.
Sensitivity Analysis
Sensitivity analyses of studies screening ASXL1 in aCML cases and TET2 in hMDS cases showed that the heterogeneity significantly decreased (from over 90% to 0%) when the studies by Meggendorfer et al. (10) and Papaemmanuil et al. (11) were omitted, indicating that these two studies may have caused the instability of the results. For the other four units with heterogeneity higher than 90%, only two studies were involved in the meta-analysis, suggesting a paucity of data and insufficient number of studies. In total, the great heterogeneity of 20 units out of 86, were caused by insufficient number of studies (only 2 studies involved). Sensitivity analyses revealed that the heterogeneity of 42 units could be reduced to <20% when one study was omitted. The results of the sensitivity analyses are detailed in Supplementary Table 2.
We did additional subgroup analyses for the ethnicity and diagnostic criteria which may contribute to the heterogeneity as well. Out of the 13 mutations analyzed, only the frequencies of SRSF2 in hMDS and lMDS showed significant difference between Asian and European cohorts, with p-value of 0.0074 and 0.0362, respectively. Meanwhile, the proportions of ASXL1 in lMDS and SRSF2 in hMDS were significantly different between studies following WHO-2008 and WHO-2016 criteria. But the heterogeneities of all four units were not significantly lowered by the subgrouping. The details of subgroup analyses were listed in Supplementary Table 3.
Publication Bias
For units eligible for publication bias tests, that is, including at least 10 studies, no significant asymmetry was found (p = 0.15–0.95).
Discussion
This study, to our knowledge, is the first meta-analysis to compare gene mutational profiles across MDS, MDS/MPN, and MPN and demonstrate the continuity among them. We reported the pooled mutation frequency of genes screened in at least 150 cases in the three myeloid tumor types. The order and mutation rates found in MDS were largely identical to those reported by Ogawa (7), except that the mutation percentage of the SRSF2 gene was between 10 and 15% in their report rather than around 7% according to the current meta-analysis. Our analysis included studies considered in Ogawa's review, and a few additional ones. The results for MDS/MPN and MPN entities were similar to those of reviews by Tanaka and Bejar (12) and Vainchenker and Kralovics (13), respectively.
In the subgroup analysis, the mutation rates of AML transformation-related genes (IDH2, ETV6, KIT, BRAF, FLT3, WT1, GATA2, NPM1, and IDH1) (14) were lower than 5% for all entities. However, these genes were more frequently mutated in hMDS than in lMDS, reflecting the high risk of leukemic transformation in the hMDS group. Otherwise, the hMDS group displayed higher mutation frequencies of DNA methylation genes, consistent with the fact that hypomethylating agents (HMAs) are first-line therapy for hMDS patients but rarely used for lMDS (15). The lMDS group showed a higher SF3B1 mutation frequency, indicating the relatively good clinical prognosis of these patients. The mutation rate of SF3B1 in lMDS when MDS-RS was excluded was still twice that in hMDS. Therefore, high SF3B1 mutation frequency and low AML transformation-related gene mutation frequency may explain the favorable clinical outcomes in lMDS patients, consistent with the results of studies evaluating the clinical significance of SF3B1 mutations (16). These genetic features in lMDS support current therapeutic practice, which mainly uses supportive care adapted by personalized genotype, followed by close observation (15).
We separated MDS into lMDS and hMDS following the WHO classification not the International Prognostic Scoring System (IPSS). On the one hand, the WHO classification was used to separate risks apart since a significant difference in AML transformation existed between the two risk groups (7, 17, 18). On the other hand, although the IPSS/IPSS-R score is widely used for assessing prognosis, it is not commonly included in the current publications analyzing gene mutation frequencies. For example, out of 53 publications we analyzed, only 2 had reported the frequencies in each IPSS groups. Indeed, the IPSS classification has been reported to be related to mutation status (19). Thus, if more publications adopt IPSS/IPSS-R classification when analyzing gene mutations, a new meta-analysis is certainly needed to address the relationship between IPSS classification and MDS mutation frequencies.
In MPN, TET2, and NFE2 appeared to be PV-distinct genes based on their significantly higher mutation rates compared with ET and PMF. The results for NFE2 were consistent with its single gene analyses (20). Elevated NFE2 levels have been demonstrated to trigger an MPN phenotype in murine models (21, 22), indicating a potential pathophysiological role of NFE2 in MPN. A recent study showed that JMJD1C is a target gene of NFE2 and participates in a positive feedback loop leading to NFE2 overexpression (23). However, Tefferi et al. found that TET2 displayed similar mutation frequencies among MPN subgroups, with no significant impact on survival, leukemic transformation, or thrombosis in PV (24). These different observations were partially due to their small sample size (PV, n = 89; ET n = 57; PMF, n = 60; SMF, n = 21) compared with ours (PV, n = 510; ET n = 1,483; PMF, n = 818; SMF, n = 126). Tefferi's study also showed a significant difference in TET2 mutation frequency between PV and ET. TET2 and NFE2 mutations were not only common in PV but also abundant in SMF, whose mutation rates were the highest across MPN subgroups. Hence, all these results imply that TET2 and NFE2 have functions in the progression of PV.
ASXL1 and splicing gene mutations were predominantly high in PMF compared with other MPN entities; therefore, they were categorized as PMF-specific genes. This category also included eight more genes identified in our analysis. These PMF-specific genes are commonly present in MDS and MDS/MPN, suggesting that PMF is a mixed myeloproliferative/myelodysplastic syndrome rather than a pure MPN such as PV (13). This assumption was supported by the heat map (not shown) excluding the three main driver gene mutations. However, mutations do not necessarily indicate pathogenetic mechanisms. The assumption on the pathogenetic roles of PMF-specific mutations needs further experiments to verify. TET2 and ASXL1 contribute to the pathogenesis of MPN, as demonstrated in zebrafish. Heterozygous loss of ASXL1 induced an MPN phenotype in half of the zebrafish at the age of 5 months. The exhibition of MPN would be more penetrate if a heterozygous TET2 loss was combined with heterozygous loss of ASXL1, whereas a homozygous loss of TET2 combined with heterozygous ASXL1 loss leads to AML progression (25). The association of these two genes with AML transformation is further supported by the finding that they are common not only in post-MPN AML but also in de novo AML and post-MDS AML (26). Thus, TET2 and ASXL1 could be key genes in both the pathogenesis and the progression of MPN. Overall, these mutational features of MPN are reflected in their leukemic transformation risks (10-year risk after diagnosis), which is estimated to be 1% in ET, 4% in PV, and 20% in PMF (27, 28).
Interestingly, SMF exhibited higher mutation rates of PV-distinct genes than did PV itself, but slightly lower rates of PMF-specific mutations than PMF, which may be associated with the pathogenesis of SMF. Compared with PMF, SMF possessed not only a similar frequency of PMF-specific gene mutations but also significantly higher rates of TET2 mutation. This genetic feature of SMF could explain its higher risk of AML transformation. The 5-year transformation rate after diagnosis is around 18% in SMF but 5% in PMF (8).
Within MDS/MPN, JMML, and MDS/MPN-RS-T had marked gene mutations in RAS signaling and SF3B1, respectively. RAS pathway mutations have been traditionally perceived as largely mutually exclusive (29), but this has been disproved by several studies that found 4–17% coexisting genetic hits (30–32). Considering this, our cumulative RAS mutation rate was consistent with those of previous studies (30–32). The leukemic transformation rate of JMML is around 10% over 5 years (32, 33), whereas MDS/MPN-RS-T has a lower rate (34) of two cases out of 82 (2.4%) (35). This difference in leukemic transformation could be partially explained by the difference in genotypes, implying that mutation in RAS signaling might be a negative predictor for AML, whereas SF3B1 is a favorable indicator. Dysregulation of the RAS signaling pathway is a current hot spot of JMML research with respect to pathogenesis, molecular mechanisms, diagnosis, and therapy (36, 37), as is SF3B1 mutation in MDS/MPN-RS-T (38–40). MDS/MPN-RS-T showed similar frequencies of mutations of driver genes to ET, and a similar frequency of SF3B1 mutations to MDS-RS, but it was otherwise distinct from both ET and MDS-RS, indicating its status as a separate entity.
On the other hand, the mutational profiles for CMML and aCML were consistent with the results of their respective reviews (41, 42). Although leukemic transformation rates increased with CMML-specific prognostic model risk levels and varied among reports, its incidence is usually quoted as 15–20% over 3–5 years (41). However, the molecular mechanisms of its pathogenesis and transformation remain unclear. A patient with CMML secondary to familial platelet disorder was reported to have AML transformation owing to a second CBL mutation and 11q-acquired uniparental disomy (11q-aUPD) following a previous RUNX1 mutation, indicating the contribution of CBL mutation during the transformation from CMML to AML (43). Later, the role of CBL mutation in CMML pathogenesis was investigated in a mouse model. Murine mutant CBL not only induced several hallmarks of CMML, for example, sustained myelomonocyte proliferation, but was also related to AML progression in cooperation with the EVI1 gene (44). These two studies were consistent with our finding that the mutation rate of CBL was highest in CMML among all the subgroups analyzed. Owing to hypermethylation caused by loss of TET2, HMAs have been approved for CMML since 2004 in the United States. More than half of CMML patients carry this mutation, a higher rate than in any other entity we analyzed. Mutant TET2 has also been shown to be associated with higher response rates to HMAs in both MDS and CMML patients (45–47).
According to our analysis, CMML was least dissimilar from aCML genetically. Atypical CML cases possessed the same top three mutations as CMML in a different order, and higher rates of SETBP1 and CEBPA mutations. Such genetic likeness or unlikeness may be an indicator of pathogenesis or a predictor of prognosis. SETBP1, in particular, could facilitate diagnosis and serve as a negative prognostic factor (48–50), but its precise role in the pathogenesis of aCML remains unclear. The AML progression rate of aCML is around 30–40% according to the literature (42, 51), higher than that of CMML. This difference could be explained by the genetic differences described above; however, more research is needed.
MDS/MPN-U was calculated to be closest to hMDS, reflecting a high risk of leukemic transformation. A clinical trial in 35 MDS/MPN patients, including 14 with MDS/MPN-U, combined azacytidine (an HMA) with ruxolitinib (a JAK1/2-inhibitor) and found better median survival among patients with MDS/MPN-U than those with CMML or aCML (52). Therefore, therapeutic algorithms for MDS/MPN-U could be based on those used for hMDS, with modifications according to patients' genetic profiles, clinical manifestations, and other important factors.
We also reported the heterogeneity of mutation frequency in each entity and analyzed the possible contributions to the high heterogeneity. The results suggested that paucity of data, disturbance of one study, ethnicity of patients and criteria of diagnosis might cause the instability of the results. However, subgrouping by the last two factors did not show significantly low heterogeneity, which might indicate their roles are compounded by other factors we do not include. Another consideration is the insufficiency of data: <150 Asian patients of lMDS were involved to test the role of ethnicity and <200 patients diagnosed by WHO-2016 criteria were included. Therefore, more studies following the newer WHO criteria and reporting different ethnic groups were needed.
In summary, this meta-analysis directly demonstrated the genetic continuity among three myeloid tumor types, MDS, MPN, and MDS/MPN. Distinguishing mutational features were highlighted, and their importance in pathogenesis, diagnosis, prognosis, and therapeutic use were explained and discussed. Our analysis could provide useful insights for future research, including mechanism studies and drug development.
Statements
Data availability statement
All datasets presented in this study are included in the article/Supplementary Material.
Author contributions
ZW and BH performed the database search, assessed the studies for inclusion, and extracted the data. ZW performed the statistical analyses and wrote the manuscript. BH revised the draft. All authors approved the final submitted version.
Funding
This study was supported by grants from the Beijing Natural Science Foundation (7192168), the Chinese Academy of Medical Sciences (CAMS) Innovation Fund for Medical Sciences (2016-I2M-3-004), and the Non-profit Central Research Institute Fund of CAMS (2019XK 320047).
Conflict of interest
The authors declare that the research was conducted in the absence of any commercial or financial relationships that could be construed as a potential conflict of interest.
Supplementary material
The Supplementary Material for this article can be found online at: https://www.frontiersin.org/articles/10.3389/fonc.2020.579221/full#supplementary-material
References
1.
Deininger MWN Tyner JW Solary E . Turning the tide in myelodysplastic/myeloproliferative neoplasms. Nat Rev Cancer. (2017) 17:425–40. 10.1038/nrc.2017.40
2.
Papaemmanuil E Cazzola M Boultwood J Malcovati L Vyas P Bowen D et al . Somatic SF3B1 mutation in myelodysplasia with ring sideroblasts. N Engl J Med. (2011) 365:1384–95. 10.1056/NEJMoa1103283
3.
Levine RL Wadleigh M Cools J Ebert BL Wernig G Huntly BJ et al . Activating mutation in the tyrosine kinase JAK2 in polycythemia vera, essential thrombocythemia, and myeloid metaplasia with myelofibrosis. Cancer cell. (2005) 7:387–97. 10.1016/j.ccr.2005.03.023
4.
Stroup DF Berlin JA Morton SC Olkin I Williamson GD Rennie D et al . Meta-analysis of observational studies in epidemiology: a proposal for reporting. Meta-analysis Of Observational Studies in Epidemiology (MOOSE) group. JAMA. (2000) 283:2008–12. 10.1001/jama.283.15.2008
5.
Vardiman JW Thiele J Arber DA Brunning RD Borowitz MJ Porwit A et al . The 2008 revision of the World Health Organization (WHO) classification of myeloid neoplasms and acute leukemia: rationale and important changes. Blood. (2009) 114:937–51. 10.1182/blood-2009-03-209262
6.
Arber DA Orazi A Hasserjian R Thiele J Borowitz MJ Le Beau MM et al . The 2016 revision to the World Health Organization classification of myeloid neoplasms and acute leukemia. Blood. (2016) 127:2391–405. 10.1182/blood-2016-03-643544
7.
Ogawa S . Genetics of MDS. Blood. (2019) 133:1049–59. 10.1182/blood-2018-10-844621
8.
Courtier F Garnier S Carbuccia N Guille A Adélaide J Chaffanet M et al . Targeted molecular characterization shows differences between primary and secondary myelofibrosis. Genes Chromosomes Cancer. (2020) 59:30–9. 10.1002/gcc.22789
9.
Rotunno G Pacilli A Artusi V Rumi E Maffioli M Delaini F et al . Epidemiology and clinical relevance of mutations in postpolycythemia vera and postessential thrombocythemia myelofibrosis: a study on 359 patients of the AGIMM group. Am J Hematol. (2016) 91:681–6. 10.1002/ajh.24377
10.
Meggendorfer M Haferlach T Alpermann T Jeromin S Haferlach C Kern W et al . Specific molecular mutation patterns delineate chronic neutrophilic leukemia, atypical chronic myeloid leukemia, and chronic myelomonocytic leukemia. Haematologica. (2014) 99:e244–6. 10.3324/haematol.2014.113159
11.
Papaemmanuil E Gerstung M Malcovati L Tauro S Gundem G Van Loo P et al . Clinical and biological implications of driver mutations in myelodysplastic syndromes. Blood. (2013) 122:3616–99. 10.1182/blood-2013-08-518886
12.
Tanaka TN Bejar R . MDS overlap disorders and diagnostic boundaries. Blood. (2019) 133:1086–95. 10.1182/blood-2018-10-844670
13.
Vainchenker W Kralovics R . Genetic basis and molecular pathophysiology of classical myeloproliferative neoplasms. Blood. (2017) 129:667–79. 10.1182/blood-2016-10-695940
14.
Makishima H Yoshizato T Yoshida K Sekeres MA Radivoyevitch T Suzuki H et al . Dynamics of clonal evolution in myelodysplastic syndromes. Nat Genet. (2017) 49:204–12. 10.1038/ng.3742
15.
Platzbecker U . Treatment of MDS. Blood. (2019) 133:1096–107. 10.1182/blood-2018-10-844696
16.
Malcovati L Papaemmanuil E Bowen DT Boultwood J Della Porta MG Pascutto C et al . Clinical significance of SF3B1 mutations in myelodysplastic syndromes and myelodysplastic/myeloproliferative neoplasms. Blood. (2011) 118:6239–46. 10.1182/blood-2011-09-377275
17.
Patnaik MM Tefferi A . Refractory anemia with ring sideroblasts (RARS) and RARS with thrombocytosis (RARS-T):2017 update on diagnosis, risk-stratification, and management. Am J Hematol. (2017) 92:297–310. 10.1002/ajh.24637
18.
Breccia M Carmosino I Biondo F Mancini M Russo E Latagliata R et al . Usefulness and prognostic impact on survival of WHO reclassification in FAB low risk myelodyplastic syndromes. Leuk Res. (2006) 30:178–82. 10.1016/j.leukres.2005.06.015
19.
Jiang L Luo Y Zhu S Wang L Ma L Zhang H et al . Mutation status and burden can improve prognostic prediction of patients with lower-risk myelodysplastic syndromes. Cancer Sci. (2020) 111:580–91. 10.1111/cas.14270
20.
Goerttler PS Kreutz C Donauer J Faller D Maiwald T März E et al . Gene expression profiling in polycythaemia vera: overexpression of transcription factor NF-E2. Br J Haematol. (2005) 129:138–50. 10.1111/j.1365-2141.2005.05416.x
21.
Kaufmann KB Gründer A Hadlich T Wehrle J Gothwal M Bogeska R et al . A novel murine model of myeloproliferative disorders generated by overexpression of the transcription factor NF-E2. J Exp Med. (2012) 209:35–50. 10.1084/jem.20110540
22.
Jutzi JS Bogeska R Nikoloski G Schmid CA Seeger TS Stegelmann F et al . MPN patients harbor recurrent truncating mutations in transcription factor NF-E2. J Exp Med. (2013) 210:1003–19. 10.1084/jem.20120521
23.
Peeken JC Jutzi JS Wehrle J Koellerer C Staehle HF Becker H et al . Epigenetic regulation of NFE2 overexpression in myeloproliferative neoplasms. Blood. (2018) 131:2065–73. 10.1182/blood-2017-10-810622
24.
Tefferi A Pardanani A Lim KH Abdel-Wahab O Lasho TL Patel J et al . TET2 mutations and their clinical correlates in polycythemia vera, essential thrombocythemia and myelofibrosis. Leukemia. (2009) 23:905–11. 10.1038/leu.2009.47
25.
Gjini E Jing CB Nguyen AT Reyon D Gans E Kesarsing M et al . Disruption of asxl1 results in myeloproliferative neoplasms in zebrafish. Dis Models Mechanisms. (2019) 12:dmm035790. 10.1242/dmm.035790
26.
Abdel-Wahab O Manshouri T Patel J Harris K Yao J Hedvat C et al . Genetic analysis of transforming events that convert chronic myeloproliferative neoplasms to leukemias. Cancer Res. (2010) 70:447–52. 10.1158/0008-5472.CAN-09-3783
27.
Rampal R Mascarenhas J . Pathogenesis and management of acute myeloid leukemia that has evolved from a myeloproliferative neoplasm. Curr Opin Hematol. (2014) 21:65–71. 10.1097/MOH.0000000000000017
28.
Cerquozzi S Tefferi A . Blast transformation and fibrotic progression in polycythemia vera and essential thrombocythemia: a literature review of incidence and risk factors. Blood Cancer J. (2015) 5:e366. 10.1038/bcj.2015.95
29.
Locatelli F Niemeyer CM . How I treat juvenile myelomonocytic leukemia. Blood. (2015) 125:1083–90. 10.1182/blood-2014-08-550483
30.
Stieglitz E Taylor-Weiner AN Chang TY Gelston LC Wang Y-D Mazor T et al . The genomic landscape of juvenile myelomonocytic leukemia. Nat Genet. (2015) 47:1326–33. 10.1038/ng.3400
31.
Caye A Strullu M Guidez F Cassinat B Gazal S Fenneteau O et al . Juvenile myelomonocytic leukemia displays mutations in components of the RAS pathway and the PRC2 network. Nat Genet. (2015) 47:1334–40. 10.1038/ng.3420
32.
Murakami N Okuno Y Yoshida K Shiraishi Y Nagae G Suzuki K et al . Integrated molecular profiling of juvenile myelomonocytic leukemia. Blood. (2018) 131:1576–86. 10.1182/blood-2017-07-798157
33.
Luna-Fineman S Shannon KM Atwater SK Davis J Masterson M Ortega J et al . Myelodysplastic and myeloproliferative disorders of childhood: a study of 167 patients. Blood. (1999) 93:459–66. 10.1182/blood.V93.2.459
34.
Patnaik MM Tefferi A . Refractory anemia with ring sideroblasts (RARS) and RARS with thrombocytosis: “2019 update on diagnosis, risk-stratification, and management.” Am J Hematol. (2019) 94:475–88. 10.1002/ajh.25397
35.
Patnaik MM Lasho TL Finke CM Hanson CA King RL Ketterling RP et al . Predictors of survival in refractory anemia with ring sideroblasts and thrombocytosis (RARS-T) and the role of next-generation sequencing. Am J Hematol. (2016) 91:492–8. 10.1002/ajh.24332
36.
Niemeyer CM Flotho C . Juvenile myelomonocytic leukemia: who's the driver at the wheel?Blood. (2019) 133:1060–70. 10.1182/blood-2018-11-844688
37.
Locatelli F Algeri M Merli P Strocchio L . Novel approaches to diagnosis and treatment of Juvenile myelomonocytic leukemia. Expert Rev Hematol. (2018) 11:129–43. 10.1080/17474086.2018.1421937
38.
Malcovati L Karimi M Papaemmanuil E Ambaglio I Jädersten M Jansson M et al . SF3B1 mutation identifies a distinct subset of myelodysplastic syndrome with ring sideroblasts. Blood. (2015) 126:233–41. 10.1182/blood-2015-03-633537
39.
Tang Y Miao M Han S Qi J Wang H Ruan C et al . Prognostic value and clinical feature of SF3B1 mutations in myelodysplastic syndromes: a meta-analysis. Crit Rev Oncol hematol. (2019) 133:74–83. 10.1016/j.critrevonc.2018.07.013
40.
Obeng EA Chappell RJ Seiler M Chen MC Campagna DR Schmidt PJ et al . Physiologic expression of Sf3b1(K700E) causes impaired erythropoiesis, aberrant splicing, and sensitivity to therapeutic spliceosome modulation. Cancer Cell. (2016) 30:404–17. 10.1016/j.ccell.2016.08.006
41.
Patnaik MM Tefferi A . Chronic myelomonocytic leukemia: 2018 update on diagnosis, risk stratification and management. Am J Hematol. (2018) 93:824–40. 10.1002/ajh.25104
42.
Schwartz LC Mascarenhas J . Current and evolving understanding of atypical chronic myeloid leukemia. Blood Rev. (2019) 33:74–81. 10.1016/j.blre.2018.07.004
43.
Shiba N Hasegawa D Park MJ Murata C Sato-Otsubo A Ogawa C et al . CBL mutation in chronic myelomonocytic leukemia secondary to familial platelet disorder with propensity to develop acute myeloid leukemia (FPD/AML). Blood. (2012) 119:2612–4. 10.1182/blood-2011-02-333435
44.
Nakata Y Ueda T Nagamachi A Yamasaki N Ikeda KI Sera Y et al . Acquired expression of Cbl(Q367P) in mice induces dysplastic myelopoiesis mimicking chronic myelomonocytic leukemia. Blood. (2017) 129:2148–60. 10.1182/blood-2016-06-724658
45.
Bejar R Lord A Stevenson K Bar-Natan M Pérez-Ladaga A Zaneveld J et al . TET2 mutations predict response to hypomethylating agents in myelodysplastic syndrome patients. Blood. (2014) 124:2705–12. 10.1182/blood-2014-06-582809
46.
Itzykson R Kosmider O Cluzeau T Mansat-De Mas V Dreyfus F Beyne-Rauzy O et al . Impact of TET2 mutations on response rate to azacitidine in myelodysplastic syndromes and low blast count acute myeloid leukemias. Leukemia. (2011) 25:1147–52. 10.1038/leu.2011.71
47.
Duchmann M Yalniz FF Sanna A Sallman D Coombs CC Renneville A et al . Prognostic Role of gene mutations in chronic myelomonocytic leukemia patients treated with hypomethylating agents. EBioMedicine. (2018) 31:174–81. 10.1016/j.ebiom.2018.04.018
48.
Piazza R Valletta S Winkelmann N Redaelli S Spinelli R Pirola A et al . Recurrent SETBP1 mutations in atypical chronic myeloid leukemia. Nat Genet. (2013) 45:18–24. 10.1038/ng.2495
49.
Meggendorfer M Bacher U Alpermann T Haferlach C Kern W Gambacorti-Passerini C et al . SETBP1 mutations occur in 9% of MDS/MPN and in 4% of MPN cases and are strongly associated with atypical CML, monosomy 7, isochromosome i(17)(q10), ASXL1 and CBL mutations. Leukemia. (2013) 27:1852–60. 10.1038/leu.2013.133
50.
Damm F Itzykson R Kosmider O Droin N Renneville A Chesnais V et al . SETBP1 mutations in 658 patients with myelodysplastic syndromes, chronic myelomonocytic leukemia and secondary acute myeloid leukemias. Leukemia. (2013) 27:1401–3. 10.1038/leu.2013.35
51.
Wang SA Hasserjian RP Fox PS Rogers HJ Geyer JT Chabot-Richards D et al . Atypical chronic myeloid leukemia is clinically distinct from unclassifiable myelodysplastic/myeloproliferative neoplasms. Blood. (2014) 123:2645–51. 10.1182/blood-2014-02-553800
52.
Assi R Kantarjian HM Garcia-Manero G Cortes JE Pemmaraju N Wang X et al . A phase II trial of ruxolitinib in combination with azacytidine in myelodysplastic syndrome/myeloproliferative neoplasms. Am J Hematol. (2018) 93:277–85. 10.1002/ajh.24972
Summary
Keywords
myelodysplastic syndromes (MDS), myeloproliferative neoplasms (MPN), myelodysplastic/myeloproliferative neoplasms (MDS/MPN), gene, mutation frequency
Citation
Wan Z and Han B (2020) Comparison and Implications of Mutational Profiles of Myelodysplastic Syndromes, Myeloproliferative Neoplasms, and Myelodysplastic/Myeloproliferative Neoplasms: A Meta-Analysis. Front. Oncol. 10:579221. doi: 10.3389/fonc.2020.579221
Received
02 July 2020
Accepted
08 September 2020
Published
07 October 2020
Volume
10 - 2020
Edited by
Alessandro Isidori, AORMN Hospital, Italy
Reviewed by
Giovanni Barosi, Fondazione Ospedale San Matteo (IRCCS), Italy; Esther Natalie Oliva, Grande Ospedale Metropolitano Bianchi Melacrino Morelli, Italy
Updates
Copyright
© 2020 Wan and Han.
This is an open-access article distributed under the terms of the Creative Commons Attribution License (CC BY). The use, distribution or reproduction in other forums is permitted, provided the original author(s) and the copyright owner(s) are credited and that the original publication in this journal is cited, in accordance with accepted academic practice. No use, distribution or reproduction is permitted which does not comply with these terms.
*Correspondence: Bing Han hanbing_li@sina.com
This article was submitted to Hematologic Malignancies, a section of the journal Frontiers in Oncology
Disclaimer
All claims expressed in this article are solely those of the authors and do not necessarily represent those of their affiliated organizations, or those of the publisher, the editors and the reviewers. Any product that may be evaluated in this article or claim that may be made by its manufacturer is not guaranteed or endorsed by the publisher.