 Juan Xu1†
 Nanhui Yu2,3†Pan Zhao4Fangfang Wang1Jingcao Huang1Yushan Cui1Hong Ding1Yan Yang1Yuhan Gao1Ling Pan1Hong Chang1Yu Wu1Bing Xiang1Yuping Gong1Xiao Shuai1Li Hou1Liping Xie1
 Ting Niu1Ting Liu1
 Li Zhang1Weiping Liu5Wenyan Zhang5Ying Qu1Wei Lin3,6Yimin Zhu3*†
 Sha Zhao5*†
 Yuhuan Zheng1*†
- 1Department of Hematology, Institute of Hematology, West China Hospital, Sichuan University, Chengdu, China
- 2Department of Anesthesiology, The Second Xiangya Hospital of Central South University, Changsha, China
- 3Hunan Provincial Key Lab of Emergency and Critical Care, Hunan Provincial People’s Hospital, Changsha, China
- 4Department of Hematology, Affiliated Hospital of North Sichuan Medical College, Nanchong, China
- 5Department of Pathology, West China Hospital, Sichuan University, Chengdu, China
- 6State Key Laboratory for Oncogenes and Related Genes, Division of Cardiology, Renji Hospital, School of Medicine, Shanghai Cancer Institute, Shanghai Jiaotong University, Shanghai, China
Macrophage migration inhibitory factor (MIF) has been shown to promote disease progression in many malignancies, including multiple myeloma (MM). We previously reported that MIF regulates MM bone marrow homing and knockdown of MIF favors the extramedullary myeloma formation in mice. Here, based on MIF immunostaining of myeloma cells in paired intramedullary and extramedullary biopsies from 17 patients, we found lower MIF intensity in extramedullary MM (EMM) versus intramedullary MM (IMM). Flow cytometry and histology analysis in xenograft models showed a portion of inoculated human MM cells lost their MIF expression (MIFLow) in vivo. Of note, IMM had dominantly MIFHigh cells, while EMM showed a significantly increased ratio of MIFLow cells. Furthermore, we harvested the extramedullary human MM cells from a mouse and generated single-cell transcriptomic data. The developmental trajectories of MM cells from the MIFHigh to MIFLow state were indicated. The MIFHigh cells featured higher proliferation. The MIFLow ones were more quiescent and harbored abundant ribosomal protein genes. Our findings identified in vivo differential regulation of MIF expression in MM and suggested a potential pathogenic role of MIF in the extramedullary spread of disease.
Introduction
The proliferation of clonal plasma cells in multiple myeloma (MM) is typically confined to the bone marrow (BM). However, the extramedullary spread of MM cells, defined as extramedullary multiple myeloma (EMM), may occur at any time in the course of MM (1). Patients with EMM have inferior outcomes (2, 3). Broadly speaking, there are two main types of EMM: plasmacytomas extending from local bone lesions (para-skeletal or extramedullary bone-related, EM-B) or resulting from hematogenous dissemination (extra-skeletal or extramedullary-extraosseous, EM-E) (1, 4, 5). Previous studies have suggested that EM-E showed an even worse prognosis than EM-B (3). In addition, plasma cell leukemia (PCL) might be considered as a specific variant of EMM (5). Nevertheless, some authors have suggested that PCL should be excluded from the EMM spectrum because of PCL’s unique disease entity (4).
The pathogenesis of EMM has not been fully understood. Various genetic and microenvironment mechanisms might affect the occurrence of EMM, including the presence of 13q14 deletion, t(4;14) or TP53 mutation, frequent mutations in the RAS pathway (6–10), the impairment of C–X–C motif chemokine receptor 4 (CXCR4)/stromal-derived factor 1Alpha(SDF-1α) (11–13), differential expression of adhesion molecules, such as very-late-antigen-4 (VLA-4), CD56, CD44 and P-selection (14–17), and upregulation of angiogenic factors like CD31 and endoglin (16). We previously identified macrophage migration inhibitory factor (MIF), a soluble pro-inflammatory cytokine, as a regulator of MM BM homing (18). MIF is highly expressed in MM BM and regulated downstream adhesion molecules’ expression in MM cells; knocking down MIF in MM cells hampered MM adhesion to BM stromal cells in vitro, therefore resulting more extramedullary tumors in an SCID mice model (18). To investigate the variation of MIF in EMM versus the parental intramedullary MM (IMM), we initiated this comparative study using paired BM and extramedullary biopsies from a series of MM patients. MIF regulation and the associated single-cell trajectories in EMM were further studied using xenograft mouse models.
Materials and Methods
Patient Samples
Formalin-fixed, paraffin-embedded (FFPE) paired tumor samples of BM and extramedullary tissues were retrospectively collected from 17 MM patients who had extramedullary involvement with the following inclusion criteria: 1) the patient was admitted to our hospital from 2014 to 2019; 2) the patient with confirmed MM had pathologically verified extramedullary involvement either at initial diagnosis (primary EMM) or during relapse/progression (secondary EMM); 3) imaging or physical examination showed measurable lesions of EMM. Both EM-B (extramedullary bone-related) and EM-E (extramedullary-extraosseous) myeloma were included in this study; 4) EMM and the corresponding IMM samples from each patient were collected at the same disease stage. Patients with solitary plasmacytoma, PCL, lymphoma with plasmacytic differentiation, or any additional malignancy were excluded. Cytogenetic examination of BM plasma cells was recommended by physicians. This study was approved by the Ethical Committee of West China Hospital, Sichuan University, China. All patients were consented for use of their medical records and samples for research.
Patient-Derived Primary MM Cells
With the approval by the Ethical Committee of West China Hospital, primary MM cells were obtained from consenting patient #16 when MM progressed with extensive extramedullary disease. Mono-nuclear cells (MNCs) were separated from his iliac BM aspirate by Ficoll-density gradient centrifugation. CD138+ myeloma cells were flow-sorted (Beckman Coulter CytoFLEX platform) using phycoerythrin (PE)-conjugated mouse anti-human CD138 antibody (BD, Biosciences, Cat.# 552026), and cryopreserved in our department tissue bank. For inoculation, the primary MM cells were resuscitated, cultured for 24 h in RPMI-1640 medium with 10% fetal bovine serum (FBS) in 5% CO2 atmosphere at 37°C, washed with phosphate buffered saline (PBS), and then resuspended in PBS at a concentration of 5 × 10⁶/ml.
Human MM Cell Line and CRISPR Based Target Gene Knock Out
The human MM cell line ARD was a generous gift from Prof. Yiguo Hu (State Key Laboratory of Biotherapy and Cancer Center, West China Hospital, Sichuan University). ARD cells were authenticated by short tandem repeat (STR) profiling (GENEWIZ, Inc. Suzhou, China) before experiment. We knocked out MIF gene in the ARD cells by the CRISPR/Cas9 system as previously described (19). The plasmid pHKO23 was also kindly gifted from Prof. Yiguo Hu. The single guided RNAs (sgRNAs) targeting human MIF gene were as follows:
CACCGAGCTCGGAGAGGAACCCGTC(fwd); AAACGACGGGTTCCTCTCCGAGCTC (rev).
Both ARD and MIF−/− ARD cells were stably infected by luciferase expressing lentivirus (HanBio Inc., Shanghai, China). All cells were cultured in RPMI-1640 medium supplemented with 10% fetal bovine serum, 100 U/ml penicillin, and 100 g/ml streptomycin at 37°C and 5%CO2, and were mycoplasma free. Cells were resuspended in PBS at 2 × 10⁷/ml for injection.
In Vivo Mouse Models of Human MM
All animal experiments were approved by the Animal Care and Use Committees of West China Hospital, Sichuan University and were performed in accordance with the ethical standards. To establish xenograft models, patient-derived primary MM cells or luciferase-expressing ARD cell line were implanted into six-week-old female immunocompromised B-NDG mice (NOD-Prkdcscid IL2rgtm1/Bcgen, Biocytogen Jiangsu CO., Ltd.) via tail vein injection. A total of 13 mice were used in this study, including those challenged with the primary MM cells (0.5 × 10⁶ cells per mouse, n = 4) or wild type (w.t.) ARD cells (2 × 10⁶ cells per mouse, n = 5), and control mice given MIF−/− ARD cells (2 × 10⁶ cells per mouse, n = 2) or vehicle (100 μl PBS, n = 2). Mice were housed in pathogen-free conditions and inspected at least twice a week to monitor general health and disease symptoms. Mice in morbid state were sacrificed. Eyeballs were removed under anesthesia to collect blood. Subsequently, they were euthanized via cervical dislocation and dissected for further examinations.
In Vivo Bioluminescent Imaging
For tumor monitoring, cell line-derived MM bearing mice were subjected to in vivo bioluminescent imaging (BLI) using IVIS spectrum (PerkinElmer, Inc.), on days 7, 14, 21, 28 post inoculation. D-luciferin, potassium salt (Biovision, USA, Cat.# 7903), a substrate of luciferase, was injected intraperitoneally (15 mg/ml in PBS, with 150 μl per mouse). At 15 min after administration, image acquisition was performed under isoflurane anesthesia.
Immunohistochemistry Analysis and Result Quantification
Tumor specimens were fixed in 10% neutral buffered formalin, decalcified (bone tissues), paraffin-embedded and then processed for immunohistochemistry (IHC) staining. FFPE sections were deparaffinized and rehydrated, and incubated with 3% H2O2 for 10 min to block endogenous peroxidase activity. Antigens were retrieved with sodium citrate buffer (10 mM, pH 6.0, at 98°C for 10 min). Nonspecific binding was blocked with 5% normal goat serum in TBST, for 1 h at room temperature. Primary antibodies including rabbit polyclonal MIF antibody (dilution 1:400, Santa Cruz Biotechnology, Cat.# FL-115) and rabbit monoclonal CD138 antibody (dilution 1:400, Abcam, Cat.# ab128936) were applied overnight at 4°C. Then, the sections were incubated with biotinylated goat anti-rabbit IgG and streptavidin–biotin complex (SABC) following manufacturer’s instructions (Boster Biological Technology, Cat.# SA1022, China). Signal was developed by diaminobenzidine (DAB) detection kit (ZSGB-Bio, China, Cat.# ZLI-9031), followed by hematoxylin re-dying. The stained slides were imaged under an upright fluorescence microscope (AX10 imager A2/AX10 cam HRC, Zeiss, Germany). For better evaluating MIF intensity, the paired IMM and EMM samples were prepared and photographed for MIF staining synchronously. To evaluate DAB intensity of MIF staining in patients’ slides, wide-field images were captured by the TissueFAXS system (TissueGnostics) as previously described (20), and the mean MIF intensity was quantified using the StrataQuest software (TissueGnostics) followed the manufacturer’s instruction. Pathological analyses of all slides were reviewed by an expert pathologist.
Opal Multicolor Staining
We used opal multicolor staining to visualize CD138 and MIF on selected human FFPE slides with Opal 4-color manual IHC kit (PerkinElmer, Inc.) as previously described (21).
Flow Cytometry Analysis
MM cells engraftment in different murine organs was assessed by flow cytometry as previously described using Beckman Coulter CytoFLEX platform (18). Single-cell suspensions were prepared from blood, spleen, liver, lung, kidney and femurs (BM) following relevant guidelines (22). Collagenase D (Sigma-Aldrich, Cat.# 11088858001) was used (1 mg/ml, at 37°C for 30 min) for enzymatic digestion of solid organs, like lung and kidney. Myeloma cells were identified by phycoerythrin (PE)-conjugated mouse anti-human CD138 antibody (BD, Biosciences, Cat.# 552026). Since MIF was an intracellular protein, cells were fixed and permeabilized using the intracellular Fix & Perm buffer set (Invitrogen eBioscience, Cat.# 88-8824-00), followed by MIF staining with Alexa Fluor 488-conjugated mouse anti-human MIF antibody (Clone# 932606) (R&D systems, Cat.# IC2891G). 7-Aminoactinomycin D (7-AAD) (AAT Bioquest, Cat.# 17501) was applied to label non-viable cells before permeabilization. The results were analyzed by the FlowJo software.
Single Cell Sequencing and Data Analysis
Splenic cells were collected from a tumor-bearing mouse xenografted with ARD cells. CD138-positive MM cells were then sorted by PE-conjugated CD138 antibody (BD, Biosciences, Cat.# 552026) using flow cytometry technology. The construction, sequencing and processing of the single-cell transcriptome library was conducted by the Chengdu Neo-life Hope Medical Laboratory Co. Ltd.
MacoskoDropSeq pipeline was used to generate the single-cell transcriptome profile (23). The raw pair-end sequencing data were first processed using DropSeq Core computation protocol developed at McCarrll’s lab. The derived digital expression matrix was then used to generate Seurat object using Seurat R package. The downstream analyses and data visualization were performed using Seurat functions. The following Seurat functions were used in the Seurat pre-processing pipeline: NormalizeData, ScaleData were used for calculate the comparable expression values; FindVariableFeatures were used to include the variable genes that contribute to the overall similarity/variability of cellular transcriptomic profiles; RunPCA, FindNeighbors, FindClusters, RunTSNE, and RunUMAP were used to calculate the dimension-reduction coordinates for visualization and to perform unsupervised clustering. In the downstream analyses, we used Uniform Manifold Approximation and Projection (UMAP) coordinates to visualize the layout of the cells. We used Monocle2 software to explore the possible differentiation path of these xenografted plasma cells and identify the subclusters using the default software parameters (24).
We used top 10 principle components to represent the digital expression profiles of each cells, and calculate the median values of these 10 principle components of each putative clusters. Then we calculate the overall dissimilarity using the cosine distances algorithm. The abovementioned dissimilarity measure was defined in TooManyCells method (25). The hierarchical cluster was plotted based on the dissimilarity matrix of each cluster.
Statistical Analysis
Statistical analyses were performed using Graphpad Prism 8 (GraphPad Softwares, USA). Comparisons of continuous variables were made by student’s t-test or analysis of variance (ANOVA). The co-expression relationship between two genes was tested by simple linear regression. Mann–Whitney U test was used to compare variables with no specific distribution from independent samples. A p <0.05 was considered statistically significant.
Results
Differential MIF Expression in EMM Versus IMM in Patients
Previously, we showed that MIF-knockdown (MIF-KD) MM cells had decreased BM homing and were likely to form extramedullary tumors in MM mouse models (18). In this study, we retrospectively collected FFPE biopsies of IMM and EMM from 17 MM patients. The patient characteristics are shown in Table 1. Twelve males (70.6%) and five females (29.4%) were included, with a median age of 63 years (range, 44–74 years). Most of the patients had IgG myeloma (10/17, 58.8%), the others had IgA (5/17, 29.4%), IgD (1/17, 5.9%) and λ light chain (1/17, 5.9%) myeloma. Thirteen of them (76.5%) were diagnosed with primary EMM, and four with secondary EMM (23.5%). There were 10 EM-B samples (58.8%) and 7 EM-E samples (41.2%), with available imaging data for extramedullary lesions in eight cases (Supplementary Figures 1A, B). Nine patients had available cytogenetic information (9/17, 52.9%). The most frequent genetic abnormalities included deletion of chromosome 13q14, immunoglobulin heavy chain gene (IGH) translocations and 1q21 amplification.
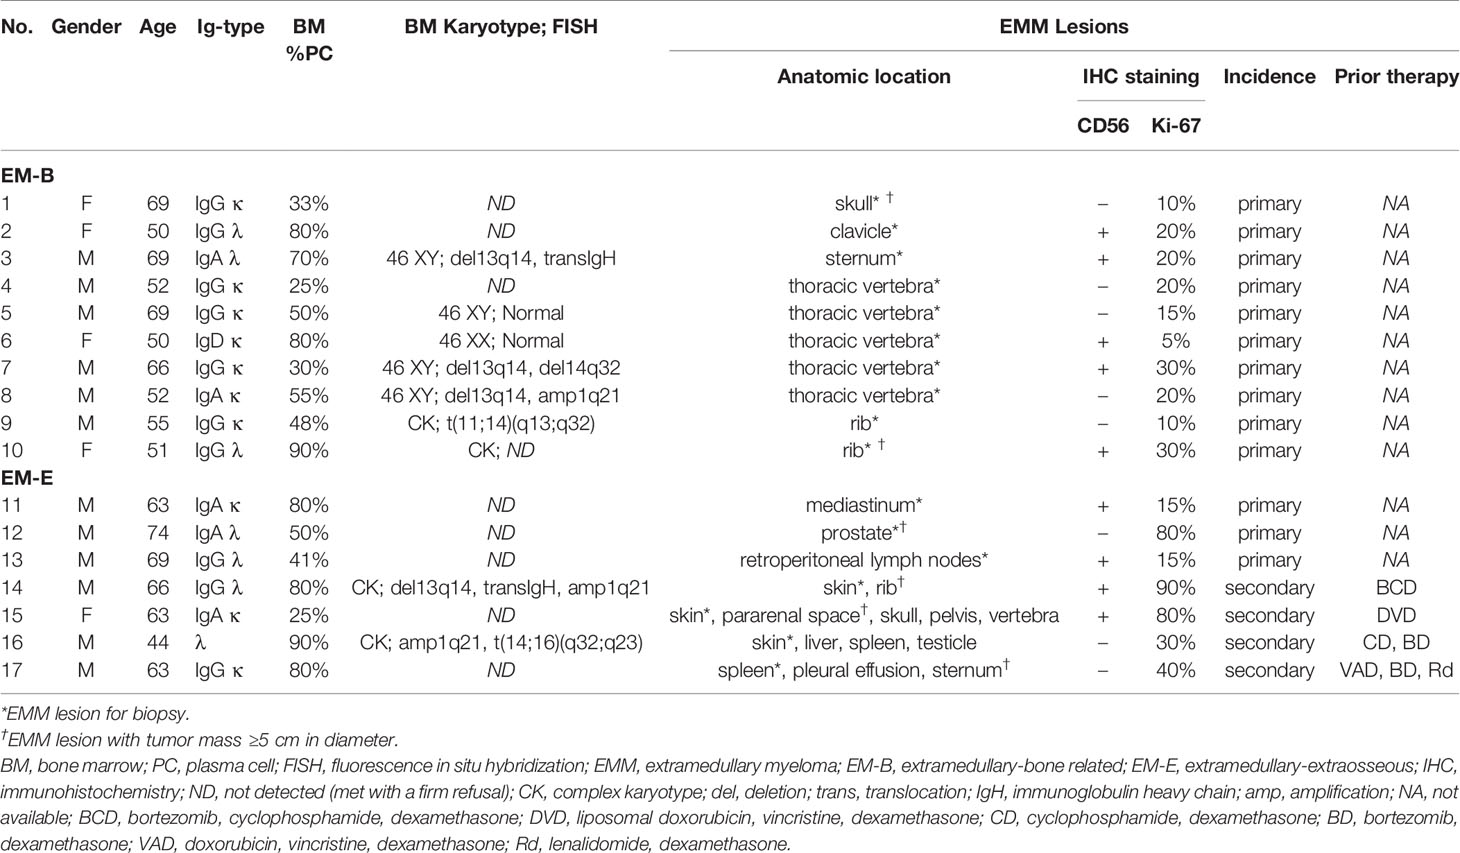
Table 1 Patient Characteristics (n = 17).
Pathological analysis revealed higher MIF expression in IMM than in the paired EMM, as shown in the representative IHC staining in Figures 1A, B (all IHC data are available in Supplementary Figure 2). First, MM cells were positive for CD138 expression in all tumor samples (Figures 1A, B and Supplementary Figure 2). The invasive pattern in IMM varied from interstitial infiltration, focal aggregation to diffuse sheets. As for EMM, a diffuse or nest-like distribution of MM cells was more common. Second, MM cells from all tested samples generally showed cytoplasmic MIF expression. Nevertheless, differential expression of MIF was observed in EMM versus IMM (Figures 1A, B and Supplementary Figure 2). Quantification of MIF staining (Supplementary Figure 3) confirmed that MM-derived MIF expression was significantly higher in IMM than in EMM for the same patient (Figures 1C, D). In addition, we performed opal multicolor staining and immunofluorescence microscopy in selected paired FFPE samples to examine MIF expression. In agree with IHC data, lower MIF expression in EMM biopsies was observed in opal multicolor staining (Figures 2A, B). Overall, our data suggest that EMM clones tended to have down-regulated MIF expression compared with the corresponding IMM clones.
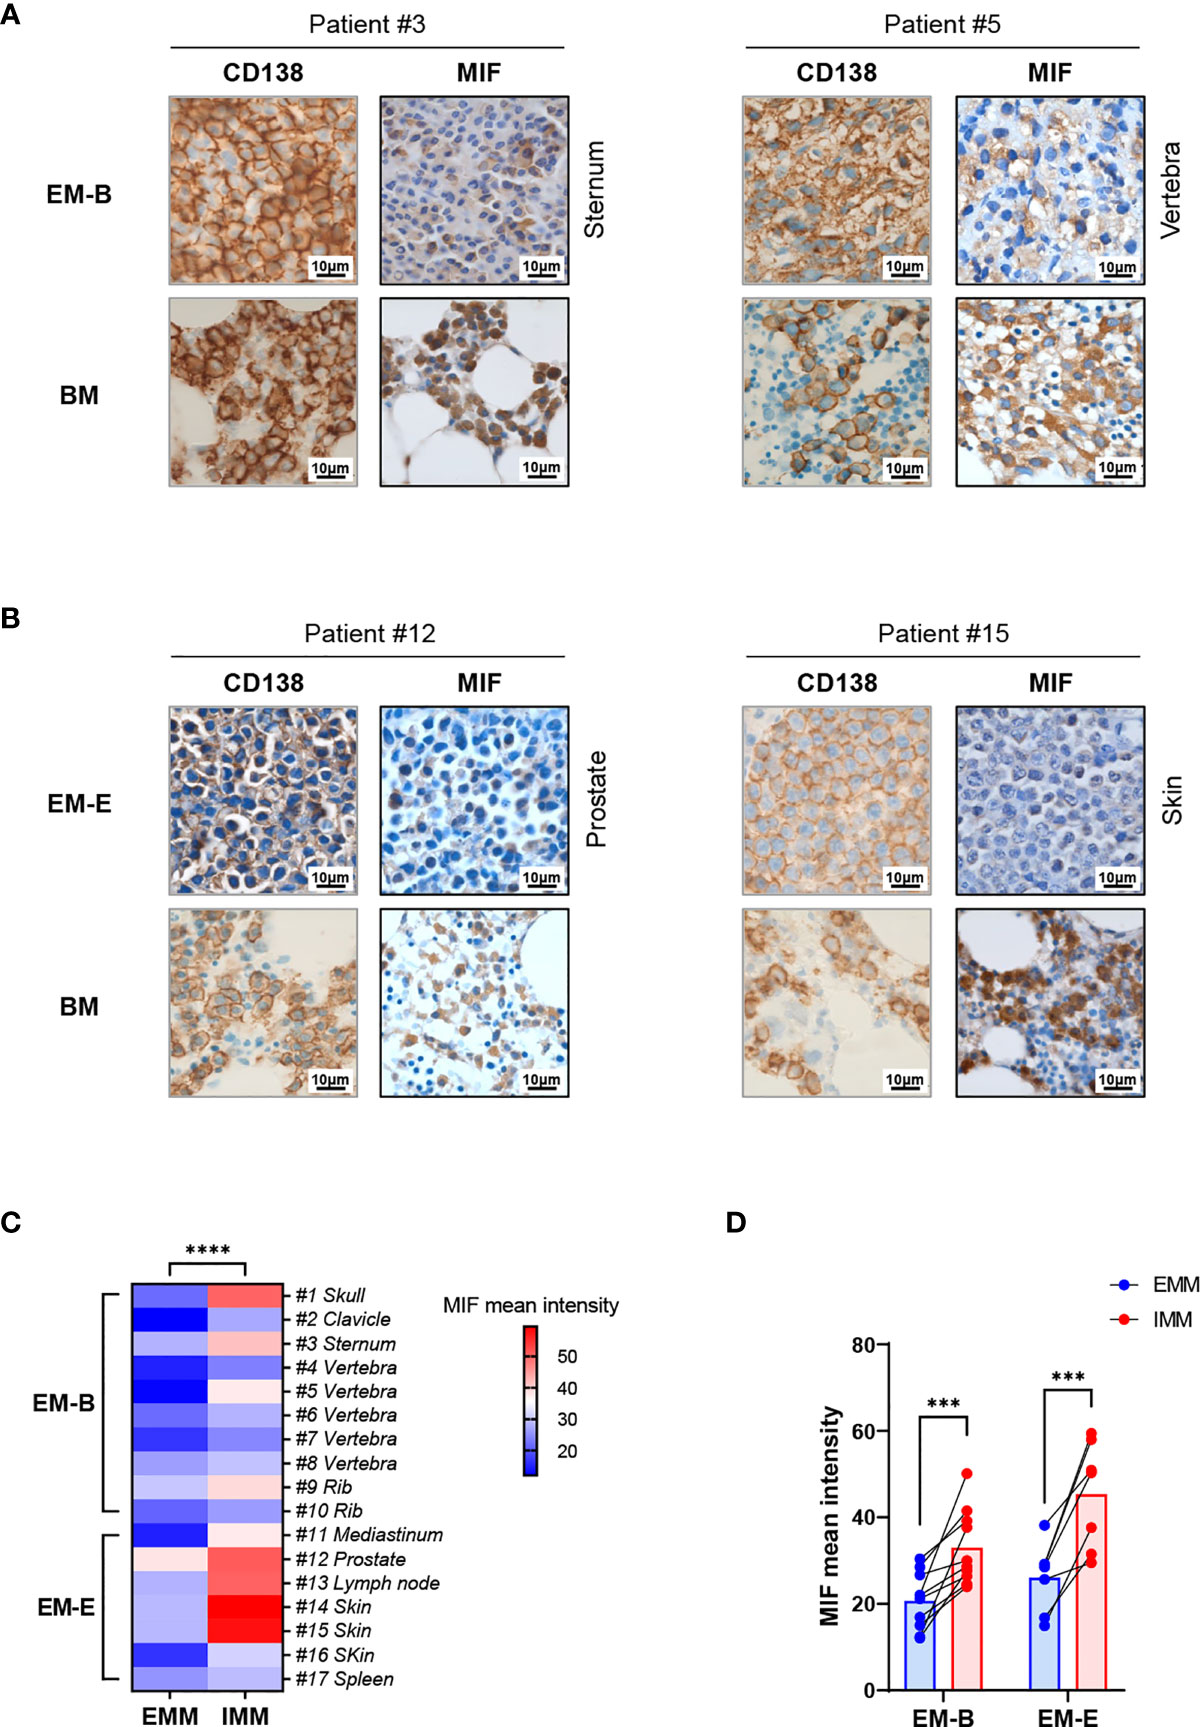
Figure 1 IHC staining showing MIF expression in EMM versus corresponding IMM. (A, B) IHC staining for CD138 and MIF in the paired samples from representative cases: the plasma cells highlighted by CD138 show higher MIF expression in IMM than in paired EMM, either for EM-B (A) or for EM-E (B; magnification 100×). (C, D) MIF intensity quantification based on wide-field IHC imaging indicates its intratumor heterogeneity; all EMM samples (n = 17) display downregulated MIF expression compared to the IMM counterparts. ****p < 0.0001, ***p < 0.001 (two-way ANOVA).
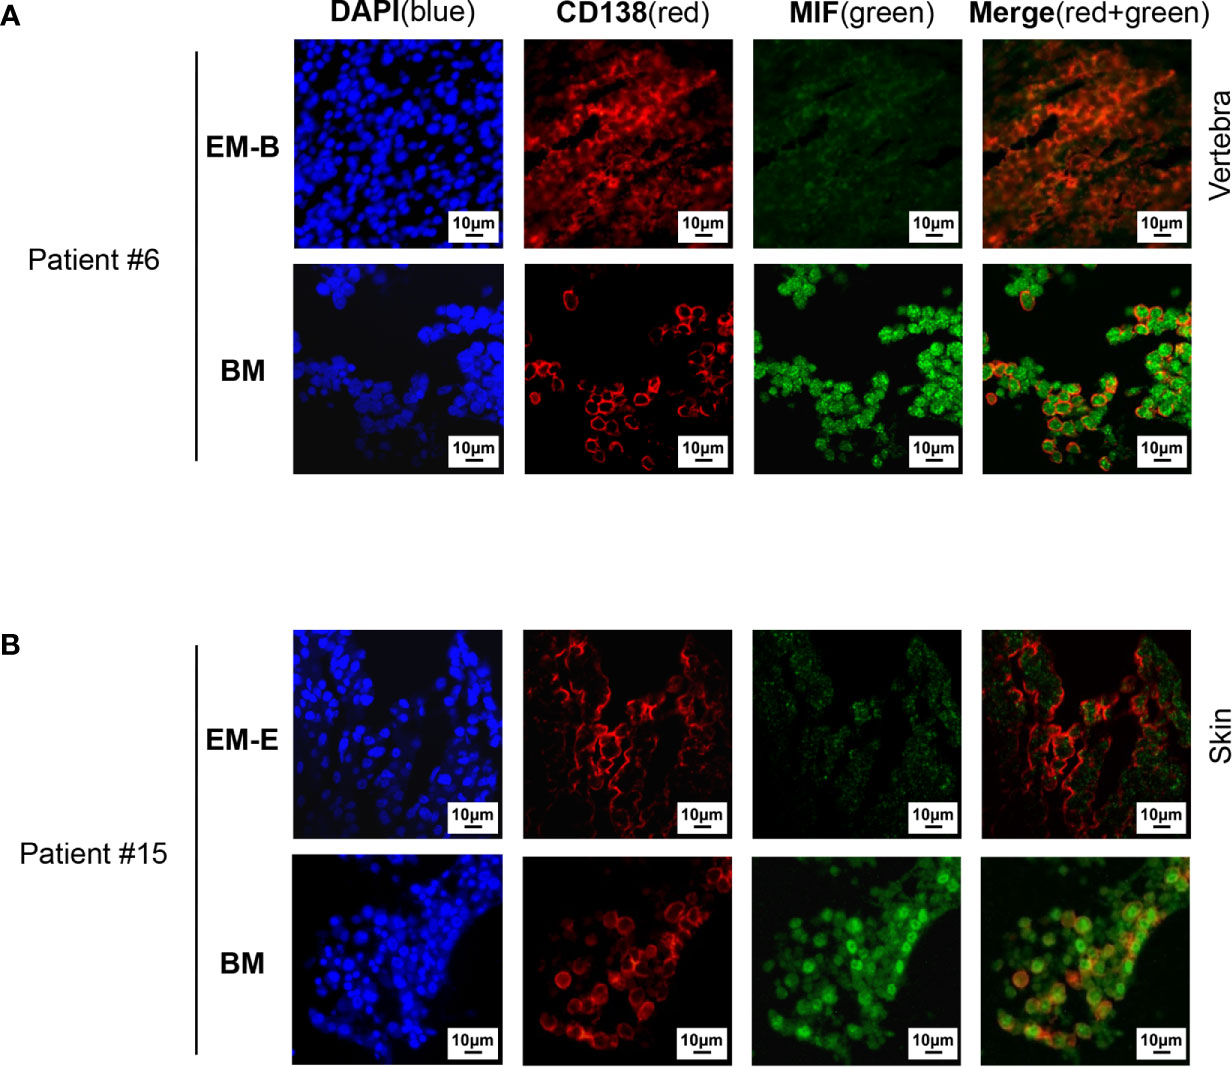
Figure 2 Immunofluorescence staining of MIF expression in EMM versus corresponding IMM. (A, B) Differential MIF expression in paired samples is also confirmed by opal multicolor staining in representative cases, including EM-B (A) and EM-E (B) (DAPI represents nuclear, red represents CD138, and green represents MIF; original magnification 40×).
Intratumor Heterogeneity of MIF Expression In Vivo in Myeloma Mouse Models
To further investigate the differential MIF expression in MM cells in vivo, immunodeficient mice were intravenously inoculated with two type of human MM cells. The primary BM MM cells were derived from a patient with advanced EM-E disease. The human MM cell line ARD was cell line-verified as single clonal PCs. MIF knockout ARD cells were used as a negative control for the animal study (Supplementary Figure 4A). All above cells showed consistent strong MIF expression in vitro (Supplementary Figure 4B). Compared with vehicle control, all the mice challenged with MM cells exhibited obvious morbidity as shown by significant weight loss, rough hair coat and limited mobility. Disease onset seemed to be earlier in ARD cell line-derived model than in the PDX model. In vivo BLI in mice revealed the formation of both IMM and EMM after inoculation with ARD or MIF−/− ARD cells, the latter resulting more evident EMM (Supplementary Figure 4C), consistent with our previous findings (18). Tumor-bearing mice became moribund approximately 4–5 weeks after inoculation and thus to be euthanized (3–4 weeks after ARD cells injection, and 4–5 weeks after primary cells injection).
Cells isolated from BM, visceral organs, and peripheral blood, were analyzed using flow cytometry for MIF expression in MM cells (CD138+ cells) in vivo. MM cells were identified in all tested samples with varied percentages, distributing mostly in BM, spleen, liver and lung (Figures 3A, B, 4A, B). In MIF−/− ARD inoculated mouse, the MM cells showed no MIF expression (Figures 3A, 4A). Both patient primary MM cells and w.t. ARD cells exhibited two populations with differential MIF expression in vivo: MIFHigh versus MIFLow. Mean fluorescence intensity (MFI) of MIF in MIFHigh cells was more than 10 folds higher than that in MIFLow cells (Figures 3C, 4C). Of note, the relative proportion of MIFHigh and MIFLow MM cells was quite different between IMM and EMM samples. In general, IMM was found to have a significantly higher ratio of MIFHigh/MIFLow MM cells compared to EMM: MM cells in BM were dominantly a MIFHigh population, while in extramedullary organs or peripheral blood, the percentages of MIFHigh cells decreased, and the MIFLow population became remarkable (Figures 3D, 4D). In the PDX scenario, MIFHigh cells still constituted the majority of EMM, except the lung lesions (Figure 3D). As to the ARD model, MIFHigh cells turned to be overwhelmed by MIFLow ones in most EMM samples (Figure 4D). In addition, IHC staining for CD138 and MIF were performed in BM and spleen samples from tumor-bearing mice. The infiltrating cells positive for CD138 were a mixture of MIFHigh and MIFLow ones, with more evident loss of MIF expression in spleen versus BM (Figures 3E, 4E).
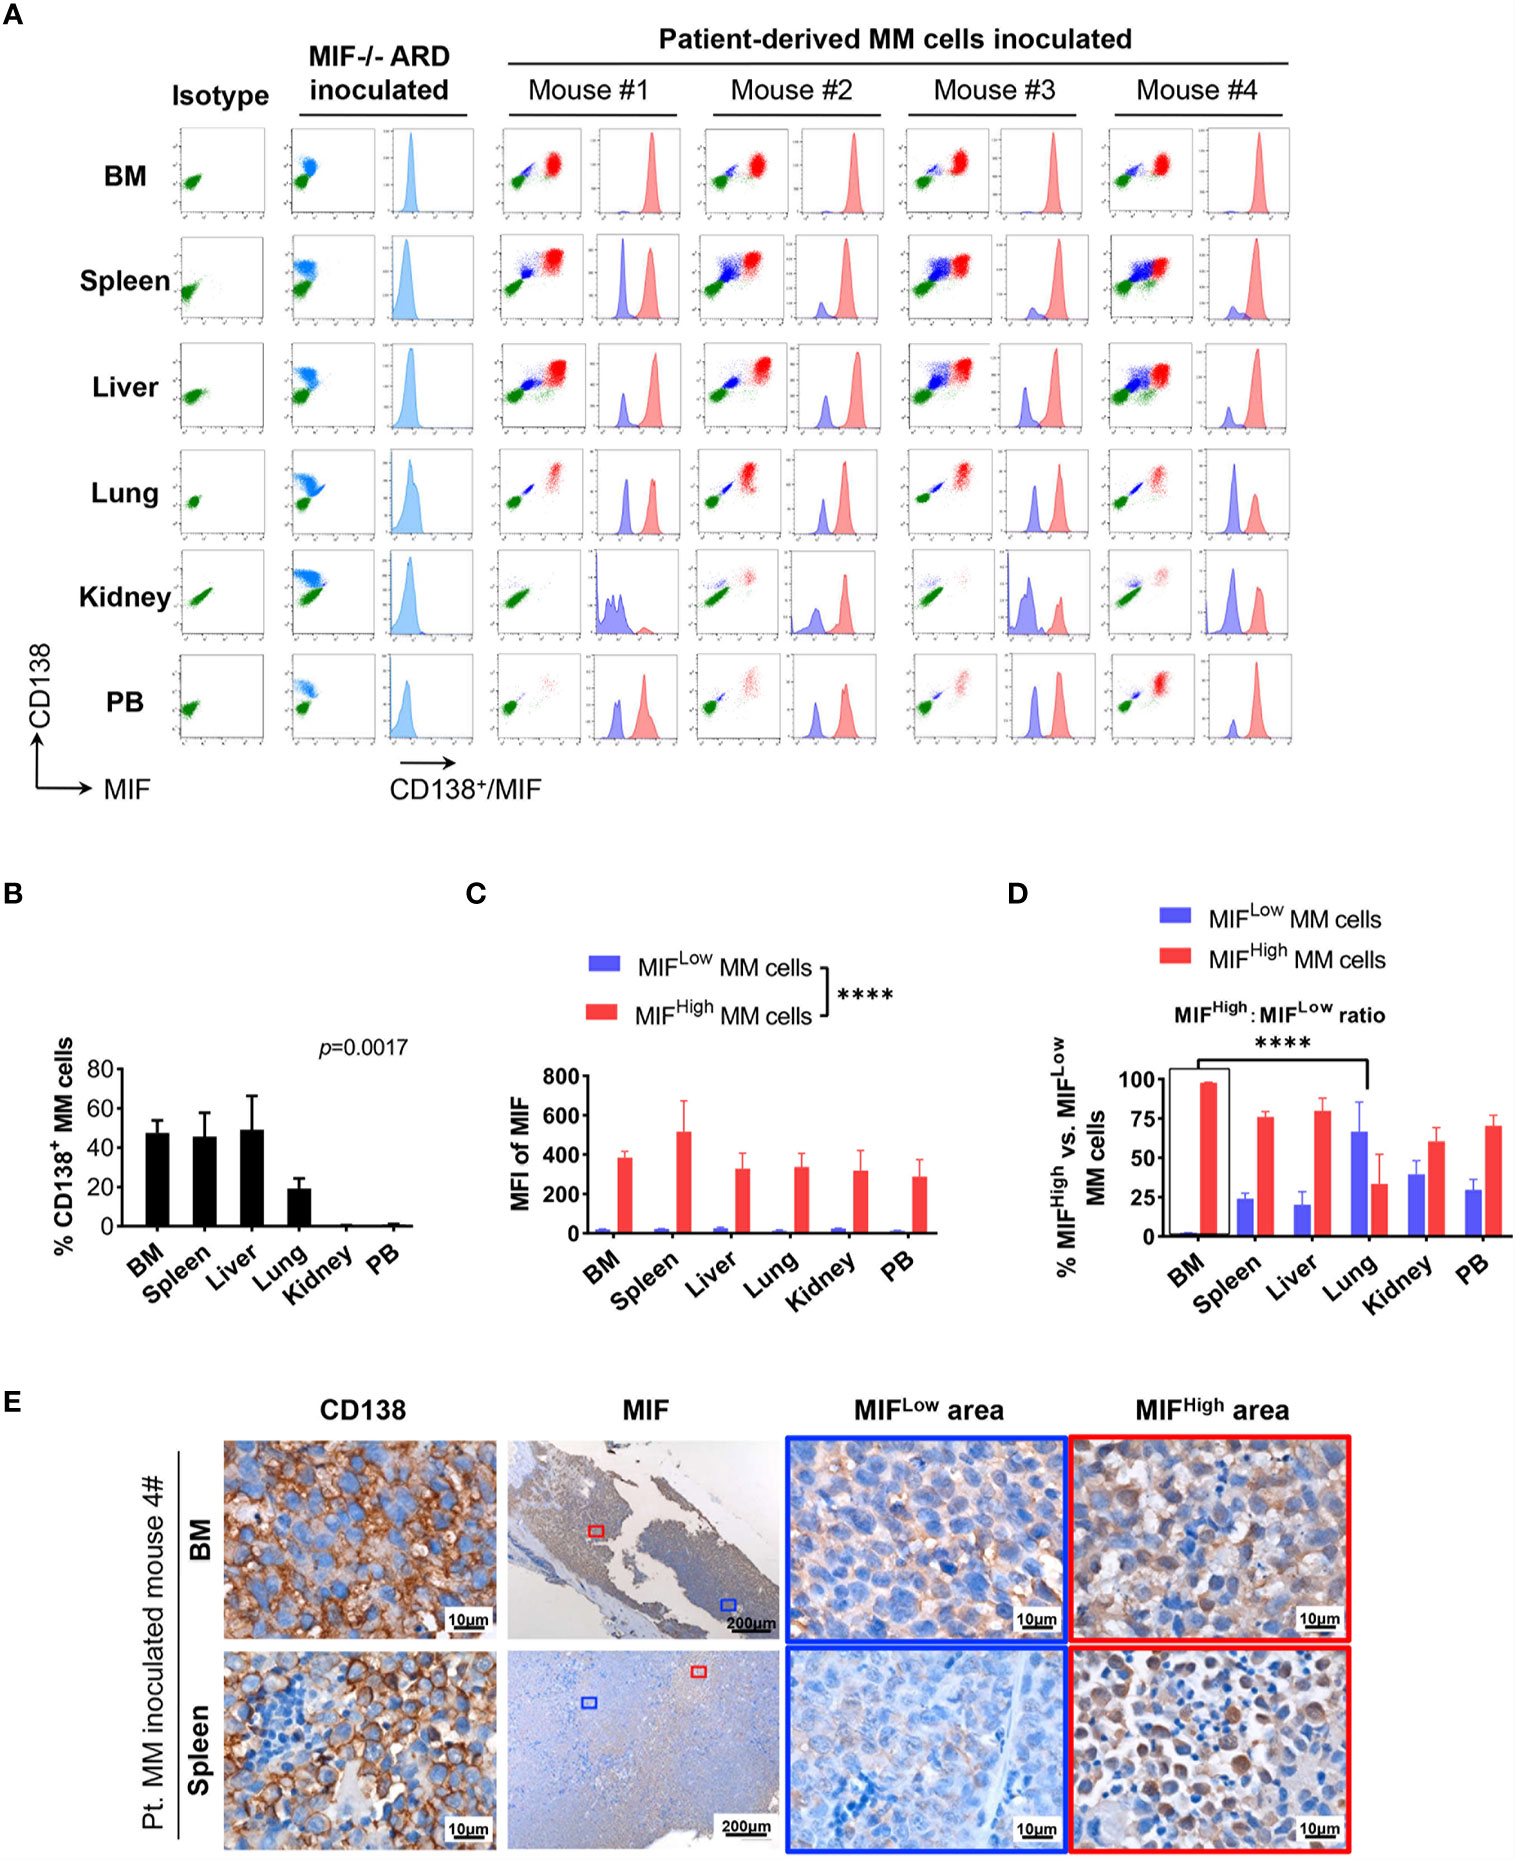
Figure 3 Identification of MIFHigh and MIFLow MM cells in patient-derived xenografts. (A) Patient #16-derived BM CD138+ cells were intravenously injected into B-NDG mice to generate a PDX model (n = 4). They were euthanized to collect fresh tissue cells for flow cytometry within four to five weeks after inoculation. Mice received MIF−/− ARD cells were used as negative controls. Representative plots show the expression profiles of CD138 and MIF in isolated cells. Green represents CD138− cells, namely non-MM cells; light blue represents MIF− MM cells, dark blue represents MIFLow MM cells, red represents MIFHigh MM cells. (B) Percentage of infiltrating CD138+ MM cells varies considerably in collected samples (n = 4). P = 0.0017 (two-way ANOVA). (C) Compare mean fluorescence intensity (MFI) of MIF between MIFHigh and MIFLow populations in diverse samples. The mean value ± standard deviation is 362.5 ± 81.8 and 19.5 ± 5.5 respectively. ****p < 0.0001 (two-way ANOVA). (D) Ratio of MIFHigh/MIFLow MM cells is notably higher in BM compared to extramedullary samples. ****p < 0.0001 (student’s t-test). (E) Representative IHC staining images of paired FFPE samples show sheets of MIFLow CD138+ cells surrounded by MIFHigh ones, and more evident loss of MIF expression in EMM (spleen) than in IMM (the blue and red boxes indicate representative areas of MIFLow and MIFHigh MM cells, respectively).
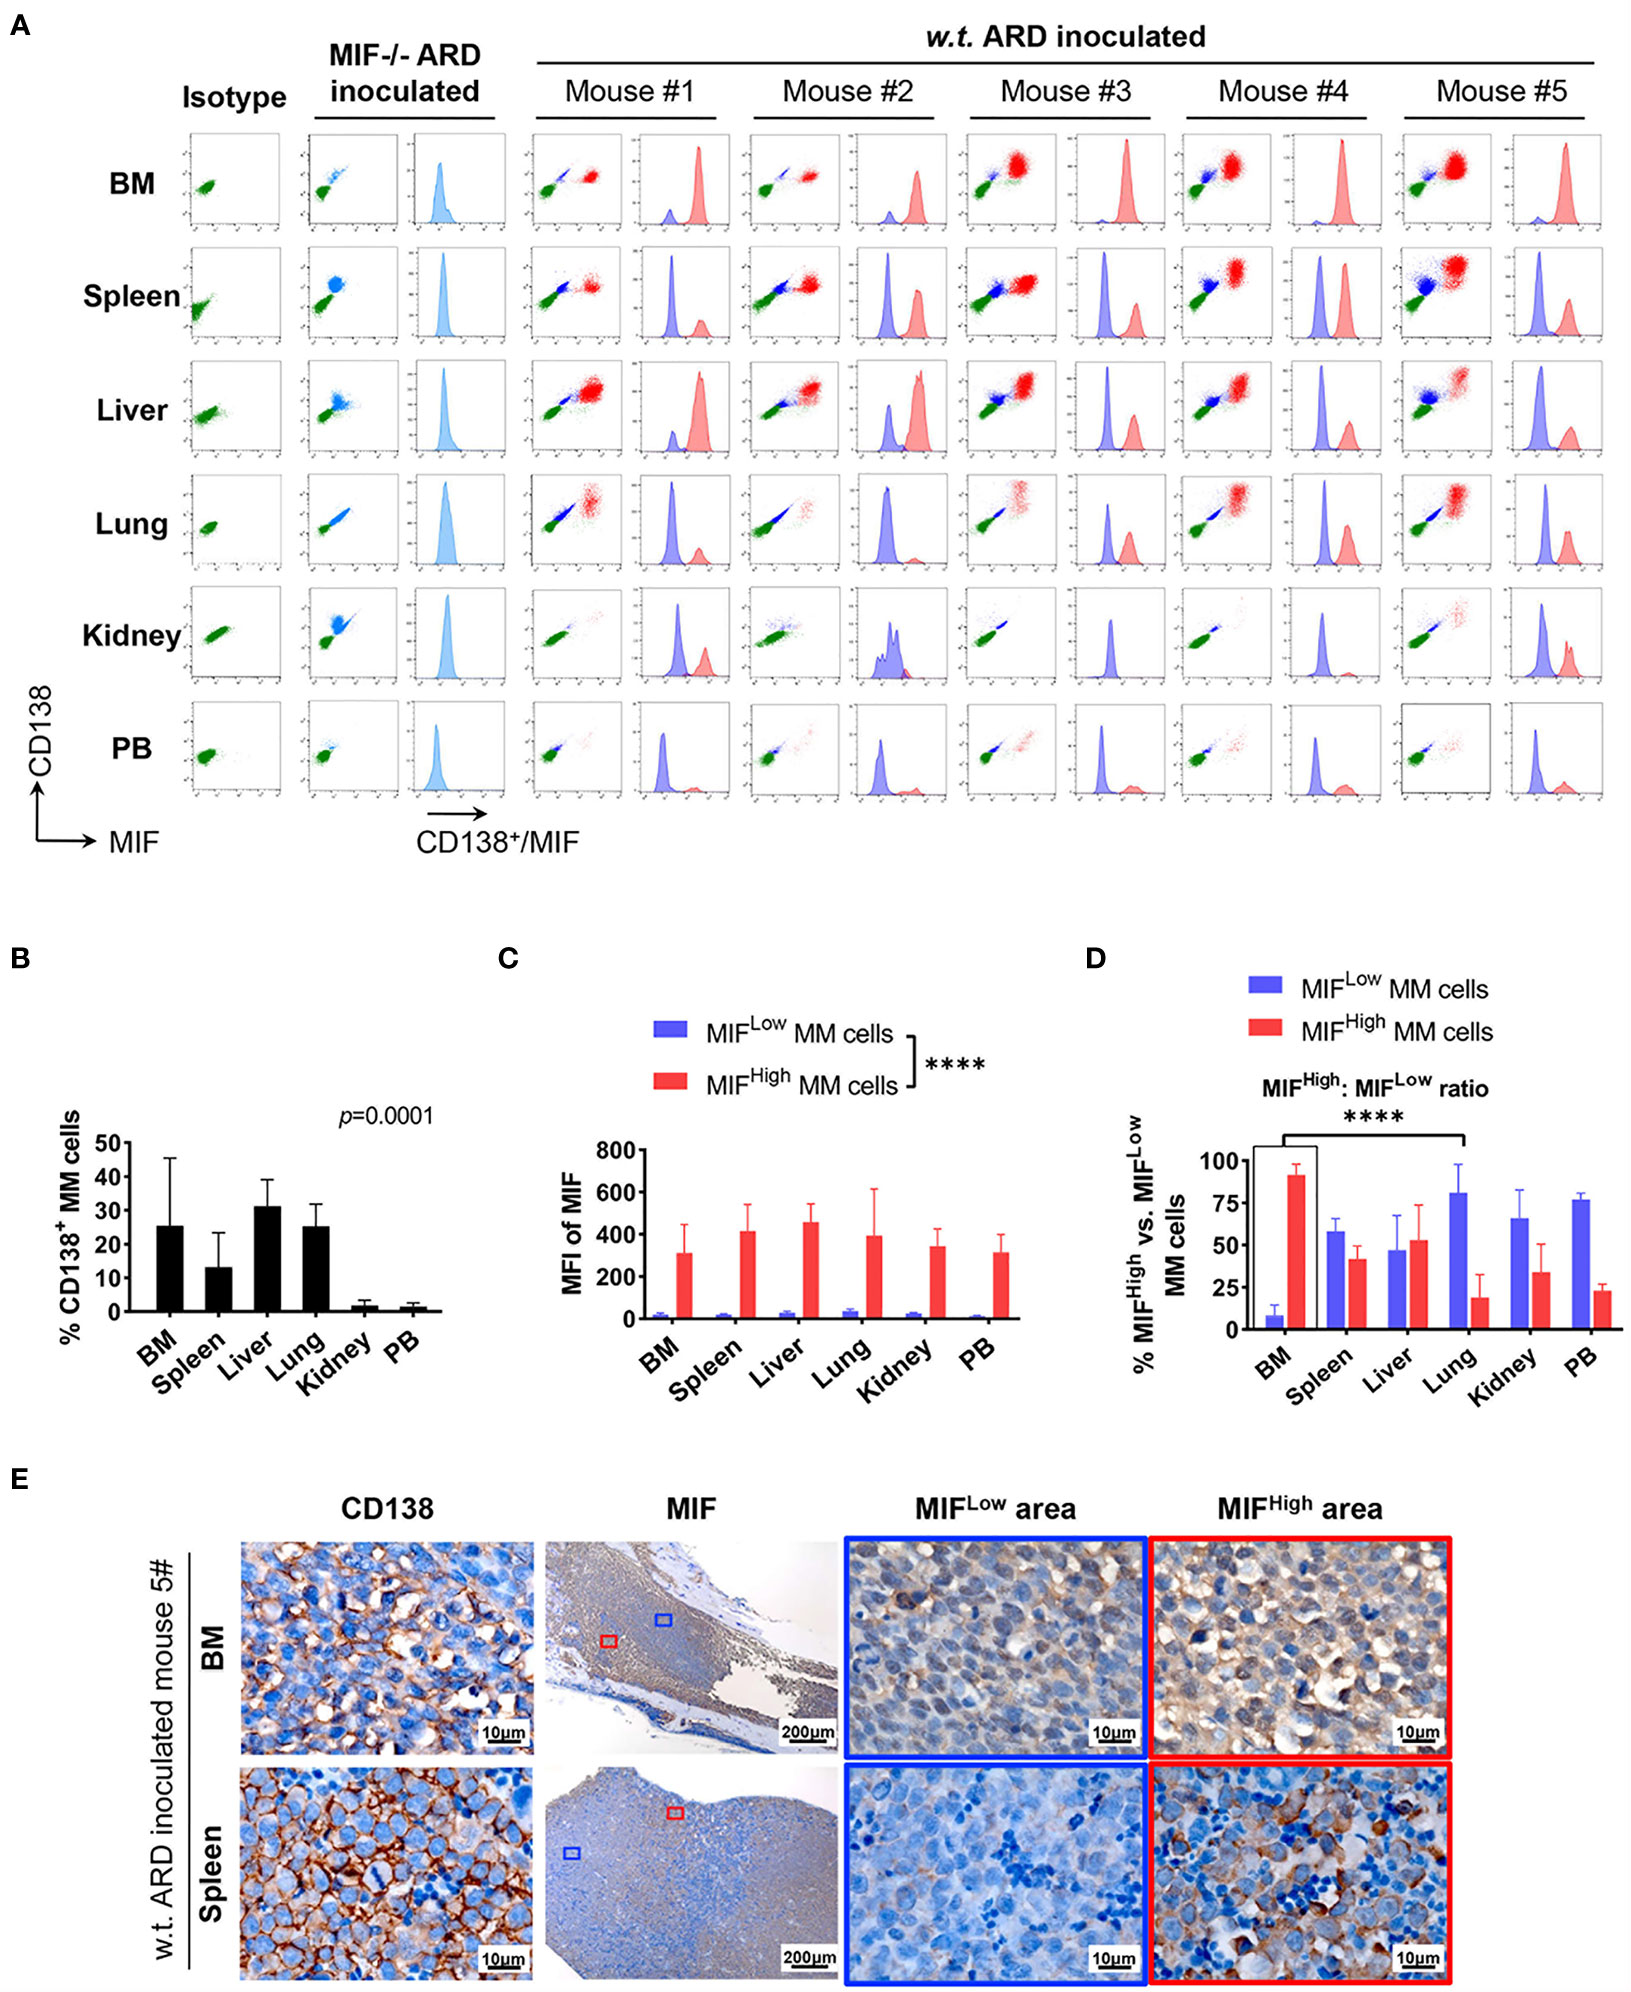
Figure 4 Identification of MIFHigh and MIFLow MM cells in ARD cell line-derived xenografts. (A) B-NDG mice were intravenously injected with ARD cell line to establish another xenograft model (n = 5). Control mice received vehicle (PBS) or MIF−/− ARD cells. Three to four weeks after inoculation, samples were processed in the same way as described in the PDX model. Representative flow cytometry plots show MIF and CD138 expression in IMM and EMM (green, CD138- cells, namely non-MM cells; light blue, MIF- MM cells; dark blue, MIFLow MM cells; red, MIFHigh MM cells). (B) CD138+ cells (ARD cells) infiltrate all tested samples with varying degrees. P = 0.0001 (two-way ANOVA). (C) MFI of MIF differs greatly between MIFHigh and MIFLow MM cells in diverse samples, with 373.4 ± 59.3 (MIFHigh) versus 24.0 ± 8.1 (MIFLow). ****p < 0.0001 (two-way ANOVA). (D) Significantly higher ratio of MIFHigh/MIFLow MM cells in BM versus extramedullary samples. ****p < 0.0001 (student’s t-test). (E) MIFHigh and MIFLow ARD cells in vivo are also identified by IHC. Representative images show their coexistence and more evident loss of MIF expression in spleen than in paired BM (the blue and red boxes indicate representative areas of MIFLow and MIFHigh MM cells, respectively).
To summarize, based on the above animal work, we found that a portion of MM cells lost their MIF expression (MIFLow) in vivo. IMM was dominated by the MIFHigh MM cells. In EMM, by contrast, the expansion of MIFHigh cells was accompanied by a notable MIFLow population, which would attenuate the overall MIF expression. Somehow, those findings from the animal models might be consistent with our data of paired patient samples. Since a single clonal cell line was used in our model and the establishment of an MM-bearing model took only 3–4 weeks, it is not likely that the heterogeneity of MIF expression in MM cells was caused by genetic alterations.
Single-Cell Transcriptome Study Reveals the Molecular Characteristics of Heterogenous Myeloma Subpopulations
Although MIFLow MM cells in vivo were phenotypically distinct from MIFHigh ones, physically separating them from each other for molecular study was not feasible because the permeabilization procedure of MIF staining would damage the nucleic acids in cells. Based on our previous findings, we hypothesized that the MM cells in vivo might have differential levels of MIF transcripts. Therefore, total CD138+ cells sorted from splenic cells in an ARD myeloma-bearing mouse (Supplementary Figure 5A) were subjected to single-cell RNA sequencing (scRNA-seq).
We used the DropSeq technique to investigate the single-cell transcriptomic profiles of the extramedullary plasma cells harvested from an ARD myeloma-bearing mouse. Given the lineage connectivity of these xenografted cells, we plotted the putative developmental trajectory using Monocle2 software. The software color-coded seven cellular states using the default parameters (Figures 5A, B). The violin plots showed significantly higher expression of MIF and two other co-expressed genes D-Dopachrome Tautomerase (DDT) and RNA Polymerase II Subunit F (POLR2F) in cluster #5, the co-expressions were validated in BM MM cells from multiple patient datasets (GSE26760, GSE19784, GSE9782) (26–28), which suggested cluster #5 was likely the initial state of these plasma cells (Figure 5C and Supplementary Figure 5B). Using the ‘FindMarkers’ function of Seurat, we further examined the signature genes of the clusters for state #5, the putative initial points of the cell lineage, as well as states #6 and #1, two putative end states of the cell lineage (Figure 6A). We carefully examined the marker genes using functional enrichments and had some interesting hits. The initial state, #5 cluster (MIFHigh subpopulation), showed a significantly higher score of S and G2/M-phase (Figure 6B) and enriched the cell cycles, p53 signaling pathway, proteasome, etc. (Figure 6C). This finding suggests that the MIFHigh feature is likely associated with a highly proliferative cell state. For the two end states of the trajectory, compared to cluster #5 of the initial state, cluster #1(MIFLow subpopulation) gave many ribosome RNA signals, while cluster #6 gave no obvious signature expression, possibly indicating a transitional state (Figure 6A).
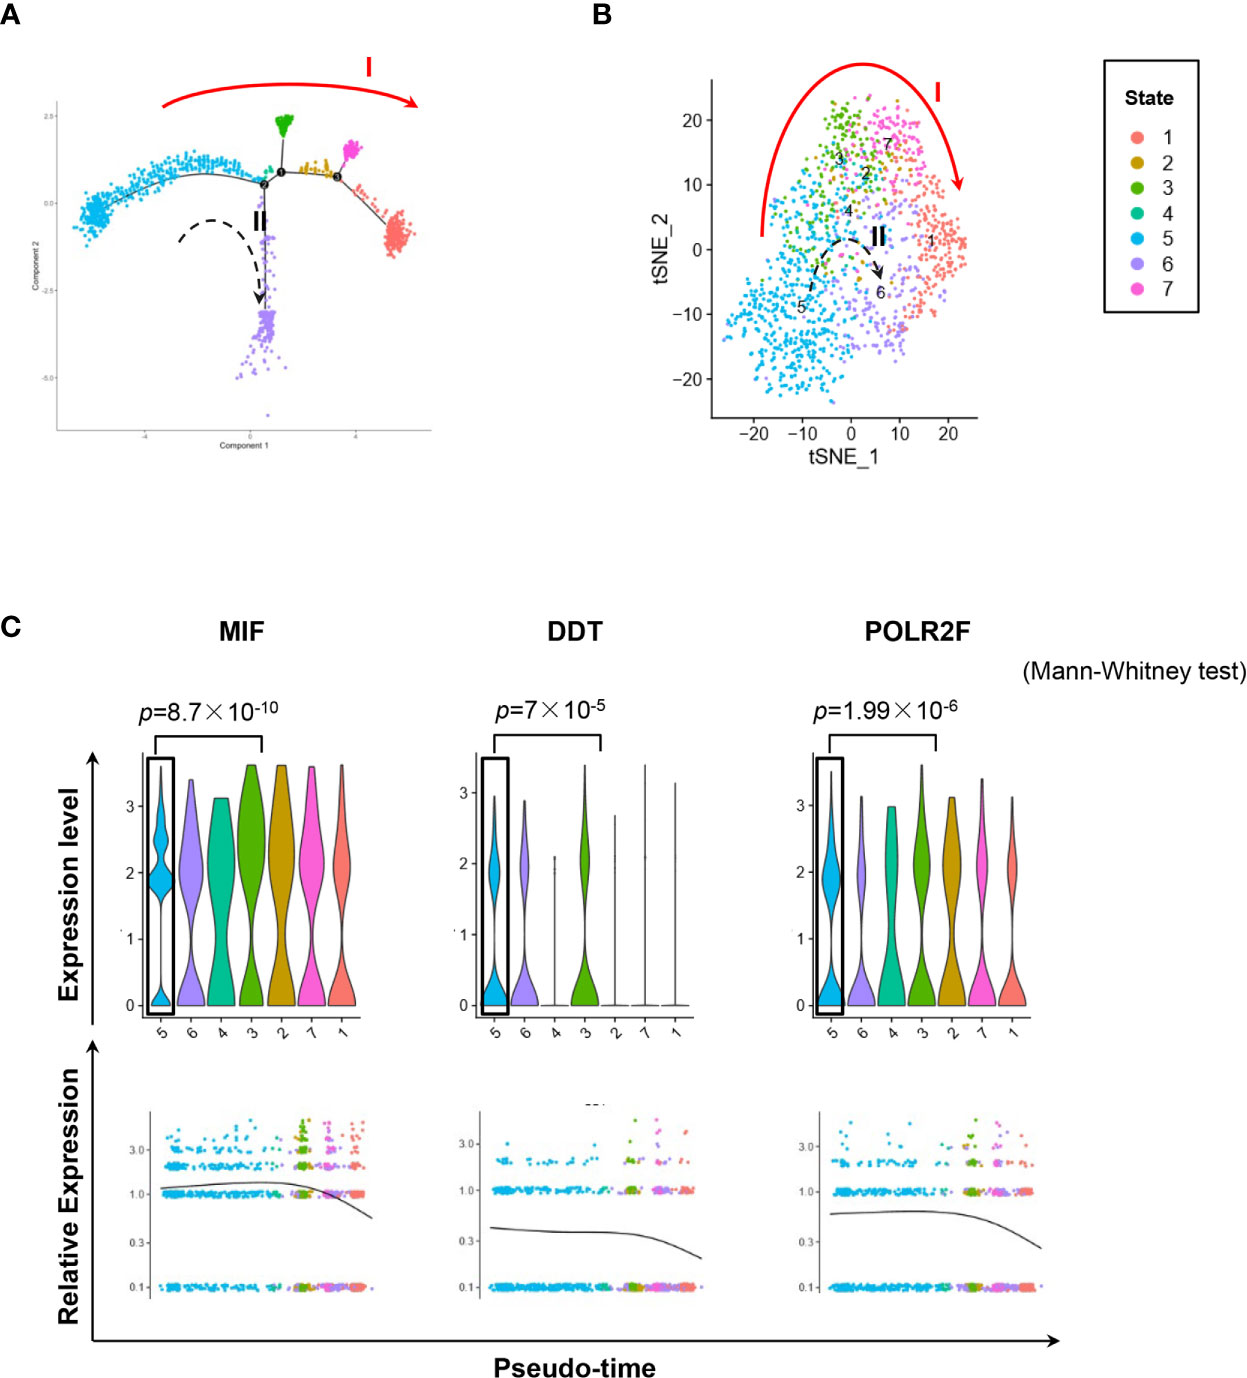
Figure 5 Single-cell transcriptomics exploring the trajectories of MIFHigh to MIFLow MM cells. (A) Sc-RNA seq explored the transcriptomic profiles associated with the development of MM cells in extramedullary microenvironment. MM cells labeled with the anti-human CD138 antibody were separated by flow cytometry from the spleen of an ARD MM-bearing mouse. A total of 1,424 extramedullary MM cells were plotted. The branching tree of MM cell trajectories define seven color-coded cell clusters or states: putatively developing from cluster #5 (initial state), proceeding along with several unstable intermediate states (clusters #3, #2 and #7, or cluster #4), and finally reaching cluster #1 or #6 (end state), as indicated by the red solid arrow (trajectory I) and black dotted arrow (trajectory II, probably transitional), respectively. (B) tSNE plots show seven clusters. Arrows I and II indicate the two putative cell-state transition trajectories, respectively. (C) Cluster #5 could reasonably be the initial state, since it has significantly higher expressions of MIF and two co-expressed genes DDT and POLR2F, as shown in the violin plots and scatter plots of pseudotime estimation. Likewise, the putative end state, especially cluster #1, has the least expression of MIF, DDT and POLR2F.
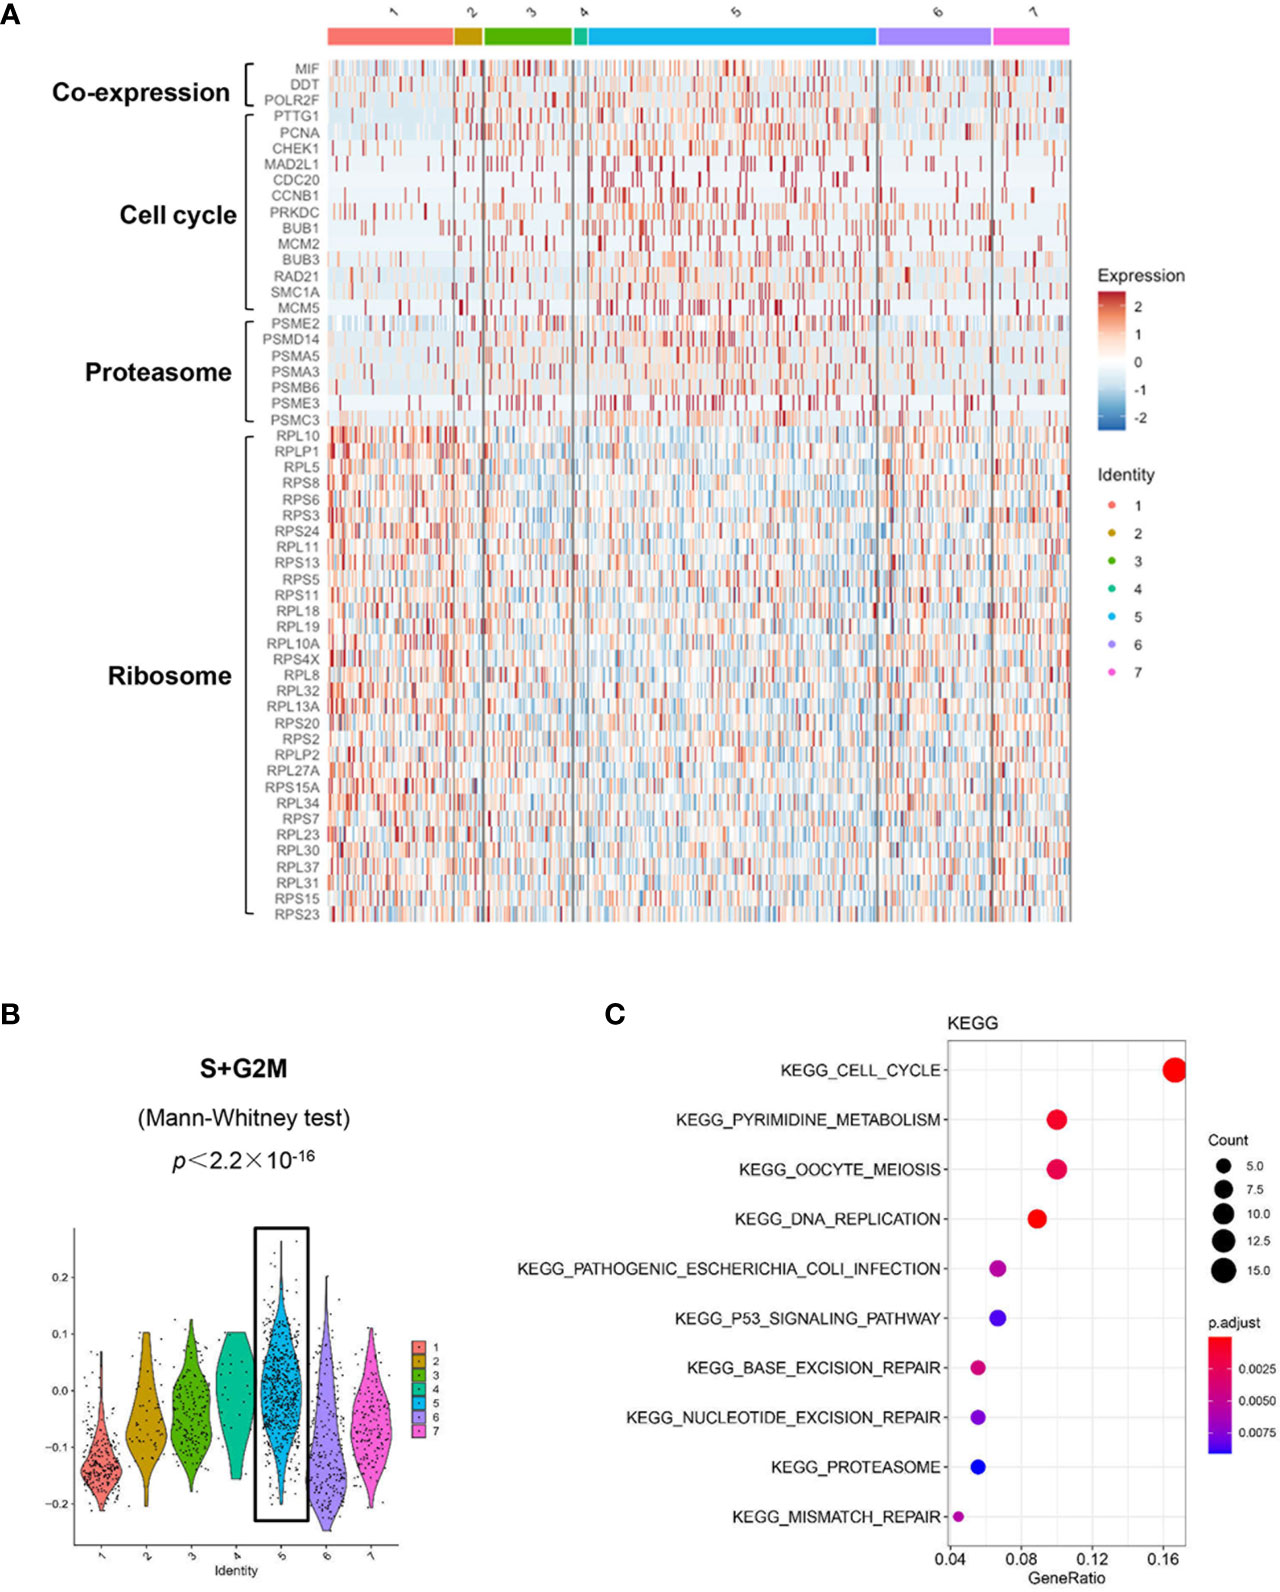
Figure 6 Distinct transcriptomic profiles of MM cells with differential MIF expression. (A) A heatmap of marker genes reveals distinct transcriptomic profiles of the MIFHigh initial state (cluster #5) versus the MIFLow end state (referring to cluster #1; cluster #6, lack of obvious gene expression signature, might actually be transitional). (B) Active proliferation is found in cluster #5 with a significantly higher score of S and G2/M-phase. (C) KEGG enrichment analysis indicates some important pathways, such as cell cycle, proteasome and p53 signaling pathway in cluster #5.
Discussion
The presence of extramedullary myeloma, namely EMM, usually portends inferior outcomes for MM patients, even in the era of novel agents and stem cell transplantation (2, 29–31). Driven by multiple genetic and microenvironmental mechanisms, certain MM subclones are predisposed to survive outside the BM niche (5, 32). The molecular basis underlying EMM is still elusive. Although EMM typically results from contiguous or hematogenous spread of the intramedullary counterpart, EMM has its own distinctive biological features (1, 5). Here we proved the differential MIF expression between the matched IMM and EMM, both in patient samples and xenograft models.
The pleotropic biological activities of MIF have been characterized since 1960s (33–35). It is highlighted that MIF promotes progress and metastasis of various solid tumors, via activating downstream proliferation and anti-apoptotic signaling, regulating VEGF-mediated angiogenesis, inhibiting tumor suppressor P53, inducing immunosuppressive microenvironment and so on (36–43). Pathogenic role of MIF has also been identified in MM, and its expression level may serve as a surrogate for disease progression and prognosis (18, 34, 44–46). Recently, Wang et al. reported that MIF was implicated in proteasome inhibitor resistance by maintaining superoxide dismutase 1 (SOD1) activity and mitochondrial function (44). In that sense, MIFHigh MM cells seem to be associated with more aggressive tumor behavior. However, MIF itself is an important chemokine favoring MM BM homing as we previously described (18). MIFLow MM cells, generated by shRNA viral infection, would more easily egress from BM and form EMM in mice, due to impaired adhesion to the BM niche (18). Therefore, we assumed that MIFLow clones, unlike in many solid tumors, may also implicated in MM extramedullary metastasis.
This study revealed that IMM was overwhelmed by MIFHigh MM cells, while EMM showed a remarkably increased ratio of MIFLow MM cells. This finding provided more evidence to suggest the link between decreased MIF and extramedullary colonization of MM cells. The differential dominance of the MIFHigh clone in IMM versus EMM also indicated that the BM microenvironment had consistent selection pressure on MM cells to maintain the MIFHigh phenotype. Predominance of MIFLow MM cells in ARD-derived EMM was more obvious, not completely consistent with that in PDX scenario. It’s probably due to the biological difference between the two kinds of inoculated cells. Most noteworthy, ARD-derived xenograft and patient-derived xenograft, representing genetic homogeneity and heterogeneity respectively, could produce similar phenotypes in the short term after engraftment. Therefore, we inferred that an inheritable mechanism, likely involving some epigenetic changes rather than acquired genetic events, might govern the stable regulation of differential MIF expression.
Based on our ARD cell line-derived xenograft model, a further scRNA-seq was applied to explore the MIF-specific gene expression profiles in EMM. Our pseudotime analysis showed the consecutive alteration of MIF and its validated co-expressed genes along the developmental trajectory of extramedullary MM cells. Those transcriptional changes of MIF would be part of the reason for its differential expressions at the protein level. Furthermore, distinct transcriptomic profiles were revealed in the MIFHigh and MIFLow clusters, respectively. For one thing, the MIFHigh cluster featured higher proliferation, while the MIFLow cluster seemed much more quiescent. Previous in vitro studies by Joseph et al. demonstrated that mature CD138+ MM cells, being highly proliferative and chemosensitve, secreted more MIF than their quiescent, chemoresistant CD138- progenitors, and addition of MIF inhibitor or recombinant MIF factor would promote the bidirectional interconversion (47). Specifically, our data suggested the in vivo correlation between MIF gene expression and MM cells proliferation, although no significant difference was found in CD138 expression between the two clusters. For another, the MIFHigh cluster enriched the cell cycle, proteasome and P53 pathways, while the MIFLow one harbored impressively abundant ribosomal protein genes. In a sense, this part of our data was consistent with the MIF-dependent tumor-promoting phenotypes reported in literature (37, 43, 44, 47, 48).Those differentially expressed marker genes between the two clusters also suggested potential upstream regulators of MIF transcription. To our knowledge, MIF transcription is mainly affected by various transcription factors, such as specificity protein 1 (SP1), cAMP response element binding protein (CREB), inverted CCAAT box binding protein of 90 kDa (ICBP90), and Hypoxia-induced factor 1α (HIF1α), and CATT repeats or G/C polymorphism at promoter region (49), the details in MM are as yet unknown.
It should be noted that the developmental trajectory of extramedullary MM cells was putative, dynamic, and even reversible. As MIF was highly expressed in MM cells before inoculation, we artificially defined MIFHigh cluster as the initial state. In this case, adaptation to the microenvironment may account for the above findings. Another possibility is that MM cells homing to BM occasionally lose their MIF expression, and the MIFLow clone would leave BM more easily to drive the extramedullary migration. Then MIFLow cluster turned to be the alternative initial state.
In summary, our work identified the coexistence of MIFHigh and MIFLow MM cells, two distinct cell states with different proliferation ability and molecular profiles, and more obvious clonal expansion of the MIFLow ones in EMM than that in IMM. The heterogeneous MIF expression in vivo was revealed at both the protein and mRNA level. We considered the loss of MIF expression in a portion of MM cells is mainly affected by microenvironment mechanisms instead of second genetic hits. Notably, our xenograft models could not entirely mimic the clinical course of EMM. Although the causal relationship of MIFLow clone and EMM pathogenesis is still not definite, this study provides new insights into our understanding of MIF, a pathogenic effector and potential therapeutic target in MM. Nevertheless, questions remain about the exact regulation mechanisms, biological behavior and drug resistance properties of MM cells with differential MIF expression. We are conducting more studies to address those questions.
Data Availability Statement
Our scRNA-seq data presented in this study can be found in online repositories. The names of the repository/repositories and accession number(s) can be found below: NCBI Gene Expression Omnibus (GEO; http://www.ncbi.nlm.nih.gov/geo/) under the accession number GSE175660.
Ethics Statement
The studies involving human participants were reviewed and approved by the Ethical Committee of West China Hospital, Sichuan University, China. The patients/participants provided their written informed consent to participate in this study. The animal study was reviewed and approved by the the Animal Care and Use Committees of West China Hospital, Sichuan University.
Author Contributions
YHZ designed and supervised the research, and prepared the manuscript. SZ provided the patients’ samples, reviewed the results of IHC staining, assisted with data interpretation. YMZ provided the biological insight from scRNA-seq data, and prepared the manuscript. YHZ, SZ, and YMZ contributed equally to this work as co-corresponding authors. JX performed the experiments, data analysis and prepared the manuscript. NY and WLin performed the extensive scRNA-seq data analyses and prepared the manuscript. JX and NY contributed equally as co-first authors to this manuscript. PZ conducted the MIF gene knock-out experiment. FW and JH assisted with research design, and provided critical suggestions. YC, HD, YY, and YG assisted with experimental work. The other authors provided the basic clinicopathological data. All authors contributed to the article and approved the submitted version.
Funding
This work was supported by grants to YHZ from the National Natural Science Foundation of China (Nos. 81870157 and 82070219), Science and Technology Department of Sichuan Province (No. 2019YJ0028), and the Sichuan University Faculty Start Fund. Grants to JH from the National Natural Science Foundation of China (No. 81800207) and the Health Commission of Sichuan Province (No. 18PJ357). A grant to YQ from Science and Technology Department of Sichuan Province (No. 2018FZ0030).
Conflict of Interest
The authors declare that the research was conducted in the absence of any commercial or financial relationships that could be construed as a potential conflict of interest.
Acknowledgments
We thank the following people for their technical assistance: Prof. Yiguo Hu (State Key Laboratory of Biotherapy and Cancer Center, West China Hospital, Sichuan University); Guonian Zhu and Bo Su (Core Facility, West China Hospital, Sichuan University); Li Li, Fei Chen and Chunjuan Bao (Laboratory of Pathology, West China Hospital, Sichuan Univsersity); Ping Liao (Laboratory of Anesthesia and Critical Care Medicine, Department of Anesthesiology, National-Local Joint Engineering Research Center of Translational Medicine of Anesthesiology, West China Hospital, Sichuan University).
Supplementary Material
The Supplementary Material for this article can be found online at: https://www.frontiersin.org/articles/10.3389/fonc.2021.694331/full#supplementary-material
Supplementary Figure 1 | Imagings of extramedullary myeloma lesions for biopsy in patients. The collected EMM tissue samples were bone-related (EM-B) or extraosseous (EM-E). Corresponding imaging data were available for 8 of them. Magnetic resonance imaging (MRI) or computed tomography (CT) showed the biopsied EM-B (A) and EM-E (B) lesions respectively (indicated by the red arrow).
Supplementary Figure 2 | Differential MIF expression in paired IMM and EMM. Seventeen pairs of FFPE samples were stained for CD138 and MIF. In all tested slides, the infiltrating MM cells were specifically highlighted by membranous CD138 staining, and showed cytoplasmic positivity for MIF to varying degrees. Generally, IMM had higher MIF expression in comparison to the paired EMM.
Supplementary Figure 3 | Quantification method of immunostain for MIF in paired patient samples. Quantitative analysis of MIF staining was as follows (showing a representative pair):wide-field images of BM and EM tissue slides were captured with the TissueFAXS system (TissueGnostics ), then StrataQuest software (TissueGnostics) was used to convert DAB channels of MIF staining into gray scale images and to evaluate the mean intensity of MIF in effective positive cells as dot plots show.
Supplementary Figure 4 | Supplementary data of the animal experiment. Complete knockout of the MIF gene in ARD cells was verified by western blot (A). Flow cytometry analysis showed the in vitro expression of CD138 and MIF in these three types of grafts: All of them were positive for CD138; MIF was homogenously over-expressed in both ARD cells and patient-derived primary BM MM cells, and totally absent in MIF-/-ARD cells (B). Intravenous injection of human MM cells led to both intra- and extra-medullary lesions in immunodeficient mice. More serious EMM lesions were detected in the MIF-/- ARD group. The representative in vivo bioluminescent imagings were taken at two weeks after inoculation (C).
Supplementary Figure 5 | Supplementary data of the sc-RNAseq. Parallel flow cytometry analysis confirmed the differential expression of MIF protein in CD138+ cells subjected to sc-RNAseq (A). Co-expression of DDT, POLR2F and MIF in patient MM cells from BM was validated in three microarray datasets: GSE26760, GSE19784, and GSE9782, by gene set enrichment analysis (GSEA) with Pearson correlation (R2, R-square) (B).
References
1. Blade J, Fernandez de Larrea C, Rosinol L, Cibeira MT, Jimenez R, Powles R. Soft-Tissue Plasmacytomas in Multiple Myeloma: Incidence, Mechanisms of Extramedullary Spread, and Treatment Approach. J Clin Oncol (2011) 29(28):3805–12. doi: 10.1200/JCO.2011.34.9290
2. Usmani SZ, Heuck C, Mitchell A, Szymonifka J, Nair B, Hoering A, et al. Extramedullary Disease Portends Poor Prognosis in Multiple Myeloma and Is Over-Represented in High-Risk Disease Even in the Era of Novel Agents. Haematologica (2012) 97(11):1761–7. doi: 10.3324/haematol.2012.065698
3. Pour L, Sevcikova S, Greslikova H, Kupska R, Majkova P, Zahradova L, et al. Soft-Tissue Extramedullary Multiple Myeloma Prognosis Is Significantly Worse in Comparison to Bone-Related Extramedullary Relapse. Haematologica (2014) 99(2):360–4. doi: 10.3324/haematol.2013.094409
4. Touzeau C, Moreau P. How I Treat Extramedullary Myeloma. Blood (2016) 127(8):971–6. doi: 10.1182/blood-2015-07-635383
5. Bhutani M, Foureau DM, Atrash S, Voorhees PM, Usmani SZ. Extramedullary Multiple Myeloma. Leukemia (2020) 34(1):1–20. doi: 10.1038/s41375-019-0660-0
6. Billecke L, Murga Penas EM, May AM, Engelhardt M, Nagler A, Leiba M, et al. Cytogenetics of Extramedullary Manifestations in Multiple Myeloma. Br J Haematol (2013) 161(1):87–94. doi: 10.1111/bjh.12223
7. Deng S, Xu Y, An G, Sui W, Zou D, Zhao Y, et al. Features of Extramedullary Disease of Multiple Myeloma: High Frequency of p53 Deletion and Poor Survival: A Retrospective Single-Center Study of 834 Cases. Clin Lymphoma Myeloma Leuk (2015) 15(5):286–91. doi: 10.1016/j.clml.2014.12.013
8. de Haart SJ, Willems SM, Mutis T, Koudijs MJ, van Blokland MT, Lokhorst HM, et al. Comparison of Intramedullary Myeloma and Corresponding Extramedullary Soft Tissue Plasmacytomas Using Genetic Mutational Panel Analyses. Blood Cancer J (2016) 6:e426. doi: 10.1038/bcj.2016.35
9. Liu Y, Jelloul F, Zhang T, Bhavsar T, Ho C, Rao M, et al. Genetic Basis of Extramedullary Plasmablastic Transformation of Multiple Myeloma. Am J Surg Pathol (2020) 44(6):838–48. doi: 10.1097/PAS.0000000000001459
10. Besse L, Sedlarikova L, Greslikova H, Kupska R, Almasi M, Penka M, et al. Cytogenetics in Multiple Myeloma Patients Progressing Into Extramedullary Disease. Eur J Haematol (2016) 97(1):93–100. doi: 10.1111/ejh.12688
11. Stessman HA, Mansoor A, Zhan F, Janz S, Linden MA, Baughn LB, et al. Reduced CXCR4 Expression Is Associated With Extramedullary Disease in a Mouse Model of Myeloma and Predicts Poor Survival in Multiple Myeloma Patients Treated With Bortezomib. Leukemia (2013) 27(10):2075–7. doi: 10.1038/leu.2013.148
12. Lapa C, Herrmann K, Schirbel A, Hanscheid H, Luckerath K, Schottelius M, et al. CXCR4-Directed Endoradiotherapy Induces High Response Rates in Extramedullary Relapsed Multiple Myeloma. Theranostics (2017) 7(6):1589–97. doi: 10.7150/thno.19050
13. Ullah TR. The Role of CXCR4 in Multiple Myeloma: Cells’ Journey From Bone Marrow to Beyond. J Bone Oncol (2019) 17:100253. doi: 10.1016/j.jbo.2019.100253
14. Barker HF, Ball J, Drew M, Hamilton MS, Franklin IM. The Role of Adhesion Molecules in Multiple Myeloma. Leuk Lymphoma (1992) 8(3):189–96. doi: 10.3109/10428199209054904
15. Cook G, Dumbar M, Franklin IM. The Role of Adhesion Molecules in Multiple Myeloma. Acta Haematol (1997) 97(1–2):81–9. doi: 10.1159/000203663
16. Hedvat CV, Comenzo RL, Teruya-Feldstein J, Olshen AB, Ely SA, Osman K, et al. Insights Into Extramedullary Tumour Cell Growth Revealed by Expression Profiling of Human Plasmacytomas and Multiple Myeloma. Br J Haematol (2003) 122(5):728–44. doi: 10.1046/j.1365-2141.2003.04481.x
17. Vande Broek I, Vanderkerken K, Van Camp B, Van Riet I. Extravasation and Homing Mechanisms in Multiple Myeloma. Clin Exp Metastasis (2008) 25(4):325–34. doi: 10.1007/s10585-007-9108-4
18. Zheng Y, Wang Q, Li T, Qian J, Lu Y, Li Y, et al. Role of Myeloma-Derived MIF in Myeloma Cell Adhesion to Bone Marrow and Chemotherapy Response. J Natl Cancer Inst (2016) 108(11):djw131. doi: 10.1093/jnci/djw131
19. Wang F, Zheng L, Yi Y, Yang Z, Qiu Q, Wang X, et al. SKLB-23bb, A HDAC6-Selective Inhibitor, Exhibits Superior and Broad-Spectrum Antitumor Activity Via Additionally Targeting Microtubules. Mol Cancer Ther (2018) 17(4):763–75. doi: 10.1158/1535-7163.MCT-17-0332
20. Squatrito M, Brennan CW, Helmy K, Huse JT, Petrini JH, Holland EC. Loss of ATM/Chk2/p53 Pathway Components Accelerates Tumor Development and Contributes to Radiation Resistance in Gliomas. Cancer Cell (2010) 18(6):619–29. doi: 10.1016/j.ccr.2010.10.034
21. Zhang D, Huang J, Zhang W, Pan L, Zhang D, Zhao P, et al. Young Female Patients With Multiple Myeloma Have Low Occurrence of Osteolytic Lesion. Bone (2018) 110:21–8. doi: 10.1016/j.bone.2018.01.021
22. Cossarizza A, Chang HD, Radbruch A, Acs A, Adam D, Adam–Klages S, et al. Guidelines for the Use of Flow Cytometry and Cell Sorting in Immunological Studies (Second Edition). Eur J Immunol (2019) 49(10):1457–973. doi: 10.1002/eji.201970107
23. Macosko EZ, Basu A, Satija R, Nemesh J, Shekhar K, Goldman M, et al. Highly Parallel Genome-Wide Expression Profiling of Individual Cells Using Nanoliter Droplets. Cell (2015) 161(5):1202–14. doi: 10.1016/j.cell.2015.05.002
24. Trapnell C, Cacchiarelli D, Grimsby J, Pokharel P, Li S, Morse M, et al. The Dynamics and Regulators of Cell Fate Decisions Are Revealed by Pseudotemporal Ordering of Single Cells. Nat Biotechnol (2014) 32(4):381–6. doi: 10.1038/nbt.2859
25. Schwartz GW, Zhou Y, Petrovic J, Fasolino M, Xu L, Shaffer SM, et al. TooManyCells Identifies and Visualizes Relationships of Single-Cell Clades. Nat Methods (2020) 17:405–13. doi: 10.1038/s41592-020-0748-5
26. Mulligan G, Mitsiades C, Bryant B, Zhan F, Chng WJ, Roels S, et al. Gene Expression Profiling and Correlation With Outcome in Clinical Trials of the Proteasome Inhibitor Bortezomib. Blood (2007) 109(8):3177–88. doi: 10.1182/blood-2006-09-044974
27. Broyl A, Hose D, Lokhorst H, de Knegt Y, Peeters J, Jauch A, et al. Gene Expression Profiling for Molecular Classification of Multiple Myeloma in Newly Diagnosed Patients. Blood (2010) 116(14):2543–53. doi: 10.1182/blood-2009-12-261032
28. Chapman MA, Lawrence MS, Keats JJ, Cibulskis K, Sougnez C, Schinzel AC, et al. Initial Genome Sequencing and Analysis of Multiple Myeloma. Nature (2011) 471(7339):467–72. doi: 10.1038/nature09837
29. Short KD, Rajkumar SV, Larson D, Buadi F, Hayman S, Dispenzieri A, et al. Incidence of Extramedullary Disease in Patients With Multiple Myeloma in the Era of Novel Therapy, and the Activity of Pomalidomide on Extramedullary Myeloma. Leukemia (2011) 25(6):906–8. doi: 10.1038/leu.2011.29
30. Gagelmann N, Eikema DJ, Iacobelli S, Koster L, Nahi H, Stoppa AM, et al. Impact of Extramedullary Disease in Patients With Newly Diagnosed Multiple Myeloma Undergoing Autologous Stem Cell Transplantation: A Study From the Chronic Malignancies Working Party of the EBMT. Haematologica (2018) 103(5):890–7. doi: 10.3324/haematol.2017.178434
31. Avivi I, Cohen YC, Suska A, Shragai T, Mikala G, Garderet L, et al. Hematogenous Extramedullary Relapse in Multiple Myeloma - A Multicenter Retrospective Study in 127 Patients. Am J Hematol (2019) 94(10):1132–40. doi: 10.1002/ajh.25579
32. Rasche L, Rollig C, Stuhler G, Danhof S, Mielke S, Grigoleit GU, et al. Allogeneic Hematopoietic Cell Transplantation in Multiple Myeloma: Focus on Longitudinal Assessment of Donor Chimerism, Extramedullary Disease, and High-Risk Cytogenetic Features. Biol Blood Marrow Transplant (2016) 22:1988–96. doi: 10.1016/j.bbmt.2016.08.024
33. Bloom BR, Bennett B. Mechanism of a Reaction In Vitro Associated With Delayed-Type Hypersensitivity. Science (1966) 153(3731):80–2. doi: 10.1126/science.153.3731.80
34. O’Reilly C, Doroudian M, Mawhinney L, Donnelly SC. Targeting MIF in Cancer: Therapeutic Strategies, Current Developments, and Future Opportunities. Med Res Rev (2016) 36(3):440–60. doi: 10.1002/med.21385
35. Kang I, Bucala R. The Immunobiology of MIF: Function, Genetics and Prospects for Precision Medicine. Nat Rev Rheumatol (2019) 15(7):427–37. doi: 10.1038/s41584-019-0238-2
36. Yaddanapudi K, Putty K, Rendon BE, Lamont GJ, Faughn JD, Satoskar A, et al. Control of Tumor-Associated Macrophage Alternative Activation by Macrophage Migration Inhibitory Factor. J Immunol (2013) 190(6):2984–93. doi: 10.4049/jimmunol.1201650
37. Brock SE, Rendon BE, Xin D, Yaddanapudi K, Mitchell RA. MIF Family Members Cooperatively Inhibit p53 Expression and Activity. PloS One (2014) 9(6):e99795. doi: 10.1371/journal.pone.0099795
38. Yaddanapudi K, Rendon BE, Lamont G, Kim EJ, Al Rayyan N, Richie J, et al. MIF Is Necessary for Late-Stage Melanoma Patient MDSC Immune Suppression and Differentiation. Cancer Immunol Res (2016) 4(2):101–12. doi: 10.1158/2326-6066.CIR-15-0070-T
39. Choi S, Kim HR, Leng L, Kang I, Jorgensen WL, Cho CS, et al. Role of Macrophage Migration Inhibitory Factor in the Regulatory T Cell Response of Tumor-Bearing Mice. J Immunol (2012) 189(8):3905–13. doi: 10.4049/jimmunol.1102152
40. Simpson KD, Templeton DJ, Cross JV. Macrophage Migration Inhibitory Factor Promotes Tumor Growth and Metastasis by Inducing Myeloid-Derived Suppressor Cells in the Tumor Microenvironment. J Immunol (2012) 189(12):5533–40. doi: 10.4049/jimmunol.1201161
41. Penticuff JC, Woolbright BL, Sielecki TM, Weir SJ, Taylor JA 3rd. MIF Family Proteins in Genitourinary Cancer: Tumorigenic Roles and Therapeutic Potential. Nat Rev Urol (2019) 16(5):318–28. doi: 10.1038/s41585-019-0171-9
42. Balogh KN, Templeton DJ, Cross JV. Macrophage Migration Inhibitory Factor Protects Cancer Cells From Immunogenic Cell Death and Impairs Anti-Tumor Immune Responses. PloS One (2018) 13(6):e0197702. doi: 10.1371/journal.pone.0197702
43. Fukaya R, Ohta S, Yaguchi T, Matsuzaki Y, Sugihara E, Okano H, et al. MIF Maintains the Tumorigenic Capacity of Brain Tumor-Initiating Cells by Directly Inhibiting P53. Cancer Res (2016) 76(9):2813–23. doi: 10.1158/0008-5472.CAN-15-1011
44. Wang Q, Zhao D, Xian M, Wang Z, Bi E, Su P, et al. MIF as a Biomarker and Therapeutic Target for Overcoming Resistance to Proteasome Inhibitors in Human Myeloma. Blood (2020). doi: 10.1182/blood.2020005795
45. Reinart N, Nguyen PH, Boucas J, Rosen N, Kvasnicka HM, Heukamp L, et al. Delayed Development of Chronic Lymphocytic Leukemia in the Absence of Macrophage Migration Inhibitory Factor. Blood (2013) 121(5):812–21. doi: 10.1182/blood-2012-05-431452
46. Krockenberger M, Engel JB, Kolb J, Dombrowsky Y, Hausler SF, Kohrenhagen N, et al. Macrophage Migration Inhibitory Factor Expression in Cervical Cancer. J Cancer Res Clin Oncol (2010) 136(5):651–7. doi: 10.1007/s00432-009-0702-5
47. Joseph D, Gonsky JP, Blain SW. Macrophage Inhibitory Factor-1 (MIF-1) Controls the Plasticity of Multiple Myeloma Tumor Cells. PloS One (2018) 13(13):e0206368. doi: 10.1371/journal.pone.0206368
48. Kong F, Deng X, Kong X, Du Y, Li L, Zhu H, et al. ZFPM2-AS1, a Novel lncRNA, Attenuates the p53 Pathway and Promotes Gastric Carcinogenesis by Stabilizing MIF. Oncogene (2018) 37(45):5982–96. doi: 10.1038/s41388-018-0387-9
Keywords: extramedullary multiple myeloma, MIF, immunohistochemistry staining, xenograft models, single-cell sequencing
Citation: Xu J, Yu N, Zhao P, Wang F, Huang J, Cui Y, Ding H, Yang Y, Gao Y, Pan L, Chang H, Wu Y, Xiang B, Gong Y, Shuai X, Hou L, Xie L, Niu T, Liu T, Zhang L, Liu W, Zhang W, Qu Y, Lin W, Zhu Y, Zhao S and Zheng Y (2021) Intratumor Heterogeneity of MIF Expression Correlates With Extramedullary Involvement of Multiple Myeloma. Front. Oncol. 11:694331. doi: 10.3389/fonc.2021.694331
Received: 13 April 2021; Accepted: 10 June 2021;
Published: 29 June 2021.
Edited by:
Rakesh Verma, ARMO Biosciences, United StatesReviewed by:
Tijana Martinov, Fred Hutchinson Cancer Research Center, United StatesEnfan Zhang, Zhejiang University, China
Copyright © 2021 Xu, Yu, Zhao, Wang, Huang, Cui, Ding, Yang, Gao, Pan, Chang, Wu, Xiang, Gong, Shuai, Hou, Xie, Niu, Liu, Zhang, Liu, Zhang, Qu, Lin, Zhu, Zhao and Zheng. This is an open-access article distributed under the terms of the Creative Commons Attribution License (CC BY). The use, distribution or reproduction in other forums is permitted, provided the original author(s) and the copyright owner(s) are credited and that the original publication in this journal is cited, in accordance with accepted academic practice. No use, distribution or reproduction is permitted which does not comply with these terms.
*Correspondence: Yuhuan Zheng, emhlbmd5dWh1YW5Ac2N1LmVkdS5jbg==; Sha Zhao, aHhibHpoYW9zaGFAMTI2LmNvbQ==; Yimin Zhu, MjgzMDEwNTgzNEBxcS5jb20=
†These authors have contributed equally to this work