 Yuan-Yuan Li1
 Delisha A. Stewart1
 Xiao-Min Ye2Li-Hua Yin2
 Wimal W. Pathmasiri1Susan L. McRitchie1
 Timothy R. Fennell3Hon-Yeung Cheung4*
 Susan J. Sumner1*
- 1NIH Eastern Regional Comprehensive Metabolomics Resource Core, Nutrition Research Institute, Department of Nutrition, University of North Carolina at Chapel Hill, Kannapolis, NC, United States
- 2Department of Pharmacology, Wuhan Institute for Drug and Medical Device Control, Wuhan, China
- 3Analytical Chemistry and Pharmaceutics, RTI International, Research Triangle Park, Durham, NC, United States
- 4Department of Biomedical Science, City University of Hong Kong, Kowloon, Hong Kong
Due to the surge in type 2 diabetes mellitus (T2DM), treatments for chronic metabolic dysregulations with fewer side-effects are sought. Lycii Cortex (LyC), a traditional Chinese Medicine (TCM) herb has a long history of being widely prescribed to treat T2DM as alternative medicine; however, the bioactive molecules and working mechanism remained unknown. Previous studies revealed kukoamine B (KB) as a major and featured compound for LyC with bioactivities for anti-oxidation and acute inflammation, which may be related to anti-diabetes properties. This study aims to understand the efficacy and the mode of action of KB in the diabetic (db/db) mouse model using a metabolomics approach. Parallel comparison was conducted using the first-line anti-diabetic drugs, metformin and rosligtazone, as positive controls. The db/db mice were treated with KB (50 mg kg−1 day−1) for 9 weeks. Bodyweight and fasting blood glucose were monitored every 5 and 7 days, respectively. Metabolomics and high-throughput molecular approaches, including lipidomics, targeted metabolomics (Biocrates p180), and cytokine profiling were applied to measure the alteration of serum metabolites and inflammatory biomarkers between different treatments vs. control (db/db mice treated with vehicle). After 9 weeks of treatment, KB lowered blood glucose, without the adverse effects of bodyweight gain and hepatomegaly shown after rosiglitazone treatment. Lipidomics analysis revealed that KB reduced levels of circulating triglycerides, cholesterol, phosphatidylethanolamine, and increased levels of phosphatidylcholines. KB also increased acylcarnitines, and reduced systemic inflammation (cytokine array). Pathway analysis suggested that KB may regulate nuclear transcription factors (e.g., NF-κB and/or PPAR) to reduce inflammation and facilitate a shift toward metabolic and inflammatory homeostasis. Comparison of KB with first-line drugs suggests that rosiglitazone may over-regulate lipid metabolism and anti-inflammatory responses, which may be associated with adverse side effects, while metformin had less impact on lipid and anti-inflammation profiles. Our research from holistic and systemic views supports the conclusion that KB is the bioactive compound of LyC for managing T2DM, and suggests KB as a nutraceutical or a pharmaceutical candidate for T2D treatment. In addition, our research provides insights related to metformin and rosiglitazone action, beyond lowering blood glucose.
Introduction
Systemic metabolic diseases, especially type 2 diabetes mellitus (T2DM), have become a global public health issue. According to the International Diabetes Federation, there are approximately 415 million diabetic patients in the world, and the number is expected to rise to 642 million by 2,040 (Forces, 2015).
T2DM presents a feature of uncontrolled high blood sugar accompanied with long-term complications such as cardiovascular diseases, diabetic retinopathy, and diabetic nephropathy. Although the pathogenesis is not yet fully understood, obesity, insulin resistance, metabolic disorder, and chronic low-grade inflammation are associated with T2DM (Esser et al., 2014). One of the most recognized theories is lipotoxicity (Schooneman et al., 2012; McArdle et al., 2013). Here, the over-accumulation of lipids and lipid metabolites interrupts normal cell signal transitions and stimulates immune cell infiltration which produces chronic inflammation that further exacerbates metabolic dysfunction (McArdle et al., 2013). In this regard, correcting lipid dysregulation and reducing inflammation are keys for managing T2DM, especially in early stages.
In addition to changing diet and lifestyle, dietary supplements and drug treatments provide a complementary strategy (Balducci et al., 2010; Poulsen et al., 2013). Most prescribed anti-diabetic drugs work on glycemic control through inhibiting intestinal adsorption (acarbose) (Bischoff, 1995), stimulating pancreatic insulin secretion (sitagliptin and glipizide) (Thulé and Umpierrez, 2014), sensitizing insulin receptors (metformin and rosiglitazone) (Ahmadian et al., 2013), and inhibiting liver gluconeogenesis (metformin) (Hundal et al., 2000). However, adverse effects, including gastrointestinal reactions, bodyweight gain, blood glucose fluctuation (Bischoff, 1995; Thulé and Umpierrez, 2014), and risks in cardiovascular disease (Gerstein et al., 2008; Ahmadian et al., 2013) have limited their use for long-term treatment of T2DM.
As an alternative approach, natural supplements originating from traditional medicine or fruits or vegetables have been widely used to maintain T2DM (Yeh et al., 2003; Yin et al., 2008; Ota and Ulrih, 2017), because of reduced cost and easier accessibility compared to prescribed medications. In fact, many pharmaceuticals commonly used today are structurally derived from natural molecules, such as metformin. Some natural products, such as flavonoids, polyphenols, and organic acids, have shown in vitro efficacy involving actions of reducing glucose absorption (Zhang et al., 2016), alleviating insulin resistance (Zhang et al., 2012), oxidative stress (Ramful et al., 2010; Li et al., 2015), and inflammation (Zagotta et al., 2015). However, in-depth and holistic in vivo studies are still required to validate the efficacies and safety and to understand the modes of action, because T2DM is a systemic metabolic disorder. Such investigations are extremely important before such natural products are recommended for clinical trial or for usage in treatment and/or prevention or attenuation of diabetes.
In recent years, the rise of metabolomics, a high throughput technology for measuring all or phenotype-relevant metabolites at one time (Bain et al., 2009; Newgard, 2017), has provided novel tools to understand the action of drug or nutritional intervention by characterizing the perturbed metabolites between groups with and without treatment (Kaddurah-Daouk and Weinshilboum, 2014, 2015). These perturbed metabolites can be further used to identify targets and pathways involved in efficacy, side reactions, and even toxicity (Nicholson et al., 2002; Stewart et al., 2015). The application of metabolomics to pharmacological studies therefore provides more comprehensive and in-depth information at a molecular level than an approach only focusing on one or several phenotypic outcomes, such as body weight, blood glucose, and enzyme activity, which are normally used to judge the efficacy or adverse effects of the treatments. Metabolomics, integrated with pathway analysis, enables novel directions in understanding the modes of action for traditional medicine, especially for study designs based on in vivo models and human subjects. For example, Su et al. used a metabolomics approach to reveal that baicalein can alleviate heavy metal-induced liver and kidney damage through regulating energy metabolism, choline metabolism, amino acid metabolism, and gut flora (Su et al., 2017). Xie et al. using GC-MS and LC-MS based metabolomics approaches, discovered a 2-week intervention with Pu-erh tea significantly changed human urinary global metabolite profiles, where the increase of nicotinic acid in urine after pu-erh tea intake may be responsible for cholesterol reducing and lipid-lowering effects, and the depleted concentration of 3-chloroytrosine may be associated with lowering triglyceride (TG) and low-density lipoprotein (LDL) (Xie et al., 2012).
Lycii Cortex (LyC) is an herb frequently prescribed in TCM to treat chronic metabolic diseases, e.g., diabetes and hypertension (Li et al., 2004; Potterat, 2009; Su et al., 2013), yet the mechanism has never been revealed. Our previous study revealed that kukoamines, especially kukoamine B, are the major compounds of LyC, accounting for approximately 2% of the herbal dry mass (Li et al., 2014). Recent research from our group and other research groups has revealed that KB (or its isomer kukoamine A) has bioactivities in anti-oxidation, anti-inflammation, and anti-insulin resistance (Liu et al., 2011; Li et al., 2015, 2017), which are highly associated with diabetes; however, direct in vivo evidence showing the beneficial effect of KB on T2DM from the viewpoint of metabolomics has not yet been found.
In the current study we used multi-metabolomics approaches, including lipidomics and a targeted panel (Biocrates p180 kit), as well as a molecular assay to profile cytokines, to study the effect of KB on the diabetic db/db mouse model. The perturbed lipids, metabolites, and cytokines were analyzed to determine the enriched biochemical pathways. Furthermore, KB was compared with the first-line anti-T2DM drugs metformin and rosiglitazone regarding efficacy, side effects, and modes of action.
Methods
Animals and Treatment
A spontaneous type 2 diabetic animal model, the db/db mouse model, was used in this study to simulate the hyperglycemia and dyslipidemia symptoms in human T2DM (Cefalu, 2006; Adam et al., 2016). Male, 4-week old db/db mice (BKS.Cg-m+/+ Leprdb/J, n = 50) and age- and strain-matched wild-type (WT) mice (C57BLKS/J-m+/+ db, n = 10) were purchased from the Mode Animal Research Center of Nanjing University (Nanjing, China). All mice were kept in a specific pathogen free (SPF) condition in the laboratory animal center located in the Wuhan Institute of Drug and Medical Device Control (WIDMDC, Wuhan, China), under regulated environmental conditions with temperature at 25°C, humidity at 50%, and a 12:12-h light-dark cycle. All mice were fed standard chow with ad libitum access to food and water. All mice had one-week adaptive feeding before receiving treatments. KB (95%) was purified from Lycii Cortex extract according to the patent awarded to Cheung et al. (US9012687B2) (Cheung et al., 2015). According to the literature, db/db mice start to present diabetic symptoms, such as hyperglycemia and weight gain, in week 4–6 (Adam et al., 2016). In our study, at the end of week-5, the bodyweight and fasting blood glucose from tail vein were measured according to standard protocol (Ayala et al., 2010). We found that db/db mice demonstrated significant diabetic phenotypes, showing 2-fold higher bodyweight and 3-fold higher blood glucose than the WT mice. At this time point, all diabetic mice were distributed randomly into 4 groups (n = 10 per group) and received gavage with 50 mg/kg/d of KB, 5 mg/kg/d of metformin, 5 mg/kg/d of rosiglitazone, or the same volume of saline as vehicle (negative control). WT mice (n = 10) were only treated with vehicle. KB dosage levels were selected according to previously published work by Liu et al. (2011). We investigated two concentrations (20 and 50 mg/Kg/day) in the whole animal study, and the high-dose group was selected for metabolomics study because of the more significant effect in controlling blood glucose. With the nutraceutical effect being our desired primary endpoint, the selection of dose-range for metformin and rosiglitazone were based on a small pilot study before doing the full animal study. We investigated two doses of 5 and 20 mg/Kg/day for metformin and rosiglitazone, respectively, and found the lower doses for both drugs demonstrated significant effects in lowering blood glucose compared to the untreated controls. The bodyweight of mice was measured every 5 days and the fasting blood glucose was measured weekly from tail vein using a glucose meter (Ayala et al., 2010). At the end of the experiment (9 weeks of treatment, mice age = 15 weeks), mice were fasted overnight and then euthanized by CO2 inhalation. Serum and tissues were collected, weighed, and snap-frozen at −80°C until analysis. Animal handling was conducted according to the “Guide for the Care and Use of Laboratory Animals” which was approved by the Institutional Animal Care and Use Committee of WIDMDC (Document: WHYXS/LL001-2014).
Lipidomics
Samples were randomized before analysis. The preparation of serum samples and data acquisition followed the method published by Bird et al. (2011) with modifications. In general, serum (30 μL) lipids were extracted by adding 600 μL of 2:1 dichloromethane/methanol (DCM), vortexed at 4,000 rpm for 2 min, then adding 120 μL H2O and vortexed again for 1 min to complete the liquid-liquid extraction. Samples were incubated for 10 min at room temperature, and then centrifuged at 16,000 rcf for 10 min at 10°C. Aliquots of the lower lipid-rich DCM layer (370 μL) were transferred to new tubes and dried overnight on a Speed Vac. Dried extracts were reconstituted with 300 μL of acetonitrile/isopropanol/H2O (65:30:5, v/v/v) for instrumental analysis. For quality control (QC) purposes, 10 aliquots of commercial pooled mouse serum (Sigma Aldrich) were prepared identically and analyzed throughout the analysis sequences.
Lipidomics data was acquired in both positive and negative modes using a Waters ACQUITY UPLC system (Waters, Milford, MA) coupled with an LTQ Orbitrap Velos mass spectrometer (Thermo Fisher, San Jose, CA). Lipids were separated via a CSH C18 column (2.1 × 100 mm, 1.7 μm, Waters Technology) at 50°C with a flow rate at 0.25 mL min−1. In the binary reverse phase gradient for LC method, the mobile phase A was composed by H2O/acetonitrile (60:40) and the mobile phase B was composed by isopropanol/acetonitrile (90:10). Formic acid (0.1%) and ammonium formate (10 mM) were added to facilitate lipid ionization. A 10 μL injection volume was used and the data was collected from 120 to 2,000 m/z in positive and negative modes using the data dependent acquisition scan.
Peak alignment and normalization were performed using Progenesis QI (version 2.1, Waters, USA). The detected ions with retention time ≤1 min or ≥27 min, and peak width ≤ 0.1 min or ≥2.0 min, and mass range ≤250 m/z were excluded from further analysis. In addition, the highly variable ions with relative standard deviation (RSD) >30% in QC samples were also excluded. The “normalize to total intensity” mode, recommended by the software, was used to normalize the data.
Multivariate analysis, including principal component analysis (PCA), partial least squares discriminate analysis (PLS-DA) and orthogonal partial least squares discriminate analysis (OPLS-DA) were performed after Pareto-scaling and mean centering, with SIMCA 14.1 (Umetrics, Umeå, Sweden). The Variable Influence on Projection (VIP) value was used to evaluate the importance of the compounds for classification. Significance was determined using t-test in SAS 9.4 (SAS Institute Inc., Cary, NC). Peaks with VIP ≥ 1.0 were considered important to the differentiation of study groups, and p < 0.05 were considered significant. Lipids were identified through matching to databases including HMDB, Lipid Blast, and the in-house database based on exact mass and MS/MS fragmentation patterns.
Targeted Metabolomics Analysis
Targeted analysis for serum metabolites was performed using the Absolute/IDQ™ p180 Kit (Biocrates Life Sciences AG, Innsbruck, Austria) with data acquired on an API 4000 (AB Sciex, Foster City, CA) triple quadrupole MS coupled with an Agilent 1200 HPLC (Santa Clara, CA). This kit enables quantitation to semi-quantification of 188 analytes, including 40 acylcarnitines, 20 amino acids, 19 biogenic amines, 76 phosphatidylcholines (PC), 14 lyso-phosphatidylcholines (LPC), 15 sphingomyelins (SM), and 1 hexose. Sample preparation and data acquisition were performed on randomized samples, according to the manufacturer's protocol and literature (Floegel et al., 2013), with LOD/LOQ indicated in supplementary material. Significant change in pairwise comparison was defined as p < 0.05 by t-test using SAS 9.4., and the importance was defined as VIP ≥ 1.0 via SIMCA.
Cytokines
Serum cytokines were measured by using the Antibody G-5 Series array (RayBiotech, GA, USA) to profile 80 inflammatory cytokines simultaneously. Eight of ten samples per group were randomly selected by SAS 9.4, and then randomized before analysis. Experimental operations of blocking, sample loading, incubation, washing, and scan for detection of cytokine intensity were performed according to the manufacturer's instructions and literature (Stewart et al., 2016). The relative expression of each cytokine was normalized to the average value of positive controls in cytokine array slides. A heat map demonstrating the relative difference of each cytokine was generated using the manufacturer's threshold criteria for being up-regulated (≥1.5-fold) or down-regulated (≤-1.5-fold) for the vehicle treated WT mice, KB-, metformin-, and rosiglitazone- treated db/db mice vs. the vehicle treated db/db mice. Likewise, significance was calculated using Wilcoxon Rank Sum Test (p < 0.05).
Pathway Analysis
GeneGo (MetaCore™) software (Encinitas, CA) was used for pathway analysis, and p-values and false discovery rates are provided for the top 12 pathways enriched from the “build your network” tool.
Results
KB Lowered Blood Glucose Without Body Weight Gain or Liver Mass Increase
At 5 weeks old, fasting blood glucose in the vehicle-treated db/db mice (control) was approximately 3-fold higher than in the vehicle-treated WT mice (Figure 1A), demonstrating typical phenotypes of hyperglycemia. In addition, the 14-week-old mice showed a significant increase (p < 0.05) of blood glucose vs. the start-point at 5 weeks old, indicating an age associated blood glucose increase in db/db mouse model. After 9 weeks of treatment, the KB-treated db/db group (KB-db/db) showed lower blood glucose than control (p < 0.01) (Figure 1A). Also, treatment with KB successfully controlled the augment of blood glucose with age increase, as no significant difference in blood glucose was found between the start- and the end- points of the treatment. Both metformin and rosiglitazone presented outstanding hypoglycemic effects vs. control (p < 0.01). Furthermore, both metformin and rosiglitazone effectively inhibited the age-associated blood glucose increase in db/db mice (Figure 1A). After the treatment, no significant difference in blood glucose level was found among the KB-db/db, metformin-db/db, and rosiglitazone-db/db groups. It was noted that metformin and rosiglitazone had immediate hypoglycemic effects, which were effective in inhibiting the blood glucose increase from the first week of treatment. In contrast, the glucose-lowering effect of KB was slower and less potent, as the significant reduction in glucose was noticeable after 7 weeks of treatment.
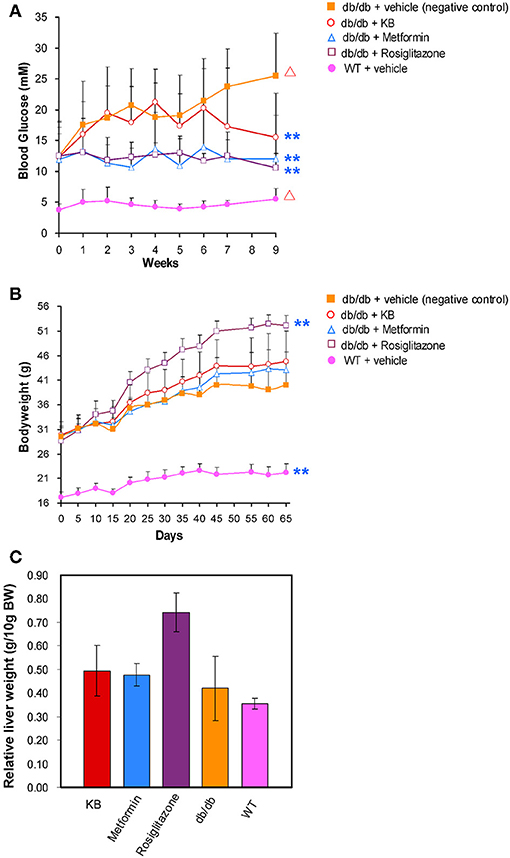
Figure 1. KB lowered blood glucose in db/db mice without bodyweight gain or hepatomegaly. (A) Effect of treatments on blood glucose. (B) Effect of treatments on body weight. (C) Effect of treatments on liver mass. Symbols: orange filled square, db/db + vehicle (negative control); pink filled circle, WT + vehicle; purple hollow square, db/db + rosiglitazone; blue triangle, db/db + metformin; red hollow circle, db/db + KB. **p < 0.01 vs. vehicle + db/db; Δp < 0.05 vs. value at starting time point.
At 5 weeks old, the bodyweight of db/db mice in control was 2-fold higher than that in the vehicle-treated WT mice (Figure 1B). Like blood glucose levels, the increase of bodyweight in db/db mice is also dependent on age (p < 0.05). Neither the KB- nor the metformin-db/db group showed significant weight gain or loss vs. control during or after the treatment. However, significant bodyweight gain was observed in the rosiglitazone-db/db group beginning at day 15, and the weight gain continued throughout the treatment. A mass increase in liver tissue was associated with rosiglitazone (Figure 1C), consistent with a previous study (Watkins, 2002). This side effect was not observed in the KB and metformin groups.
Impact of KB Treatment on Lipid Profiles
Circulating lipids were first investigated by broad-spectrum lipidomics. To obtain a comprehensive picture of the up- or down- regulation of lipids following treatments, LC-MS data were acquired by both positive and negative modes. Triglycerides (TG) and cholesterols (CHEL) were detected in positive mode, whereas most phosphatidylethanolamines (PE) and phosphatidylinositols (PI) were detected in negative mode (Table 1). Unsupervised multivariate analyses (PCA) for positive- (Figure 2A) and negative modes (Figure S1) are consistent in showing similar separation patterns for the investigated treatments, including vehicle-WT, vehicle-db/db, KB-db/db, metformin-db/db, and rosiglitazone-db/db. The vehicle-WT group was differentiated from the vehicle-db/db-group, indicating a shift of lipid metabolism in the db/db mice compared with WT mice. The drug response was evaluated by comparing with the vehicle-db/db group as control. KB treatment showed an obvious differentiation of the lipid profile from the control (Figure 2A). In the same direction as KB, the rosiglitazone treated group displayed a much greater differentiation from the control. However, the metformin-db/db group was clustered with the control, suggesting that metformin has limited influence on lipid metabolism.
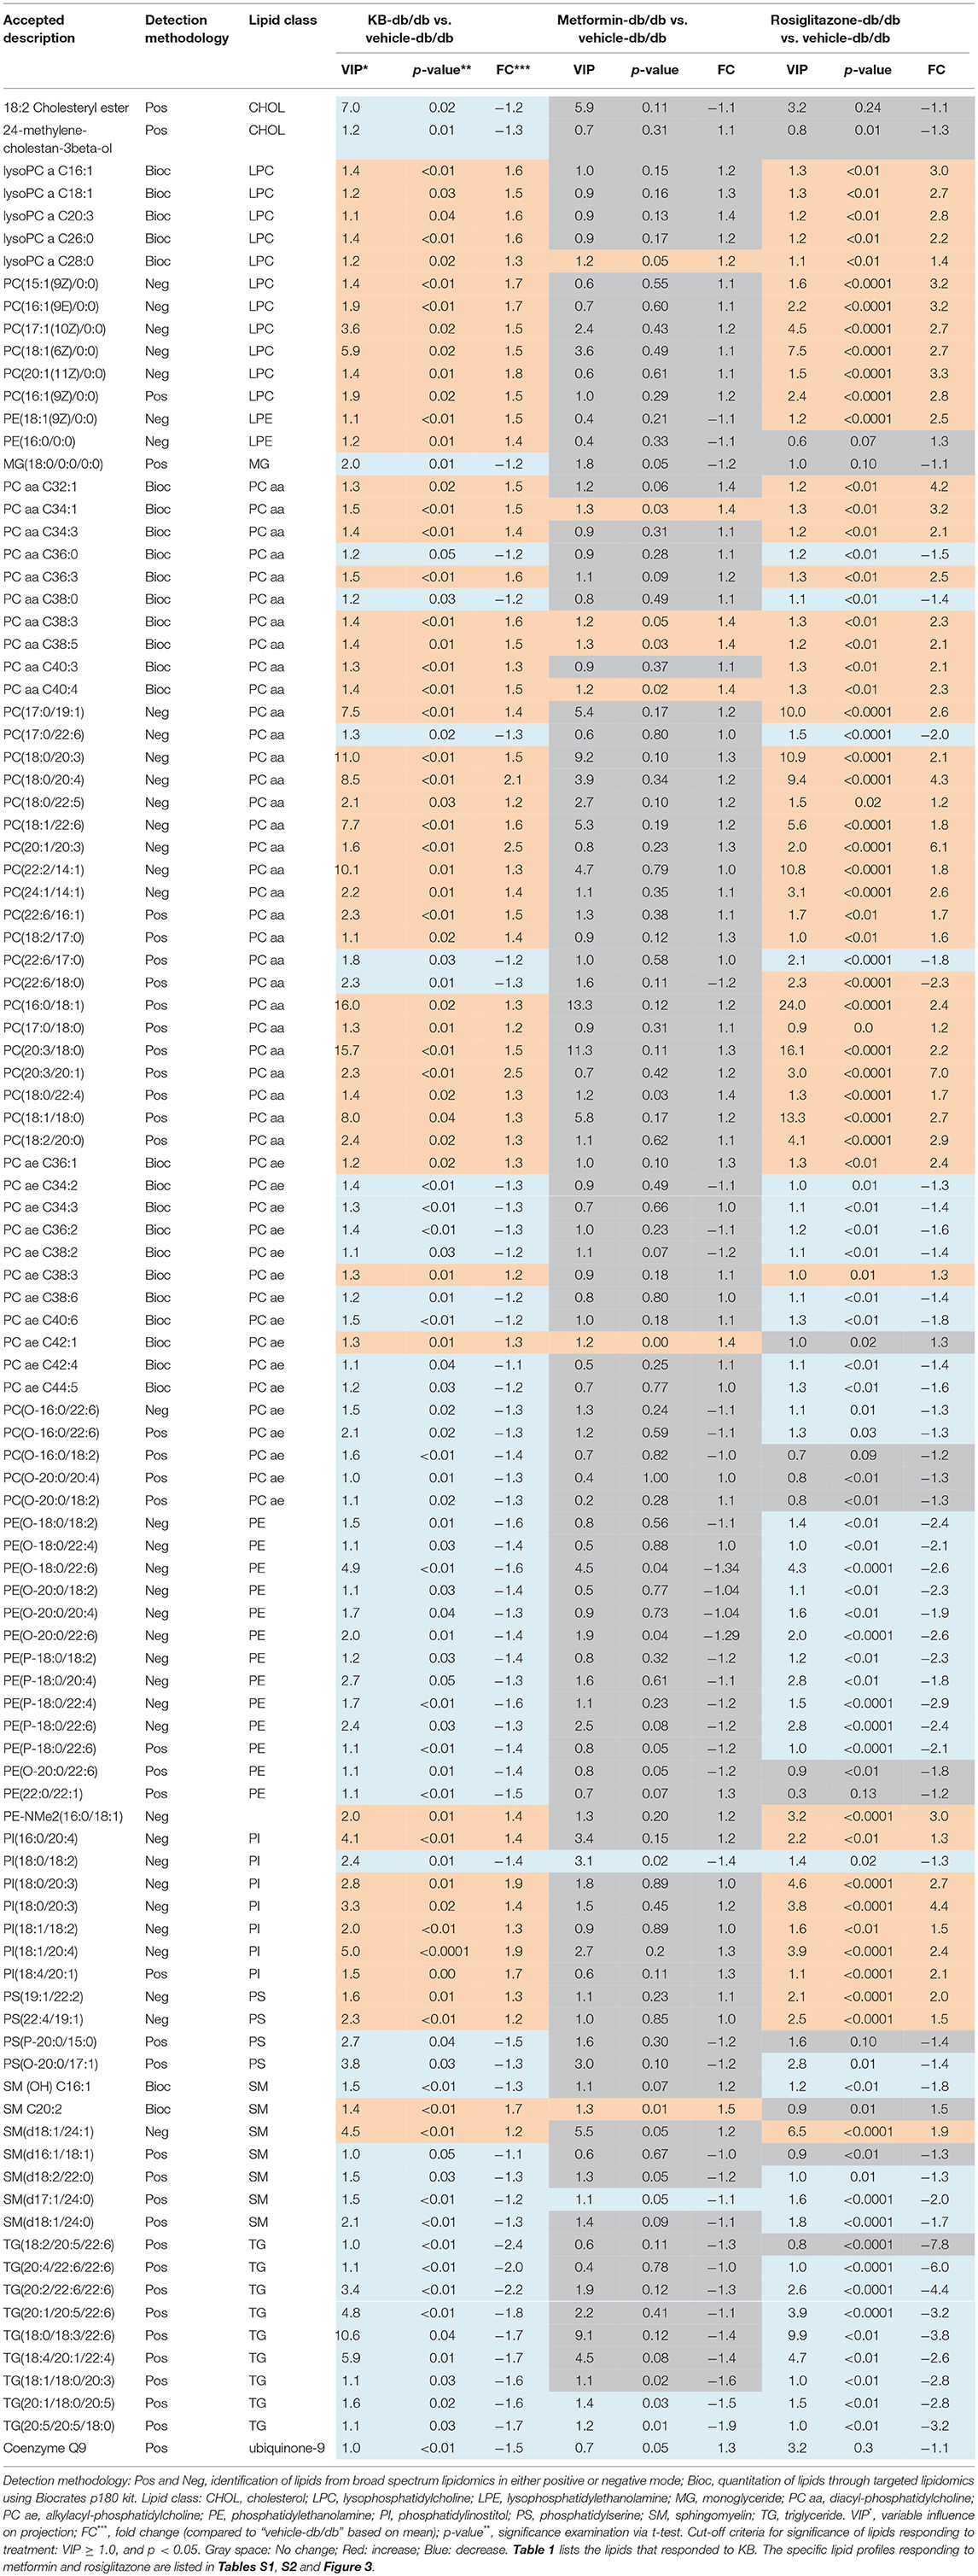
Table 1. Serum lipids significantly responded to KB and the comparison with metformin and rosiglitazone.
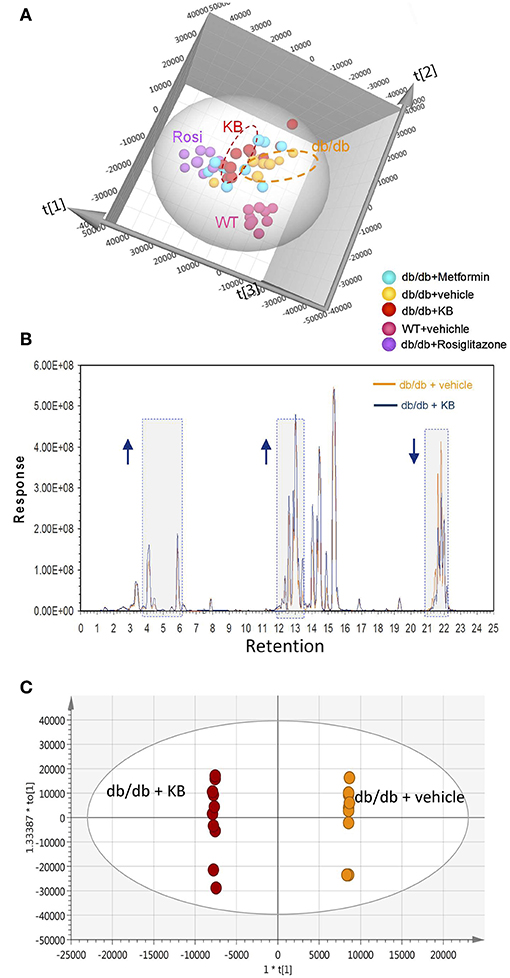
Figure 2. KB influenced circulating lipids in db/db mice. (A) Score scatter plot of the principal component analysis (PCA) for KB-, metformin-, rosiglitazone-, and vehicle-treated db/db mice, and vehicle-treated WT mice (data was acquired in positive mode). R2X (cum) = 0.939. (B) Overlap of typical base peak ion (BPI) chromatograms of KB- and the vehicle treated db/db (negative control) mice. Colors: dark blue line, KB +db/db; orange line, vehicle + db/db. Arrow up or down indicates the trend of signal change vs. negative control. (C) Score scatter plot of the supervised multivariate analysis (OPLS-DA) for KB +db/db vs. vehicle +db/db mice. R2X (cum) = 0.947, R2Y (cum) = 1, and Q2 (cum) = 0.764. Colors for (A,C): Orange, vehicle+ db/db; pink, vehicle + WT; red, KB + db/db; blue, metformin + db/db; purple, rosiglitazone + db/db.
The overlap of the base peak chromatogram (BPC) from the KB-db/db and the vehicle-db/db samples in positive mode (Figure 2B) exhibits most signal differences in three retention-time regions. For the C18 column used, we expect the down-regulated signals at the region of 21.0–22.5 min to be associated with non-polar lipids, such as triglycerides, cholesterols, and cholesterol esters (Bird et al., 2011; Fauland et al., 2011). The up-regulated signals in the region of 13.0–15.0 min are attributed to phospholipids, while the signals in the region of 3.5–6.5 min are attributed to lysophospholipids and other hydrosoluble small lipid-related metabolites.
An additional aliquot of serum from the same animals was measured by a targeted approach using the Biocrates p180 kit, in which 106 lipid species were visualized by PCA. The pattern of PCA score scatter plot for this targeted approach (Figure S3) is very similar to that of broad spectrum lipidomics (Figure 2A and Figure S1), demonstrating consistent results between targeted and untargeted approaches.
Supervised pairwise comparison between drug-treated group (KB-db/db, metformin-db/db, and rosiglitazone-db/db) and control (vehicle-db/db) was performed by OPLS-DA for both the untargeted and targeted lipidomics data (Figure 2C and Figures S2, S4). Compounds satisfying VIP ≥ 1.0 and p < 0.05 were considered as treatment-responsive lipids and summarized in Table 1 and Figure 3. As shown in the Venn diagram (Figure 3A), 104 lipids were identified as the KB-perturbed lipids to differentiate the KB-db/db group from the vehicle-db/db control. Likewise, 191 lipids were perturbed by rosiglitazone; while only 56 lipids were perturbed by metformin. Overall, 75% of altered lipids were in common between KB and rosiglitazone. However, very few of these lipids were influenced by metformin.
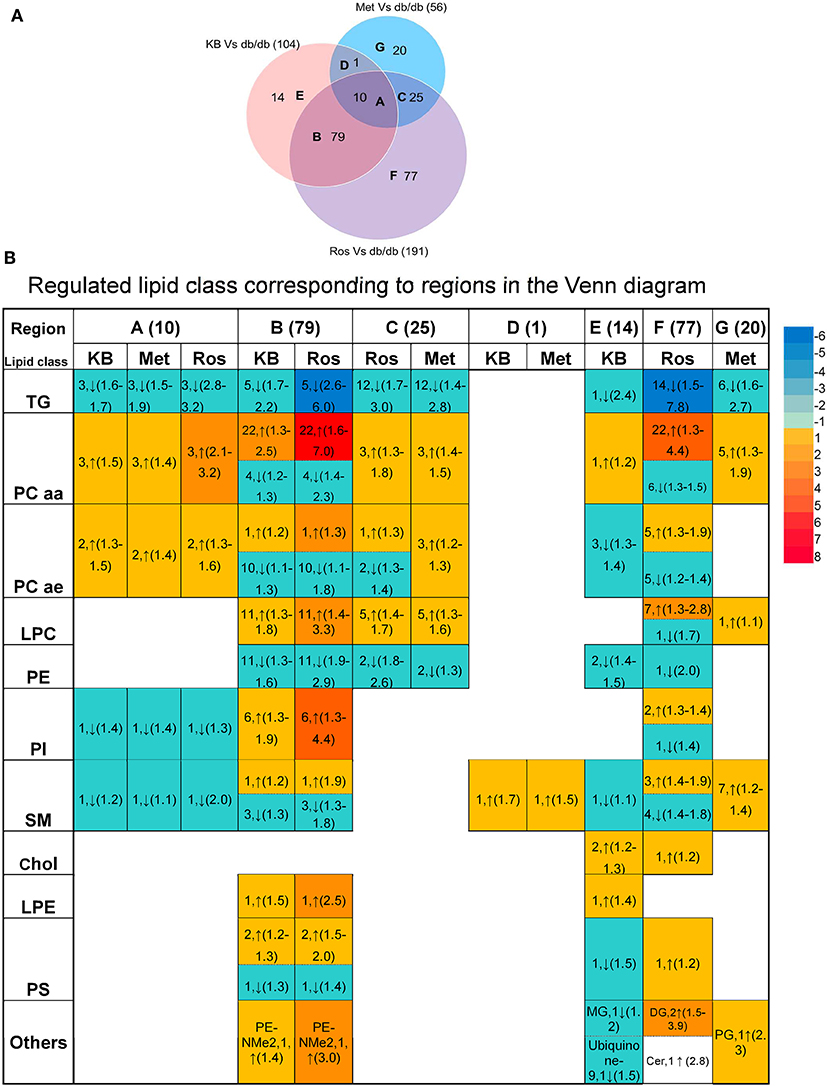
Figure 3. Comparison of lipids responding to KB, rosiglitazone, and metformin treatment. (A) Venn diagram of altered lipids following treatment with KB, rosiglitazone and metformin in db/db mice. Lipids which differentiated treatment groups (i.e., KB-db/db, rosiglitazone-db/db, and metformin-db/db) from control group (i.e., vehicle-db/db) satisfying VIP ≥ 1.0 and p < 0.05 were defined as altered. The capital letters inside each circle of the diagram represent the overlap of altered lipids following each respective treatment; and the digit next to the capital letters indicate the number of lipid species that overlap. Digits in parentheses outside the Venn diagram represent the total number of altered lipids from each treatment. (B) Classes of the lipids corresponding to different regions of the Venn diagram. Arrow direction indicates up- or down-regulation of the lipid species. The digit before the arrow indicates the number of lipid species identified in each class, and the numbers inside the parentheses indicate fold-change from low to high. Colors from blue to red indicate the fold-change magnitudes.
The drug-responsive lipid class corresponding to different regions of the Venn diagram is shown in Figure 3B. KB treatment significantly decreased triglycerides (TG), phosphatidylethanolamines (PE), monoglycerides (MG), cholesterol, cholesteryl ester, coenzyme Q9, as well as most of sphingomyelin (SM), and alkylacyl-phosphatidylcholines (PCae) species, accompanied by an increase of diacyl-phosphatidylcholine (PCaa) and lysophosphatidylcholine (LPC) and phosphatidylinositol (PI) (Table 1 and Figure 3B). It is interesting to find that phosphatidyl-dimethylethanolamine (PE-NMe2), the intermediate of PC biosynthesis from PE via the phosphatidylethanolamine N-methyltransferase (PEMT) pathway (Gibellini and Smith, 2010; Cole et al., 2012), was elevated 1.4-fold, indicating the activation of this pathway.
Rosiglitazone-db/db vs. control and KB-db/db vs. control showed consistent regulated directions for all lipid classes (Table 1 and Figure 3B), but rosiglitazone induced a dramatically greater magnitude of fold-change and impacted more lipid species in each class.
Metformin caused less perturbation in lipid species and alteration of magnitude than KB and rosiglitazone (Figure 3B, Table 1, and Table S1). Compared with phospholipids, TG seems more responsive to metformin treatment. Among the few metformin-influenced lipids, TG, LPC, PCaa, and PE were up- or down- regulated in the same direction as KB and rosiglitazone. Since metformin, rosiglitazone, and KB were effective in regulating blood glucose of db/db mice in different levels, changing of these lipid classes might be related to glucose homeostasis.
Influence of KB on Acylcarnitine Profiles Compared to Rosiglitazone and Metformin
The influences of KB, metformin, and rosiglitazone on acylcarnitine profile were studied using the Biocrates p180 kit. A total of 21 acylcarnitines were measured in a semi-quantitative manner (Table 2), while 19 species were lower than the limit of detection. Carnitine (C0) and acetylcarnitine (C2) were found to be the most abundant species in the acylcarnitine profile, with 10- to 100-fold higher abundance than those with longer carbon chains. The vehicle-db/db mice generally had lower serum acylcarnitine levels than the vehicle-WT mice (Table 2). Compared to the control (vehicle-db/db), the KB-db/db group showed moderate increases of the C18, C16, C14, C3, and C2 acylcarnitines with/without hydroxyl- or unsaturated- fatty acid conjugates. Rosiglitazone-db/db vs. control displayed significantly increased acylcarnitines, as well as more perturbed acylcarnitine species with greater fold-change magnitudes than KB-db/db vs. control. Metformin appeared to work in a different way, as the short-chain acylcarnitines, such as C0, C2, C4, C5, and C6 were decreased compared to control.
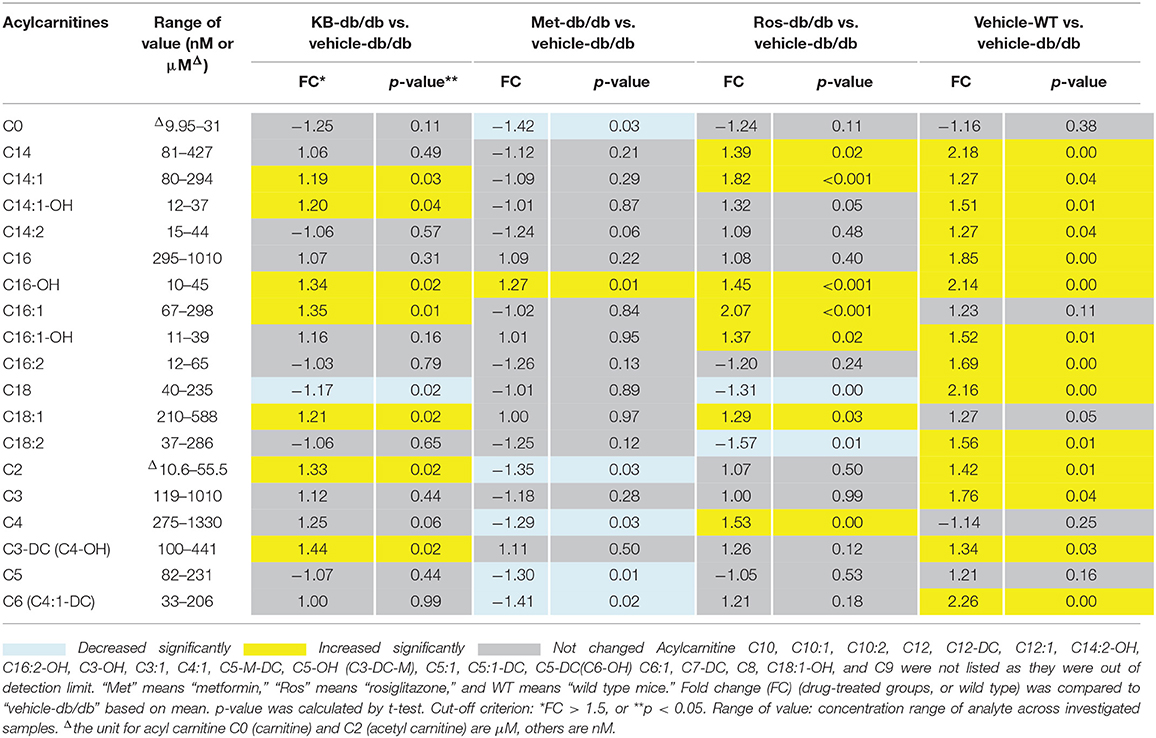
Table 2. Up- and down- changed acylcarnitines in response to different treatments.
Unlike for lipids and acylcarnitines, perturbation of amino acids and biogenic amines by KB was minor in db/db mice (Table S3). Results for hexose were not reported in the Biocrates section, because the data did not pass the QC in pool samples.
KB Reduced Chronic Inflammation in db/db Mice
Eighty circulating inflammatory markers were profiled in a separate aliquot of the same serum samples. As shown in Figure 4, the vehicle treated db/db mice (control) had overall higher cytokine levels than the vehicle-treated WT group, consistent with previous studies (Esser et al., 2014). After treatment, the KB-db/db mice showed reduced levels of 29 inflammatory markers vs. control (Figure 4). The rosiglitazone-db/db group showed sharp decreases of all cytokines vs. control. For several cytokines, this reduction was even greater than that of vehicle-WT vs. vehicle-db/db. The metformin-db/db group showed moderate to no down-regulation in measured cytokines vs. control, reducing only 15 cytokines. Both metformin and KB moderately regulated the chemokines, IGF-1, leptin, and growth factor hormones; however, metformin did not decrease any of the interleukins (Table 3 and Table S3).
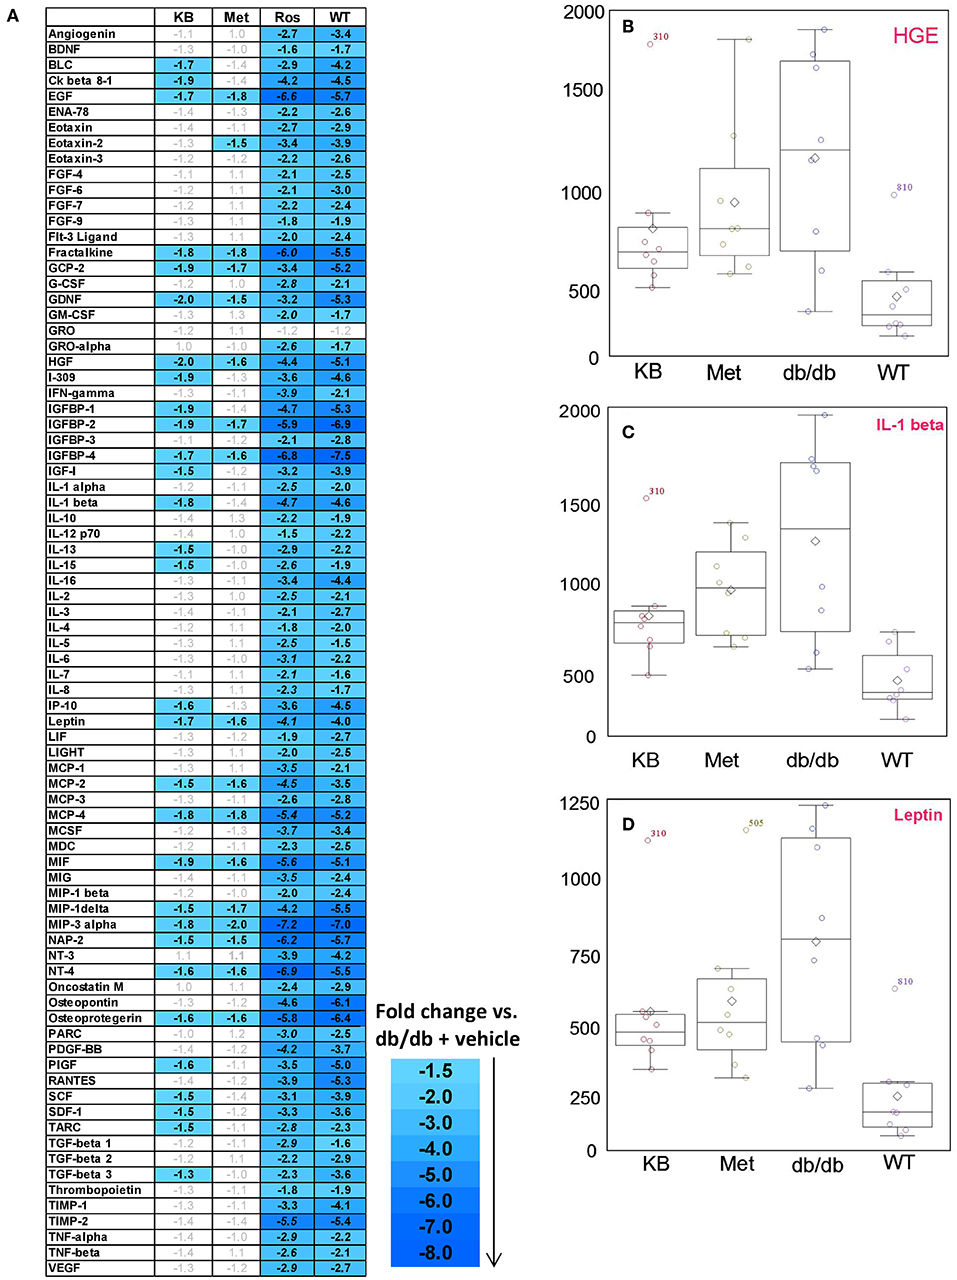
Figure 4. Influence of KB, metformin, and rosiglitazone on chronic inflammation in db/db mice. (A) The color-graded table demonstrates relative fold-change of cytokines for KB-, metformin-, and rosligtazone-treated db/db mice, as well as the vehicle-WT group, all normalized to the vehicle-db/db group (control). The fold changes are based on the median of biological replicates in each group (n = 8). Threshold criteria for being up-regulated (≥1.5-fold) or down-regulated (≤-1.5-fold) are according to manufacturer's guidelines (RayBiotech). A negative fold change means the cytokine level is lower than in the control (vehicle-db/db group). (B–D) Box plots for cytokines of interest in KB-db/db and metformin-db/db mice: (B) HGE; (C) IL-1β; (D) Leptin. KB, Met, and Rosi indicate KB-, metformin-, and rosiglitazone treated db/db mice, respectively; WT indicates vehicle-treated wild type mice.
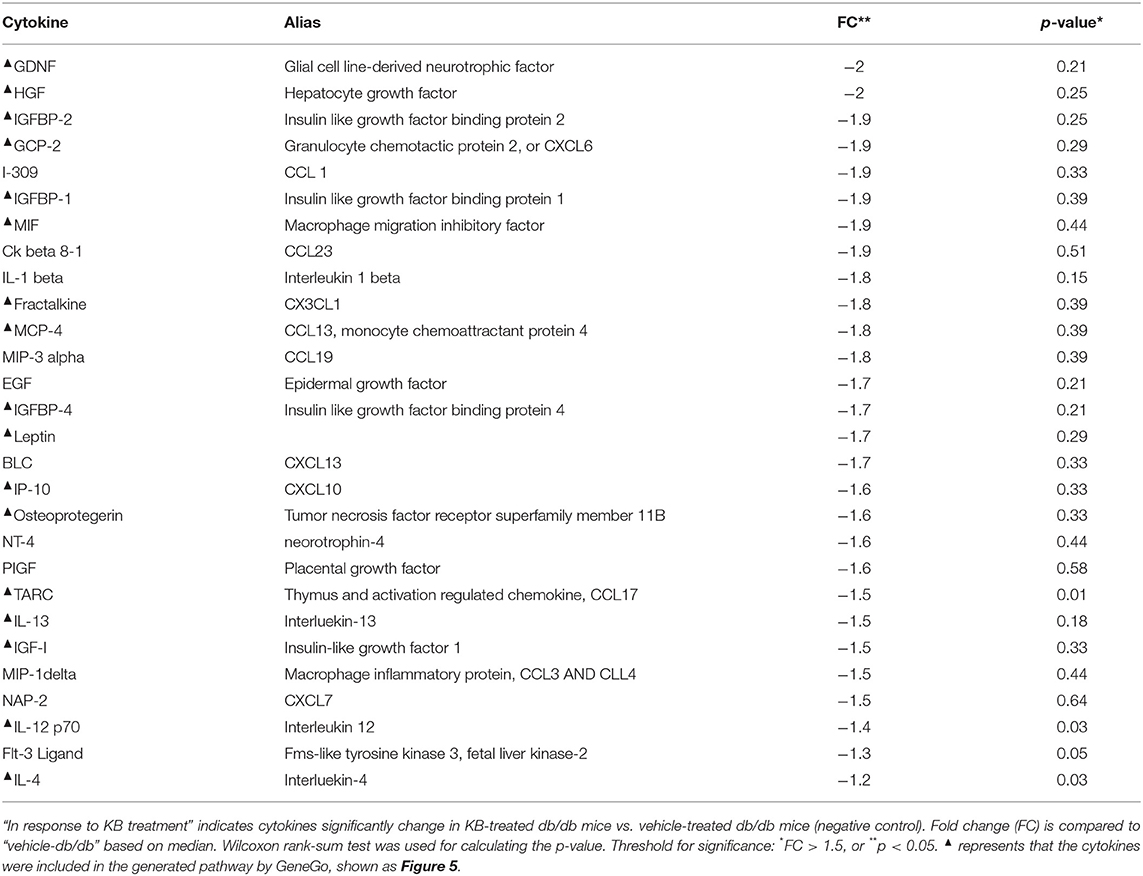
Table 3. Down-regulated cytokines in response to KB treatment in db/db mice.
Discussion
We used a multi-omics approach to investigate the efficacy of KB, a natural product purified from the TCM herb Lycii Cortex, on T2DM by means of the db/db diabetic mouse model. Compared to the vehicle-treated db/db mice (control), KB (1) attenuated blood glucose without bodyweight gain or hepatomegaly; (2) regulated lipid and energy metabolic pathways toward homeostasis; and (3) reduced chronic inflammation. This in vivo study has provided direct evidence that KB is the major bioactive molecule from LyC that intervenes early diabetes. This research also provides new insight about the influence of low-dose metformin and rosiglitazone on lipid metabolism and circulating inflammatory markers in the diabetic mouse model.
Measurement of fasting blood glucose reduction is the gold standard to evaluate efficacy of anti-T2DM drugs. Even though the dosages used in this study are lower than the levels commonly used for therapeutic purposes (Fujita et al., 2005; Chodavarapu et al., 2013; Adam et al., 2016), metformin and rosiglitazone still presented significant effects in attenuating blood glucose increase (Figure 1). Rosiglitazone is reported to associate with adverse effects such as bodyweight gain and hepatomegaly (Watkins, 2002; Ahmadian et al., 2013). In our animal study, we also observed weight-gain and the increased liver tissue mass in the rosiglitazone-treated db/db mice compared to controls; whereas these adverse effects were not observed in the KB-db/db mice, despite the hypoglycemic effect of KB being much slower and less acute than rosiglitazone and metformin (Figure 1). We postulated that KB might indirectly regulate cellular glucose update or consumption, so that the immediate hypoglycemic effect was not as outstanding as those first-line drugs. However, since T2DM is a complicated disease with systemic dysfunctions underlying the symptom of hyperglycemia, KB may work via correction of one or more of the metabolic disorders, thus gradually helping the body to recover homeostasis.
Lipidomics revealed that KB reduced serum TG levels (Table 1 and Figure 3), consistent with results found in the metformin- and rosiglitazone-db/db mice; although to different magnitudes. A decrease in TG is expected to be associated with improvement of lipid homeostasis by several means, including (1) facilitating lipogenesis rather than adipocyte lipolysis (Ahmadian et al., 2013; Frühbeck et al., 2014; Kwon et al., 2015), (2) improving lipoprotein composition by reducing low-density lipoprotein (LDL) and increasing high-density lipoproteins (HDL) (Ahmadian et al., 2013; Geerling et al., 2014), and (3) accelerating lipid clearance and fatty acid oxidation (Geerling et al., 2014; Kwon et al., 2015). In addition to alterations in TG, we found that KB substantially increased circulating PC and LPC but decreased PE (Table 1 and Figure 3). There are mainly two in vivo pathways for synthesizing PC (Gibellini and Smith, 2010; Cole et al., 2012). One is the “Kennedy pathway,” which starts from choline occurring in all nucleated cells, and the other is the “PEMT pathway” which mainly occurs in the liver via three sequential methylations of PE by the enzyme phosphatidylethanolamine N-methyltransferase (PEMT) (Gibellini and Smith, 2010; Cole et al., 2012). KB was found to increase PE-NMe2 (16:0/18:1) (Table 1), suggesting it may influence the PEMT pathway and facilitate PC biosynthesis from PE. Because PC is required for lipoprotein assembly and secretion, especially for VLDL and HDL, this process is considered helpful for lipid secretion, transportation and clearance (Cole et al., 2012). Furthermore, the abundant PCs [such as PC (18:0/18:1) and PC (16:0/18:1)] which were found to respond to KB treatment in this study (Table 1) are endogenous PPAR δ or -á ligands, and have been proved to regulate glucose and lipid homeostasis (Chakravarthy et al., 2009; Lamaziere and Wolf, 2010; Liu et al., 2013). The increase of LPC (Table 1 and Figure 3B) by KB may result from either PC hydrolysis via enzymes from the phospholipase A2 superfamily, or cholesterol esterification which was catalyzed by the lecithin-cholesterol acyltransferase (LCAT) to transfer fatty acid moieties from position sn-2 of PC to circulating cholesterol to form cholesterol esters (Schmitz and Ruebsaamen, 2010). However, further work is needed to define which pathway was activated by KB to increase the LPC. The role of LPC in T2DM is still controversial; some researchers consider LPCs as a pro-inflammatory factor associated with atherosclerosis and cardiovascular disease comorbidities (Huang et al., 1999), while others believe LPC may be beneficial for glucose and metabolic homeostasis, and not related to insulin resistance (Yea et al., 2009; Klingler et al., 2016). Our results support the second argument that LPC facilitates metabolic homeostasis and anti-inflammation (Figure 4), although the mode of action has not yet been clearly defined.
Parallel comparisons with the first-line anti-T2DM drugs indicated that KB works in a similar way to rosiglitazone in regulating lipid profiles (Figure 3), although rosiglitazone was far more potent. Both KB and rosiglitazone appear to activate the PEMT pathway to facilitate PC biosynthesis, again considered beneficial for lipoprotein formation and lipid transportation (Lamaziere and Wolf, 2010; Weidner et al., 2012; Ahmadian et al., 2013). Based on the modulation of lipids and pathway analysis, we believe KB also regulates transcription factors (e.g., PPAR-γ), like rosiglitazone, which is already known to regulate genes that influence lipid metabolism. The difference, however, between KB and rosiglitazone may be that KB is more selective and less potent, because the number of lipid species being influenced and the magnitude of fold changes in lipid levels was less than those demonstrated by rosiglitazone, a full PPAR-γ agonist. Similar partial PPAR-γ agonists were found in edible plant herb licorice (Glycyrrhiza foetida) (Weidner et al., 2012). To confirm the influence of KB on transcription factors, we plan to perform RNA-Seq to verify the transcription factors regulated by KB corresponding to the lipid profile changes and compare with results from rosiglitazone.
Fatty acid oxidization (FAO) is an important biological process for energy supply and lipid homeostasis. Acylcarnitines are required to shuttle fatty acids through the mitochondrial membrane; thus acylcarnitines, especially long chain acylcarnitines, can be used to reflect the loading of fatty acid flux into mitochondria (Schooneman et al., 2012). In addition to FAO, degradation of ketone bodies (such as acetoacetate, beta-hydroxybutyrate, and acetone) and amino acids (such as valine, leucine, and tryptophan) for energy can also yield short-chain acylcarnitines (such as C3-, C4-, and C-5 acylcarnitines) (Schooneman et al., 2012). In our study, the vehicle-db/db mice had overall lower acylcarnitine levels than vehicle-WT mice in fasting status, indicating that db/db mice were less capable of utilizing either fatty acids or amino acids to adapt to starvation (Muoio, 2014). The PPAR-γ agonist rosiglitazone, reported to be a FAO stimulator (Schooneman et al., 2012; Ahmadian et al., 2013), significantly enhanced long-chain acylcarnitines in the db/db mice, indicating a higher loading of fatty acids into mitochondria to yield energy. Similar increases were observed in the KB-db/db mice. It is generally recognized in humans that the level of FAO can be reflected by the level of medium-chain acylcarnitines (Lehmann et al., 2010; Zhang et al., 2017). However, in the current study, except for C14 acylcarnitines, most of the other medium-chain species were too low to achieve validated quantitation using the Biocrates p180 assay. Nevertheless, we believe our data supports the suggestion that KB accelerates the transformation of fatty acids to acylcarnitines; but the actual FAO level needs to be confirmed using assays that evaluate citric acid cycle oxidation and the respiratory quotient (Speakman, 2013). Unlike KB and rosiglitazone, metformin treatment increased long chain acylcarnitine (e.g., C16-OH), but reduced short-chain acylcarnitines, corresponding to its anti-gluconeogenesis effect via reducing burning of amino acids for energy metabolism (Takashima et al., 2010; Viollet et al., 2012). Since KB showed almost no influence on amino acids and biogenic amines (Table S3), perturbation of these compounds by metformin and rosiglitazone, as well the biochemistry outcomes are not further discussed in this paper.
Chronic inflammation and metabolic dysfunction interact to serve as both cause and consequence for diabetes (Esser et al., 2014). This crosstalk was clearly demonstrated in our study, as the diabetic model presented strikingly higher overall cytokine levels compared to WT mice (Figure 4). KB treatment resulted in notable anti-inflammatory effects, reducing the level of 29 of 80 measured cytokines (Table 3), including interleukins, chemokines, insulin- like growth factors, and other growth factors such as HGF and GDNF. This response is not only considered to alleviate insulin resistance and diminish metabolic disorder, which are aggravated by unchecked inflammatory responses (Esser et al., 2014), but also to be beneficial for reducing risk of diabetic complications associated with macro- and micro-angiopathy (Mitamura et al., 2005; Clermont et al., 2006; Konya, 2014). The PPAR-γ agonist has been shown to interfere with immune-related genes to block inflammatory responses (Ahmadian et al., 2013), and coincident with our results rosiglitazone reduced all inflammatory markers in db/db mice after treatment. For some cytokines, the reduction caused by rosiglitazone-db/db vs. vehicle-db/db was even greater than the fold change between vehicle-WT and vehicle-db/db. This aggressive down-regulation may indicate a potential risk of immune compromise during long-term usage, although limited attention has been paid to this possible side effect. Although very effective at maintaining glucose homeostasis, compared to KB and rosiglitazone, the investigated lower-range dose of metformin exhibited the least anti-inflammatory responses, especially for down-regulating interleukins.
Pathway enrichment analysis (GeneGo MetaCore™) was used to evaluate which endogenous pathways were influenced by KB (Table S4) and networks can be seen in Figure 5. Based on the relevant enriched pathways, KB-influenced pathways were primarily related to (1) inflammatory response; (2) positive regulation of metabolic process; (3) lipoprotein assembly, localization, transportation, and clearance; and (4) positive response of peptide hormone. According to the analysis criteria of selected network objects in Figure 5, we believe that KB regulates nuclear transcription factors which inhibit down-stream cytokines and the G-alpha (i)-specific peptide G-protein-coupled receptors (Gi-GPCRs), modulating insulin signaling and metabolic homeostasis (Berger et al., 2015; Oh and Olefsky, 2016). In addition, interference with nuclear transcription factors also suggests regulation of genes and proteins (such as apolipoproteins) (Yue et al., 2008) for lipid metabolism, substantiated by changes of lipid profiles shown in our lipidomics study.
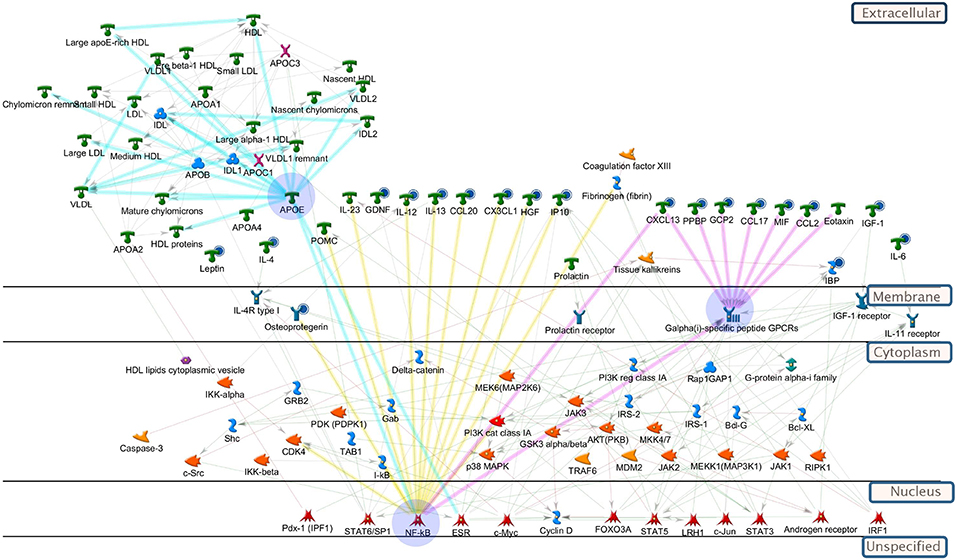
Figure 5. Pathway analysis of biomolecules differentiating vehicle-treated vs. KB-treated db/db mice. All-important metabolites, lipids, and cytokines were included in the enrichment analysis (GeneGo, MetaCore). The highlighted blue circles indicate the cytokines (or metabolites) being reduced by KB. Yellow highlighted linkages: cytokines regulated by up-stream transcription factors, e.g., NF-κB. Pink highlighted linkages: reduction of cytokines regulate down-stream receptors, Galpha(i)-specific peptide GPCRs, to influence metabolism. Light blue-highlighted linkages: apolipoprotein (e.g., APOE) regulated by transcription factors. Explanation of pathway map symbols can be found at https://portal.genego.com/.
In summary, from a holistic view, we demonstrated KB is effective in alleviating T2DM symptoms, and the primary mode of action may be through modulation of nuclear transcription factors (such as NF-κB and, or PPAR) to alter lipid metabolism and reduce chronic inflammation, thus eventually facilitating metabolic homeostasis. Although rosiglitazone was excellent at lowering blood glucose, the demonstrated overall disruption of lipid metabolism and the immune system may contribute to weight gain, as well as add risks in liver and cardiovascular outcomes, which have been reported in human subjects (Ahmadian et al., 2013). Since KB and rosiglitazone may impact similar pathways in regulating lipid metabolism and inflammation, increasing dosage and/or long-term exposure of KB may result in adverse effects like those of rosiglitazone. To test this, further evaluation on acute and long-term toxicities is required. With the investigated low dose, metformin appeared to be less effective at regulating lipid metabolism, fatty oxidation, and anti-inflammatory markers compared to either KB or rosiglitazone, although it significantly inhibited fasting blood glucose increase in diabetic mice. This indicated that metformin might regulate lipid metabolism and chronic inflammation requiring a higher dose-range and through another pathway independent to the route for simply influencing glucose metabolism. Our study presents great potential to further develop KB as a nutraceutical using independently, or in combination with low-dose first-line pharmaceuticals, for T2DM prevention and management. Our comparison study with metformin and rosiglitazone provided more information on how these currently used medications may act beyond lowering blood glucose.
Author Contributions
Y-YL: study design, animal sample collection. LC-MS: based metabolomics, data analysis, and manuscript writing. DS: cytokine array experiment design, execution, analysis and data interpretation. X-MY: animal study design consultant and execution. L-HY: animal study execution and animal sample collection. WP: SIMCA 14 multivariate data analysis. SM: statistical analysis. TF: data interpretation. H-YC: supervisor of animal study, including study design, data collection, analysis. SS: supervisor of metabolomics study and manuscript writing.
Conflict of Interest Statement
The authors declare that the research was conducted in the absence of any commercial or financial relationships that could be construed as a potential conflict of interest.
Acknowledgments
The authors are thankful for funding support from the Department of Health, Hong Kong Government SAR, China, for a project (CityU No. 9210029) on the Hong Kong Chinese Materia Medica Standards (HKCMMS). The omics-based work and analysis was supported by the NIH Eastern Regional Comprehensive Metabolomics Resource Core (1U24DK097193 – Sumner, PI). All lipidomics raw and normalized analytical data and associated metadata have been uploaded to the publicly accessible NIH Common Fund Metabolomics Data Repository (http://www.metabolomicsworkbench.org/). Biocrates p180 kit Concentration Data (μM) are shown in Data Sheet 1 in Supplementary Material. We thank Mr. Zachery Acuff for his contribution to this study. Also, many thanks will give to Dr. Jessica Gooding for her suggestions in lipidomics.
Supplementary Material
The Supplementary Material for this article can be found online at: https://www.frontiersin.org/articles/10.3389/fphar.2018.01575/full#supplementary-material
Data Sheet 1. Biocrates p180 kit Concentration Data (μM).
Abbreviations
T2DM, Type 2 diabetes mellitus; LyC, Lycii Cortex; KB, Kukoamine B; TG, Triglycerides; CHEL, Cholesterols; PE, Phosphatidylethanolamine; PI, Phosphatidylinositol; PC, Phosphatidylcholine; PCA, Principal component analysis; TCM, Traditional Chinese Medicine.
References
Adam, J., Brandmaier, S., Leonhardt, J., Scheerer, M. F., Mohney, R. P., Xu, T., et al. (2016). Metformin effect on nontargeted metabolite profiles in patients with type 2 diabetes and in multiple murine tissues. Diabetes 65, 3776–3785. doi: 10.2337/db16-0512
Ahmadian, M., Suh, J. M., Hah, N., Liddle, C., Atkins, A. R., Downes, M., et al. (2013). PPARγ signaling and metabolism: the good, the bad and the future. Nat. Med. 99, 557–566. doi: 10.1038/nm.3159
Ayala, J. E., Samuel, V. T., Morton, G. J., Obici, S., Croniger, C. M., Shulman, G. I., et al. (2010). Standard operating procedures for describing and performing metabolic tests of glucose homeostasis in mice. Dis. Model. Mech. 3, 525–534. doi: 10.1242/dmm.006239
Bain, J. R., Stevens, R. D., Wenner, B. R., Ilkayeva, O., Muoio, D. M., and Newgard, C. B. (2009). Metabolomics applied to diabetes research: moving from information to knowledge. Diabetes 58, 2429–2443. doi: 10.2337/db09-0580
Balducci, S., Zanuso, S., Nicolucci, A., Fernando, F., Cavallo, S., Cardelli, P., et al. (2010). Anti-inflammatory effect of exercise training in subjects with type 2 diabetes and the metabolic syndrome is dependent on exercise modalities and independent of weight loss. Nutr. Metab. Cardiovasc. Dis. 20, 608–617. doi: 10.1016/j.numecd.2009.04.015
Berger, M., Scheel, D. W., Macias, H., Miyatsuka, T., Kim, H., Hoang, P., et al. (2015). Galphai/o-coupled receptor signaling restricts pancreatic beta-cell expansion. Proc. Natl. Acad. Sci. U.S.A. 112, 2888–2893. doi: 10.1073/pnas.1319378112
Bird, S. S., Marur, V. R., Sniatynski, M. J., Greenberg, H. K., and Kristal, B. S. (2011). Serum lipidomics profiling using LC–MS and high-energy collisional dissociation fragmentation: focus on triglyceride detection and characterization. Anal. Chem. 83, 6648–6657. doi: 10.1021/ac201195d
Bischoff, H. (1995). The mechanism of alpha-glucosidase inhibition in the management of diabetes. Clin. Invest. Med. 18, 303–311.
Cefalu, W. T. (2006). Animal models of type 2 diabetes: clinical presentation and pathophysiological relevance to the human condition. ILAR J. 47, 186–198. doi: 10.1093/ilar.47.3.186
Chakravarthy, M. V., Lodhi, I. J., Yin, L., Malapaka, R. R., Xu, H. E., Turk, J., et al. (2009). Identification of a physiologically relevant endogenous ligand for PPARα in liver. Cell 138, 476–488. doi: 10.1016/j.cell.2009.05.036
Chodavarapu, H., Grobe, N., Somineni, H. K., Salem, E. S., Madhu, M., and Elased, K. M. (2013). Rosiglitazone treatment of type 2 diabetic db/db mice attenuates urinary albumin and angiotensin converting enzyme 2 excretion. PLoS ONE 8:e62833. doi: 10.1371/journal.pone.0062833
Clermont, A. C., Cahill, M., Salti, H., Rook, S. L., Rask-Madsen, C., Goddard, L., et al. (2006). Hepatocyte growth factor induces retinal vascular permeability via MAP-Kinase and PI-3 Kinase without altering retinal hemodynamics. Investig. Opthalmol. Vis. Sci. 47, 2701–2708. doi: 10.1167/iovs.05-0071
Cole, L. K., Vance, J. E., and Vance, D. E. (2012). Phosphatidylcholine biosynthesis and lipoprotein metabolism. Biochim. Biophys. Acta 1821, 754–761. doi: 10.1016/j.bbalip.2011.09.009
Esser, N., Legrand-Poels, S., Piette, J., Scheen, A. J., and Paquot, N. (2014). Inflammation as a link between obesity, metabolic syndrome and type 2 diabetes. Diabetes Res. Clin. Pract. 105, 141–150. doi: 10.1016/j.diabres.2014.04.006
Fauland, A., Köfeler, H., Trötzmüller, M., Knopf, A., Hartler, J., Eberl, A., et al. (2011). A comprehensive method for lipid profiling by liquid chromatography-ion cyclotron resonance mass spectrometry. J. Lipid Res. 52, 2314–2322. doi: 10.1194/jlr.D016550
Floegel, A., Stefan, N., Yu, Z., Mühlenbruch, K., Drogan, D., Joost, H. G., et al. (2013). Identification of serum metabolites associated with risk of type 2 diabetes using a targeted metabolomic approach. Diabetes 62, 639–648. doi: 10.2337/db12-0495
Frühbeck, G., Méndez-Giménez, L., Fernández-Formoso, J. A., Fernández, S., and Rodríguez, A. (2014). Regulation of adipocyte lipolysis. Nutr. Res. Rev. 27, 63–93. doi: 10.1017/S095442241400002X
Fujita, H., Fujishima, H., Koshimura, J., Hosoba, M., Yoshioka, N., Shimotomai, T., et al. (2005). Effects of antidiabetic treatment with metformin and insulin on serum and adipose tissue adiponectin levels in db/db mice. Endocr. J. 52, 427–433. doi: 10.1507/endocrj.52.427
Geerling, J. J., Boon, M. R., Van Der Zon, G. C., Van Den Berg, S. A., Van Den Hoek, A. M., Lombès, M., et al. (2014). Metformin lowers plasma triglycerides by promoting VLDL-triglyceride clearance by brown adipose tissue in mice. Diabetes 63, 880–891. doi: 10.2337/db13-0194
Gerstein, H. C., Miller, M. E., Byington, R. P., Goff, D. C., Bigger, J. T., Buse, J. B., et al. (2008). Effects of intensive glucose lowering in type 2 diabetes. N. Engl. J. Med. 358, 2545–2559. doi: 10.1056/NEJMoa0802743
Gibellini, F., and Smith, T. K. (2010). The Kennedy pathway-De novo synthesis of phosphatidylethanolamine and phosphatidylcholine. IUBMB Life 62, 414–428. doi: 10.1002/iub.337
Huang, Y. H., Schäfer-Elinder, L., Wu, R., Claesson, H. E., and Frostegård, J. (1999). Lysophosphatidylcholine (LPC) induces proinflammatory cytokines by a platelet-activating factor (PAF) receptor-dependent mechanism. Clin. Exp. Immunol. 116, 326–331. doi: 10.1046/j.1365-2249.1999.00871.x
Hundal, R. S., Krssak, M., Dufour, S., Laurent, D., Lebon, V., Chandramouli, V., et al. (2000). Mechanism by which metformin reduces glucose production in type 2 diabetes. Diabetes 49, 2063–2069. doi: 10.2337/diabetes.49.12.2063
Kaddurah-Daouk, R., and Weinshilboum, R. (2015). Metabolomic signatures for drug response phenotypes: pharmacometabolomics enables precision medicine. Clin. Pharmacol. Ther. 98, 71–75. doi: 10.1002/cpt.134
Kaddurah-Daouk, R., and Weinshilboum, R. M. (2014). Pharmacometabolomics: implications for clinical pharmacology and systems pharmacology. Clin. Pharmacol. Ther. 95, 154–167. doi: 10.1038/clpt.2013.217
Klingler, C., Zhao, X., Adhikary, T., Li, J., Xu, G., Häring, H. U., et al. (2016). Lysophosphatidylcholines activate PPARδ and protect human skeletal muscle cells from lipotoxicity. Biochim. Biophys. Acta 1861, 1980–1992. doi: 10.1016/j.bbalip.2016.09.020
Konya, H. (2014). Hepatocyte growth factor, a biomarker of macroangiopathy in diabetes mellitus. World J. Diabetes 5:678. doi: 10.4239/wjd.v5.i5.678
Kwon, E. Y., Jung, U. J., Park, T., Yun, J. W., and Choi, M. S. (2015). Luteolin attenuates hepatic steatosis and insulin resistance through the interplay between the liver and adipose tissue in mice with diet-induced obesity. Diabetes 64, 1658–1669. doi: 10.2337/db14-0631
Lamaziere, A., and Wolf, C. (2010). Phosphatidylcholine and PPARα: A relevant connection in liver disease? Gastroentérol. Clin. Biol. 34, 250–251. doi: 10.1016/j.gcb.2010.02.005
Lehmann, R., Zhao, X., Weigert, C., Simon, P., Fehrenbach, E., Fritsche, J., et al. (2010). Medium chain acylcarnitines dominate the metabolite pattern in humans under moderate intensity exercise and support lipid oxidation. PLoS ONE 5:e11519. doi: 10.1371/journal.pone.0011519
Li, G., Zhou, F., Chen, Y., Zhang, W., and Wang, N. (2017). Kukoamine A attenuates insulin resistance and fatty liver through downregulation of Srebp-1c. Biomed. Pharmacother. 89, 536–543. doi: 10.1016/j.biopha.2017.02.024
Li, W. L., Zheng, H. C., Bukuru, J., and De Kimpe, N. (2004). Natural medicines used in the traditional Chinese medical system for therapy of diabetes mellitus. J. Ethnopharmacol. 92, 1–21. doi: 10.1016/j.jep.2003.12.031
Li, Y.-Y., Di, R., Baibado, J. T., Cheng, Y.-S., Huang, Y.-Q., Sun, H., et al. (2014). Identification of kukoamines as the novel markers for quality assessment of Lycii Cortex. Food Res. Int. 55, 373–380. doi: 10.1016/j.foodres.2013.11.008
Li, Y.-Y., Hu, S., Huang, Y.-Q., Han, Y., and Cheung, H.-Y. (2015). Preventing H2O2-induced toxicity in primary cerebellar granule neurons via activating the PI3-K/Akt/GSK3β pathway by kukoamine from Lycii Cortex. J. Funct. Foods 17, 709–721. doi: 10.1016/j.jff.2015.06.029
Liu, S., Brown, J. D., Stanya, K. J., Homan, E., Leidl, M., Inouye, K., et al. (2013). A diurnal serum lipid integrates hepatic lipogenesis and peripheral fatty acid use. Nature 502, 550–554. doi: 10.1038/nature12710
Liu, X., Zheng, X., Wang, N., Cao, H., Lu, Y., Long, Y., et al. (2011). Kukoamine B, a novel dual inhibitor of LPS and CpG DNA, is a potential candidate for sepsis treatment. Br. J. Pharmacol. 162, 1274–1290. doi: 10.1111/j.1476-5381.2010.01114.x
McArdle, M. A., Finucane, O. M., Connaughton, R. M., Mcmorrow, A. M., and Roche, H. M. (2013). Mechanisms of obesity-induced inflammation and insulin resistance: insights into the emerging role of nutritional strategies. Front. Endocrinol. 4:52. doi: 10.3389/fendo.2013.00052
Mitamura, Y., Harada, C., and Harada, T. (2005). Role of Cytokines and Trophic Factors in the Pathogenesis of Diabetic Retinopathy. Curr. Diabetes Rev. 1, 73–81. doi: 10.2174/1573399052952596
Muoio, D. M. (2014). Metabolic inflexibility: when mitochondrial indecision leads to metabolic gridlock. Cell 159, 1253–1262. doi: 10.1016/j.cell.2014.11.034
Newgard, C. B. (2017). Metabolomics and metabolic diseases: where do we stand? Cell Metab. 25, 43–56. doi: 10.1016/j.cmet.2016.09.018
Nicholson, J. K., Connelly, J., Lindon, J. C., and Holmes, E. (2002). Metabonomics: a platform for studying drug toxicity and gene function. Nat. Rev. Drug Discov. 1, 153–161. doi: 10.1038/nrd728
Oh, D. Y., and Olefsky, J. M. (2016). G protein-coupled receptors as targets for anti-diabetic therapeutics. Nat. Rev. Drug Discov. 15, 161–172. doi: 10.1038/nrd.2015.4
Ota, A., and Ulrih, N. P. (2017). An overview of herbal products and secondary metabolites used for management of type two diabetes. Front. Pharmacol. 8:436. doi: 10.3389/fphar.2017.00436
Potterat, O. (2009). Goji (Lycium barbarum and L. chinense): phytochemistry, pharmacology and safety in the perspective of traditional uses and recent popularity. Planta Med. 76, 7–19. doi: 10.1055/s-0029-1186218
Poulsen, M. M., Vestergaard, P. F., Clasen, B. F., Radko, Y., Christensen, L. P., Stødkilde-Jørgensen, H., et al. (2013). High-dose resveratrol supplementation in obese men: an investigator-initiated, randomized, placebo-controlled clinical trial of substrate metabolism, insulin sensitivity, and body composition. Diabetes 62, 1186–1195. doi: 10.2337/db12-0975
Ramful, D., Tarnus, E., Rondeau, P., Robert Da Silva, C., Bahorun, T., and Bourdon, E. (2010). Citrus fruit extracts reduce advanced glycation end products (AGEs)- and H2O2-induced oxidative stress in human adipocytes. J. Agric. Food Chem. 58, 11119–11129. doi: 10.1021/jf102762s
Schmitz, G., and Ruebsaamen, K. (2010). Metabolism and atherogenic disease association of lysophosphatidylcholine. Atherosclerosis 208, 10–18. doi: 10.1016/j.atherosclerosis.2009.05.029
Schooneman, M. G., Vaz, F. M., Houten, S. M., and Soeters, M. R. (2012). Acylcarnitines: reflecting or inflicting insulin resistance? Diabetes 62, 1–8. doi: 10.2337/db12-0466
Speakman, J. R. (2013). Measuring energy metabolism in the mouse – theoretical, practical, and analytical considerations. Front. Physiol. 4:34. doi: 10.3389/fphys.2013.00034
Stewart, D., Dhungana, S., Clark, R., Pathmasiri, W., Mcritchie, S., and Sumner, S. (2015). “Omics technologies used in systems biology,” in Systems Biology in Toxicology and Environmental Health, ed R. C. Fry (London: Elsevier) 57–83. doi: 10.1016/B978-0-12-801564-3.00004-3
Stewart, D. A., Winnike, J. H., Mcritchie, S. L., Clark, R. F., Pathmasiri, W. W., and Sumner, S. J. (2016). Metabolomics analysis of hormone-responsive and triple-negative breast cancer cell responses to paclitaxel identify key metabolic differences. J. Proteome Res. 15, 3225–3240. doi: 10.1021/acs.jproteome.6b00430
Su, G., Chen, G., An, X., Wang, H., and Pei, Y. H. (2017). Metabolic profiling analysis of the alleviation effect of treatment with baicalin on cinnabar induced toxicity in rats urine and serum. Front. Pharmacol. 8:271. doi: 10.3389/fphar.2017.00271
Su, K., Zhu, F., Guo, L., Zhu, Y., Li, W., and Xiong, X. (2013). Retrospective study on Professor Zhongying Zhou's experience in Traditional Chinese Medicine treatment on diabetic nephropathy. J. Tradit. Chin. Med. 33, 262–267. doi: 10.1016/S0254-6272(13)60137-5
Takashima, M., Ogawa, W., Hayashi, K., Inoue, H., Kinoshita, S., Okamoto, Y., et al. (2010). Role of KLF15 in regulation of hepatic gluconeogenesis and metformin action. Diabetes 59, 1608–1615. doi: 10.2337/db09-1679
Thulé, P. M., and Umpierrez, G. (2014). Sulfonylureas: a new look at old therapy. Curr. Diab. Rep. 14:473. doi: 10.1007/s11892-014-0473-5
Viollet, B., Guigas, B., Sanz Garcia, N., Leclerc, J., Foretz, M., and Andreelli, F. (2012). Cellular and molecular mechanisms of metformin: an overview. Clin. Sci. 122, 253–270. doi: 10.1042/CS20110386
Watkins, S. M. (2002). Lipid metabolome-wide effects of the PPARgamma agonist rosiglitazone. J. Lipid Res. 43, 1809–1817. doi: 10.1194/jlr.M200169-JLR200
Weidner, C., De Groot, J. C., Prasad, A., Freiwald, A., Quedenau, C., Kliem, M., et al. (2012). Amorfrutins are potent antidiabetic dietary natural products. Proc. Natl. Acad. Sci. U.S.A. 109, 7257–7262. doi: 10.1073/pnas.1116971109
Xie, G., Zhao, A., Zhao, L., Chen, T., Chen, H., Qi, X., et al. (2012). Metabolic fate of tea polyphenols in humans. J. Proteome Res. 11, 3449–3457. doi: 10.1021/pr300318m
Yea, K., Kim, J., Yoon, J. H., Kwon, T., Kim, J. H., Lee, B. D., et al. (2009). Lysophosphatidylcholine activates adipocyte glucose uptake and lowers blood glucose levels in murine models of diabetes. J. Biol. Chem. 284, 33833–33840. doi: 10.1074/jbc.M109.024869
Yeh, G. Y., Eisenberg, D. M., Kaptchuk, T. J., and Phillips, R. S. (2003). Systematic review of herbs and dietary supplements for glycemic control in diabetes. Diabetes Care 26, 1277–1294. doi: 10.2337/diacare.26.4.1277
Yin, J., Zhang, H., and Ye, J. (2008). Traditional chinese medicine in treatment of metabolic syndrome. Endocr. Metab. Immune Disord. Drug Targets 8, 99–111. doi: 10.2174/187153008784534330
Yue, L., Christman, J. W., and Mazzone, T. (2008). Tumor necrosis factor-α-mediated suppression of adipocyte apolipoprotein E gene transcription: primary role for the Nuclear Factor (NF)-κB pathway and NFκB p50. Endocrinology 149, 4051–4058. doi: 10.1210/en.2008-0340
Zagotta, I., Dimova, E. Y., Debatin, K. M., Wabitsch, M., Kietzmann, T., and Fischer-Posovszky, P. (2015). Obesity and inflammation: reduced cytokine expression due to resveratrol in a human in vitro model of inflamed adipose tissue. Front. Pharmacol. 6:79. doi: 10.3389/fphar.2015.00079
Zhang, J., Light, A. R., Hoppel, C. L., Campbell, C., Chandler, C. J., Burnett, D. J., et al. (2017). Acylcarnitines as markers of exercise-associated fuel partitioning, xenometabolism, and potential signals to muscle afferent neurons. Exp. Physiol. 102, 48–69. doi: 10.1113/EP086019
Zhang, L., Tu, Z.-C., Yuan, T., Wang, H., Xie, X., and Fu, Z.-F. (2016). Antioxidants and α-glucosidase inhibitors from Ipomoea batatas leaves identified by bioassay-guided approach and structure-activity relationships. Food Chem. 208, 61–67. doi: 10.1016/j.foodchem.2016.03.079
Keywords: kukoamine B, type 2 diabetes mellitus, db/db mouse, metabolomics, lipidomics, cytokine array
Citation: Li Y-Y, Stewart DA, Ye X-M, Yin L-H, Pathmasiri WW, McRitchie SL, Fennell TR, Cheung H-Y and Sumner SJ (2019) A Metabolomics Approach to Investigate Kukoamine B—A Potent Natural Product With Anti-diabetic Properties. Front. Pharmacol. 9:1575. doi: 10.3389/fphar.2018.01575
Received: 07 February 2018; Accepted: 31 December 2018;
Published: 22 January 2019.
Edited by:
Adolfo Andrade-Cetto, National Autonomous University of Mexico, MexicoReviewed by:
Lucyna Alicja Wozniak, Medical University of Lodz, PolandWentzel Christoffel Gelderblom, Cape Peninsula University of Technology, South Africa
Copyright © 2019 Li, Stewart, Ye, Yin, Pathmasiri, McRitchie, Fennell, Cheung and Sumner. This is an open-access article distributed under the terms of the Creative Commons Attribution License (CC BY). The use, distribution or reproduction in other forums is permitted, provided the original author(s) and the copyright owner(s) are credited and that the original publication in this journal is cited, in accordance with accepted academic practice. No use, distribution or reproduction is permitted which does not comply with these terms.
*Correspondence: Hon-Yeung Cheung, Y2hldW5nLmhvbnlldW5nQGNpdHl1LmVkdS5oaw==
Susan J. Sumner, c3VzYW5fc3VtbmVyQHVuYy5lZHU=