 Hidetaka Tamune
 Jumpei Ukita
 Yu Hamamoto1,2
- 1Department of Neuropsychiatry, Tokyo Metropolitan Tama Medical Center, Tokyo, Japan
- 2Department of Neuropsychiatry, Graduate School of Medicine, The University of Tokyo, Tokyo, Japan
- 3Mental Health Research Course, Faculty of Medicine, The University of Tokyo, Tokyo, Japan
- 4Department of Physiology, Graduate School of Medicine, The University of Tokyo, Tokyo, Japan
Background: Vitamin B deficiency is common worldwide and may lead to psychiatric symptoms; however, vitamin B deficiency epidemiology in patients with intense psychiatric episode has rarely been examined. Moreover, vitamin deficiency testing is costly and time-consuming, which has hampered effectively ruling out vitamin deficiency-induced intense psychiatric symptoms. In this study, we aimed to clarify the epidemiology of these deficiencies and efficiently predict them using machine-learning models from patient characteristics and routine blood test results that can be obtained within one hour.
Methods: We reviewed 497 consecutive patients, who are deemed to be at imminent risk of seriously harming themselves or others, over a period of 2 years in a single psychiatric tertiary-care center. Machine-learning models (k-nearest neighbors, logistic regression, support vector machine, and random forest) were trained to predict each deficiency from age, sex, and 29 routine blood test results gathered in the period from September 2015 to December 2016. The models were validated using a dataset collected from January 2017 through August 2017.
Results: We found that 112 (22.5%), 80 (16.1%), and 72 (14.5%) patients had vitamin B1, vitamin B12, and folate (vitamin B9) deficiency, respectively. Further, the machine-learning models were well generalized to predict deficiency in the future unseen data, especially using random forest; areas under the receiver operating characteristic curves for the validation dataset (i.e., the dataset not used for training the models) were 0.716, 0.599, and 0.796, respectively. The Gini importance of these vitamins provided further evidence of a relationship between these vitamins and the complete blood count, while also indicating a hitherto rarely considered, potential association between these vitamins and alkaline phosphatase (ALP) or thyroid stimulating hormone (TSH).
Discussion: This study demonstrates that machine-learning can efficiently predict some vitamin deficiencies in patients with active psychiatric symptoms, based on the largest cohort to date with intense psychiatric episode. The prediction method may expedite risk stratification and clinical decision-making regarding whether replacement therapy should be prescribed. Further research includes validating its external generalizability in other clinical situations and clarify whether interventions based on this method could improve patient care and cost-effectiveness.
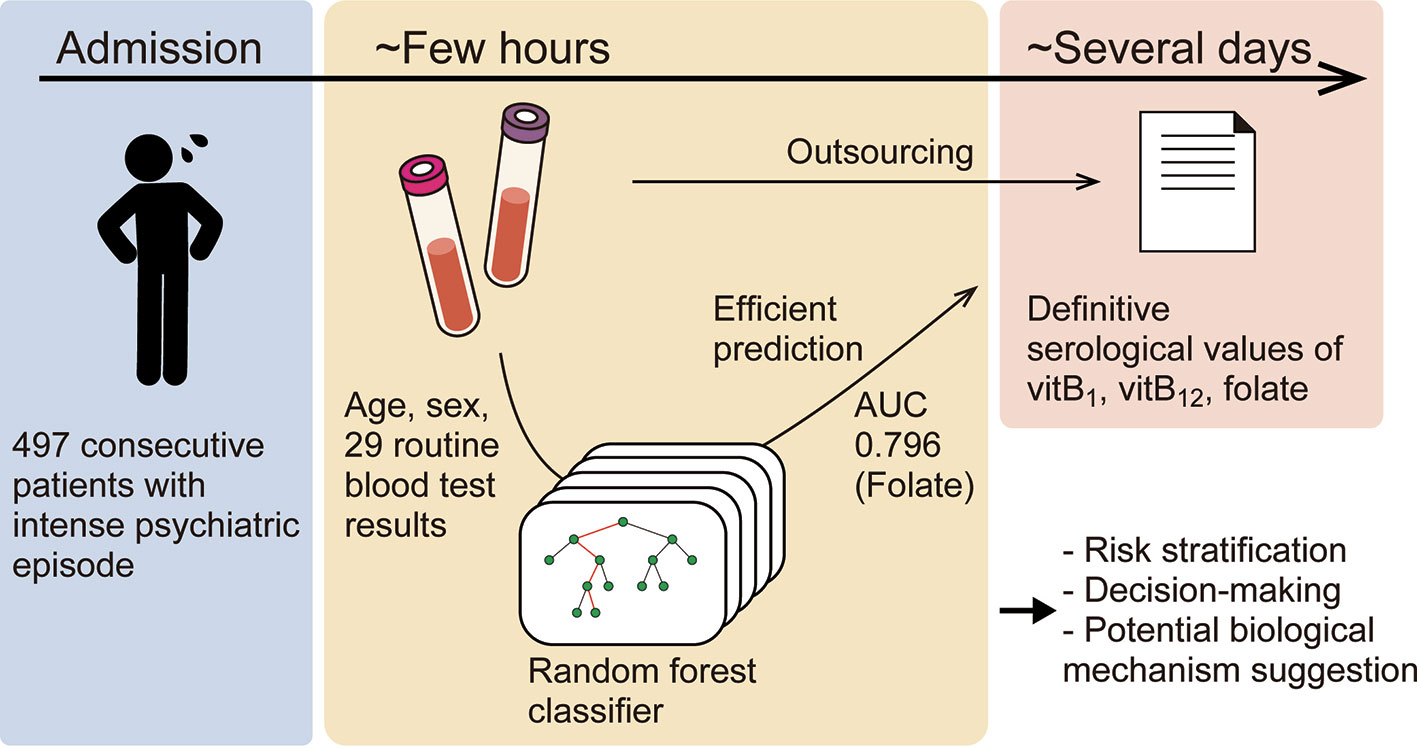
Graphical Abstract
Introduction
Vitamin B deficiency is common worldwide and may lead to psychiatric symptoms (1–4). For example, meta-analyses have shown that patients with schizophrenia or first-episode psychosis have lower folate (vitamin B9) levels than their healthy counterparts (4, 5). Moreover, vitamin therapy can effectively alleviate symptoms in a subgroup of patients with schizophrenia (3, 6–8). However, the epidemiology of vitamin B deficiency in patients with active mental symptoms requiring immediate hospitalization has rarely been examined.
In a psychiatric emergency, psychiatrists should promptly distinguish treatable patients with altered mental status due to a physical disease from patients with an authentic mental disorder (International Statistical Classification of Diseases and Related Health Problems-10, ICD-10 code: F2-9). However, vitamin deficiency testing is very costly (around 60 dollars for each measurement of vitamin B1 (vitB1), vitamin B12 (vitB12), or folate in the U.S.; 15–25 dollars for each test in Japan) and usually requires at least two days. Therefore, an efficient, cost-effective method of predicting vitamin B deficiency is needed.
Although several studies have applied machine-learning to the prediction of diagnosis or treatment outcomes (9–11), no study using machine-learning has focused on vitamin B deficiencies. We herein explore whether vitB1, vitB12, and folate deficiencies can be predicted using a machine-learning classifier from patient characteristics and routine blood test results obtained within one hour based on a large cohort of patients requiring urgent psychiatric hospitalization.
Methods
Medical Chart Review
We reviewed consecutive patients admitted to the Department of Neuropsychiatry at Tokyo Metropolitan Tama Medical Center, one of the biggest psychiatric tertiary-care centers in Japan, between September 2015 and August 2017 under the urgent involuntary hospitalization law, which requires the immediate psychiatric hospitalization of patients at imminent risk of seriously harming themselves or others. The necessity of hospitalization was judged by designated mental health specialists. There were no exclusion criteria. The patient characteristics, ICD-10 codes, and laboratory data were gathered retrospectively.
Since the reference ranges for vitB1, vitB12, and folate are 70–180 nmol/L (30–77 ng/mL), 180–914 ng/L, and >4.0 μg/L, respectively (12), a deficiency of the nutrients was defined as <30 ng/mL, <180 ng/L, and <4.0 μg/L, respectively, unless otherwise stated. The odds ratios of each deficiency in each ICD-10 code were calculated assuming binomial distribution.
Classifiers and Statistics
We compared four types of standard machine-learning classifiers: k-nearest neighbors, logistic regression, support vector machine, and random forest. Each type of classifier was trained to predict the deficiency of each substance from age, sex, and 29 routine blood variables (described with values in the Results section). For developing the models, any missing values were replaced using the mean. The classifiers were trained using the dataset populated in the period from September 2015 to December 2016 (the “Training set”). First, except for logistic regression, we optimized the hyperparameters of the classifier by selecting the best combination of hyperparameters that maximized the "5-fold cross validation" accuracy, among many combinations within appropriate ranges. The cross-validation accuracy was computed as follows: in one session, the classifiers were trained using 80% of the training set and evaluated on the withheld 20% of the training set. This session was performed five times so that every data would be withheld once. The accuracies were finally averaged across sessions to yield the cross-validation accuracy. By incorporating this process, the classifiers were generalized to unseen data (Graphical method is shown in Figure 1).
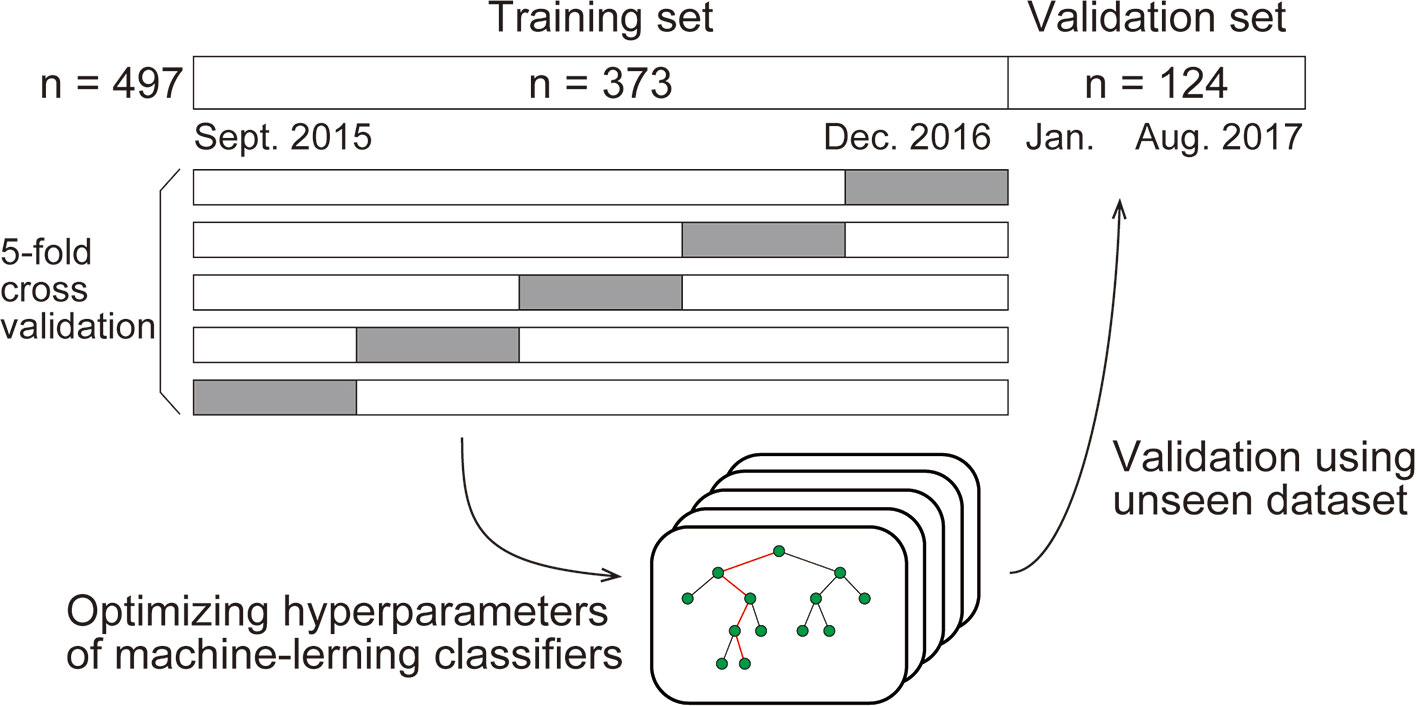
Figure 1 Graphical illustration of method of machine-learning.
Using the optimized hyperparameters, the classifiers were then validated using data collected from January 2017 through August 2017 (the “Validation set”). We report the classification performance on the validation set in the Results section unless otherwise stated.
We quantified the sensitivity, specificity, and accuracy (defined as the average of the sensitivity and the specificity on the optimal operating point) using receiver operating characteristic curves (ROCs). We also quantified the 95% confidence interval of the area under the ROCs (AUCs) and accuracy using 1000-times bootstrapping.
When investigating the Gini importance and the partial dependency (13), we retrained the classifiers using all datasets. All data analyses were performed using Python (2.7.10) with the Scikit-learn package (0.19.0) and R (3.4.2) with the edarf package (1.1.1) and pROC package (1.15.3).
Robustness Verification
We verified the robustness of the prediction performances by three independent approaches. First, we compared the following two prediction performances: random forest classifiers trained and validated using the dataset from the F2 population, and random forest classifiers trained and validated using the dataset from the non-F2 population.
Second, we compared the prediction performances of several random forest classifiers trained and validated using the dataset where different cut-off values were used to define the vitamin deficiency. We chose other two cut-off values for each vitamin based on previous reports (14–16), as well as pre-defined cut-off values (see also Medical Chart Review section).
Third, we trained and validated other random forest classifiers where the dataset was split in a different way. Here, the training set consisted of data between 31 January 2016 and August 2017 and the validation set consisted of data between September 2015 and 31 January 2016, so that the sample sizes of the training and validation sets were equal to those in the original split.
Subsampling Analysis
We also examined the relationship between the dataset size and the generalization performance (17). In this analysis, we trained the random forest classifiers using X% of the training set (X = 30, 35, 40, …, 95, and 100), and validated them using the validation set. The hyperparameters were identical to those used in the previous section. To remove sampling bias, this procedure was repeated 100 times for each value of X, where the training dataset was sampled randomly for each repetition. This results in obtaining 100 AUC scores for each X and for each vitamin. We plotted the AUC scores (averaged across the 100 repetition) versus X for each vitamin, then the curve was fit with the following saturating function using Levenberg-Marquardt algorithm implemented as “curve_fit” function in the Scipy package (0.19.0).
where Y is the AUC score, and a and b are the parameters to fit. Note that Y →a+0.5 as X →∞ and Y = 0.5 as X = 0.
Ethical Considerations
Informed consent was obtained from participants using an optout form on the website. The study protocol was approved by the Research Ethics Committee, Tokyo Metropolitan Tama Medical Center (Approval number: 28-8). The study complied with the Declaration of Helsinki and the STROBE statement.
Results
Eligible Patients
During the 2-year study period, 497 consecutive patients (496 were Asian) were enrolled. The mean age (standard deviation, SD) was 42.3 (±15.4) years, and 228 patients (45.9%) were women. F2 (Schizophrenia, schizotypal, delusional, and other non-mood psychotic disorders) was diagnosed in over 60% of the patients. The ICD-10 codes of the patients and the number of deficiencies at several cut-off values for vitB1, vitB12, and folate are shown in Table 1. According to the predefined cut-off values (12), 112 (22.5%), 80 (16.1%), and 72 (14.5%) patients exhibited a deficiency of vitB1 (<30 ng/mL), vitB12 (<180 ng/L), and folate (<4.0 μg/L), respectively. Vitamin B deficiencies in sub-groups are shown in Table 2. A summary of the full dataset is shown in Table 3. Detailed information (sub-datasets) is shown in Supplementary Tables 1–3 online. Histograms of vitB1, vitB12, and folate values are shown in Figures 2A–C.
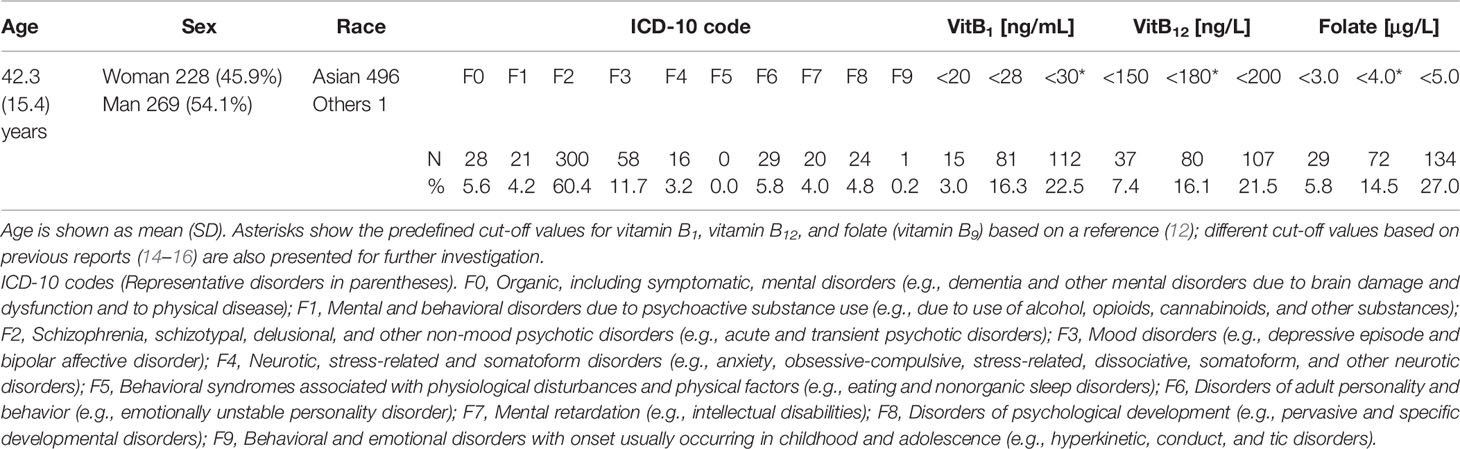
Table 1 Patient distribution data (n = 497).
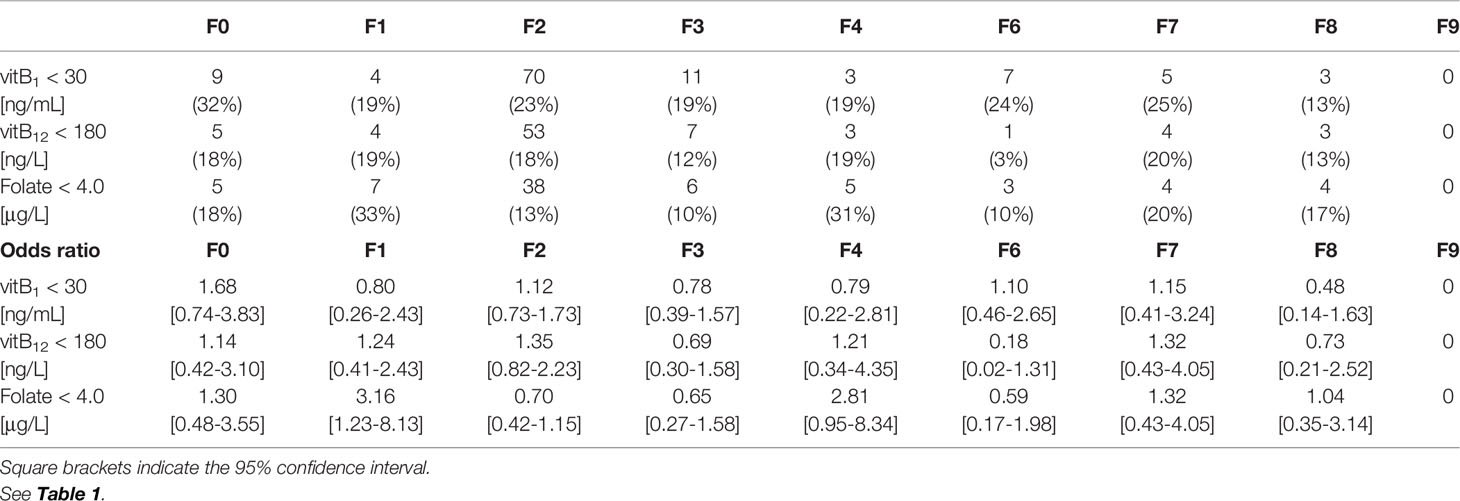
Table 2 Vitamin B deficiencies in sub-groups.
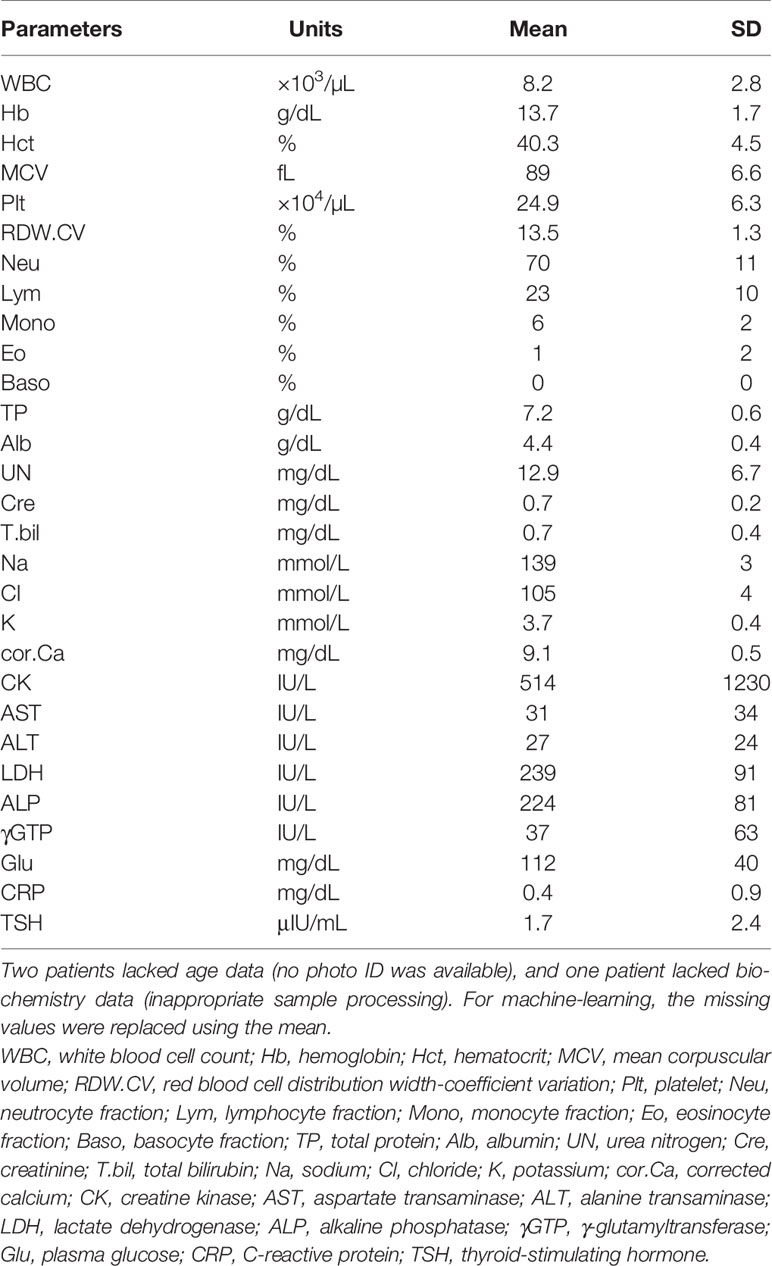
Table 3 Summary of full dataset of 29 parameters for machine-learning.
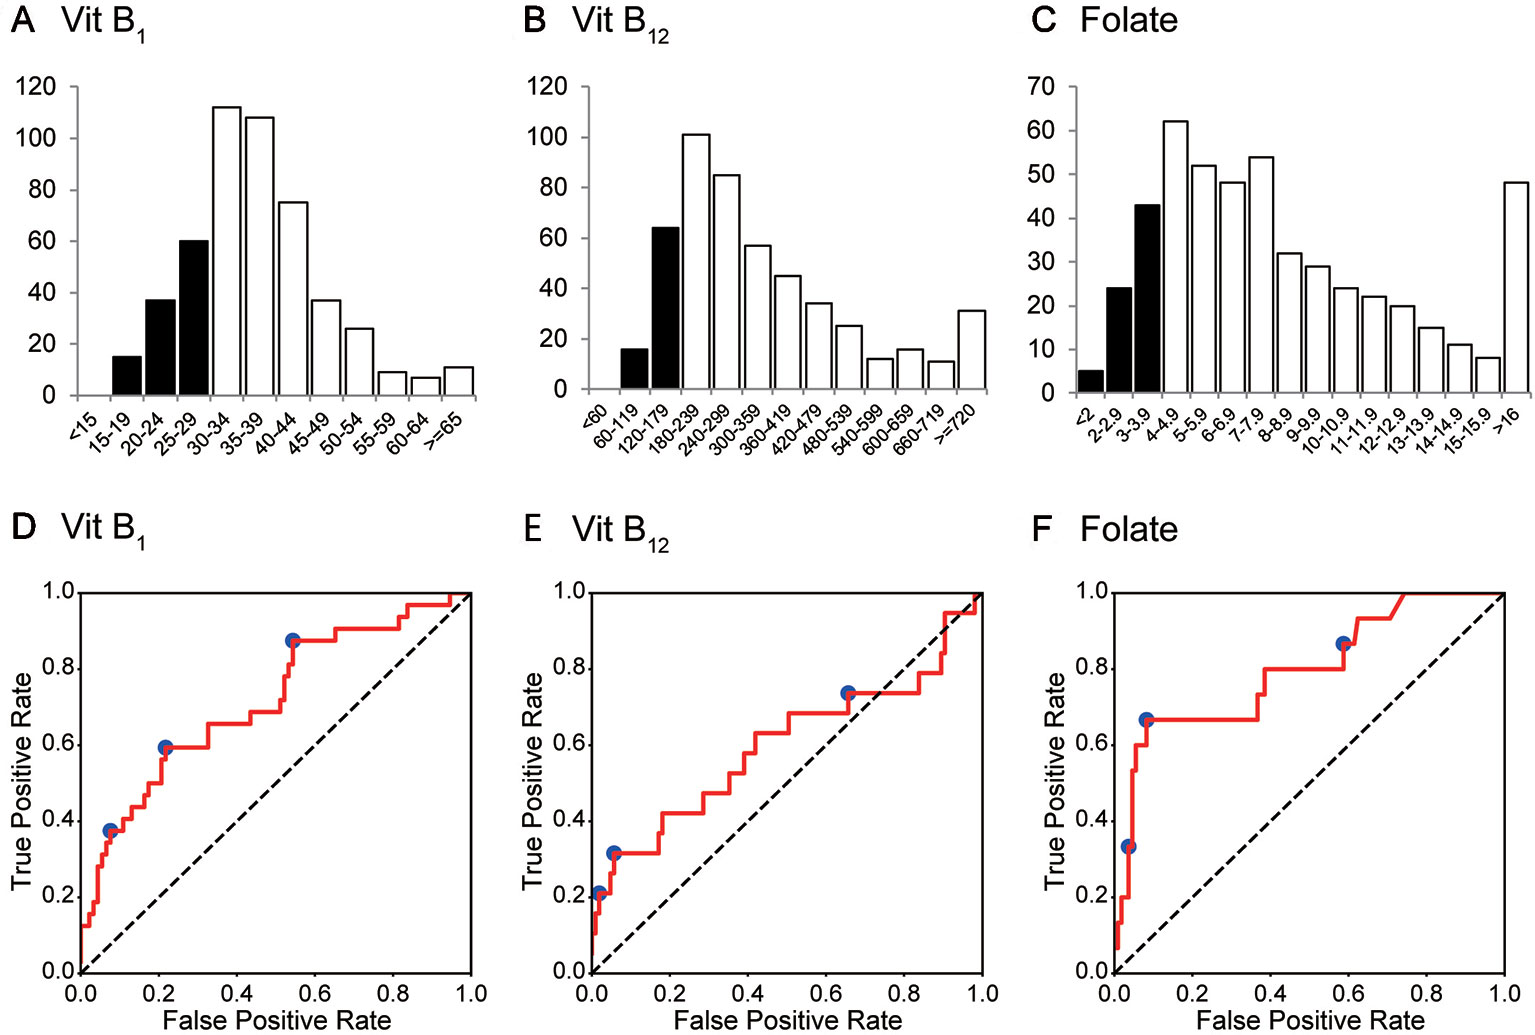
Figure 2 Histogram and ROC curves of each vitamin B value. (A–C) The histograms for vitamin B1, vitamin B12, and folate (vitamin B9). Their medians (1st–3rd quartile) are 35 (30–42) ng/mL, 285 (206–431) ng/L, and 7.2 (4.9–10.8) μg/L, respectively. (D–F) ROC curves for vitamin B1, vitamin B12, and folate. Operating points used in Table 4 and Supplementary Table 5 are depicted in blue. Vit B1, vitamin B1; Vit B12, vitamin B12.
Prediction via Machine-Learning Using Routine Blood Test Results
Machine-learning classifiers were trained to predict the deficiency of each substance from patient characteristics and routine blood test results. The classifiers were trained using the dataset gathered in the period from September 2015 to December 2016 (the “Training set,” n = 373), which was then validated from January 2017 through August 2017 (the “Validation set,” n = 124). By splitting the whole dataset in this way, the ratio of the training and validation sample size was 3:1, a commonly used ratio in machine-learning analyses.
AUCs for the validation set for each classifier are summarized in Table 4. Although the performance of the classifiers was similar except for the k-nearest neighbors, random forest yielded the highest AUC on average. Therefore, we focused on random forest in the following analysis.
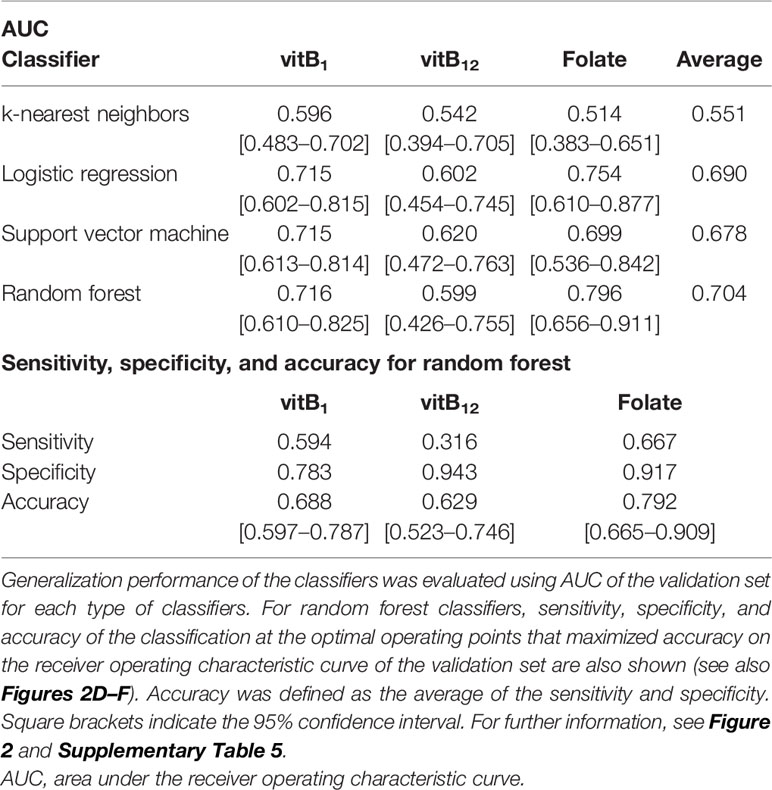
Table 4 Summary of AUC, sensitivity, specificity, and accuracy for the validation set.
The AUCs of the random forest classifiers were 0.716, 0.599, and 0.796, for vitB1, vitB12, and folate, respectively (Figures 2D–F and Table 4). With some operative points on the ROC, the sensitivity, specificity, and accuracy for the validation set were calculated (Table 4. See also Supplementary Table 4 for training set and Supplementary Table 5 for different operating points). The 95% confidence interval (CI) of the AUC and accuracy was quantified using 1000-times bootstrapping. For random forest classifiers, the 95% CI of each value did not include 0.5, except for the AUC of vitB12.
Figure 3 shows the Gini importance (A–C) and partial dependency plots (D–F) for the eight most important variables for each substance. The results provided further evidence of a relationship between the vitamin B levels and complete blood count while also indicating the hitherto rarely considered, potential association between these vitamins and alkaline phosphatase (ALP) or thyroid stimulating hormone (TSH).
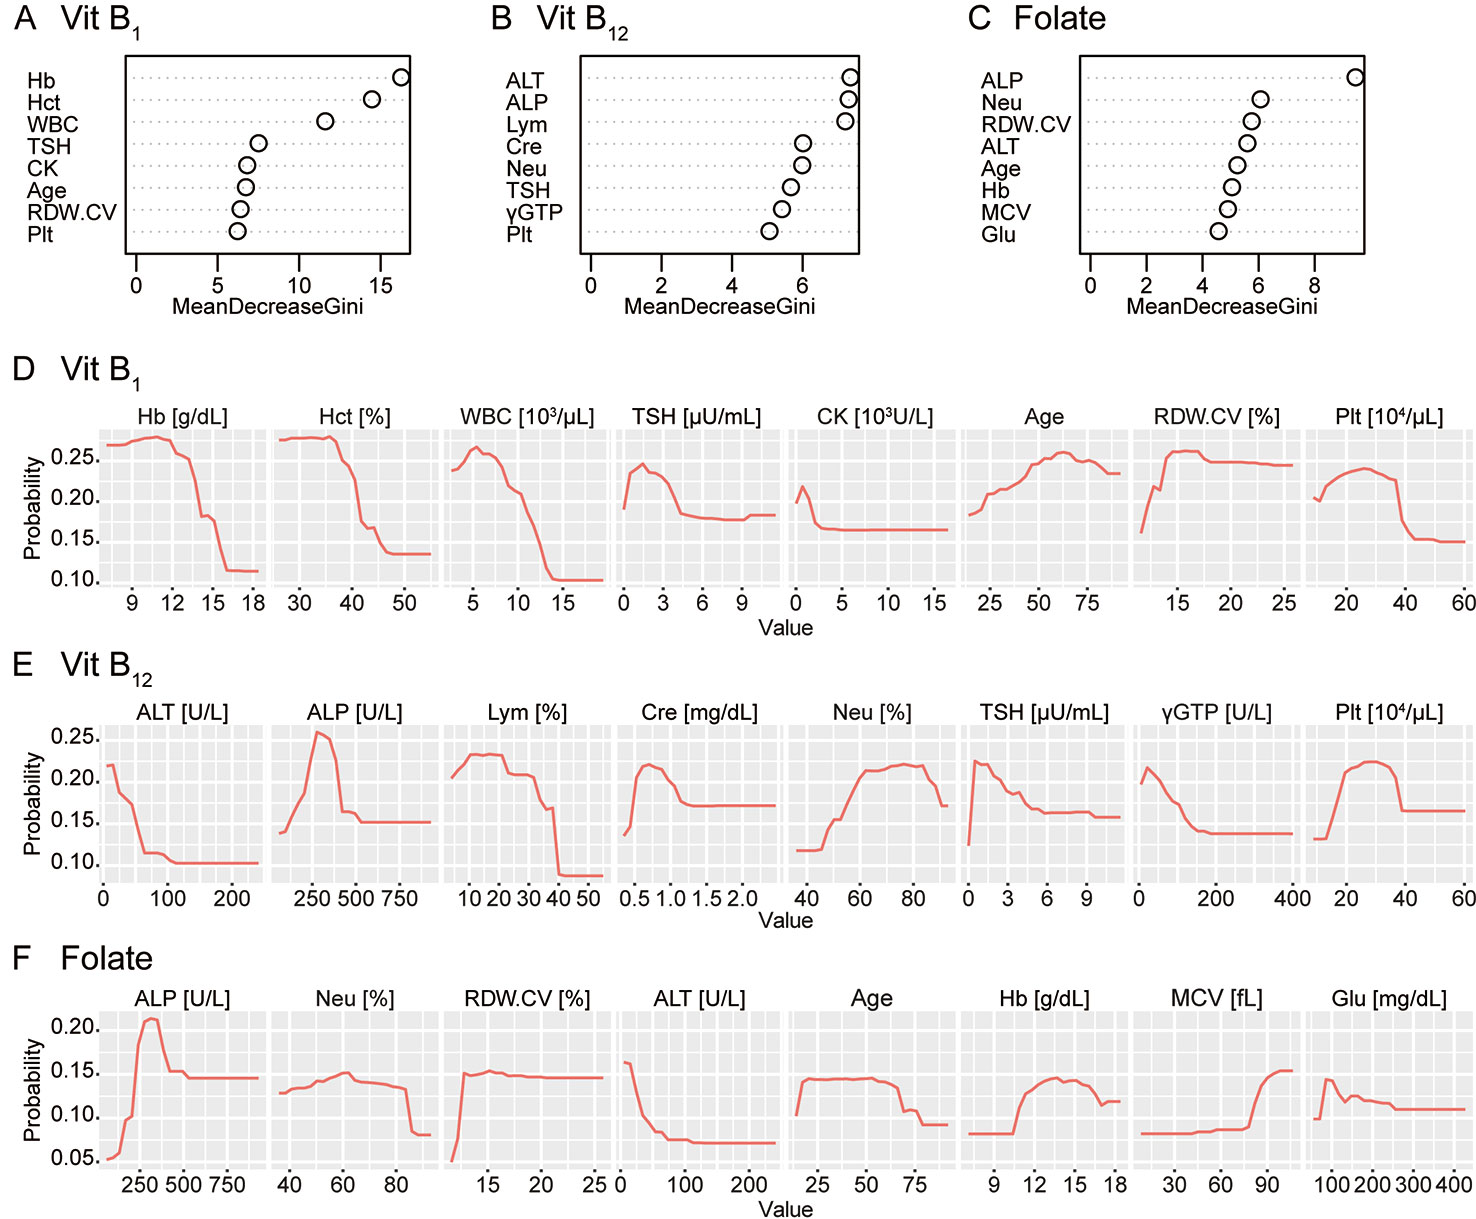
Figure 3 Gini importance and partial dependence plots of vitamin B deficiencies. The Gini importance (A–C) and partial dependency plots of the probability of deficiency (D–F) are shown for the eight most important variables for vitamin B1, vitamin B12, and folate (vitamin B9). Combined with these, this machine-learning classifier without hypothesis also provided further evidence of a relationship between vitamin B levels and the complete blood count while also indicating a potential association between these vitamins and alkaline phosphatase (ALP) or thyroid-stimulating hormone (TSH). Vit B1, vitamin B1; Vit B12, vitamin B12; Hb, hemoglobin; Hct, hematocrit; WBC, white blood cell count; CK, creatine kinase; RDW.CV, red blood cell distribution width-coefficient variation; Plt, platelet; ALT, alanine transaminase; Lym, lymphocyte fraction; Cre, creatinine; Neu, neutrocyte fraction; γGTP, γ-glutamyltransferase; MCV, mean corpuscular volume; Glu, plasma glucose.
Robustness Verification
We verified the robustness of the results by three independent means. First, we asked if the prediction performance was influenced by the ICD-10 categories. When the prediction performances were compared between the random forest classifiers trained using the dataset from the F2 population and the classifiers trained using the dataset from the other population, the AUC was not statistically different (DeLong’s test), except in the case of vitB1 (see Supplementary Table 6).
Second, we used different cut-off values to define the deficiency (14–16). Although the AUC for the validation set, shown in Supplementary Table 7, tended to be higher when strict cut-off values were used, the obtained AUCs were not statistically significant (p > 0.05, DeLong’s test with Bonferroni correction).
Third, we investigated if the prediction performance was influenced by the way the dataset was split into the training and validation set. Here, we trained and evaluated random forest classifiers using a dataset split in a reversed way (see Methods section for details). The AUCs for the validation set were 0.771, 0.621, and 0.745 for vitB1, vitB12, and folate, respectively; none were statistically different from the AUC trained using the original setting (DeLong’s test), further demonstrating the robustness of the performance.
Subsampling Analysis
To estimate the number needed to saturate the performance, we examined the relationship between the generalizability and the sample size (17). We randomly sampled X% of the training set, trained random forest classifiers using the dataset, and evaluated the generalization performance by AUCs using the validation set (X = 30, 35, 40, …, 95, and 100; see Methods for details). As shown in Figure 4, the relationships between AUC and the training size for vitB1 and vitB12 were almost saturated, whereas that for folate is not saturated. To quantitatively understand this, we fitted each curve using a saturating function formulated in equation (1) (see Methods section for details). The fitted parameters of equation (1) were as follows; for vitB1, a = 0.186 and b = 0.074; for vitB12, a = 0.099 and b = 0.156; and for folate, a = 0.291 and b = 0.123. By using these parameter values and extrapolating the curve, we then computed how many additional samples are necessary to reach almost maximum performances. To reach 99% of the maximum performance [i.e., Y = (a + 0.5) × 0.99 in equation (1)], the training dataset to be collected was 92.5%, 143%, and 341% of the training size in this study for vitB1, vitB12, and folate, respectively. These quantitative analyses revealed that collecting further similar datasets up to 1,000 patients (e.g. four years × hospitals with similar scale as Tokyo Metropolitan Tama Medical Center) may increase and reproduce the generalizability for folate, while the effect of collecting further dataset is expected to be small for vitB1 and vitB12.
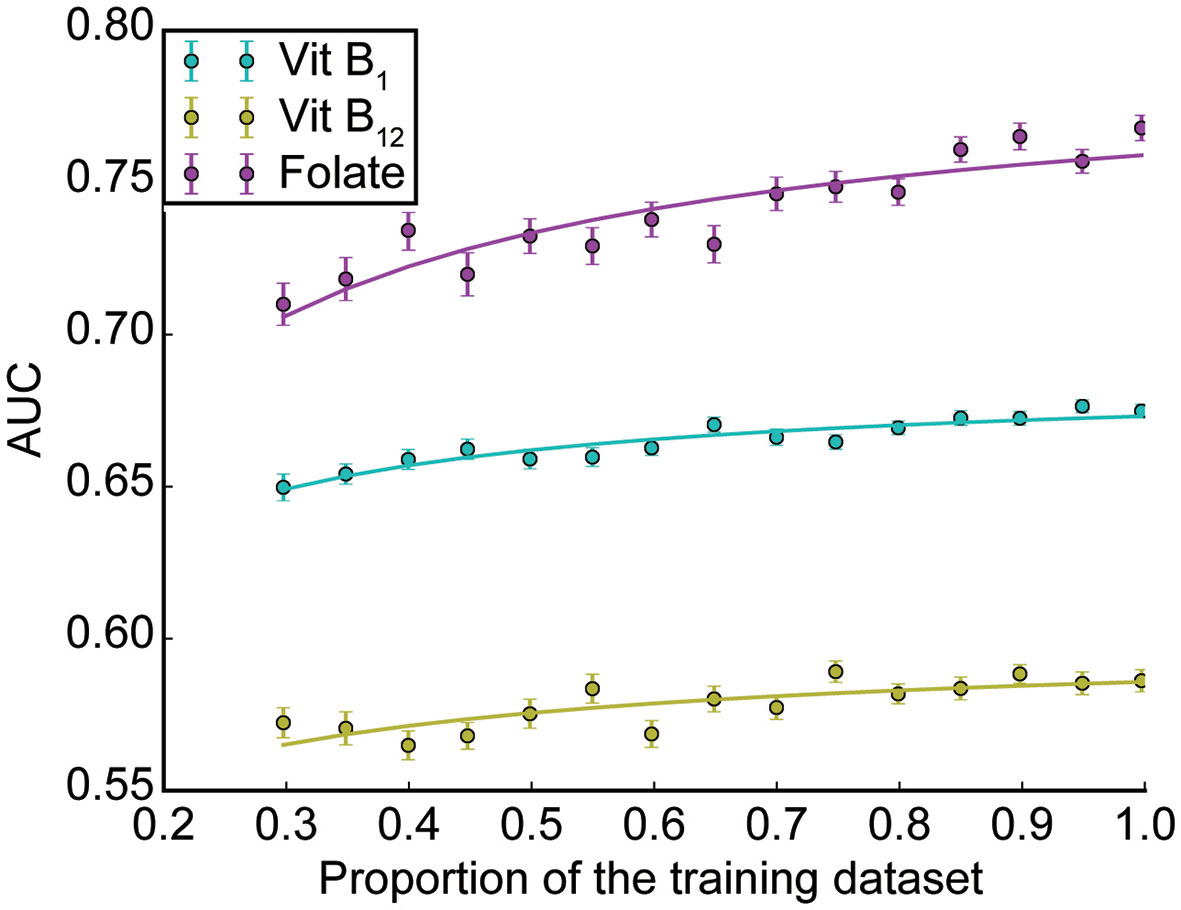
Figure 4 Subsampling analysis. The AUC performances as a function of the dataset size is shown for each vitamin (mean ± SEM across 100 repetitions; see Methods for details).
Discussion
Relevance of The Present Study
Based on the largest cohort to date of patients at imminent risk of seriously harming themselves or others, this study indicated that deficiency of certain vitamins can be predicted in an efficient manner via machine-learning using routine blood test results. The 29 routine blood variables are available at almost all hospitals/clinics and are necessary to rule out other comorbid physical problems. Given the large number of patients with vitamin B deficiencies, empirical therapy might be acceptable; however, risk stratification is preferred for personalized medicine and shared decision-making. The prediction method presented here may expedite clinical decision-making as to whether vitamins should be prescribed to a patient (Graphical Abstract).
Remarkably, the AUC of folate deficiency was 0.796. The robustness of folate prediction was also suggested by various independent methods and statistics. Folate has a potential to maintain neuronal integrity and is one of the homocysteine-reducing B-vitamins (5). Homocysteine may be linked to the etiology of schizophrenia (18), and vitamin B supplements have been reported to reduce psychiatric symptoms significantly in patients with schizophrenia (7). A recent meta-review has pointed out that the bioactivity of the supplement should be considered (e.g. methylfolate, which successfully crosses the blood-brain barrier, has been reported effective, whereas the effect of other forms of folate is equivocal) (19). As our study does not present longitudinal clinical courses, an intervention effect of folate supplementation to the cohort based on our method remains to be clarified.
Biological Mechanism Prediction
To connect with biological knowledge, we compared four models with high interpretability in this study. Using the random forest classifiers, as shown in Figure 3, we identified several items related to complete blood count as top hits. Notably, our classifier was blind to any biological knowledge, including the well-established association between anemia and vitamin B deficiency, including folate (20). The results provide further evidence of a relationship between vitamin B levels and the complete blood count and support the use of machine-learning to investigate novel, underlying biological mechanisms (21).
ALP and its metabolites indicate the vitamin B6 status (22); low vitB12 is potentially associated with low ALP (23). More generally, ALP may have a close and complicated relationship with the overall vitamin B group. Autoimmune disorders, especially thyroid disease, are commonly associated with pernicious anaemia (24), but there has been no established hypothesis regarding the causal relationships between thyroid disease and vitamin B deficiencies. The potential association between the levels of these vitamins and ALP or TSH awaits further study, both via investigations of populations and basic research (25).
Limitations
This study is subject to several limitations. First, the findings of this single-center retrospective study may have limited external generalizability, though internal generalizability was considered to the maximum extent. Second, the patients’ basic characteristics and long-term prognosis were not fully investigated due to administrative restrictions. Though there is similar involuntary treatment/admission in psychiatry worldwide, there is a gap between legislation and practice (26). Therefore, the extent to which this method can expedite clinical decision-making is unclear.
Further, we did not investigate the relationship between serological values and the need for intervention. The lack of data for vitamin B deficiency in the Japanese general population hampered the comparison between the experimental cohort and their counterparts who lacked psychiatric symptoms. Establishing appropriate reference values and an assessment method requires further investigation. Finally, we did not assess the predictive value of other nutritional impairments, including vitamin B6 and homocysteine deficiency, which were previously shown to have a close link with psychiatric symptoms (3, 5); however, our study provides fundamental data on nutritional impairment based on the largest cohort of patients with intense psychiatric episode ever assembled for this purpose and presents a potential framework for predicting nutritional impairment using machine-learning.
Conclusion
The present report is, to the best of our knowledge, the first to demonstrate that machine-learning can efficiently predict nutritional impairment. This study also provides a possible application of machine-learning to investigate novel, underlying biological mechanisms. Further research is needed to validate the external generalizability of the findings in other clinical situations and clarify whether interventions based on this method can improve patient care and cost-effectiveness.
Data Availability Statement
The source code is available on https://github.com/ukky17/vitaminPrediction. The datasets utilized in the current study are available from the corresponding author upon reasonable request.
Ethics Statement
The studies involving human participants were reviewed and approved by Research Ethics Committee, Tokyo Metropolitan Tama Medical Center. Informed consent was obtained from participants using an optout form on the website.
Author Contributions
HTam has full access to all data and takes responsibility for the integrity of the data. HTam, JU, KN, and NY conceived the study. HTam, YH, and HTan collected the data. JU performed the statistical analyses. HTam and JU drafted the first version of the manuscript. All authors critically revised the manuscript for intellectual content and approved the final version.
Conflict of Interest
JU declares a scholarship grant from Takeda Science Foundation and Masayoshi Son Foundation.
The remaining authors declare that the research was conducted in the absence of any commercial or financial relationships that could be construed as a potential conflict of interest.
Acknowledgments
We thank Mr. James Robert Valera for his assistance in editing this manuscript and all the staff for their care of the patients and their contributions to this study. This manuscript has been previously published as a preprint (27) in medRxiv (https://doi.org/10.1101/19004317).
Supplementary Material
The Supplementary Material for this article can be found online at: https://www.frontiersin.org/articles/10.3389/fpsyt.2019.01029/full#supplementary-material
References
1. Harper C. Thiamine (vitamin B1) deficiency and associated brain damage is still common throughout the world and prevention is simple and safe! Eur J Neurol (2006) 13:1078–82. doi: 10.1111/j.1468-1331.2006.01530.x
2. Reynolds E. Vitamin B12, folic acid, and the nervous system. Lancet Neurol (2006) 5:949–60. doi: 10.1016/S1474-4422(06)70598-1
3. Arai M, Yuzawa H, Nohara I, Ohnishi T, Obata N, Iwayama Y, et al. Enhanced carbonyl stress in a subpopulation of schizophrenia. Arch Gen Psychiatry (2010) 67:589–97. doi: 10.1001/archgenpsychiatry.2010.62
4. Cao B, Wang DF, Xu MY, Liu YQ, Yan LL, Wang JY, et al. Lower folate levels in schizophrenia: a meta-analysis. Psychiatry Res (2016) 245:1–7. doi: 10.1016/j.psychres.2016.03.003
5. Firth J, Carney R, Stubbs B, Teasdale SB, Vancampfort D, Ward PB, et al. Nutritional deficiencies and clinical correlates in first-episode psychosis: a systematic review and meta-analysis. Schizophr Bull (2018) 44:1275–92. doi: 10.1093/schbul/sbx162
6. Levine J, Stahl Z, Sela BA, Ruderman V, Shumaico O, Babushkin I, et al. Homocysteine-reducing strategies improve symptoms in chronic schizophrenic patients with hyperhomocysteinemia. Biol Psychiatry (2006) 60:265–9. doi: 10.1016/j.biopsych.2005.10.009
7. Firth J, Stubbs B, Sarris J, Rosenbaum S, Teasdale S, Berk M, et al. The effects of vitamin and mineral supplementation on symptoms of schizophrenia: a systematic review and meta-analysis. Psychol Med (2017) 47:1515–27. doi: 10.1017/S0033291717000022
8. Itokawa M, Miyashita M, Arai M, Dan T, Takahashi K, Tokunaga T, et al. Pyridoxamine: A novel treatment for schizophrenia with enhanced carbonyl stress. Psychiatry Clin Neurosci (2018) 72:35–44. doi: 10.1111/pcn.12613
9. Koutsouleris N, Kahn RS, Chekroud AM, Leucht S, Falkai P, Wobrock T, et al. Multisite prediction of 4-week and 52-week treatment outcomes in patients with first-episode psychosis: a machine learning approach. Lancet Psychiatry (2016) 3:935–46. doi: 10.1016/S2215-0366(16)30171-7
10. Mechelli A, Lin A, Wood S, McGorry P, Amminger P, Tognin S, et al. Using clinical information to make individualized prognostic predictions in people at ultra-high risk for psychosis. Schizophr Res (2017) 184:32–8. doi: 10.1016/j.schres.2016.11.047
11. Vieira S, Pinaya WH, Mechelli A. Using deep learning to investigate the neuroimaging correlates of psychiatric and neurological disorders: methods and applications. Neurosci Biobehav Rev (2017) 74:58–75. doi: 10.1016/j.neubiorev.2017.01.002
12. Mayo Foundation for Medical Education and Research, Rochester Test Catalog. (2018). https://www.mayomedicallaboratories.com/test-catalog/.
13. Friedman JH. Greedy function approximation: a gradient boosting machine. Ann Stat (2001) 29:1189–232. doi: 10.1214/aos/1013203451
14. Sasaki T, Yukizane T, Atsuta H, Ishikawa H, Yoshiike T, Takeuchi T, et al. A case of thiamine deficiency with psychotic symptoms: blood concentration of thiamine and response to therapy. Seishin Shinkeigaku Zasshi (2010) 112:97–110.
15. Clarke R, Refsum H, Birks J, Evans JG, Johnston C, Sherliker P, et al. Screening for vitamin B-12 and folate deficiency in older persons. Am J Clin Nutr (2003) 77:1241–7. doi: 10.1093/ajcn/77.5.1241
16. Goff DC, Bottiglieri T, Arning E, Shih V, Freudenreich O, Evins AE, et al. Folate, homocysteine, and negative symptoms in schizophrenia. Am J Psychiatry (2004) 161:1705–8. doi: 10.1176/appi.ajp.161.9.1705
17. Gulshan V, Peng L, Coram M, Stumpe MC, Wu D, Narayanaswamy A, et al. Development and validation of a deep learning algorithm for detection of diabetic retinopathy in retinal fundus photographs. JAMA (2016) 316:2402–10. doi: 10.1001/jama.2016.17216
18. Muntjewerff JW, Kahn RS, Blom HJ, den Heijer M. Homocysteine, methylenetetrahydrofolate reductase and risk of schizophrenia: a meta-analysis. Mol Psychiatry (2006) 11:143–9. doi: 10.1038/sj.mp.4001746
19. Firth J, Teasdale SB, Allott K, Siskind D, Marx W, Cotter J, et al. The efficacy and safety of nutrient supplements in the treatment of mental disorders: a meta-review of meta-analyses of randomized controlled trials. World Psychiatry (2019) 18:308–24. doi: 10.1002/wps.20672
20. Evans TC, Jehle D. The red blood cell distribution width. J Emerg. Med (1991) 9:71–4. doi: 10.1016/0736-4679(91)90592-4
21. So HC, Chau CK, Chiu WT, Ho KS, Lo CP, Yim SH, et al. Analysis of genome-wide association data highlights candidates for drug repositioning in psychiatry. Nat Neurosci (2017) 20:1342–9. doi: 10.1038/nn.4618
22. Ueland PM, Ulvik A, Rios-Avila L, Midttun Ø, Gregory JF. Direct and functional biomarkers of vitamin B6 status. Annu Rev Nutr (2015) 35:33–70. doi: 10.1146/annurev-nutr-071714-034330
23. Carmel R, Lau KH, Baylink DJ, Saxena S, Singer FR. Cobalamin and osteoblast-specific proteins. N. Engl J Med (1988) 319:70–5. doi: 10.1056/NEJM198807143190202
25. Zheng Y, Cantley LC. Toward a better understanding of folate metabolism in health and disease. J Exp Med (2018) 216:253–66. doi: 10.1084/jem.20181965
26. Saya A, Brugnoli C, Piazzi G, Liberato D, Di Ciaccia G, Niolu C, et al. Criteria, procedures, and future prospects of involuntary treatment in psychiatry around the world: a narrative review. Front Psychiatry (2019) 10:271. doi: 10.3389/fpsyt.2019.00271
Keywords: machine learning, random forest classifier, vitamin B deficiency, folic acid, early diagnosis, decision support techniques or decision making
Citation: Tamune H, Ukita J, Hamamoto Y, Tanaka H, Narushima K and Yamamoto N (2020) Efficient Prediction of Vitamin B Deficiencies via Machine-Learning Using Routine Blood Test Results in Patients With Intense Psychiatric Episode. Front. Psychiatry 10:1029. doi: 10.3389/fpsyt.2019.01029
Received: 14 August 2019; Accepted: 30 December 2019;
Published: 20 February 2020.
Edited by:
Dagmar Iris Keller, University Hospital Zürich, SwitzerlandCopyright © 2020 Tamune, Ukita, Hamamoto, Tanaka, Narushima and Yamamoto. This is an open-access article distributed under the terms of the Creative Commons Attribution License (CC BY). The use, distribution or reproduction in other forums is permitted, provided the original author(s) and the copyright owner(s) are credited and that the original publication in this journal is cited, in accordance with accepted academic practice. No use, distribution or reproduction is permitted which does not comply with these terms.
*Correspondence: Hidetaka Tamune, dGFtdW5lLXRreUB1bWluLmFjLmpw
†These authors have contributed equally to this work