 Shishir Priyadarshi
 Qing-He Zhang
 Yuzhang Ma1
 Ze-Jun Hu
 Guozhu Li
- 1Shandong Provincial Key Laboratory of Optical Astronomy and Solar-Terrestrial Environment, Institute of Space Sciences, Shandong University, Weihai, China
- 2SOA Key Laboratory for Polar Science, Polar Research Institute of China, Shanghai, China
- 3Key Laboratory of Earth and Planetary Physics, Institute of Geology and Geophysics, Chinese Academy of Sciences, Beijing, China
Dynamical nightside auroral structures are often observed by the all sky imagers (ASI) at the Chinese Yellow River Station (CYRS) at Ny-Ålesund, Svalbard, located in the polar cap near poleward edge of the nightside auroral oval. The boundaries of the nightside auroral oval are stable during quiet geomagnetic conditions, while they often expand poleward and pass through the overhead area of CYRS during the substorm expansion phase. The motions of these boundaries often give rise to strong disturbances of satellite navigations and communications. Two cases of these auroral boundary motions have been introduced to investigate their associated ionospheric scintillations: one is Fixed Boundary Auroral Emissions (FBAE) with stable and fixed auroral boundaries, and another is Bouncing Boundary Auroral Emissions (BBAE) with dynamical and largely expanding auroral boundaries. Our observations show that the auroral boundaries, identified from the sharp gradient of the auroral emission intensity from the ASI images, were clearly associated with ionospheric scintillations observed by Global Navigation Satellite System (GNSS) scintillation receiver at the CYRS. However, amplitude scintillation (S4) and phase scintillation (σϕ) respond in an entirely different way in these two cases due to the different generation mechanism as well as different IMF (Interplanetary Magnetic Field) condition. S4 and σϕ have similar levels around the FBAE, while σϕ was much stronger than S4 around BBAE. The BBAE were associated with stronger particle precipitation during the substorm expansion phase. IU/IL, appeared to be a good indicator of the poleward moving auroral structures during the BBAE as well as FBAE.
Key Points
• Ionospheric scintillation study at the equatorward and poleward edge of the nighttime auroral oval.
• Study of the two distinct types of auroral emission structures.
• IMF conditions and the generation mechanism of different auroral structures are dissimilar.
Introduction
The widely recognized threat to the trans-ionospheric radio wave communication and ranging is the presence of ionospheric irregularities in their signal path, which give rise to ionospheric scintillation and consequently, degrades the signal quality (Yeh and Liu, 1982; Bhattacharyya et al., 1992; Basu and Basu, 1993; Yeh and Wernik, 1993; Wernik et al., 2004; Kintner et al., 2007; Priyadarshi, 2015). During active solar periods Sun can produce flares, coronal mass ejections (CMEs), which are generally accompanied by the solar particles and electromagnetic radiations. When solar flares and CME's are Earth directed, they hit the Earth's magnetosphere initially by electromagnetic radiation and later by the solar particles. Aurora or polar lights are the indicator of the disturbed magnetosphere due to the solar wind-magnetosphere coupling. Charged particles from the solar wind and magnetosphere, mostly electrons and protons, precipitate in the upper atmosphere and dissipate their energy by generating the auroral emission. The nightside auroral events have been studied by many researchers since the last several decades and it has been found that in the auroral region, strong ionospheric scintillations are observed (Coker et al., 2004; Mitchell et al., 2005; De Franceschi et al., 2008; Hosokawa et al., 2014; Jin et al., 2014; van der Meeren et al., 2014, 2015; and the references therein). Cusp region ionospheric irregularity dynamics which gives rise to pre-noon hour scintillation and cycle slips have been found to be associated with the polar cap patches during the solar minimum (Prikryl et al., 2010). However, the nightside auroral oval is known to have predominant phase scintillations (Prikryl et al., 2011). Certainly, cusp scintillation and nighttime auroral scintillation are different because of different ionospheric irregularity production dynamics (van der Meeren et al., 2016). The cusp region scintillations are long lasting as compared to the night time auroral scintillation. The scintillation generated in the cusp is associated with the ionospheric irregularity perturbation in the cusp region as well as cusp region particle precipitation, whereas, nighttime auroral oval scintillations are associated with the nightside energetic particle precipitation giving rise to auroral emissions (Prikryl et al., 2010, 2011, 2014; Jiao et al., 2013; Kinrade et al., 2013; Hosokawa et al., 2014; Jin et al., 2014 and references therein). Inside the auroral oval there are some regions, where the amplitude scintillations are stronger as compared to the phase scintillations and they are supposed to be the regions having strong particle precipitations around the existing polar cap patches (Wang et al., 2016). Strong amplitude scintillation at L-band are rare at polar latitudes (Prikryl et al., 2010, 2011) due to which space weather researchers have a common opinion that the σϕ is a more reliable scintillation index than the S4 for the polar ionosphere. Poleward moving auroral forms (PMAFs) and their dependence on IMF (interplanetary magnetic field) have been discussed by Rinne et al. (2007, 2010) and Oksavik et al. (2011, 2015), and references therein. These research studies have reported that PMAFs causes severe phase scintillation and temporary loss of lock in the navigation satellite signals. PMAFs are the region of strong ionosphere irregularities in the cusp region and they cause stronger phase scintillations in comparison to the polar cap patches.
Northern polar region is very diverse in culture and human habitation. In recent years, there is noticeable increase in the anthropological actions in the polar region. The polar latitude upper atmospheric researches, GNSS scintillation associated with the auroral emission are the latest hot research topics among the space physicists. The polar ionospheric scintillation activities are mostly associated to the active solar wind disturbances which directly influences magnetosphere-ionosphere coupling. This solar wind induced magnetosphere-ionosphere coupling system triggers the generation of the steep ionospheric irregularities and plasma density gradients. Solar wind plasma enters through the dayside cusp region. Fast drifting plasma and the steep density gradients are the main cause of the ionospheric scintillation at the dayside cusp religions (Prikryl et al., 2015; van der Meeren et al., 2015, 2016 and references therein). Most significant ionospheric scintillation at the polar latitudes occurs at the nightside auroral oval, dayside cusp/cleft region and at the polar cap (Prikryl et al., 2015). Recent Ionospheric scintillation studies associated to the aurora in Arctic and Antarctica can be summarized as follows. Jin et al. (2016) studied the scintillation associated with the different types of the auroral blobs and found that the scintillation caused due to the blobs is more severe than the polar cap patches. Ionospheric scintillation is mostly in the dayside noon in the auroral region (cusp region). These dayside auroral zone noon scintillations are due to the particle precipitation, which is very similar to the PMAFs (Jin et al., 2015). PMAFs are the poleward moving auroral forms and they cause severe degradation on the GNSS signals by causing scintillation and the loss of lock between satellite signal and the GNSS ground based receiver (Oksavik et al., 2015). Crowley et al. (2000) and Zhang et al. (2013a, 2015) mentioned that nighttime aurora are occasionally due to the dayside high plasma density, which enters the nightside auroral oval and generate aurora thereafter, these high density plasma returns back to the dayside region. Inside the nightime auroral oval if the polarcap patches enters and produce aurora, the strongest scintillation is mostly found at the poleward edge of the nighttime auroral oval (van der Meeren et al., 2015).
Recent nightside auroral studies are highly relying on the SuperDARN radar network data. For example, Baddeley et al. (2017) used SuperDARN radar network to demonstrate that ULF waves push the auroral arcs equatorward and the wave energy is dissipated by the ionospheric joule heating / ion friction heating with the auroral particles. Chen et al. (2017) studied the throat aurora using the SuperDARN radar observation and found that the throat aurora are the precursor of dayside PMAFs, and they are the auroral arcs mostly aligning in the North-South direction. Their brightening and diming is the signature of the open and closed field lines respectively. Many other important recent research investigations (e.g., Liu et al., 2015; Lyons et al., 2015; Prikryl et al., 2015; van der Meeren et al., 2015; Hosokawa et al., 2016; Jin et al., 2017 etc.) related with the auroral emission have been successfully carried out suing the SuperDARN radar network.
Further, recent research studies related to the auroral emission and the polar ionospheric (e.g., Crowley et al., 2000; Zhang et al., 2013a, 2015; Jin et al., 2015, 2016, 2017; Liu et al., 2015; Lyons et al., 2015; Oksavik et al., 2015; Prikryl et al., 2015; van der Meeren et al., 2015; Hosokawa et al., 2016; Baddeley et al., 2017; Chen et al., 2017 and many others) have covered many important aspects of magnetosphere-ionosphere-thermosphere coupling, such as nightside patch related aurora and poleward edge brightening of the nightside auroral oval; nightside auroral blobs and their associated scintillations; throat aurora as the precursor of PMAFs; equatorward driven auroral arcs due to the ULF waves and their energy dissipation caused due to joule/ion frictional heating etc. Still the long time duration (3–5 h) auroral emissions neither were studied nor characterized based on their boundary movement. Many researchers have attempted ionospheric scintillation associate to the dayside as well as nighside auroral emission (e.g., Jin et al., 2015, 2016, 2017; Oksavik et al., 2015; Prikryl et al., 2015; van der Meeren et al., 2015) but, the ionospheric scintillation response on the GNSS signal caused at the poleward as well as equatorward edge of the auroral emission boundary is poorly understood. Feldstein and Galperin (1985), Lyons et al. (2000), Zesta et al. (2002); and references therein; have discussed the structure of the auroral emission in really great details. Though, the IMF condition which may conceivably be responsible for generating the long duration (3–5 h) auroral emission structures with stable and unstable boundaries have not been attempted yet. The presented research is an attempt to answer certain questions which arise from earlier research studies mentioned above.
The structure of auroral particles precipitation has been widely studied (e.g., Feldstein and Galperin, 1985; Lyons et al., 2000; Zesta et al., 2002; and references therein), but, many things related this topic is very poorly understood. Specifically; is there any involvement of IMF By/Bz in generating the different night time auroral structures (FBAE and BBAE in our case)? What really accelerates the poleward/equatorward boundary of the few auroral structures more than the other stable auroral structures? In the presented paper, we are introducing two different types of night time auroral emission structures based on their boundary movement. In the next section we will define the two different types of the auroral structures based on their sharp emission intensity gradient. Amplitude and phase scintillations, related with the distinct auroral emission at different sections of the nightside auroral oval are discussed in section Observations and Results, while section Discussions, summarizes the significance of the present study in the context of ionospheric irregularity formation and motivation for the future research work. The conclusions of this research work are provided in the section Summary and Conclusions.
Data and Methodology
All Sky Imager (ASI) Data
The Chinese Yellow River Station (CYRS) is situated at 76.24° N geomagnetic latitude and 110.19° E geomagnetic longitude in Ny-Ålesund, Svalbard in the Arctic. CYRS, Svalbard has installed an optical observation system in November 2003 (Liu et al., 2005; Hu et al., 2009), which consists of three all-sky cameras (ASI) supplied with the narrow-band filters centered at 427.8, 557.7, and 630.0 nm. We are only using the observations from 557.7 and 630.0 nm cameras in this paper. The time resolution of CYRS, Svalbard, ASI is 10 s, which including 7 s of exposure time and 3 s for recording and storing. The station location makes it possible to observe longer time aurora during winter nights of the arctic regions. More details about this optical system are available in Liu et al. (2005) and Hu et al. (2009). We also present the keograms extracted along the meridian line from the ASI data for showing the time-series appearance of auroral emissions.
Global Positioning System (GPS) Data
We are using GSV4004B GPS scintillation receiver data deployed at the CYRS, Svalbard. This receiver calculates the amplitude and phase scintillation indices using the method described by Van Dierendonck et al. (1993). The amplitude scintillation index is the ratio of standard deviation of the received GPS satellite signal power to the average signal power, however, phase scintillation index is standard deviation of the received signal phase. As it is well accepted fact that the multipath takes place at all elevation angles, hence, it is quite unavoidable completely. But, multipath effects are extremely dominating at the lower elevation angles (Priyadarshi and Wernik, 2013; Priyadarshi, 2015). For minimizing the multipath, we have discarded the data below 20° elevation angle. Only the scintillation indices ≥0.05 have been used in this study, as the ambient noise order is ≤ 0.05 (Van Dierendonck et al., 1993). We have considered the height of the ionospheric pierce point (IPP) at 350 km above Earth's surface.
SuperDARN Radar Data
We have used SuperDARN (Super Dual Auroral Radar Network) radar data freely available at http://vt.superdarn.org/tiki-index.php. This radar network comprised nearly 30 high frequency (HF) radars. These radars monitor the motion of irregularities in the upper atmosphere from mid-latitude regions to the polar regions of the northern and southern hemispheres. Depending on the SuperDARN radar, the number of beams varies from 16 to 25, each beam is separated by an azimuth angle of ~3° 14′. A full scan covers 3,000 km range and 52° latitude in every 2 min. The resolution of the radar beam scan is ~45 km (Zhang et al., 2010). The radar beams can measure the line of sight velocity of the ionospheric plasma. The line of sight of the SuperDARN radars beam should overlap the field of view of ASI, for capturing the ionospheric irregularities that are responsible for producing the presented auroral sturctures in this study. We found that the Hankasalmi radar's beam 8 and Pykkvibaer radar's beam 5, overlap the field of view of CYRS, Svalbard ASI. We have used these radar beams scan and plotted them in universal time (UT) and magnetic latitude.
Provisional Activity Indices, IMF, and IMAGE Electrojet Data
NASA's OMINIWEB (http://omniweb.gsfc.nasa.gov/form/omni_min.html) provides high resolution (1-min, used in our case) solar wind and IMF data. We have used magnetic field (Bx, By and Bz) data, which are interplanetary magnetic field (IMF) components in nanoTesla (nT) and the provisional activity index data (Auroral Electrojet: AE, AU, and AL in nT) data. The IMF data have been observed by ACE (Advanced Composition Explorer), which was launched in August 25, 1997. These satellites are continuously providing magnetic field, and plasma parameters related data of the energetic particles. We are targeting the nightside auroral oval in this paper. IMF is measured at the dayside, and the IMF takes time to influences the nightside auroral zone. The delay time is inversely proportional to the dayside reconnection rate (Zhang et al., 2015; Browett et al., 2017). On the nightside IMF delay depends on the solar wind velocity. For maintaining the IMF delay for the nighside auroral zone, we have delayed the IMF data by 60 min (Tenfjord et al., 2017). This delay in the IMF data is with respect to the ACE measurements, which maintains the propagation delay of the solar wind from the bow to the magnetotail lobe (Kullen et al., 2015). AE index is the total range of deviation of Earth's horizontal magnetic field component from geomagnetic quiet days, around the auroral oval, at an instant of time. It has been derived and developed by Davis and Sugiura (1966). International Monitor for Auroral Geomagnetic Effects (IMAGE) is a network of around 30 magnetometers in the Northern auroral regions. This project run by 10 multinational institutions and its primary goal is to study auroral electrojets and the ionospheric current at 110 km altitude moving in the auroral ionosphere. These ground magnetometers covers 58–79° geographic latitude and 5–36° geographic longitude. From IMAGE data local auroral electrojet indices (IU, IL, and IE) are calculated for monitoring the auroral oval ionospheric currents in the European sector (Kauristie et al., 1996 and references therein). These data sets are freely available at http://space.fmi.fi/image/beta/?page=il_index. In the presented study, we are using the IMAGE magnetometer data, which is located within 70–80° geographic latitude and 10–30° grographic longitude. We are using the estimated total eastward (IU) and westward (IL) ionospheric currents, which crosses the magnetometers. These current are useful for the presented case study, as they show coherent and immediate response with any movement in the auroral emission structures, which helps in understanding ionospheric dynamics in the vicinity of the nighside auroral emission region.
Apart from all above listed data types we have used OVATION (auroral Oval Variation, Assessment, Tracking, Intensity, and Online Nowcasting), which uses historical data and real time Nowcasting. All the datasets used in OVATION display, are long running and cross calibrated by the auroral boundaries derived from DMSP satellite. The modeled maps obtained from OVATION are the electron number density flux and electron energy density fluxes, which are predicted by the Boundary-Based-Precipitation-Model (Sotirelis and Newell, 2000). OVATION display is available at http://www.jhuapl.edu/Aurora/ovation/ovation_display.html. OVATION is an experimental model. In the presented paper, it has been used for showing the integral flux of precipitated particle energy as well as the integral flux of the precipitated electrons for the duration of the auroral emissions in the presented events. The next section will introduce two types of auroral emissions and discuss the amplitude and phase scintillation variations during these auroral emissions.
Observations and Results
In the past few decades there were many studies to quantify the poleward edge of the auroral luminosity (Feldstein and Galperin, 1985; Siscoe, 1991 and references therein). Greenwald et al. (1973) used radar data together with ASI images to locate the poleward edge of the nightside auroral oval. The average 630.0 nm auroral emission is ≥200 R in our observations, which is about 40% of the maximum red line emission (~500 R). Following the previous studies and the available, ASI data obtained from the CYRS Svalbard, we have considered the drop in the auroral emission by more than 40% (i.e., intensity gradient) as the auroral emission boundary. Based on the sharp intensity gradients observed by ASI, we have defined following two types of the auroral emissions: (1) Fixed Boundary Auroral Emissions (FBAE) and (2) Bouncing Boundary Auroral Emissions (BBAE). It should be noted that the auroral emission boundaries discussed in the presented paper, are exclusively for the auroral emission structures observed from the ASI based at the CYRS, Svalbard. These auroral emission boundaries are not the boundaries of the nightside auroral oval. We have cross checked our ASI data observed at the CYRS, Svalbard during the presented events and there were no light contamination, such as due to the moon.
Fixed Boundary Auroral Emissions (FBAE)
In FBAE equatorward boundary (boundary is defined by the sharp intensity gradients) of the intense auroral emissions is nearly constant, while poleward boundary shows ≤ 5% enhancement in its lowest value, from the beginning to the end of the auroral event. Figures 1A,B show the auroral emission keograms which have been extracted along the magnetic meridian at 557.7 nm and 630.0 nm respectively from every 10 s aurora images observed at the CYRS, Svalbard between 19:00 and 24:00 UT (21:32-02:24 MLT) on 5 December, 2014. The red line on the keogram and scintillation maps shows the boundary of the auroral emissions, which has been calculated using ≥40% drop in the intensity of auroral emission in 630.0 nm. From 70 to 75° MLAT (magnetic latitude) we see merely constant intense auroral emissions in Figures 1A,B and both upper boundary close to 75° MLAT and the lower boundary at around 70° MLAT are not moving during this auroral activity. Above the poleward auroral emission boundary there are some tiny intense auroral structures present in the keograms. If these tiny auroral structures are collocated in both the keogram of red and green lines (Figures 1A,B) then they are auroral arcs or polar cap hot patches (Zhang et al., 2017), but, if they appear only in 630.0 nm keogram (Figure 1B), so called polar cap patches (e.g., Sato et al., 1998; Zhang et al., 2011, 2013a,b, 2016; Hosokawa et al., 2012). Whenever, these structures meet the GNSS signals, they give rise to moderate amplitude and phase scintillation (Hosokawa et al., 2014), especially for polar cap hot patches (Zhang et al., 2017). The equatorward boundary of the nightside auroral (which is calculated using the sharp intensity gradients of auroral emission) oval is at ~69° MLAT (see in Figures 1A,B), but the scintillation data are available between 70 and 80° MLAT only, due to which only the poleward boundary is visible on the scintillation maps. Figure 1C presents the σϕ behavior during the auroral event 19:00–24:00 UT on 05 December 2014. This map has been created by averaging the scintillation index for the bin size 1° MLAT × 1 UT minute. We see that before ~23:25 UT of the FBAE, we have mostly low (σϕ < 0.1) to middle (σϕ ~0.10–0.15) range phase scintillations. But, after ~23:25 UT, we can see clear enhanced σϕ (σϕ >0.15), which, seems to be related to the poleward moving structure, and may be associated with a flow burst suggested by de la Beaujardiere et al. (1991) and Sergeev et al. (2000). There is poleward enhancement of the auroral emission near 19:00 UT and at 24:00 UT, but, the phase scintillation was not that large as it is at ~23:15 UT. This indicates that the phase scintillation enhancement is highly interconnected with the enhanced ionospheric current as well as enhanced AE in the nightside auroral oval. Amplitude scintillation variation is shown in Figure 1D which has been created by using similar methods as in Figure 1C. There are some enhanced regions of S4 at above 80° MLAT that seems to be associated with some small-scale structures like auroral arcs or polar cap hot patches. Within the auroral emission boundary, we observed middle to large range amplitude scintillation during the FBAE at different points (e.g., at ~19:20-1940 UT, ~20:30 UT, ~20:45 UT, and ~22:50 UT), but there is a little enhanced phase scintillation appeared at 23:25 UT, which seems to be associated with the poleward moving auroral structures. Small scale (few tens of centimeters) ionospheric irregularities are known to be the main cause of the amplitude scintillation while the middle to large scale ionospheric irregularities structures (few tens of meters to few kilometers) produce the phase scintillation (Wernik et al., 2004; Kintner et al., 2007 and references therein). Actually, the FBAE represents the variations of two boundaries of the auroral oval, where the poleward boundary is thought to be the open-closed boundary and associated with the particle precipitations from the magnetotail plasma sheet due to the far tail reconnections associated with precipitation. Ching (1981) have reported that these poleward nightside aurora are different than the polar rain, which often occurs in the polar cap regions. During quiet geomagnetic conditions, the boundaries of auroral oval are roughly stable, thus, the FBAE between 19:00 and 23:00 UT in our case is fixed and stable, which is generated by electron precipitations in the energy range of a few keV from magnetotail plasma sheet (Ching, 1981; Lassen and Danielsen, 1989). For fully understanding the FBAE, we should have a clear idea of the IMF and geomagnetic conditions during the auroral event on 05 December, 2014. Figure 1E shows the IMF conditions [IMF Bx (blue line), By (green line), and Bz (red line) in natotesla (nT)]. Bx has positive value (~>0 to <+5nT) between 19:00 and 21:30 UT, thereafter Bx turns negative and have a weak value close to 0 up to 22:30 UT. Again Bx turns positive between 22:30 and 23:00 UT, thereafter it achieve a constant negative value of ~−3 nT. Initially By has a negative value (~−5 nT) but it turns positive at around 19:50 UT and after this starts to bounce with small positive and negative values until 23:00 UT. After 23:00 UT it attains a positive value of 1–2 nT. IMF (Bz) has almost weak positive value from 19:00 to 21:30 UT and thereafter it is almost negative with weak value varying from 0 to −4 nT. Figure 1F, AE index confirms it was a quiet geomagnetic condition until 22:30 UT. After 22:30 UT AE index starts to increase and attains a value >200 nT, which indicates commencement of a small substorm (Kamide and Akasofu, 1983). Figure 1G shows the magnetic effects of eastward and westward ionospheric currents over Scandinavia, IU (in green), IL (in blue) and their difference IE (in red); respectively, between 70 and 80° MLAT, at the nightside auroral oval during 19:00–24:00 UT. During 19:00–22:50 UT, we see the IU and IL are varying very close to zero, which is an indication of the quiet auroral zone behavior. Just after 22:50 UT, IE, and IU started to enhance. Figure 1G shows the enhanced ionospheric auroral current at ~23:00 UT onward, which also enhance the possibility of poleward moving auroral structures. These structures are mostly away from the field of view of the ASI at CYRS, Svalbard due to which we couldn't capture all parts of it. At ~23:00 UT we observe sudden enhancement in the ionospheric current (see Figure 1G) and the auroral emission band intensity appears fragmented. The enhanced ionospheric current in the auroral oval may be associated with flow burst in the ionosphere (Sergeev et al., 1990; de la Beaujardière et al., 1994; Kauristie et al., 2003). There is a possibility that the fragmented poleward moving auroral structures may be associated with the flow burst (Zou et al., 2009), which causes significant enhancement in the phase scintillation. The small scale aurora, which is not extended in latitudinal direction and it can be in various small shape with persistent geometry, is known as fragmented aurora (Shiokawa et al., 2014).
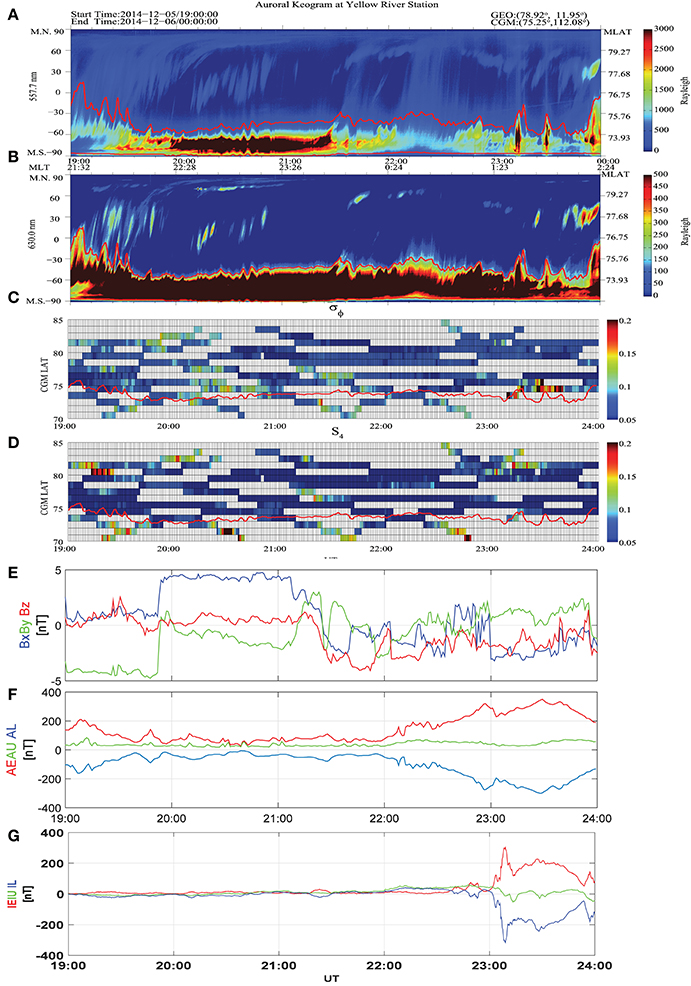
Figure 1. The FBAE and associated scintillation indices on 05 December, 2014, between 19:00 and 24:00 UT (A) 5,577 nm Keogram based on ASI observation at CYRS Svalbard, (B) 6,300 nm Keogram (C) σϕ, (D) S4, (E) IMF components, (F) AE, AU, and AL, and (G) eastward current IU(in red)/westward current IL(in blue) crossing the magnetometers.
We have obtained the constant auroral emission band (both red and green) during 19:00–23:00 UT on 05 December 2014. During the quiet geomagnetic condition, if IMF Bz remain northward or southward for a long duration (say few hours), then its sudden turning to the opposite sign takes very long time to shrink/expand aurora emission band (~15 h or more for 5° MLAT movement) in the nightside auroral oval (Lee et al., 2010 and references therein). During such a quiet geomagnetic condition and IMF Bz, auroral structures similar to the FBAE are most likely to appear. Such stable boundary auroral emission is a consequence of a few keV particle precipitations during the quiet geomagnetic condition (Lee et al., 2010 and references therein). We will discuss more details about these outcomes in the section Discussions. The data presented so far is solely based on the comparison of the auroral emission at the CYRS on 05 December 2014 and their associated ionospheric amplitude and phase scintillation occurrence. Ionospheric scintillation has been observed at the same location where the ASI at the CYRS is deployed. In brief, there are two main things in the FBAE, first is the occurrence of the amplitude and phase scintillation at the similar numerical scale which is very rare during the strongly disturbed geomagnetic situation. The second is the FBAE occurs at weakly disturbed geomagnetic condition. At the high latitude strong amplitude scintillations are very rare and the phase scintillation is highly dependent on the irregularity drift velocity (Spogli et al., 2009; Li et al., 2010; Prikryl et al., 2010; Moen et al., 2013). During the weak disturbed geomagnetic time, the ionospheric irregularity drift velocity is very low, and due to this the boundaries of FBAE are more stable as compared to the other dynamic auroral emission structures. Now it is important to know another kind of aurora structure and their related phase/amplitude scintillation behavior.
Bouncing Boundary Auroral Emissions (BBAE)
An example of the BBAE is shown in Figures 2A,B. Figures 2A,B are keograms of the auroral emission at the CYRS, Svalbard during 20:30–23:00 UT (22:40-01:06 MLT) on 27 January 2015, at 557.7 and 630.0 nm respectively. Similar to Figure 1, two redlines on Figures 2A–D show the poleward as well as equatorward boundary of the auroral emission. In BBAE both the boundaries of the intense auroral emission fluctuate more than 5% of their lowest value. Some of the auroral emission is visible below the equatoward boundary of the auroral emission, because, these red lines are the calculated boundaries, and they may differ a little from the actual boundary. The upper and the lower boundary of the intense auroral emission are changing with the time. In the presented case here we see four regions of the distinct auroral emission; (1) before 20:54 UT the auroral emission boundary in roughly stable and hold onto a lower latitude (<74° MLAT), the auroral emission in this region have some emission gaps, which is associated with quiet condition; (2) between 20:54 and 21:21 UT, the auroral emissions start to become active and dynamic with poleward expansions from about 73–75° MLAT, which may be associated with the substorm onset (~20:54 UT); and (3) after 21:21 UT, the auroral emission, rapidly starts to expand poleward and pass through the overhead regions of CYRS Svalbard, which is at about 73–79° MLAT, with a wide and very dynamic auroral emission region, this may be associated with the substorm expansion phase; (4) after about 22:39 UT, the auroral emission became week and starts to shrink (auroral emission retreated equatorward) to lower latitude regions, which is associated with the substorm recovery phase (Figures 2A,B). The auroral emission boundary is very dynamic in BBAE. Figure 2C shows the phase scintillation behavior during the auroral event on 27 January 2015 during 20:30–23:00 UT. Between 20:30 and 20:54 UT, we observed mostly middle (σϕ ~0.15–0.1) and low (σϕ < 0.1) phase scintillations. While, from 20:54 to 21:21 middle and large phase scintillation occurred at about 71–72° and 76–77° MLAT. σϕ is much higher (σϕ ~0.2) from 21:21 to 22:39 UT when the BBAE is varying from 72 to 79° MLAT. There are some enhanced phase scintillation regions around 80° MLAT, which are beyond the field of view of ASI. They may be associated with some large scale irregularity structures. Further, Figure 2D shows the amplitude scintillation profile for the similar auroral event. We observed very weak (S4 < 0.1) S4 throughout this BBAE event occurred on 27 January 2015 between 20:30 and 23:00 UT. We only see S4 enhancement (medium to high value) between 20:54 and 21:21 UT at 71–73° MLAT. Figure 2E, shows the IMF condition during the BBAE event of 27 January 2015 between 20:30 and 23:00 UT. Please keep in mind that we have delayed the IMF data by 60 min (Tenfjord et al., 2017). IMF Bx (in blue line) has a negative value (~−5 nT) from 20:30 to 22:40 UT. Thereafter, Bx starts to increase and turns positive at 21:45 UT and it turns negative again (~−1 to −2 nT) during 22:45–23:00 UT. From 20:30 to 20:50 UT By (shown by the green line) was westward, but from 21:55 to 21:40 UT, By attains a positive value (0–3 nT) (Figure 2E). Between 21:40 and 22:15 By was ~0 nT, thereafter it attains a negative value of −4 to −6 nT. IMF (Bz; shown by the red line) was negative throughout the BBAE event and its negative value varied between 0 and −5 nT (Figure 2E). AE (Figure 2F) was ~400 nT throughout the BBAE event duration, which shows the existence of substorms during this auroral event. Figure 2G shows both IU and IL start turning negative at ~21:00 UT, which is associated with the poleward expansions of aurora oval. The IU/IL was keeping negative with some magnitude increasing until about 22:30 UT, which is well correlated with poleward expansions of the auroral structures. After about 22:30 UT, IU/IL turned close to zero due to auroral structures was shrinking to lower latitude shown in Figures 2A,B. It is clear from Figures 2A,B,G that during the poleward movement of the auroral structures, ionospheric current in the nightside auroral zone were high. Following Guo et al. (2012), Kamide and Kokubun (1996), and Ahn et al. (1999, 2000), the increased IU/IL is related with the enhanced electric field and Hall conductance, which is mostly associated with the enhanced auroral particle precipitation around the local midnight sector.
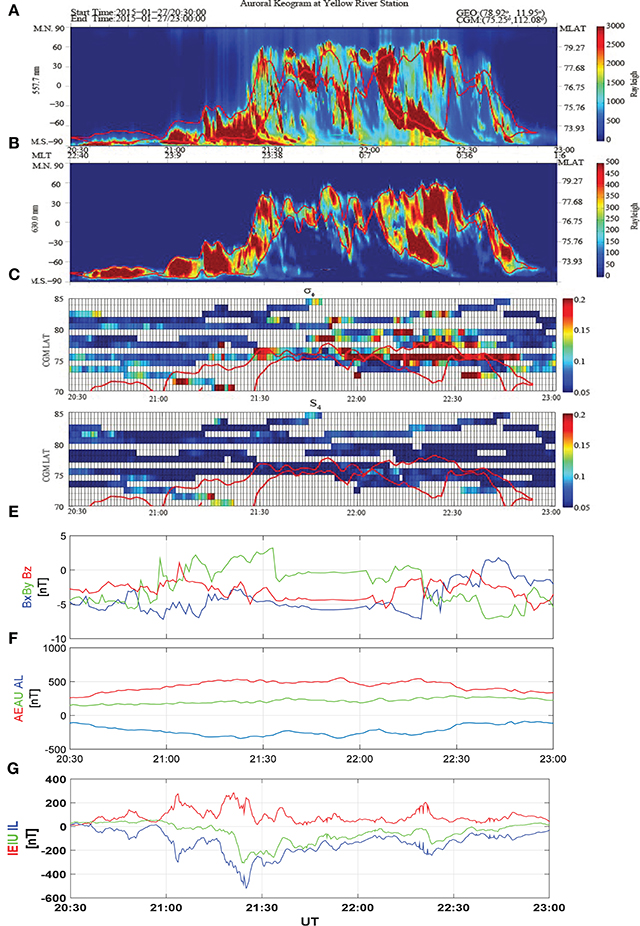
Figure 2. The BBAE and associated scintillation indices on 27 January, 2015 between 20:30 and 23:00 UT (A) 5,577 nm Keogram based on ASI observation at CYRS Svalbard, (B) 6,300 nm Keogram (C) σϕ, (D) S4, (E) IMF components, (F) AE, AU, and AL, and (G) eastward current IU(in red)/westward current IL(in blue) crossing the magnetometers.
Following the observations presented in Figure 1 and the discussed previous research literatures; it seems that the stable auroral boundary emissions like the FBAE are mostly due to few keV particle precipitation during the quiet/moderate geomagnetic condition. The IMF Bz was changing its sign throughout the FBAE, but, the numerical value of IMF Bz was always close to zero up to 21:10 UT, thereafter, Bz turned negative with varying value of 0 to −4 nT. Both amplitude and phase scintillation occurred from small to moderate proportions during the auroral event on 05 December 2014. Only at around 23:15 UT near the auroral emission break point we see enhanced phase scintillation but, moderate amplitude scintillation. This may be associated with the movement of the fragmented aurora due to the flow burst. We found a good consistency between the poleward growth of the fragmented aurora (Shiokawa et al., 2014) and IL/IU ionospheric current during the FBAE near ~23:15 UT during the substorm (please see discussion of Figure 1). However, during the BBAE we witnessed a disturbed geomagnetic condition and the continuous existence of large scale and dynamic auroral structures. The high AE index indicates a moderate substorm, which will be associated with the larger energetic particle precipitation which results in poleward and equatorward expansion of the auroral emission structures. IMF (Bz) was southward throughout the BBAE, which causes the existence of active two cell convection pattern across the polar cap (Dungey, 1961; Zhang et al., 2013b). Following Lee et al. (2010), positive IMF By causes extension of the aurora oval boundary more poleward at the post-midnight sectors in the northern hemisphere. As we have seen during the BBAE at ~21:30 UT auroral emissions shrinks to the poleward region and at the same time IMF By was positive (~4 nT at 21:30 UT and > = 0 nT, thereafter before ~22:20 UT). Due to this IMF By, auroral emission boundaries of the nightside auroral oval shrink more poleward at and after the magnetic midnight sector. As the IMF By turns negative, at ~22:20 UT auroral oval boundaries move equatorward. On the other hand IMF Bz turning response to the nightside auroral oval size is not very fast (Nakai and Kamide, 1983). But, during the BBAE the IMF Bz was almost negative, thus it has comparatively less influence on the auroral emission boundary movement during BBAE than the IMF By. Solovyev et al. (1999) studied the substorm time (AE~400 nT) nightside auroral oval during the southward IMF Bz and reported that pre-magnetic-midnight auroral structure shrink to the equatorward edge of the auroral oval, however post-magnetic-midnight sectors formed the omega band auroral structure. We observe nearly similar saturation during the BBAE, where nightside auroral oval boundaries shrink to poleward during the substorm and southward IMF Bz in the post-midnight sectors and form some auroral emission pattern like an omega aurora band. We found IL/IU have a good coherence with the poleward shrink near the post-midnight sectors during the BBAE. During the FBAE IMF By kept on turning positive and negative. However, stable auroral boundaries are due to a roughly stable particle precipitation in the auroral oval during quiet/moderate geomagnetic condition. The common thing between FBAE and BBAE, is the positive By, during the poleward shrink of post-midnight time auroral emission. The scintillation observations shown in Figures 1, 2 also confirm the ionospheric scintillation occurring at the different MLATs beyond the red line boundaries of the FBAE and BBAE. Based on the previous polar ionospheric scintillation studies (e.g., Hosokawa et al., 2014; Jin et al., 2014; van der Meeren et al., 2014, 2015; and the references therein) we can say that the strong phase scintillations with almost weak amplitude scintillation shown in Figures 2C,D above the upper boundary of the BBAE maybe associated to the fast moving polar cap patches, which are beyond the field of view of the ASI deployed at the CYRS. The weak amplitude as well as weak phase scintillations, above the upper auroral emission boundary during the FBAE might have occurred mostly due to the background ionosphere.
The presented nightside auroral emission events are typical in all such cases but, the presented case is the only case in our database which is for such a long duration. All other cases are for very short duration as compared to the presented events. In the same way BBAE is the typical event for such a long duration. There are other small events which are of very short time. We don't present the short time events which might appear similar to the FBAE and/or BBAE, because, then the nomenclature of these two distinct kind of the auroral emission will appear doubtful, which is purely based on the auroral emission boundary movement. Further, in the short duration similar events it is also not clear that the aurora appear for the short duration or it occurred beyond the field of view of all sky imager (ASI) observation presented in our paper. Considering all these points, we have presented these two best cases in our opinion, which qualify all the condition of nomenclature and avoid any doubt related to auroral emission occurrences and ASI field of view related issues.
In order to investigate which type of auroral structure is associated with the enhancement of scintillations, we also present the 2D auroral images at 630.0 nm, from the ASI at CYRS, Svalbard for above two cases, respectively. We have cross checked all the ASI data for the presented events and they are free from any type of the light contamination, such as due to the moon. For the FBAE events, we have selected those auroral images which seem comparatively active than the rest, one in the pre-midnight sector and one in the post-midnight sector. During the presented FBAE images we observed a little mount in the poleward edge of the auroral boundary. Figures 3A,B show the 630.0 nm image of the FBAE on the polar map in MLAT and MLT (magnetic local time) coordinates at 19:10 UT (pre-magnetic midnight) on 05 December 2014 overlapped with S4 and σϕ respectively. We have used different colors for representing the ionospheric scintillation levels; blue for scintillation indices <0.1, green for scintillation indices ~0.1–0.2 and red for the scintillation indices >0.2. Both the ASI and scintillation data have been estimated at 220 km above Earth's surface. It is true that the IPP has been set to 350 km. But, in the presented research study our foremost objective is to study the ionospheric scintillation associated with two distinct kind of auroral structures whose boundary movements are entirely different. The 220 km altitude above the Earth's surface is a common sub-ionospheric raypath pierce height along the GPS satellite track, at which the ASI observations at CYRS are also estimated. In short, the auroral emissions seen from ASI at CYRS is mainly around 220 km, therefore the pierce point of GPS based scintillation measurements has been fixed to 220 km. These 2D figures are representing a comparison between auroral emission and associated ionospheric scintillation in MLAT and MLT coordinates. Figure 3A,B show three auroral brightening regions; however, we have observations only for the one (close to 75° MLAT), which is more poleward than the rest. In Figure 3C,D we have only one bright auroral emission, existing between 70 and 75° MLAT in the post-midnight sector. In these figures, we see that the amplitude and phase scintillations occur very frequently at the poleward edge of the auroral emission, at 19:10 UT on 05 December 2014, however, the magnitude of the scintillation indices are <0.1. Similarly, Figure 3C,D show the amplitude and phase scintillation respectively at 22:20 UT on 05 December 2014, respectively. The auroral emissions shown in Figures 3C,D are mainly located in the post-magnetic midnight region, where we only have a few scintillation data points which are mainly appearing around the poleward edge of the auroral emission with scintillation indices <0.1. For the BBAE, we are presenting the images of the pre-midnight region during which auroral emission band was very narrow, and the other image in the post-midnight region during which we observed the poleward shrink of the auroral boundaries. Figure 3E,F have a 630.0 nm auroral emission existing in pre-midnight sector, at ~69–75° MLAT. Whereas, Figure 3G,H have a sporadic auroral emission, scattered in pre- and post-midnight sectors between 75 and 80° MLAT. Figures 3E–H are the 630.0 nm auroral emissions overlapped by the amplitude and phase scintillations during the BBAE. In the pre-magnetic midnight region, we observe the weak amplitude (Figure 3E) but, moderate phase (Figure 3F) scintillation at 20:50 UT (region 1 of BBAE) on 27 January 2015. Figure 3G shows the weak amplitude scintillation in close proximity of intense auroral emissions UT in region 3 of BBAE at 21:50 (close to 23–24, 01, and 02 MLT). Whereas, we have observed strong phase scintillation near 02 MLT (near the poleward edge of the auroral emission) and weak phase scintillation near the 24 and 01 MLT sectors at 21:50 UT (Figure 3H).
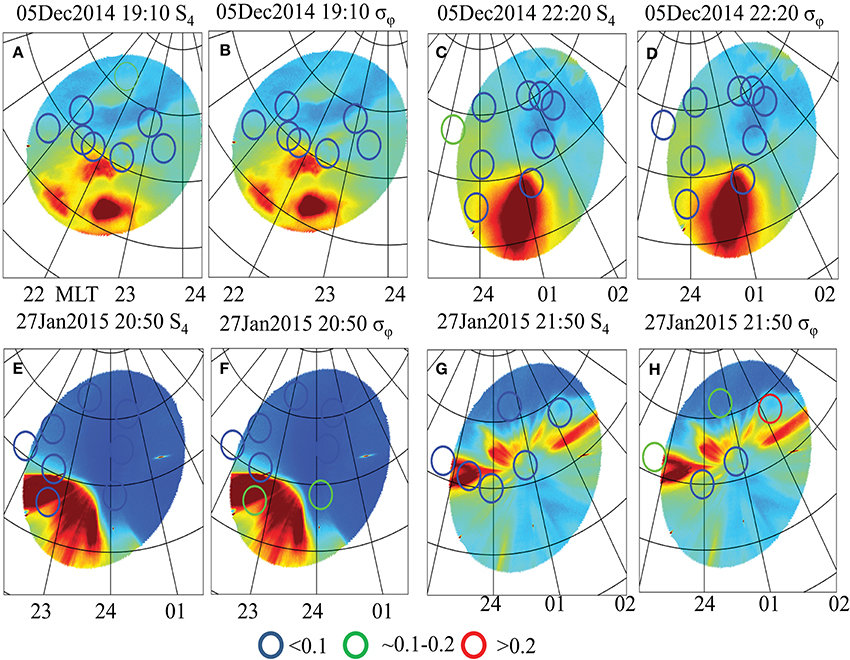
Figure 3. (A) ASI auroral emission/S4 observation during FBAE of 05 December 2014, at 19:10 UT, (B) ASI auroral emission/σϕ on 05 December 2014, at 19:10 UT, (C) ASI auroral emission/S4 observation during FBAE of 05 December 2014, at 22:20 UT, (d) ASI auroral emission/σϕ during FBAE of 05 December 2014, at 22:20 UT, (E) ASI auroral emission/S4 observation during BBAE of 27 January 2015, at 20:50 UT, (F) ASI auroral emission/σϕ observation during BBAE of 05 December 2014, at 20:50 UT, (G) ASI auroral emission/S4 observation during BBAE of 27 January 2015, at 21:50 UT, (H) ASI auroral emission/σϕ observation during BBAE of 27 January 2015, at 21:50 UT.
The coherence in amplitude and phase scintillation data associated with the FBAE indicates that the irregularity structures causing these auroral emissions are mostly medium scale structures. FBAE and BBAE both are the auroral emissions in the nightside auroral oval, but, their associated scintillation responses are completely different. During this instance of the FBAE we observed weak value of the σϕ and S4 (<0.1 and indicated by the blue circles in Figures 3A–D), which is the indication of the presence medium range ionospheric irregularities (Kintner et al., 2007). The strong phase scintillation in the nightside auroral oval is caused by the energetic particle precipitations, which give rise to field aligned high speed ionospheric irregularities (Oksavik et al., 2015; Prikryl et al., 2015). Hosokawa et al. (2014) also suggested that strong phase scintillation in the nighttime auroral oval is mostly due to the large scale ionospheric irregularity generated due to the structured precipitation of particles on the scale of a few tens of meters to a few tens of kilometers. On the other hand Figures 3F,H confirms that the BBAE auroral emission is in the vicinity of strong phase scintillation, therefore, the BBAE is mostly due to the large scale ionospheric irregularity generated due to the energetic particle precipitation due to substorm, on the scale of few tens of meters to few tens of kilometers (Hosokawa et al., 2014).
In the next section we will take a closer look at the ionospheric irregularity movement over the CYRS, Svalbard using the SuperDARN radar observations and the modeled particle precipitation features in the auroral oval for both cases.
Discussions
The SuperDARN radar network is designed to estimate the ionospheric plasma convection over the high latitude and Polar Regions. The irregularities los velocities are calculated using the pair of radars having identical field of view. A computer controlled radar beams phase matrix sequence enables SuperDARN radar to estimate autocorrelation function (ACF) of each radar range gate, which is used to calculate SuperDARN radar 2-D Doppler or los velocity, scattered signal power. The spectral width is calculated from the decorrellation time of the ACF phase (Ponomarenko and Waters, 2005; and reference therein). SuperDARN observations provide the evidence of the auroral boundary movement and the ionospheric irregularity drift, which is directly related to the scintillation occurrences (Prikryl et al., 2015; van der Meeren et al., 2015). We have looked for the available SuperDARN radar data during these events and found that Pykkvibaer (PYK) beam 05 and Hankasalmi (HAN) beam 08 overlap the ASI field of view, installed at the CYRS, Svalbard. Figure 4A shows the line of sight (eastward) of the PYK and HAN radars and the black dot on the map is the location of the CYRS, Svalbard. This map is in geomagnetic coordinates. Figures 4B,C,D shows the power, line-of-sight (los) velocity and spectral width data between 19:00 and 24:00 UT on 05 December 2014. HAN radar maps show the continuous presence of the ionospheric irregularities between 70 and 75° MLAT during the full FBAE, as the scattered power is in 15–26 dB high range. But, at 22:30 we see that the scattered power shrinks to 70° MLAT, which may be the reason of the auroral emission reduction reported in Figures 1A,B. The radar's scattered signals shows the velocity is varying between −375 and 375 m/s. The negative value of velocity indicates that the ionosperic irregularities are moving westward. Further, Figure 4C velocity data shows a lot of velocity shear between 19:00 and 22:00 UT which means that the ionospheric irregularities generating FBAE are coming from two different sources (Oksavik et al., 2011). The specific width data for these two different irregularities indicate that the sources of their origin are not same (Baker et al., 1995). Such velocity shear generates ionospheric irregularities (Kivanç and Heelis, 1997). If we see the scale size of these ionospheric irregularities coming from two different routes, then we will have an idea about their source. For example, between 19:45 and 20:00 UT we see an irregularity in blue color which is present from 77 to 73° MLAT (~450 km using AACGM coordinate conversion), moving eastward with a speed of ~400 m/s. Another irregularity in the orange color between ~20:10 and 20:20 UT, from 75 to 72° MLAT (~315 km using AACGM coordinate conversion) moving westward by 125 m/s. The dawn-to-dusk direction sizes of patches are ~500 km (Moskaleva and Zaalov, 2013) and the average velocity of the patch can be between 100 and 1,000 m/s, but, the average is ~500 m/s (Fukui et al., 1994). It seems that the blue irregularities (related to the los velocity) are somehow not from the equatorward edge of the auroral oval, as their specific width ~150 m/s (Baker et al., 1995). Further, the irregularities in the orange color have relatively lower los velocity and the scale size, which may be generated due to the quiet time nightside precipitation. The specific width data make clearer the origin of the ionospheric irregularities. The irregularities spectral width coming from the cusp region is ≥200 m/s, whereas the spectral width of the irregularities from the equatorward edge of the auroral oval is ≤ 50 m/s (Baker et al., 1995). The specific width data also confirms the continuous presence of the irregularity structure during FBAE. The HAN radar beam 05 has no backscatter during the BBAE, however the PYK radar beam 08 has some weak backscatter. Such absence of SuperDARN backscatter is either due to the HF signal absorption caused by the ionospheric changes associated with the substorm precipitation or due to the changes in the HF radar wave propagation condition (Gauld et al., 2002). Large substorm expansion causes complete absorption of the SuperDARN HF radar signal and as a result, during the time of extended substorms we do not get any backscatter in the local field-of-view (Gauld et al., 2002). We have also checked the PYK radar data for the BBAE event on 27 January 2015 (Figures 4E–G). The PYK radar beam 08 shows the part of BBAE between 70 and 75° magnetic latitude during 21:30–23:00 UT. These are few power scatters from the equatorward boundary of the auroral emission. The velocity and specific width data confirms that these power scattered signals are coming from the parts of the BBAE. From the ASI keograms shown in Figures 2A,B it is clear that during BBAE auroral structures shrink to poleward (from 21:21 to 22:39 UT), which means the irregularity structures have moved poleward and went beyond the line of sight of the radar beams. Some previous studies have suggested that such movement of the auroral emissions is a result of sudden enhancement in the solar dynamic pressure. On the day side, just few minutes after the enhancement of solar dynamic pressure, ionospheric convection enhances, whereas for the nightside it is delayed by ~40 min and significant size reduction of the polar cap have been observed (Boudouridis et al., 2008 and reference therein).
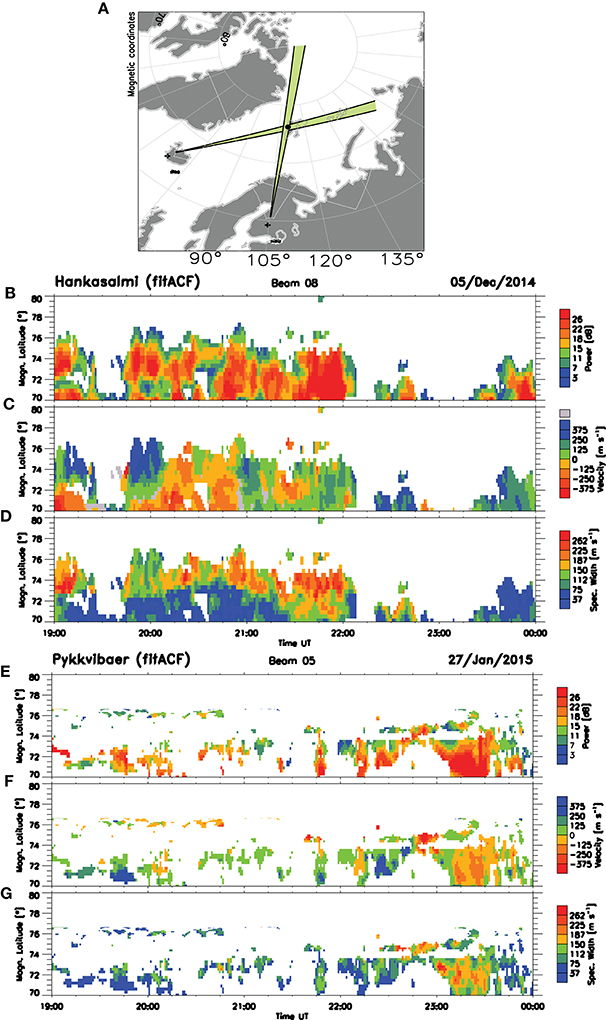
Figure 4. Ionospheric irregularity and radar data, ASI observation, (A) Line of sight of the HAN radar beam 08 and PYK radar beam 05 over the CYRS Svalbard, (B) Power, (C) Velocity, and (D) Spectral width data of HAN radar during the FBAE of 05 December 2014, between 19:00 and 24:00 UT, (E) Power, (F) Velocity, and (G) Spectral width data of PYK radar during the BBAE of 27 January 2015, between 19:00 and 24:00 UT.
Figure 5 has been obtained from the OVATION. This figure shows the integral energy and electron flux of the precipitated electrons in two dimensions. These figures also show the equatorward and poleward boundary of the auroral oval in black solid line. The DMSP data set is used to calculate the inner and outer boundary of the auroral oval. The equatorward boundary in the OVATION is defined by Newell et al. (2001). The open closed boundary is supposed to be the poleward boundary of the auroral oval in OVATION (Sotirelis et al., 1998 and Sotirelis and Newell, 2000). The maps shown in this figure are in MLT and MLAT. The unit of precipitation intensity is log10/centimeter2 second steradian and unit of the precipitation electron flux is log10 electron volt/centimeter2 second steradian. The intensity has been calculated by the Boundary-Oriented Precipitation Model (Sotirelis and Newell, 2000). Figures 5A,B are presenting integral intensity flux of the precipitated electron on 05 December 2014 at 19:00 UT and 27 January, 2015 at 20:30 UT respectively. The boundaries have been calculated using DMSP F16, F17, and F18 and calibrated by the DMSP magnetotail stretching index. Equivalent Kp index on 05 December, 2014 was 2.3 however on 27 January, 2015 was 3.0. B2i (plasma sheet MLAT) was 64° on 05 December, 2014 however on 27 January, 2015 it is 63°. We see the larger integral intensity flux of the precipitated electrons near magnetic midnight (in the black square) on 27 January 2015 (Figure 5B), than on the 05 December, 2014 (Figure 5A). Figures 5C,D also confirm that the integral number flux of the precipitated electrons was larger on 27 January 2015 than the 05 December 2014. Figures 2A,B keogram created using ASI 557.7 nm and 630.0 nm camera filters also shows the poleward boundary expansion during the BBAE. Thus OVATION display, ASI keogram and scintillation data both are confirming the poleward moving auroral structures during the BBAE during 20:30–23:00 UT are due to the large number precipitation of energetic particles in the nightside auroral oval.
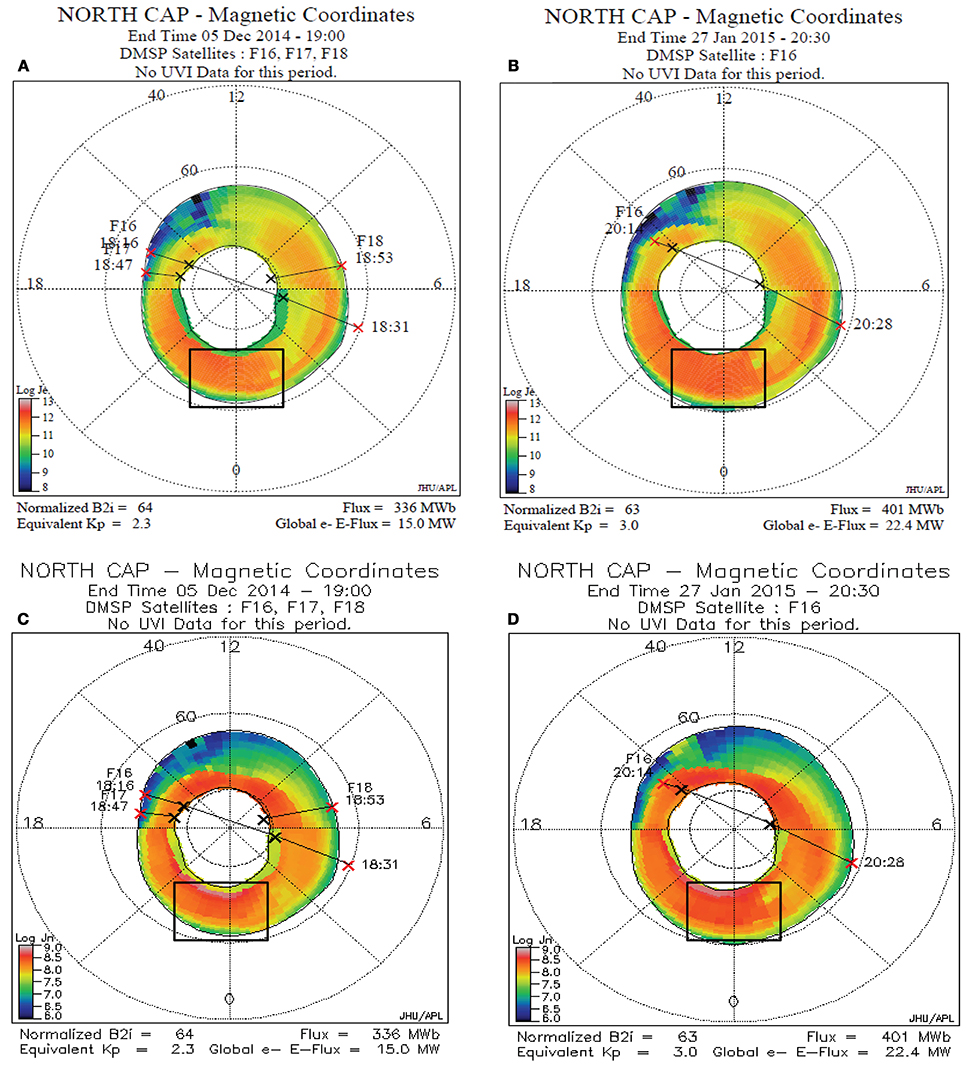
Figure 5. OVATION based polar particle precipitation data during FBAE and BBAE (A) Integral electron intensity flux precipitation data on 05 December 2015, between 19:00 and 24:00 UT, (B) Integral electron intensity flux precipitation data on 27 January, 2015, between 20:30 and 23:00 UT, (C) Integral electron number flux precipitation data on 05 December 2015, between 19:00 and 24:00 UT, and (D) Integral electron number flux precipitation data on 27 January, 2015, between 20:30 and 23:00 UT.
All the evidences shown in Figures 3, 5 indicate that greater particle precipitation and the disturbed geomagnetic conditions are more likely to produce BBAE. The boundaries shown in Figure 5 are the model calculated auroral oval boundary and the boundaries of the FBAE/BBAE shown in Figures 1, 2, are the auroral emission boundary which has been calculated using the sharp intensity gradient of the auroral emission and these boundaries are not necessarily the auroral oval boundary. Due to this reason no expansion of the poleward boundary of aurora can be seen in Figure 5.The ionosphere's response to the GNSS scintillation due to the FBAE and BBAE are completely different. This indicates that the ionospheric irregularities generating the BBAE and FBAE are not alike and consequently these irregularities have produced different scintillation indices. We have checked the ionospheric convection pattern (data not shown) determined from SuperDARN radar observations during FBAE (05 December 2014) and BBAE (27 January 2015) at 20:00, 21:00, and 22:00 UTs. There were enough back-radar scatters in the pre- and post- magnetic midnight hours, which make convection patterns believable. During the entire FBAE the dusk side convection cell seems very active and it shows some nightside reconnection from 22 to 01 MLT. From the convection patterns it seems that during FBAE nightside reconnection starts in the pre-magnetic midnight hours. After that, these structures propagate around the midnight and the post-midnight MLT sectors as we observe appreciable radar scatters from those MLT sectors. Mostly IMF Bz was northward in the beginning of FBAE, however By having a weak (~0 nT) value but, changing signs. During the northward IMF the dayside contributions are negligible and the cross polar cap potential is entirely due to the nightside reconnection. On the other hand, during BBAE we see a full two cell convection pattern. IMF Bz was almost southward during the entire BBAE. As we know that for southward IMF, cross polar cap potential is mostly due to the day side contribution by 2–4% more than due to the night side reconnection (Connor et al., 2014). The IMF By negative turning at ~21:30 UT seems the main transient for shifting of the aurora producing plasma to the polar cap.
Summary and Conclusions
Recently, ionospheric scintillation studies related to the auroral emission at the polar latitude have attracted Space physics community, but, the scintillation features associated with the different aural emission structures are ambiguous. This research study focuses on the three main points, which we think are of a great scientific interest. Our principle objective is to introduce for the first time two distinct type of the long term auroral emission structures which are rare in occurrence. These auroral structures are defined based on their auroral emission boundary movement. The next important point of this paper is presenting observations related to the ionospheric scintillation occurrence around the magnetic midnight sector at the equatorward as well as at the poleward boundaries of these two auroral emission structures. The last important point of the presented study is the comparison of the IMF conditions during the two distinct auroral events. The points discussed above were untouched and we have attempted them for the first time. The summary of the main highlights of the presented study is as given below.
We consider the ≥40% drop in the auroral emission intensity as the boundary. The movements of the auroral emission boundaries are of two types, FBAE (in which lower boundary of the auroral emission is merely constant while the upper boundaries enhancement is ≤ 5% of its lowest value) and BBAE (upper and lower boundaries of the auroral emissions are very dynamic and they fluctuate more than 5% of their lowest value during the auroral event). We could track the FBAE using PYK and HAN radars single beam, but, we could see only the part of signatures of the BBAE using these radar scans. The GPS scintillation receiver at CYRS, Svalbard gives us much localized results associated with both the auroral emissions. There is no doubt that GPS receiver's field of view is much wider than the ASI deployed at CYRS Svalbard, but, we are considering only those observations which are close to the ASI observations. OVATION maps used in this study are very crucial as they are helping in understanding the differences in the magnetospheric conditions, which give rise to the different auroral emission structures. The distinct auroral structures are observed when the significant magnetospheric particle precipitation meets the appropriate geomagnetic conditions. During the BBAE we have dayside as well as nightside contributions all together. The conclusions of the presented night time auroral observation and their associated ionospheric scintillation behaviors are as follows;
1. At CYRS Ny-Ålesund, in the Arctic we have observed two kinds of night time auroral emissions, which are fixed boundary auroral emission (FBAE) and bouncing boundary auroral emission (BBAE).
2. The auroral emissions are a consequence of extremely localized ionospheric irregularities. Amplitude and phase scintillation regions are co-located with the intense auroral emissions. We have very limited scintillation observations during the FBAE as compared to the BBAE, however, the S4 and σϕ both are quite equivalent during the FBAE. But, during the BBAE, σϕ seems more promising.
3. FBAE is mostly due to the precipitation of few keV particles during the quiet geomagnetic condition (Ching, 1981; Lassen and Danielsen, 1989). The IMF By/Bz was changing its sign throughout the FBAE. However, BBAE is the results of large precipitation of the energetic particles during the disturbed geomagnetic condition.
4. A significant and nearly constant southward IMF Bz, steady negative/positive value of IMF By and AE (auroral electrojet) index of ~400 or more), is more likely to generate BBAE and strong phase scintillations.
5. BBAE seems mostly due to the irregularities generated through the large scale structured fluxes of precipitated electrons near the magnetic midnight regions.
6. The east/west nightside auroral ionospheric current components, IU and IL turned to a significant negative value during the poleward movement of the auroral structures. During the FBAE, IU, and IL, have mostly zero numerical value throughout the auroral emission. However, they were, significantly negative during the BBAE's poleward auroral emission structure shrink.
Author Contributions
SP is the first and corresponding author of the manuscript, Q-HZ helped in editing and scientifically improving the paper, YM helped in the aurora data processing, ZX collected observation of the auroral and scintillation data. Z-JH and GL provided raw scintillation and aurora data.
Conflict of Interest Statement
The authors declare that the research was conducted in the absence of any commercial or financial relationships that could be construed as a potential conflict of interest.
The reviewer CX and handling editor declared their shared affiliation.
Acknowledgments
This research work was supported by the China Postdoctoral International Exchange Program grant from the Institute of Space Sciences Shandong University, China; the National Natural Science Foundation (grants 41574138, 41274149, and 41274148); the Shandong Provincial Natural Science Foundation (grant JQ201412); and the International Collaboration Supporting Project, Chinese Arctic and Antarctic Administration (IC201511). We have used data from the NASAOMINIWEB server [http://omniweb.gsfc.nasa.gov/] and have used OVATION display (http://www.jhuapl.edu/Aurora/ovation/ovation_display.html). International Monitor for Auroral Geomagnetic Effects (IMAGE) data are also used in the presented research work, which is freely available at http://space.fmi.fi/image/beta/?page=il_index. We also acknowledge the use of SuperDARN data. SuperDARN is a collection of radars funded by national scientific funding agencies of Australia, Canada, China, France, Japan, South Africa, United Kingdom, and United States of America.
References
Ahn, B.-H., Emery, B., Kroehl, H., and Kamide, Y. (1999). Climatological characteristics of the auroral ionosphere in terms of electric field and ionospheric conductance. J. Geophys. Res. 104, 10031–10040. doi: 10.1029/1999JA900043
Ahn, B.-H., Kroehl, H., Kamide, Y., and Kihn, E. (2000). Seasonal and solar cycle variations of the auroral electrojet indices. J. Atmos. Sol. Terr. Phys. 62, 1301–1310. doi: 10.1016/S1364-6826(00)00073-0
Baddeley, L. J., Lorentzen, D. A., Partamies, N., Denig, M., Pilipenko, V. A., Oksavik, K., et al. (2017). Equatorward propagating auroral arcs driven by ULF wave activity: multipoint ground- and space-based observations in the dusk sector auroral oval. J. Geophys. Res. Space Phys. 122, 5591–5605. doi: 10.1002/2016JA023427
Baker, K. B., Dudeney, J. R., Greenwald, R. A., Pinnock, M., Newell, P. T., Rodger, A. S., et al. (1995). HF radar signatures of the cusp and low-latitude boundary layer. J. Geophys. Res. 100, 7671–7695. doi: 10.1029/94JA01481
Basu, S., and Basu, S. (1993). “Ionospheric structures and scintillation spectra,” in Wave Propagation in Random Media (Scin-tillation), eds V. I. Tatarski, A. Ishimaru, and V. U. Zavorotny (Bellingham, WA: The International Society for Optical Engineering), 139–153.
Bhattacharyya, A., Yeh, K. C., and Franke, S. J. (1992). Deducting turbulence parameters from transionospheric scintillation measurements. Space Sci. Rev. 61, 335–386. doi: 10.1007/BF00222311
Boudouridis, A., Lyons, L. R., Zesta, E., Ruohoniemi, J. M., and Lummerzheim, D. (2008). Nightside flow enhancement associated with solar wind dynamic pressure driven reconnection. J. Geophys. Res. 113:A12211. doi: 10.1029/2008JA013489
Browett, S. D., Fear, R. C., Grocott, A., and Milan, S. E. (2017). Timescales for the penetration of IMF By into the Earth's magnetotail. J. Geophys. Res. Space Phys. 122, 579–593. doi: 10.1002/2016JA023198
Chen, X.-C., Han, D.-S., Lorentzen, D. A., Oksavik, K., Moen, J. I., and Baddeley, L. J. (2017). Dynamic properties of throat aurora revealed by simultaneous ground and satellite observations. J. Geophys. Res. Space Phys. 122, 3469–3486. doi: 10.1002/2016JA023033
Ching, I. M. (1981). The auroral electron precipitation during extremely quiet geomagnetic conditions. J. Geophys. Res. 86, 4607–4627.
Coker, C., Bust, G. S., Doe, R. A., and Gaussiran, T. L. (2004). High-latitude plasma structure and scintillation. Radio Sci. 39, 1–10. doi: 10.1029/2002RS002833
Connor, H. K., Zesta, E., Ober, D. M., and Raeder, J. (2014). The relation between transpolar potential and reconnection rates during sudden enhancement of solar wind dynamic pressure: openGGCM-CTIM results. J. Geophys. Res. Space Phys. 119, 3411–3429. doi: 10.1002/2013JA019728
Crowley, G., Ridley, A. J., Deinst, D., Wing, S., Knipp, D. J., Emery, B. A., et al. (2000). Transformation of high-latitude ionospheric F region patches into blobs during the March 21, 1990, storm. J. Geophys. Res. 105, 5215–5230. doi: 10.1029/1999JA900357
Davis, T. N., and Sugiura, M. (1966). Auroral electrojet activity index AE and its universal time variations. J. Geophys. Res. 71, 785–801, doi: 10.1029/JZ071i003p00785
De Franceschi, G., Alfonsi, L., Romano, V., Aquino, M., Dodson, A., Mitchell, C. N., et al. (2008). Dynamics of high latitude patches and associated small-scale irregularities during the October and November 2003 storms. J. Atmos. Sol. Terr. Phys. 70, 879–888. doi: 10.1016/j.jastp.2007.05.018
de la Beaujardiere, O., Lyons, L. R., and Frijs-Christensen, E. (1991). Sondrestrom radar measurements of the reconnection electric field. J. Geophys. Res. 96, 13907–13912. doi: 10.1029/91JA01174
de la Beaujardière, O., Lyons, L. R., Ruohoniemi, J. M., Friis-Christensen, E., Danielsen, C., Rich, F. J., et al. (1994). Quiet-time intensifications along the poleward auroral boundary near midnight. J. Geophys. Res. 99, 287–298.
Dungey, J. W. (1961). Interplanetary magnetic field and the auroral zones. Phys. Rev. Lett. 6, 47–48.
Feldstein, Y. I., and Galperin, Y. I. (1985). The auroral luminosity structure in the high-latitude upper atmosphere: its dynamics and relationship to the large-scale structure of the Earth's magnetosphere. Rev. Geophys. 23, 217–275 doi: 10.1029/RG023i003p00217
Fukui, K., Buchau, J., and Valladares, C. E. (1994). Convection of polar cap patches observed at the Qaanaaq Greenland during winter of 1989–1990. Radio Sci. 29, 231–248. doi: 10.1029/93RS01510
Gauld, J. K., Yeoman, T. K., Davies, J. A., Milan, S. E., and Honary, F. (2002). SuperDARN radar HF propagation and absorption response to the substorm expansion phase. Ann. Geophys. Eur. Geosci. Union 20, 1631–1645. doi: 10.5194/angeo-20-1631-2002
Greenwald, R. A., Ecklund, W. L., and Balsley, B. B. (1973). Auroral currents, irregularities, and luminosity. J. Geophys. Res. 78, 8193–8203. doi: 10.1029/JA078i034p08193
Guo, J., Feng, X., Pulkkinen, T. I., Tanskanen, E. I., Xu, W., Lei, J., et al. (2012). Auroral electrojets variations caused by recurrent high-speed solar wind streams during the extreme solar minimum of 2008. J. Geophys. Res. 117:A04307 doi: 10.1029/2011JA017458
Hosokawa, K., Otsuka, Y., Ogawa, Y., and Tsugawa, T. (2014). Observations of GPS scintillation during an isolated auroral substorm. Prog. Earth Planet Sci. 1, 1–9. doi: 10.1186/2197-4284-1-16
Hosokawa, K., Taguchi, S., and Ogawa, Y. (2016). Periodic creation of polar cap patches from auroral transients in the cusp. J. Geophys. Res. Space Phys. 121, 5639–5652. doi: 10.1002/2015JA022221
Hosokawa, K., Taguchi, S., Ogawa, Y., and Aoki, T. (2012). Periodicities of polar cap patches. J. Geophys. Res. Space Phys. 118, 447–453. doi: 10.1029/2012JA018165
Hu, Z. J., Yang, H., Huang, D., Araki, T., Sato, N., Taguchi, M., et al. (2009). Synoptic distribution of dayside aurora: multiple-wavelength all-sky observation at Yellow River Station in Nyᴼ Alesund, Svalbard. J. Atmos. Solar Terr. Phys. 71, 794–804. doi: 10.1016/j.jastp.2009.02.010
Jiao, Y., Morton, Y. T., Taylor, S., and Pelgrum, W. (2013). Characterization of high-latitude ionospheric scintillation of GPS signals. Radio Sci. 48, 698–708. doi: 10.1002/2013RS005259
Jin, Y., Moen, J. I., and Miloch, W. J. (2014). GPS scintillation effects associated with polar cap patches and substorm auroral activity: direct comparison. J. Space Weather Space Clim. 4:A23. doi: 10.1051/swsc/2014019
Jin, Y., Moen, J. I., and Miloch, W. J. (2015). On the collocation of the cusp aurora and the GPS phase scintillation: a statistical study. J. Geophys. Res. Space Phys. 120, 9176–9191. doi: 10.1002/2015JA021449
Jin, Y., Moen, J. I., Miloch, W. J., Clausen, L. B. N., and Oksavik, K. (2016). Statistical study of the GNSS phase scintillation associated with two types of auroral blobs. J. Geophys. Res. Space Phys. 121, 4679–4697. doi: 10.1002/2016JA022613
Jin, Y., Moen, J. I., Oksavik, K., Spicher, A., Clausen, L. B. N., and Miloch, W. J. (2017). GPS scintillations associated with cusp dynamics and polar cap patches. J. Space Weather Space Clim. 7:A23. doi: 10.1051/swsc/2017022
Kamide, Y., and Akasofu, S.-I. (1983). Notes on the auroral electrojet indices. Rev. Geophys. 21, 1647–1656. doi: 10.1029/RG021i007p01647
Kamide, Y., and Kokubun, S. (1996). Two-component auroral electrojet: importance for substorm studies. J. Geophys. Res. 101, 13027–13046. doi: 10.1029/96JA00142
Kauristie, K., Pulkkinen, T. I., Pellinen, R. J., and Opgenoorth, H. J. (1996). What can we tell about global auroral-electrojet activity from a single meridional magnetometer chain? Ann. Geophys. 14, 1177–1185.
Kauristie, K., Sergeev, V. A., Amm, O., Kubyshkina, M. V., Jussila, J., Donovan, E., et al. (2003). Bursty bulk flow intrusion to the inner plasma sheet as inferred from auroral observations. J. Geophys. Res. 108:1040. doi: 10.1029/2002JA009371
Kinrade, J., Mitchell, C. N., Smith, N. D., Ebihara, Y., Weatherwax, A. T., and Bust, G. S. (2013). GPS phase scintillation associated with optical auroral emissions: first statistical results from the geographic South Pole. J. Geophys. Res. Space Phys. 118, 2490–2502. doi: 10.1002/jgra.50214
Kintner, P. M., Ledvina, B. M., and de Paula, E. R. (2007). GPS and ionospheric scintillations. Space Weather 5, 1–13. doi: 10.1029/2006SW000260
Kivanç, Ö., and Heelis, R. A. (1997). Structures in ionospheric number density and velocity associated with polar cap ionization patches. J. Geophys. Res. Space Phys. 102, 307–318. doi: 10.1029/96JA03141
Kullen, A., Fear, R. C., Milan, S. E., Carter, J. A., and Karlsson, T. (2015). The statistical difference between bending arcs and regular polar arcs. J. Geophys. Res. 120, 10443–10465. doi: 10.1002/2015JA021298
Lassen, K., and Danielsen, C. (1989). Distribution of auroral arcs during quiet geomagnetic conditions. J. Geophys. Res. 94, 2587–2594. doi: 10.1029/JA094iA03p02587
Lee, D.-Y., Ohtani, S., and Lee, J. H. (2010). On the poleward boundary of the nightside auroral oval under northward interplanetary magnetic field conditions. J. Geophys. Res. 115:A08204. doi: 10.1029/2009JA014906
Li, G., Ning, B., Ren, Z., and Hu, L. (2010). Statistics of GPS ionospheric scintillation and irregularities over polar regions at solar minimum. GPS Solutions 14, 331–341. doi: 10.1007/s10291-009-0156-x
Liu, J., Hu, H., Han, D., Yang, H., and Lester, M. (2015). Simultaneous ground-based optical and SuperDARN observations of the shock aurora at MLT noon. Earth Planets Space 67:120. doi: 10.1186/s40623-015-0291-2
Liu, R.-Y., Liu, Y.-H., Xu, Z.-H., Hu, H.-Q., Yang, H.-G., Zhang, B.-C., et al. (2005). The Chinese ground-based instrumentation in support of the combined Cluster/Double Star satellite measurements. Ann. Geophys. 23, 2943–2951. doi: 10.5194/angeo-23-2943-2005
Lyons, L. R., Nishimura, Y., Gallardo-Lacourt, B., Zou, Y., Donovan, E. F., Mende, S., et al. (2015). “Dynamics related to plasmasheet flow bursts as revealed from the aurora,” in Auroral Dynamics and Space Weather, eds Y. Zhang and L. J. Paxton (Hoboken, NJ: John Wiley & Sons Inc), 95–114.
Lyons, L. R., Zesta, E., Samson, J. C., and Reeves, G. D. (2000). Auroral disturbances during the January 10, 1997 magnetic storm. Geophys. Res. Lett. 27, 3237–3240. doi: 10.1029/1999GL000014
Mitchell, C. N., Alfonsi, L., Defranceschi, G., Lester, M., Romano, V., and Wernik, A. W. (2005). GPS TEC and scintillation measurements from the polar ionosphere during the October 2003 storm. Geophys. Res. Lett. 32:L12S03. doi: 10.1029/2004GL021644
Moen, J., Oksavik, K., Alfonsi, L., Daabakk, Y., Romano, V., and Spogli, L. (2013). Space weather challenges of the polar cap ionosphere. J. Space Weather Space Clim. 3:A02. doi: 10.1051/swsc/2013025
Moskaleva, E. V., and Zaalov, N. Y. (2013). Signature of polar cap inhomogeneities in vertical sounding data. Radio Sci. 48, 547–563. doi: 10.1002/rds.20060
Nakai, H., and Kamide, Y. (1983). Response of nightside auroral-oval boundaries to the interplanetary magnetic field. J. Geophys. Res. 88, 4005–4014. doi: 10.1029/JA088iA05p04005
Newell, P. T., Meng, C.-I., Sotirelis, T., and Liou, K. (2001). Polar Ultraviolet Imager observations of global auroral power as a function of polar cap size and magnetotail stretching. J. Geophys. Res. 106, 5895–5905. doi: 10.1029/2000JA003034
Oksavik, K., Moen, J. I., Rekaa, E. H., Carlson, H. C., and Lester, M. (2011). Reversed flow events in the cusp ionosphere detected by SuperDARN HF radars, J. Geophys. Res. 116:A12303. doi: 10.1029/2011JA016788
Oksavik, K., van der Meeren, C., Lorentzen, D. A., Baddeley, L. J., and Moen, J. (2015). Scintillation and loss of signal lock from poleward moving auroral forms in the cusp ionosphere. J. Geophys. Res. Space Phys. 120, 9161–9175. doi: 10.1002/2015JA021528
Ponomarenko, P. V., and Waters, C. L. (2005). Spectral width of SuperDARN echoes: measurement, use and physical interpretation. Ann. Geophys. 24, 115–128. doi: 10.5194/angeo-24-115-2006
Prikryl, P., Jayachandran, P. T., Mushini, S. C., and Chadwick, R. (2011). Climatology of GPS phase scintillation and HF radar backscatter for the high-latitude ionosphere under solar minimum conditions. Ann. Geophys. 29, 377–392. doi: 10.5194/angeo-29-377-2011
Prikryl, P., Jayachandran, P. T., Mushini, S. C., Chadwick, R., and Kelly, T. D. (2015). Climatology of GPS phase scintillation at northern high latitudes for the period from 2008 to 2013. Ann. Geophys. 33, 531–545. doi: 10.5194/angeo-33-531-2015
Prikryl, P., Jayachandran, P. T., Mushini, S. C., Pokhotelov, D., MacDougall, J. W., Donovan, E., et al. (2010). GPS TEC, scintillation and cycle slips observed at high latitudes during solar minimum. Ann. Geophys. 28, 1307–1316. doi: 10.5194/angeo-28-1307-2010
Prikryl, P., Jayachandran, P. T., Mushini, S. C., and Richardson, I. G. (2014). High-latitude GPS phase scintillation and cycle slips during high-speed solar wind streams and interplanetary coronal mass ejections: a superposed epoch analysis. Earth Planets Space 66:62. doi: 10.1186/1880-5981-66-62
Priyadarshi, S. (2015). Ionospheric scintillation modeling for high- and mid-latitude using B-spline technique. Astrophys. Space Sci. 359, 1–8. doi: 10.1007/s10509-015-2461-x
Priyadarshi, S., and Wernik, A. W. (2013). Variation of the ionospheric scintillation index with elevation angle of the transmitter. Acta Geophys. 61, 1279–1288. doi: 10.2478/s11600-013-0123-3
Rinne, Y., Moen, J., Carlson, H. C., and Hairston, M. R. (2010). Stratification of east-west plasma flow channels observed in the ionospheric cusp in response to IMF BY polarity changes. Geophys. Res. Lett. 37:L13102. doi: 10.1029/2010GL043307
Rinne, Y., Moen, J., Oksavik, K., and Carlson, H. C. (2007). Reversed flow events in the winter cusp ionosphere observed by the European Incoherent Scatter (EISCAT) Svalbard radar. J. Geophys. Res. Space Phys. 112:A10313. doi: 10.1029/2007JA012366
Sato, N., Nagaoka, T., and Hashimoto, K. (1998). Conjugacy of isolated auroral arcs and nonconjugate auroral breakups. J. Geophys. Res. 103, 11641–11652. doi: 10.1029/98JA00461
Sergeev, V. A., Aulamo, O. A., Pellinen, R. J., Vallinkoski, M. K., Bösinger, T., Cattell, C. A., et al. (1990). Non-substorm transient injection events in the ionosphere and magnetosphere. Planet. Space Sci. 38, 231–239.
Sergeev, V. A., Sauvaud, J. A., Popescu, D., Kovrazhkin, R. A., Lutsenko, V. N., Zelenyi, L. M., et al. (2000). Plasma sheet ion injections into the auroral bulge: correlative study of spacecraft and ground observations. J. Geophys. Res. 105, 18465–18481. doi: 10.1029/1999JA900435
Shiokawa, K., Hashimoto, A., Hori, T., Sakaguchi, K., Ogawa, Y., Donovan, E., et al. (2014). Auroral fragmentation into patches. J. Geophys. Res. Space Phys. 119, 8249–8261. doi: 10.1002/2014JA020050
Siscoe, G. L. (1991). “What determines the size of the auroral oval,” in Auroral Physics, eds C. I Meng, M. J. Rycroft, and L. A. Frank (New York, NY: Cambridge Univ. Press), 159–175.
Solovyev, S. I., Baishev, D. G., Barkova, E. S., Engbretson, M. J., Posch, J. L., Hughes, W. J., et al. (1999). Structure of disturbances in the dayside and nightside ionosphere during periods of negative interplanetary magnetic field Bz. J. Geophys. Res. 104, 28019–28039.
Sotirelis, T., and Newell, P. T. (2000). Boundary-oriented electron precipitation model. J. Geophys. Res. 105, 18655–18673. doi: 10.1029/1999JA000269
Sotirelis, T., Newell, P. T., and Meng, C.-I. (1998). The shape of the open-closed boundary of the polar cap as determined from observations of precipitating particles by up to four DMSP satellites. J. Geophys. Res. 103, 399–406. doi: 10.1029/97JA02437
Spogli, L., Alfonsi, L., Defranceschi, G., Romano, V., Aquino, M. H. O., and Dodson, A. (2009). Climatology of GPS ionospheric scintillations over high and mid-latitude European regions. Ann. Geophys. 27, 3429–3437. doi: 10.5194/angeo-27-3429-2009
Tenfjord, P., Østgaard, N., Strangeway, R., Haaland, S., Snekvik, K., Laundal, K. M., et al. (2017). Magnetospheric response and reconfiguration times following IMF By reversals. J. Geophys. Res. Space Phys. 122, 417–431. doi: 10.1002/2016JA023018
van der Meeren, C., Oksavik, K., Lorentzen, D. A., Paxton, L. J., and Clausen, L. B. N. (2016). Scintillation and irregularities from the nightside part of a Sun-aligned polar cap arc. J. Geophys. Res. Space Phys. 121, 5723–5736. doi: 10.1002/2016JA022708
van der Meeren, C., Oksavik, K., Lorentzen, D. A., Rietveld, M. T., and NClausen, L. B. (2015). Severe and localized GNSS scintillation at the poleward edge of the nightside auroral oval during intense sub-storm aurora. J. Geophys. Res. Space Phys. 120, 10607–10621. doi: 10.1002/2015JA021819
van der Meeren, C., Oksavik, K., Lorentzen, D., Moen, J. I., and Romano, V. (2014). GPS scintillation and irregularities at the front of an ionization tongue in the night- side polar ionosphere. J. Geophys. Res. Space Phys. 119, 8624–8636. doi: 10.1002/2014JA020114
Van Dierendonck, A. J., Klobuchar, J., and Hua, Q. (1993). “Ionospheric scintillation monitoring using commercial single frequency C/A code receivers,” in Proceedings of the 6th International Technical Meeting of the Satellite Division of The Institute of Navigation (ION GPS-93) (Arlington, TX: The Institute of Navigation), 1333–1342.
Wang, Y., Zhang, Q.-H., Jayachadran, P. T., Lockwood, M., Zhang, S.-R., Moen, J., et al. (2016). A comparison between large-scale irregularities and scintillations in the polar ionosphere. Geophys. Res. Lett. 43, 4790–4798. doi: 10.1002/2016GL069230
Wernik, A. W., Alfonsi, L., and Materassi, M. (2004). Ionospheric irregularities, scintillation and its effect on systems. Acta Geophys. Polon. 52, 237–249.
Yeh, K. C., and Liu, C. H. (1982). Radio wave scintillation in the ionosphere. Proc. IEEE 70, 324–360.
Yeh, K. C., and Wernik, A. W. (1993). “On ionospheric scintillation,” in Wave Propagation in Random Media (Scintillation), ed V. I. Tatarskiĭ, A. Ishimaru, and V. U. Zavorotny (Bellingham, WA: The International Society for Optical Engineering), 34–49.
Zesta, E., Donovan, E., Lyons, L., Enno, G., Murphree, J. S., and Cogger, L. (2002). Two-dimensional structure of auroral poleward boundary intensifications. J. Geophys. Res. 107, SIA 6-1–SIA 6-20. doi: 10.1029/2001JA000260
Zhang, Q.-H., Dunlop, M. W., Lockwood, M., Liu, R. –Y., Hu, H. –Q., and Yang, H. –G. (2010). Simultaneous observations of reconnection pulses at Cluster and their effects on the cusp aurora seen at Chinese Yellow River Station. J. Geophys. Res. 115:A10237. doi: 10.1029/2010JA015526
Zhang, Q.-H., Hang, B.-C., Moen, J., Lockwood, M., McCrea, I. W., Yang, H.-G., et al. (2013a). Polar cap patch segmentation of the tongue of ionization in the morning convection cell. Geophys. Res. Lett. 40, 2918–2922. doi: 10.1002/grl.50616
Zhang, Q.-H., Lockwood, M., Foster, J. C., Zhang, S.-R., Zhang, B.-C., McCrea, I. W., et al. (2015). Direct observations of the full Dungey convection cycle in the polar ionosphere for southward interplanetary magnetic field conditions. J. Geophys. Res. Space Phys. 120, 4519–4530. doi: 10.1002/2015JA021172
Zhang, Q.-H., Ma, Y. Z., Jayachandran, P. T., Moen, J., Lockwood, M., Zhang, Y. L., et al. (2017). Polar cap hot patches: enhanced density structures different from the classical patches in the ionosphere. Geophys. Res. Lett. 44, 8159–8167. doi: 10.1002/2017GL073439
Zhang, Q.-H., Zhang, B.-C., Liu, R.-Y., Dunlop, M. W., Lockwood, M., Moen, J., et al. (2011). On the importance of interplanetary magnetic field |By| on polar cap patch formation. J. Geophys. Res. 116:A05308. doi: 10.1029/2010JA016287
Zhang, Q.-H., Zhang, B.-C., Lockwood, M., Hu, H.-Q., Moen, J., Ruohoniemi, J. M., et al. (2013b). Direct observations of the evolution of polar cap ionization patches. Science 339, 1597–1600. doi: 10.1126/science.1231487
Zhang, Q.-H., Zong, Q. G., Lockwood, M., Heelis, R. A., Hairston, M., Liang, J., et al. (2016). Earth's ion upflow associated with polar cap patches: Global and in situ observations. Geophys. Res. Lett. 43, 1845–1853. doi: 10.1002/2016GL067897
Keywords: polar ionosphere, scintillation, nighttime aurora, GPS, GNSS etc.
Citation: Priyadarshi S, Zhang Q-H, Ma Y, Xing Z, Hu Z-J and Li G (2018) The Behaviors of Ionospheric Scintillations Around Different Types of Nightside Auroral Boundaries Seen at the Chinese Yellow River Station, Svalbard. Front. Astron. Space Sci. 5:26. doi: 10.3389/fspas.2018.00026
Received: 28 March 2018; Accepted: 23 July 2018;
Published: 14 August 2018.
Edited by:
Hermann Lühr, Helmholtz-Zentrum Potsdam Deutsches Geoforschungszentrum, Helmholtz-Gemeinschaft Deutscher Forschungszentren (HZ), GermanyReviewed by:
Chao Xiong, Helmholtz-Zentrum Potsdam Deutsches Geoforschungszentrum, Helmholtz-Gemeinschaft Deutscher Forschungszentren (HZ), GermanyGeorgios Balasis, National Observatory of Athens, Greece
Copyright © 2018 Priyadarshi, Zhang, Ma, Xing, Hu and Li. This is an open-access article distributed under the terms of the Creative Commons Attribution License (CC BY). The use, distribution or reproduction in other forums is permitted, provided the original author(s) and the copyright owner(s) are credited and that the original publication in this journal is cited, in accordance with accepted academic practice. No use, distribution or reproduction is permitted which does not comply with these terms.
*Correspondence: Shishir Priyadarshi, c3ByaXlhZGFyc2hpQHNkdS5lZHUuY24=
Qing-He Zhang, emhhbmdxaW5naGVAc2R1LmVkdS5jbg==