 W. Holmes Finch
- Educational Psychology, Ball State University, Muncie, IN, USA
Multivariate analysis of variance (MANOVA) is a widely used technique for simultaneously comparing means for multiple dependent variables across two or more groups. MANOVA rests on several assumptions, including that of multivariate normality. Much prior research has investigated the performance of standard MANOVA with continuous, nonnormally distributed variables. However, very little work has examined its performance when the dependent variables are ordinal in nature. Therefore, the current study was designed to investigate the performance of standard MANOVA with ordinal dependent variables, and to compare it with several alternatives that might prove superior in this context. Results of the simulation study demonstrated that methods based on ranks, and spatial ranks and signs were optimal in terms of controlling the Type I error rate and maintaining reasonably high power. All of the methods considered here were applied to an existing dataset, and implications of the study results for practice are discussed.
Introduction
Frequently, researchers in the social sciences are interested in testing the null hypothesis of equality of means for several variables across multiple groups. For example, it may be of interest to compare performance on several measures of academic achievement between males and females, or among groups representing different methods of instruction. Due to its ease of use, familiarity, and clear interpretation, researchers will sometimes address the comparison of group means on several dependent variables using a series of independent univariate Analysis of Variance (ANOVA) models. In the previous example, three separate ANOVA models, one each for math, reading, and science achievement, could be fit to the data in order to determine whether mean academic achievement differed between males and females. Although easy to use and interpret, this approach to comparing multivariate means can lead to spurious conclusions due to inflation of the family-wise Type I error rate, and a potential decrease in power when the dependent variables are correlated with one another but are analyzed using separate models [1]. Perhaps more importantly, in the presence of multivariate data such as that described above, the research question(s) of interest may center on how groups differ along a combination of dimensions or variables, rather than a single variable at a time. Univariate methods like ANOVA are not designed to address such questions. In such situations, multivariate analysis of variance (MANOVA) is generally the preferred method for comparing group means on multiple dependent variables simultaneously, when those variables are conceptually and statistically related and the research hypotheses treat the variables in a unitary fashion (Huberty and Olejnik).
MANOVA rests upon several assumptions about the nature of the data, including multivariate normality, equal covariance matrices across groups, and uncorrelated model errors. A number of statistical methods have been designed for conducting MANOVA when one or more of these assumptions are not met. Much of the research examining these approaches has focused on the case of nonnormal continuous data [e.g., 2–8]. However, in some situations, the researcher may be interested in simultaneously comparing the means of multiple ordinal variables, such as responses to likert questionnaire items, across groups. When using such items, the researcher may assume that there is an underlying continuous latent variable, and that the ordered categories are the observed realizations produced by the measurement process to represent this latent construct. Such might be the case, for example, when school psychologists rate a child's behavior on a likert-type scale, or when observed score teachers in terms of their classroom management skills using an ordinal rating rubric. Relatively little work has examined how best to address this problem in the context of MANOVA, despite the fact that such comparisons are not at all uncommon in the research literature [e.g., 9–12]. Therefore, the purpose of this simulation study was to investigate the performance of several approaches for multivariate means comparisons that may be particularly useful for ordinal dependent variables.
Standard Parametric Multivariate Means Comparisons
As noted above, MANOVA is often seen as the preferred approach for comparing group means on multiple dependent variables because it controls for inflation of the Type I error rate, and accounts for correlations among a set of conceptually related dependent variables [13, 14]. The null hypothesis of no difference on the multivariate dependent variable means for the two groups case is tested with Hotelling's T2 statistic:
Where
Mean vector for group 1
Mean vector for group 2
n1 = Sample size for group 1
n2 = Sample size for group 2
S = Sample pooled covariance matrix;
S1 = Covariance matrix for group 1
S2 = Covariance matrix for group 2
When means for more than two groups are to be compared, there are four different commonly used multivariate statistics that can be converted to an approximation of the F statistic, including Pillai's trace, (P) Wilk's lambda (Λ), Hotelling-Lawley Trace (H) and Roy's Greatest Root (R). These test statistics can be expressed as follows:
Where W = within group sum of squares and cross products matrix
B = between group sum of squaresand cross products matrix
Performance of MANOVA When Assumptions Are Violated
As mentioned above, the standard hypothesis tests used with MANOVA all rely upon assumptions regarding the data, including multivariate normality, equal group covariance matrices, and independence of model errors. When these assumptions are met, the standard MANOVA statistics perform well in terms of controlling the Type I error rate, and maintaining appropriate power. However, research has shown that when one or more of these assumptions is violated, the standard MANOVA test statistics yield inflated Type I error rates and diminished statistical power for detecting group differences [e.g., 15–19]. Simulation study results have shown clearly that the performance of Pillai's Trace, Wilk's Lambda, Hotelling-Lawley's Trace and Roy's Greatest Root can be severely compromised when there are violations in the assumption of equality of covariance matrices [2, 17, 20, 21]. In particular, when group covariance matrices are not equivalent in the two groups case, and the smaller group has the larger variance, Type I error rates will be inflated, whereas when the larger group has the larger variance power is reduced. In addition, the presence of skewed dependent variables has also been shown to be related to reductions in power for correctly identifying group differences [2, 20, 22]. The results of these prior studies has also indicated that no one of the standard MANOVA test statistics is clearly optimal under in all situations when the assumptions are violated, though all generally perform poorly in such situations [18, 19, 23].
Synthesizing these results, prior research has demonstrated that the standard test statistics used with MANOVA are deleteriously impacted by violations of the assumptions of multivariate normality and homogeneity of covariance matrices. With respect to MANOVA in the nonmultivariate normal case, nearly all of the simulation work has focused on continuous data that is skewed and/or kurtotic. In response to this type of data structure, a number of robust statistics have been suggested for use, of which several (e.g., Yao's F test, the Brown-Forsythe F test) have been shown to perform better (maintain the nominal Type I error rate and render power above 0.8) than the standard MANOVA tests when the dependent values are skewed [2, 3, 24–26]. In contrast, very little research has been conducted to investigate how MANOVA methods work when the dependent variables are ordinal in nature. Yet, researchers frequently use MANOVA to compare group means on several likert-type items at once [e.g., 9–12]. It is unclear the extent to which such practice is optimal, given the fact that these ordinal variables may not satisfy the assumptions underlying standard MANVOA, particularly that of multivariate normality. In the univariate case, analysis of models with ordinal dependent variables such as likert-type items is generally carried out using some variation of logistic regression [27]. However, in the context of multivariate responses analogous multivariate logistic regression models are not readily available, leaving the researcher faced with the aforementioned problems associated with conducting multiple univariate analyses. Therefore, it is important that methods for multivariate comparisons appropriate for use with ordinal data be available and well understood so that applied researchers can have access to them. The goal of this study, therefore, was to examine the performance of several such methods. The techniques that were included in the study are, at least theoretically, most appropriate for use with ordinal data such as that produced by likert-type items, because they do not rest on the presumption of continuity that underlies the robust methods mentioned above (e.g., Brown and Forsythe, Yao, etc.). Following is a brief description of the methods that were examined in this study, including discussion of prior research on their performance in analyses when the assumptions underlying the standard MANOVA test statistics are not met.
Permutation Test
One alternative to the standard MANOVA that has been mentioned in the literature for use when the distribution of the dependent variables is not multivariate normal is based on permutation testing [28]. In general, such tests work by creating all possible permutations of the data, and for each of these the statistic(s) of interest is calculated, thereby creating a null distribution for the statistic against which the value taken from the actual data can be compared. In the context of MANOVA, the permutation test would be based on the following steps:
1. Calculate Λ for the original sample.
2. For each possible permutation of the data calculate Λ* to create a distribution of the test statistic under the null hypothesis of no group differences on the means.
3. Compare Λ to the distribution of Λ* values.
4. The p-value is the percentile for Λ in the permuted distribution.
Finch and Davenport [29] investigated the performance of the permutation method with regard to nonnormal continuous data, and found that it provided good Type I error control when the dependent variables were skewed, and that it yielded Type I error and power rates nearly as good as those of the standard test when the data are multivariate normal [29]. The permutation test does not make any assumptions about the scale of the dependent variables (i.e., that they are continuous), and thus may be useful in the current application involving ordinal data [28].
Structural Equation Models for MANOVA Tests
A second approach considered in this study involves the use of structural equation modeling (SEM) for testing the null hypothesis of equal group means for multiple dependent variables [30]. Raykov suggested that this approach may be particularly useful when the assumptions underlying standard MANOVA are not met. The SEM approach for conducting MANOVA is based on the confirmatory factor analysis (CFA) model, which takes the form:
Generally with CFA each latent variable is associated with multiple observed indicator variables. However, when applied to the multivariate means comparison problem each observed dependent variable is related to a single unique latent variable, with the following constraints:
In (7) Ip is the identity matrix and Θ is the covariance matrix for δ, which consists of 0 elements. These constraints imply that each latent variable is exactly equal to one of the observed variables [30], and that the latent variable covariance matrix is identical to the covariance matrix for the observed variables.
In order to test the null hypothesis of equality of multivariate group means on the response variables, we must impose two more restrictions:
These additional restrictions to the model make the comparison of latent means equivalent to a comparison of observed means, which can be done by fitting two CFA models, one in which the latent (and therefore also the observed) variable means are constrained to be equal across groups and the other in which they are allowed to vary. The test of the null hypothesis of group difference on the responses can then be constructed as the difference in the χ2 fit statistics: . When the group means are allowed to differ the resulting CFA model is saturated so that the value of will be 0. Therefore, Raykov [30] showed that the test of the null hypothesis of group differences across the vector of dependent variable means is equivalent to .
Raykov [30] argued that the primary advantage of using the SEM approach to compare multivariate group means is that it may prove to be robust to violations of assumptions underlying the standard MANOVA test statistics. For example, when the assumption of normality is violated, an adjusted version of the χ2 test statistic for nonnormal data, such as the [31] statistic may be appropriate. In addition, for ordinal data the researcher could also elect to use an estimation algorithm designed specifically for use with categorical variables, such as robust weighted least squares (RWLS; [32]). RWLS is an extension of weighted least squares (WLS) estimation [33]. RWLS has been found to provide accurate parameter estimates for ordered categorical observed variables with samples as small as 100, and appears to perform better in such cases than either WLS or maximum likelihood estimation [34, 35]. There are two distinct RWLS estimators, weighted least squares mean adjusted (WLSM) and weighted least squares mean and variance adjusted (WLSMV). Prior research has found that for group comparisons in the context of CFA, the WLSMV is an effective tool [36]. Therefore, the WLSMV estimator was used in the current study. Henceforth, the acronym RWLS will be used to mean WLSMV.
Relatively little empirical research has been conducted to evaluate the effectiveness of the SEM based approach for testing the null hypothesis of multivariate mean equality. Finch and French [2] found that for continuous data in the absence of assumption violations, the Satorra-Bentler corrected χ2 test and the standard MANOVA tests had comparable Type I error rates and power for sample sizes of 100 or more, whereas for smaller samples SEM yielded elevated Type I error rates. When the assumption of multivariate normality was violated, the SEM approach to MANOVA based on the Satorra-Bentler corrected χ2 statsitic exhibited only some Type I error inflation for skewed data, and typically less than the standard test statistic. There does not seem to have been any research done to investigate the performance of the SEM method for MANOVA when the dependent variables are categorical in nature. Given the prior simulation work showing that it worked well with continuous nonnormal data in some situations, the SEM method may also be promising for use with ordinal data, though work needs to be done to determine this.
Nonparametric Wilks Lambda
Liu et al. [37] introduced a fully nonparametric version of Λ that is based upon work of Munzel and Brunner [38]. These earlier authors described a method for calculating Λ that is based on ranks of the observed data, and that can be used when either the sample size or the number of treatment groups tends to infinity. In addition, they described a small sample approximation, which was used in the current study. In this approach, the individual values of the dependent variable are first ranked, independently of one another. The value of Λ is then calculated as:
Where
I = The identity matrix
a = Number of groups
N = Total sample size
k = Number of dependent variables
sum of squares and cross products matrix due to group
Sum of squares and cross products due to error
Mean rank for group j on variable k
Overall mean rank on variable k
Rijk = Rank for individual i in group j on variable k
Mean rank for group j on variable k
In the finite sample case, an approximation of the F statistic is then calculated as:
Where
The resulting FLBH is then referred to the F distribution with df1 and df2, in order to test the null hypothesis of equivalent distributions across groups.
Liu et al. [37] conducted a simulation study comparing the Type I error and power rates of FLBH with those of the standard Λ, as well as a test involving FLBH in which the p-value was obtained through a permutation methodology. The results of this study demonstrated that FLBH generally provided the most accurate hypothesis test results when the underlying distribution of the dependent variables was skewed and/or kurtotic. Liu et al. [37] concluded that FLBH offers researchers a useful alternative to the standard Λ when the data are not multivariate normal, or even continuous. Therefore, it would seem that this nonparametric version of Λ might be particularly appropriate for use with ordinal dependent variables.
Spatial Signs and Spatial Ranks
Another alternative for comparing multivariate measures of location involves the use of spatial signs or spatial ranks. This approach belongs to a larger family of methods based on score centering, and which has been implemented for use in the context of regression, principal components analysis, and univariate means comparisons, as well as the multivariate means comparisons problem examined here [e.g., 39–41]. This general approach has been adapted to the problem of comparing multivariate means when the distribution of the dependent variables cannot be assumed to be multivariate normal [42]. Collectively, the spatial signs and ranks methods work by minimizing an L1 criterion, as opposed to standard least squares based methods, which minimize the L2 criterion. The L2 criterion is simply the familiar sum of squared residuals, whereas the L1 criteria include the Least Absolute Deviation [43], and variations of the Hodges-Lehmann estimators [44].
When applying the spatial signs or spatial ranks to the problem of comparing multivariate means, the researcher must first standardize the data in some fashion. As mentioned above, this can be done using either inner or outer standardization. In the context of MANOVA, the use of outer standardization is appropriate when the dependent variables are on the same scale, whereas when they are not on the same scale, inner standardization should be used [45]. Thus, the decision as to which standardization approach the researcher will use should be based on the nature of the data itself. If the dependent variables are all on the same scale, then outer standardization is appropriate because all of the variables are on a common scale, and standardization of them together will not lead to problems of variables with large scales having more weight in the standardization algorithm than those on small scales. In addition, the method of centering must also be selected, and can involve either inner or outer centering. Centering in the context of this analytic approach is similar in spirit to centering in the context of multilevel data, in that a measure of central tendency is subtracted from each individual value of each dependent variable. The difference is that for some of the methods of centering used here, the mean of the values is replaced with the median or the mean rank, because they are more robust to the presence of outliers than is the mean [39]. The mean is used in one instance, however, along with a robust estimator of the covariance matrix, as is discussed below.
The centering and standardization approaches can be crossed with one another. There is not currently a recommendation for how the centering and standardization methods should be combined. Indeed, any of the 4 combinations (inner centering/inner standardization, inner centering/outer standardization, outer centering/inner standardization, and outer centering/outer standardization) are possible. Oja [46] suggests that further research needs to be conducted in order to identify under what conditions particular combinations of centering and standardization are most appropriate. Thus, one goal of the current study is to help address this issue of which combination of approaches is optimal for multivariate means comparisons under conditions like those simulated here. As an example of how these methods can be combined with one another, spatial signs with inner centering and outer standardization would take the form:
where
xijk = Value of dependent variable k for person i in group j.
M = Spatial Median of dependent variables.
Thus, the value uijk simply reflects the deviation from the median of individual i's value on variable k. The statistic for testing the null hypothesis of equal multivariate means across groups is then:
uj = Mean vector of the centered scores for group j.
The test statistic Q2 is distributed as a χ2 with k(J−1) degrees of freedom.
The hypothesis test using spatial signs with inner centering and inner standardization involves the following calculations. First,
S = Full rank transformation matrix selected so that
Overall mean vector across groups.
All other terms are as defined above. In this case, uijk is the standardized deviation from the mean of individual i's value on variable k using a robust estimator of the covariance matrix. The test statistic is then given as
As was true for the inner centering and inner standardization, Q2 is distributed as χ2 with k(J−1) degrees of freedom.
As mentioned earlier, it is also possible to use the methods described here with ranks, rather than scores. The algorithm involving spatial ranks with outer standardization involves the following steps.
1. Rank the data for each dependent variable.
2. Calculate the mean rank for each group for each dependent variable for each group, .
3.
Where Vector of mean ranks for group j.
In Equation (15) centering is done using the mean of the ranks for the dependent variables. As before, Q2 is distributed as χ2 with k(J−1) degrees of freedom. Finally, testing the null hypothesis of no multivariate group mean differences using spatial ranks with inner standardization can be done using the following steps.
1. Identify the transformation matrix, S, that leads to .
2.
3. Calculate the median rank for each group for each variable and put them together in the vector
4.
Where
Rijk = Rank of individual i in group j on variable k
In Equation (17) centering of the standardized ranks obtained in (16) is done using the median of these standardized values. The test statistic Q2 is distributed as χ2 with k(J−1) degrees of freedom.
There has been some prior research examining the performance of the spatial sign and rank statistics described above. Oja Randles [39] reported that when making multivariate means comparisons with skewed data, the spatial signs and ranks approach yielded better Type I error control than did the standard MANOVA test statistics. Similar results were reported by Rantala and Ilmonen [47], who found, using a simulation study, that the spatial signs and ranks methods yielded better Type I error control than did Wilks Λ when the data contained outliers.
Goals of the Current Study
Prior research has demonstrated the utility of these methods in the context of continuous data that is not multivariate normal, as was cited above. Furthermore, several of them have been recommended for use with categorical dependent variables, such as the permutation approach [28], SEM [2], and rank based methods [48]. These approaches stand in contrast to other robust methods for multivariate means comparisons, which were designed for use with continuous data, and are particularly adept in the context of skewed and kurtotic distributions (e.g., variants of the F statistic by Brown and Forsythe, Yao, and Kim). In some applications, however, a researcher might be interested in comparing the means of multiple ordinal variables across two or more groups, as where the dependent variables are individual likert type items from a questionnaire. In such situations, the data do not conform to the continuity assumed by many of these robust methods, and the alternatives described above may prove to be useful, as they rely either on ranks (or sign scores), permutation methods, or a SEM with estimators designed for categorical data. In addition, they have each shown some promise in the general MANOVA case, so that they can be considered leading candidates for use with MANOVA involving ordinal dependent variables. Therefore, the primary goal of this simulation study was to compare the Type I error and power rates of the methods described above, with respect to the comparison of multivariate means for ordinal variables. A variety of simulation conditions were manipulated, as described below. It is hoped that the results of this work will provide researchers with information regarding which method(s) might be optimal for comparing means on ordinal variables, such as likert type item responses.
Methods
In order to address the goals outlined above, a Monte Carlo simulation study was used. Application of the analyses was also demonstrated with an empirical dataset, which is described below. For each combination of the simulation conditions, 1000 replications were generated. All data were generated using the GenOrd library in the R software environment, version 3.1.0 [49]. GenOrd is designed specifically for simulating data from a multivariate ordinal distribution with a known covariance structure and a specific number of categories for each variable. The data were generated with correlations of 0.5 among all of the dependent variables, and across all conditions two groups were simulated to be present.
Number of Dependent Variables
Three conditions for the number of dependent variables were simulated in this study: 2, 4, or 6. These values were selected in order to represent a range of values that might be seen in practice.
Number of Categories in Dependent Variables
The dependent variables were simulated to be ordinal in nature, and took the values 3, 4, or 5. These values were selected so as to represent a variety of ordinal variables that can be associated with, for example, questions on a survey or other psychological or educational measure.
Sample Size and Group Size Ratio
The sample sizes simulated for this study were 25, 50, 100, 250, or 500 for the first group. In the equal group size condition, the second group was also simulated to have 25, 50, 100, 250, or 500 individuals. Thus, the total sample sizes in the equal group size ratio were 50, 100, 200, 500, or 1000. In the unequal group size ratio condition, the first group was simulated to be of the sizes listed above, and the second group was simulated to have 12, 25, 50, 125, or 250 individuals, leading to total sample sizes of 37, 75, 150, 325, and 750.
Distribution Shape of Dependent Variables
All data were simulated to be ordinal using the GenOrd library, as described above. The dependent variables were simulated to be either symmetric or skewed, with skewness of 1.5. In the ordsample command call, the symmetric marginal values used were (0.3, 0.6), (0.2, 0.5, 0.8), and (0.2, 0.4, 0.6, 0.8). For the assymetric condition, the marginal values that were used were (0.1, 0.4), (0.1, 0.3, 0.5), and (0.1, 0.2, 0.3, 0.4).
Group Difference
The groups were simulated to have mean differences on the dependent variables of 0, 0.25, 0.5, or 0.8. These values represent the situations where groups' means were not different on the dependent variables (0), or differed by a small (0.25), medium (0.5), or large (0.8) amount, based on Cohen [50] suggested guidelines for mean differences.
Multivariate Methods
The methods for comparing group means included in this study were standard MANOVA in the form of Wilks' Λ (manova command in the R MASS library), the SEM approach to multivariate means comparisons was conducted using the WLSMV estimator (R lavaan package), nonparametric Λ (R nonpartest command), permutation test for Λ (R adonis command), spatial signs with inner centering, spatial signs with outer centering, spatial ranks with inner centering, and spatial ranks with outer centering (R MNM and HSAUR libraries).
Outcome Variables in the Study
The outcome variables for this study were the Type I error and power rates for each of the methods. In order to ascertain which of the manipulated study variables, or their interactions were significantly related to Type I error and power rates, a repeated measures analysis of variance (ANOVA) was used. The dependent variable in this analysis was the Type I error or power rate for each combination of conditions (taken across all 1000 replications for that combination), while the within subjects factor was the multivariate method, and the between subjects factors were the number of dependent variables, number of categories per dependent variable, sample size, sample size ratio, and for power the magnitude of mean differences between groups. To be clear, in this ANOVA the observations consisted of the 540 different combinations of manipulated between subjects study conditions, and the dependent variable was the rejection rate for each of these observations, and not the individual binary rejection decisions for each replication. Each of the assumptions of the repeated measures analysis (normality of the errors and sphericity) were assessed and found to hold. In addition to the hypothesis testing results of the ANOVA, the effect size is also reported in the results.
Results
Type I Error Rate
The ANOVA used to identify the statistically significant manipulated factors identified the 3-way interaction of testing method by number of categories and number of dependent variables was significantly related to the Type I error rate [F(8, 158) = 4.873, p < 0.0001, η2 = 0.358]. In addition, the 2-way interaction of method by distribution shape was also significantly related to the Type I error rate [F(4, 158) = 3.099, p < 0.0001, η2 = 0.302]. The top panel of Table 1 contains the Type I error rate by method, number of dependent variables, and the number of categories. With the exception of the SEM approach, all of the methods maintained the Type I error rate at the nominal 0.05 level. SEM yielded inflated Type I error rates across all numbers of dependent variables and number of categories for each dependent variable. This Type I error inflation was least present for 2 dependent variables, and most marked for 6 dependent variables. In addition, the SEM Type I error rate declined when the dependent variables had more categories of the dependent variables, and this effect was greater in the presence of a larger number of dependent variables.
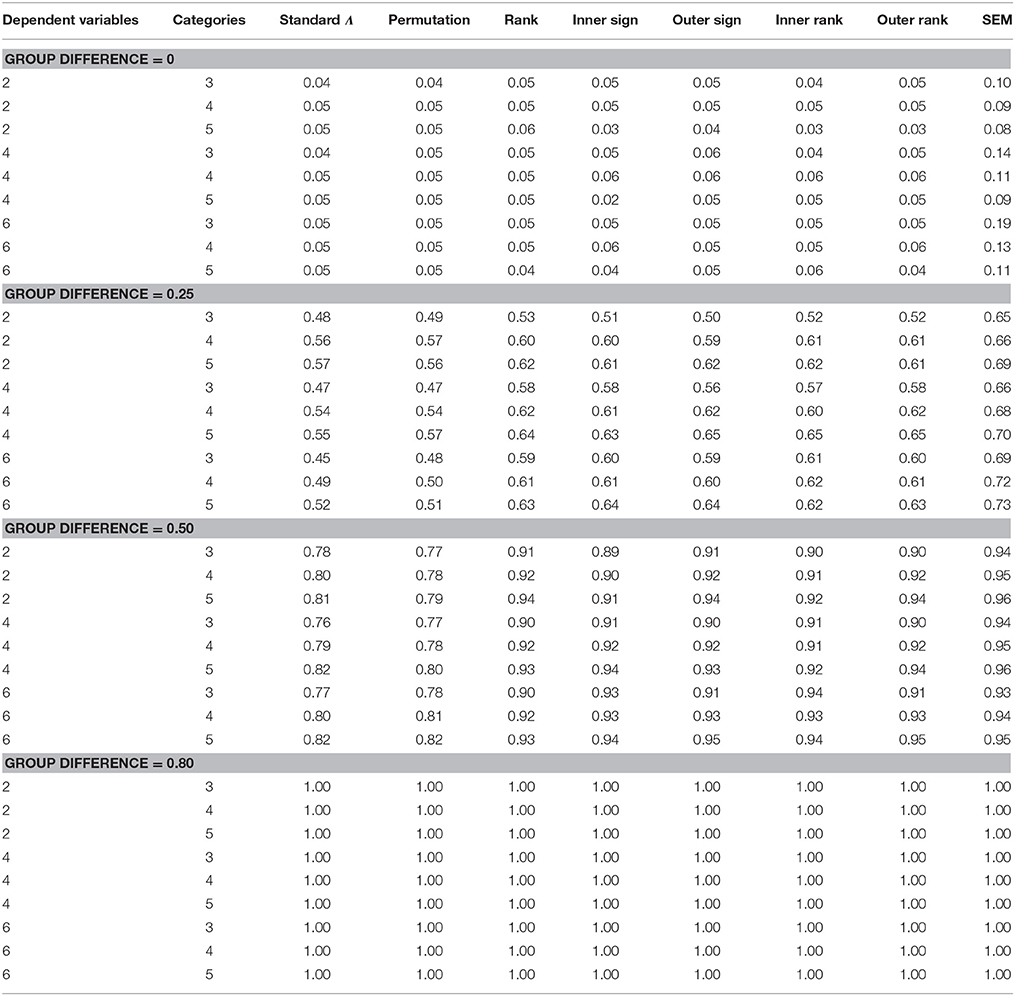
Table 1. Rejection Rates by method, number of dependent variables, group difference, and number of categories.
The top two rows of Table 2 contain the Type I error rates for the methods by the distribution of the dependent variables. Regardless of the distribution, the Type I error rate was controlled by all of the methods, with the exception of SEM. SEM displayed inflated error rates for both distributional shapes, with slightly higher rates in the assymetric case.
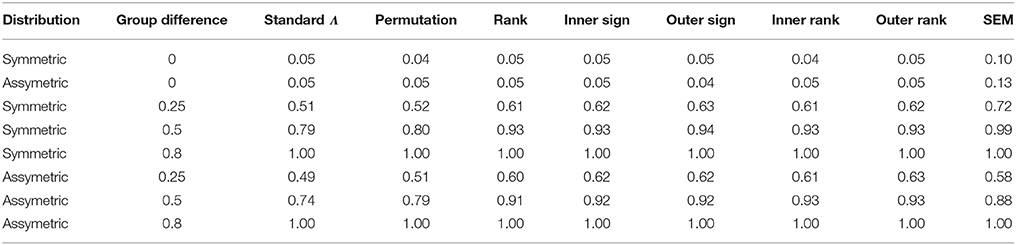
Table 2. Rejection rates by method, distribution, and group difference.
Power
ANOVA identified the interaction of method by degree of group difference by number of dependent variables by number of categories [F(12, 68) = 3.651, p < 0.0001, η2 = 0.334], and the interaction of method by distribution shape [F(12, 158) = 2.882, p = 0.003, η2 = 0.298] as statistically significantly related to power. The bottom three panels of Table 1 display power rates by method, degree of group difference, number of dependent variables and number of categories. For all of the testing methods, power was higher when the group means were simulated to be more different (0.25 vs. 0.5 vs. 0.8). Secondly, SEM displayed higher power rates than any of the other methods, across conditions, though this difference in power was greater when the group difference was 0.25. However, this higher power for SEM must be interpreted with great caution, given the inflated Type I error rate associated with this method. In terms of the other approaches, which were able to maintain the nominal 0.05 Type I error rate, power was lowest for the standard Λ statistic, and the permutation test, across both levels of group difference. The rank based approach, as well as the spatial statistics methods exhibited comparable power rates to one another, and higher than either Λ or the permutation approach. In addition, although power for the rank and spatial methods were lower than that of SEM, this difference was much less marked for a group difference of 0.5 than for 0.25. When group means were simulated to differ by 0.8, the power of all methods was 1.00 across conditions. Finally, for all of the methods, power increased concomitantly with more categories in the dependent variables, and this effect was greater for a group difference of 0.25, and for fewer dependent variables. This impact was least marked for SEM.
The bottom four rows of Table 2 display power by testing method, magnitude of group difference, and distributional shape. Power was lower for SEM in the assymetric distribution condition, whereas for the rank based and spatial statistics methods, the shape of the distribution did not have an impact on power. With regard to Λ, power was somewhat lower in the assymetric case than for symmetric data, except when the group mean difference was simulated to be 0.8. However, this difference was much less marked as compared to SEM.
Discussion
The simultaneous comparison of means for multiple dependent variables across groups is very common in the social sciences. For example, psychologists may be interested in comparing mean scores from subscales of a personality measure among several diagnostic groups (e.g., patients diagnosed with depression, anxiety, etc.). Likewise, educational researchers may want to know the extent to which individuals who successfully matriculate from college differ from those who do not, on scores from a battery measuring college readiness. Most often in such instances means are compared using MANOVA, assuming normality and independence of model errors, and homogeneity of the groups' covariance matrices. When these assumptions are not met, the researcher may be best served using a robust alternative, of which there are many [2]. Though there has been a great deal of research focused on the performance of these robust alternatives when the data are not normally distributed and/or the covariance matrices differ across groups, there has been much less work done with respect to dependent variables that are ordinal, rather than continuous in nature. Nonetheless, it is not uncommon for researchers to be interested in making comparisons of means across groups for ordinal variables, such as individual items on a questionnaire, ratings of behaviors, or discrete frequency measurements of some event [e.g., 9–12]. The purpose of this study was to compare the performance of several methods for conducting MANOVA with ordinal data. These methods were selected for inclusion in the study specifically because they have theoretical qualities which may make them particularly appropriate for use with ordinal dependent variables, such as estimators designed with noncontinuous data in mind (RWLS with the SEM approach), the use of ranks or sign scores (rank based Wilks Λ, spatial signs, and ranks), or permutation methodology.
The results of the study revealed that the standard approach for multivariate means comparisons using Wilks Λ with ordinal dependent variables resulted in control of the Type I error rate, but a diminution of power when compared to other methods studied here. Conversely, the SEM based approach had problems controlling the Type I error rate, calling into question its higher power values. The fully nonparametric version of Wilks Λ, along with the spatial signs and ranks methods seemed to provide the best combination of Type I error control with comparatively high power rates. Between these methods neither was clearly superior in the sense of yielding the uniformly highest power rates.
It is of some interest to consider why the methods performed as they did with respect to multivariate comparison of ordinal means. The Type I error inflation for the SEM estimator based on RWLS was similar to the results for the Satorra-Bentler corrected χ2 test reported in Finch and French [2] in the context of comparing multivariate means for continuous dependent variables. In addition, prior research in the context of latent variable modeling has shown that the RWLS χ2 statistic tends to exhibit an upward bias for more complex models (i.e., models with more variables) and when used with ordinal variables containing fewer categories [51]. These earlier findings may help shed light on the results reported in the current study for the RWLS χ2 test, particularly the Type I error inflation. Indeed, in the current work this inflation was more marked for dependent variables with fewer categories and for models with more dependent variables. This Type I error inflation may be due in part to the fact that for models with more variables there are more opportunities for small differences to be present between the groups. Even if these small differences are essentially random in nature, they could serve to drive the value of the RWLS χ2 statistic upward, thereby leading to the Type I error inflation that is apparent in such cases.
The results reported here for the nonparametric Λ and the spatial approaches are similar to some earlier findings for rank based MANOVA methods in the context of continuous dependent variables, though different from others. Specifically, when continuous variables were simulated to be skewed, rank based test statistics were found to maintain the nominal Type I error rate and at the same time yield higher power than did Pillai's Trace (20). However, Finch also found that when the data were normally distributed, the power of the rank based method was lower than that of Pillai's Trace. In the current study, the rank based approaches (nonparametric Λ and the spatial ranks) yielded higher power than did the parametric test, while also controlling the Type I error rate. It should be noted that the rank based methods featured in Finch's paper differed from the methods used in the current study in that they involved ranking individuals based on the set of dependent variable values. In contrast, both the nonparametric Λ and the spatial methods used here ranked observations for each variable individually. As noted by Liu et al. [37] this approach to ranking based on each individual variable, rather than the marginal distribution of the set of variables, yields a test statistic that is more like the parametric versions (e.g., Λ), and thereby retaining several of its positive traits, such as being invariant under monotone transformations of the individual variables. As mentioned above, results of the current study demonstrated that the nonparametric Λ yielded higher power than the parametric version across conditions when the dependent variables were ordinal. This would suggest that the problem of lower power reported in Finch [20] was successfully addressed through the ranking of observations using the individual dependent variables, rather than the set. Indeed, although very different in terms of how the statistics are calculated, the spatial methods also involve the ordering of individual observations using each variable separately, as opposed to the marginal distribution of the set. Given that these approaches also outperformed the parametric method in terms of power, while controlling the Type I error rate, it would appear that the ordering of observations based upon the individual variable values is a key component in the success of these two approaches to multivariate means testing for ordinal data.
Based on the results of this study, it would appear that researchers may be best served using a rank based approach for simultaneously comparing the means of multiple ordinal dependent variables across groups. They are relatively easy to employ in the R software environment, and are also easy to conceptualize, particularly the rank based Wilks Λ. These methods all appear to yield good Type I error control and relatively high power rates for data similar to that simulated in this study.
Directions for Future Research
An issue of some importance is the appropriate method for following up a statistically significant MANOVA when conducted using one of these alternative methods. It is generally recommended that discriminant analysis be used to follow up a statistically significant Wilks Λ [1]. However, it is unclear the extent to which this strategy would work with ordinal dependent measures. An alternative approach to following up a statistically significant MANOVA with ordinal dependent variables might be some type of robust discriminant analysis approach [e.g., 52–55]. However, these methods are all primarily designed to reduce the impact of outlying observations, which is not inherently an issue with ordinal data. Currently, the researcher is faced with either using standard discriminant analysis with ordinal data and being unsure as to its performance, or conducting a series of rank based univariate mean comparisons (presuming rank based methods were used for the multivariate comparisons) and not taking full advantage of the multivariate nature of the data. Thus, given this choice of two less than optimal options it would appear that future work needs to be done with regard to discriminant analysis with ordinal dependent variables. In addition, research should also focus on expanding the number of groups that are included in the simulation study, as well as the number of independent variables. Furthermore, in the current study, the group size ratio and the total sample size were altered together; i.e., changing the group size ratio changed the total sample size, because one group remained the same size under all conditions. Thus, future research could maintain stable overall sample sizes while manipulating the groups size ratio. Finally, it would also be of interest to increase the number of categories in the dependent variables beyond the common 3, 4, or 5, in order to attempt to learn how many categories are necessary for the standard Wilks Λ begins to perform as it does with truly continuous data, if in fact this does occur.
Author Contributions
The author confirms being the sole contributor of this work and approved it for publication.
Conflict of Interest Statement
The author declares that the research was conducted in the absence of any commercial or financial relationships that could be construed as a potential conflict of interest.
Supplementary Material
The Supplementary Material for this article can be found online at: http://journal.frontiersin.org/article/10.3389/fams.2016.00002
References
2. Finch H, French B. A monte carlo comparison of Robust MANOVA test statistics. J Mod Appl Stat Methods (2013) 12:35–81.
3. Krishnamoorthy K, Xia Y. On selecting tests for equality of two normal mean vectors. Multivariate Behav Res. (2006) 41:533–48. doi: 10.1207/s15327906mbr4104_5
4. Brown MB, Forsythe AB. Robust tests for equality of variances. J Am Stat Assoc. (1974) 69:364–7. doi: 10.1080/01621459.1974.10482955
5. James GS. Tests of linear hypotheses in univariate and multivariate analysis when the ratio of the population variances are unknown. Biometrika (1954) 41:19–43. doi: 10.2307/2333003
6. Johansen S. The Welch-James approximation to the distribution of the residual sum of squares in a weighted linear regression. Biometrika (1980) 67:85–92. doi: 10.1093/biomet/67.1.85
7. Yao Y. An approximate degrees of freedom solution to the multivariate Behrens-Fisher problem. Biometrika (1965) 52:139–47.
8. Nel DG, Van der Merwe CA. A solution to the multivariate behrens–fisher problem. Commun Stat Theory Methods (1986) 15:3719–35. doi: 10.1080/03610928608829342
9. Hoppe C, Stojanovic J, Elger, CE. Enhancing memory for lists by grouped presentations and rehearsal: a pilot study in healthy subjects with unexpected results. Seizure (2009) 18:711–5. doi: 10.1016/j.seizure.2009.10.001
10. Sharpley CF, Christie DRH. ‘How I was then and how I am now’: current and retrospective self-reports of anxiety and depression in australian women with breast cancer. Psychooncology (2007) 16:752–62. doi: 10.1002/pon.1125
11. Darlington Y, Feeney JA, Rixon, K. Interagency collaboration between child protection and mental health services: practices, attitudes and barriers. Child Abuse Negl. (2005) 29:1085–98. doi: 10.1016/j.chiabu.2005.04.005
12. Frederickson NL, Furnham, AF. Sociometric classification methods in school peer groups: a comparative investigation. J Child Psychol Psychiatry (1998) 39:921–33. doi: 10.1017/S0021963098002868
13. Tabachnick BG, Fidell LS. Using Multivariate Statistics. 6th ed. Boston, MA: Allyn and Bacon (2013).
14. Hancock GR, Lawrence FR., Nevitt J. Type I error and power of latent mean methods and MANOVA in factorially invariant and noninvariant latent variable systems. Struc Equat Model. (2001) 7:534–56. doi: 10.1207/S15328007SEM0704_2
15. Hakstian AR, Roed JC, Lind JC. Two-sample T2 procedure and the assumption for homogeneous covariance matrices. Psychol Bull. (1979) 86:1255–63. doi: 10.1037/0033-2909.86.6.1255
16. Hopkins JW, Clay PPF. Some empirical distributions of bivariateT2 and homoscedasticity criterion M under unequal variance and leptokurtosis. J Am Stat Assoc. (1963) 58:1048–53.
17. Olson CL. Comparative robustness of six test in multivariate analysis of variance. J Am Stat Assoc. (1974) 69:894–908. doi: 10.1080/01621459.1974.10480224
18. Lee Y-S. Asymptotic formulae for the distribution of a multivariate test statistic: power comparisons of certain multivariate tests. Biometrika (1971) 58:647–51. doi: 10.1093/biomet/58.3.647
19. Pillai KCS, Jayachandran K. Power comparisons of tests of two multivariate hypotheses based on four criteria. Biometrika (1967) 54:195–210. doi: 10.1093/biomet/54.1-2.195
20. Finch H. Comparison of the performance of the nonparametric and parametric MANOVA test statistics when assumptions are violated. Methodology (2005) 1:27–38. doi: 10.1027/1614-1881.1.1.27
21. Sheehan-Holt JK. MANOVA simultaneous test procedures: the power and robustness of restricted multivariate contrasts. Educ Psychol Meas. (1998) 58:861–81. doi: 10.1177/0013164498058006001
22. Everitt BS. A Monte Carlo investigation of the robustness of Hotelling's one and two sample T2 tests. J Am Stat Assoc. (1979) 74:48–51.
23. Johnson RA, Wichern DW. Applied Multivariate Statistical Analysis. Upper Saddle River, NJ: Prentice Hall (2002).
24. Fouladi RT, Yockey RD. Type I error control of two-group multivariate tests on Means under conditions of heterogeneous correlation structure and varied multivariate distributions. Commun Stat Simul Comput. (2002) 31:360–78. doi: 10.1081/sac-120003848
25. Wilcox RR. Simulation results on solutions to the multivariate Behrens-Fisher problem via trimmed means. Statistician (1995) 44:213–25. doi: 10.2307/2348445
26. Algina J, Oshima TC, Tang KL. Robustness of Yao's, James' and Johansen's tests under variance-covariance heteroscedasticity and nonnormality. J Educ Stat. (1991) 16:125–39. doi: 10.2307/1165116
28. Anderson MJ. A new method for non-parametric multivariate analysis of variance. Aust. Ecol. (2001) 26:32–46.
29. Finch H, Davenport T. Performance of Monte Carlo permutation and approximation tests for multivariate means comparisons with small sample sizes when parametric assumptions are violated. Methodology (2009) 5:60–70. doi: 10.1027/1614-2241.5.2.60
30. Raykov T. Testing multivariable covariance structure and means hypotheses via structural equation modeling. Struct Equat Model. (2001) 8:224–56. doi: 10.1207/S15328007SEM0802_4
31. Satorra A, Bentler PM. Corrections to test statistics and standard errors in covariance structure analysis. In von Eye A, Clogg CC, editors. Latent Variables Analysis: Applications for Developmental Research. Thousand Oaks, CA: Sage (1994). p. 399–419.
32. Muthén B. Goodness of fit with categorical and other non-normal variables. In: Bollen KA, Long JS, editors. Testing Structural Equation Models. Newbury Park, CA: Sage (1993). p. 205–243.
33. Muthén B. A general structural equation model with dichotomous, ordered categorical, and continuous latent variable indicators. Psychometrika (1984) 49:115–32.
34. Finch WH. Multidimensional item response theory parameter estimation with non-simple structure items. Appl Psychol Measur. (2011) 35:67–82. doi: 10.1177/0146621610367787
35. Flora DB, Curran PJ. An empirical evaluation of alternative methods of estimation for confirmatory factor analysis with ordinal data. Psychol Methods (2004) 9:466–91. doi: 10.1037/1082-989X.9.4.466
36. French BF, Finch WH. Confirmatory factor analytic procedures for the determination of measurement invariance. Struct Equat Model. (2006) 13:378–402. doi: 10.1207/s15328007sem1303_3
37. Liu C, Bathke AC, Harrar SW. A nonparametric version of Wilks' Lambda – asymptotic results and small sample approximations. Stat Probab Lett. (2011) 81:1502–6. doi: 10.1016/j.spl.2011.04.012
38. Munzel U, Brunner E. Nonparametric methods in multivariate factorial designs. J Stat Plann Inference (2000) 88:117–32. doi: 10.1016/S0378-3758(99)00212-8
39. Oja H, Randles RH. Multivariate nonparametric tests. Stat Sci. (2004) 19:598–605. doi: 10.1214/088342304000000558
40. Choi K, Marden J. An approach to multivariate rank tests in multivariate analysis of variance. J Am Stat Assoc (1997) 92:1581–90. doi: 10.1080/01621459.1997.10473680
41. Oja H. Affine invariant multivariate sign and rank tests and corresponding estimates: a review. Scand J Stat. (1999) 26:249–59. doi: 10.1111/1467-9469.00152
42. Möttönen J, Oja H, Tienari J. On the efficiency of multivariate spatial sign and rank tests. Ann Stat. (1997) 25:542–52. doi: 10.1214/aos/1031833663
43. Charnes A, Cooper WW, Ferguson, RO. Optimal estimation of executive compensation by linear programming. Manage Sci. (1955) 1:138–51. doi: 10.1287/mnsc.1.2.138
44. Hodges JL, Lehmann EL. Estimates of location based on rank tests. Ann Math Stat. (1963) 34:598–611. doi: 10.1214/aoms/1177704172
45. Nordhausen K, Oja H, Paindaveine D. Signed-rank tests for location in the symmetric independent component model. J Multivariate Aanl. (2009) 100:821–34. doi: 10.1016/j.jmva.2008.08.004
46. Oja H. Multivariate Nonparametric Methods with R: An Approach Based on Spatial Signs and Ranks. New York, NY: Springer (2010).
47. Rantala S, Ilmonen P. Several Sample Location Problem. Technical Report. Aalto University, School of Science, Helsinki (2015).
48. Fu L, Wang Y-G, Liu CJ. Rank regression for analyzing ordinal qualitative data for treatment comparison. Phytopathology (2012) 102:1064–70. doi: 10.1094/PHYTO-05-11-0128
49. R Core Development Team. R: A Language and Environment for Statistical Computing. Vienna: R Foundation for Statistical Computing (2014).
50. Cohen J. Statistical Power Analysis for the Behavioral Sciences. Hillsdale, NJ: Lawrence Erlbaum Associates (1988).
51. Beauducel A, Herzberg PY. On the performance of maximum likelihood versus mean and variance adjusted weighted least squares estimation in CFA. Struct Equat Model. (2006) 13:186–203. doi: 10.1207/s15328007sem1302_2
52. Piros AM, Branco JA. Projection-pursuit approach to robust linear discriminant analysis. J Multivariate Anal. (2010) 101:2464–85. doi: 10.1016/j.jmva.2010.06.017
53. Hubert M, Van Drieesen K. Fast and robust discriminant analysis. Comput Stat. Data Anal. (2004) 45:301–20. doi: 10.1016/S0167-9473(02)00299-2
54. Hawkins DM, McLachlan GJ. High-breakdown linear discriminant analysis. J Am Stat Assoc. (1997) 92:136–43. doi: 10.1080/01621459.1997.10473610
Keywords: MANOVA, nonparametrics, rank based methods, ordinal data, spatial signs and ranks
Citation: Finch WH (2016) Comparison of Multivariate Means across Groups with Ordinal Dependent Variables: A Monte Carlo Simulation Study. Front. Appl. Math. Stat. 2:2. doi: 10.3389/fams.2016.00002
Received: 18 December 2015; Accepted: 05 February 2016;
Published: 26 February 2016.
Edited by:
Mike W.-L. Cheung, National University of Singapore, SingaporeReviewed by:
Augustin Kelava, Eberhard Karls Universität Tübingen, GermanyShu Fai Cheung, University of Macau, China
Copyright © 2016 Finch. This is an open-access article distributed under the terms of the Creative Commons Attribution License (CC BY). The use, distribution or reproduction in other forums is permitted, provided the original author(s) or licensor are credited and that the original publication in this journal is cited, in accordance with accepted academic practice. No use, distribution or reproduction is permitted which does not comply with these terms.
*Correspondence: W. Holmes Finch, d2hmaW5jaEBic3UuZWR1