 Bijan Beheshti
- FactSet Research Systems, San Francisco, CA, United States
In this paper, we explore the ex-post attributes of 120 simulated portfolios across the U.S., International, and Emerging Markets. We estimate expected returns using a given global stock selection model employing Global Equity Rating (GLER) and Consensus Temporary Earnings Forecasting (CTEF) signals. Our portfolios are constructed under the Markowitz optimization framework and constrained at various tracking error levels. Further, an alpha alignment factor is applied to aid in portfolio construction. As a result of our research, we present the reader with three key findings. First, GLER and CTEF signals employed as the primary inputs to security selection result in portfolios with superior risk adjusted returns relative to the Russell 3000, MSCI AC World ex. US, and MSCI Emerging Markets benchmarks which they are measured against. Second, expanding the investment universe outside the U.S. increases the opportunity set yielding higher risk adjusted performance. Third, the incorporation of an alpha alignment factor within the portfolio construction process improves risk forecasts resulting in ex-post tracking error aligning more closely to ex-ante, and ultimately improving information ratios.
Introduction
There are generally multiple layers of investment research that are conducted in order to arrive at a final portfolio. The practitioner must first develop a framework for evaluating and selecting investment opportunities. We focus our research on the Global Equity Ratings (GLER) database in Guerard et al. [1] and the consensus earnings forecasting efficiency variable, CTEF, developed in Guerard [2]. These variables are designed using FactSet and Thomson Financial global security databases. A detailed decomposition of our chosen signals can be found in section Stock Selection Models. After verifying the efficacy of the chosen stock selection model, the next step is to transfer our given signal into an investable portfolio. There are an abundant number of methods to building portfolios, our approach is based on Markowitz [3] optimization. We utilize the Axioma Portfolio Optimizer API integrated through FactSet's Portfolio Simulation Module in order to build and run our model portfolios. The specific inputs into our portfolio construction process are discussed in further detail within section Portfolio Construction. After testing and analyzing multiple permutations of simulated portfolios, we are able to equip ourselves with the appropriate knowledge to make assessments regarding the efficacy and validity of our model inputs. The inputs we evaluate and focus on in this paper include our choice of expected returns variable, the use of an alpha alignment factor (AAF) developed by Saxena and Stubbs [4], and the scope of our investment universe. Our comparative analysis for the various model inputs are presented in section Results.
Literature Review
Before diving into our research, it's important to review the historical evolution of asset selection and portfolio construction models. Possibly the most consequential method for selecting stocks, later coined value investing, was introduced by Graham and Dodd [5]. They focused on using fundamental metrics such as earnings yield, book to price, and dividend yield to identify securities whose intrinsic values were above their traded price. We move from identifying value stocks to quantifying intrinsic value with John Burr Williams' text The Theory of Investment Value [6], where he presented the Dividend Discount Model (DDM) for valuing companies. The use of a valuation model based on discounted cash flows builds on Graham and Dodd's [5] analysis and provides us with a more sophisticated mathematical framework for estimating security returns. Fourteen years later, Harry [7] publishes his paper, Portfolio Selection, in the Journal of Finance. Markowitz reads Williams' book and is struck by the fact that risk is not taken into consideration. This inspires the publication of the mean variance model. Markowitz [7] establishes the understanding that a stock's underlying volatility must be taken into consideration along with its expected return, and the efficient frontier is born. These core concepts laid the groundwork for decades of financial theory to be built upon. Basu [8] reported evidence supporting the low P/E model. Fama and French [9] expanded the value approach by presenting the three-factor model, which includes beta, size, and book to price. Van Der Hart et al. [10] reported the efficiency of book to price within emerging markets. Bloch et al. [11] found that high book to price, cash flow yield, and sales to price were features linked to stocks that outperformed their local benchmark in Japan. Their findings supported the efficacy of these same variables as well as earnings yield within the U.S. markets. Guerard et al. [12, 13] added the [2] composite earnings forecasting variable CTEF and the [14] price momentum variables to the equation which created a 10-factor stock selection model referred to as the Global Expected Returns (GLER) model.
Stock Selection Models
Above all else, the most important factor in building optimal portfolios is the expected return variable, denoted TRt+1, used to differentiate and select securities that ultimately make up the portfolio. An optimized portfolio's performance is significantly more sensitive to errors in TRt+1 than any other input, therefore it is crucial to select an alpha signal with strong, consistent, and statistically significant relationships to asset forward returns [15]. In this analysis we use the GLER database in Guerard et al. [1], and the consensus earnings forecasting efficiency variable, CTEF, developed in Guerard [2].
The GLER variable is decomposed below:
Where:
EP = [earnings per share]/[price per share] = earnings-price ratio;
BP = [book value per share]/[price per share] = book-price ratio;
CP = [cash flow per share]/[price per share] = cash flow-price ratio;
SP = [net sales per share]/[price per share] = sales-price ratio;
REP = [current EP ratio]/[average EP ratio over the past five years];
RBP = [current BP ratio]/[average BP ratio over the past five years];
RCP = [current CP ratio]/[average CP ratio over the past five years];
RSP = [current SP ratio]/[average SP ratio over the past five years];
CTEF = consensus earnings-per-share forecast, revisions and breadth;
PM = Price Momentum; and
e = normally distributed error term (mean = 0, standard deviation = 1).
The CTEF variable, initially estimated in Guerard [2], is a composite signal composed of forecasted earnings yields (see Guerard and Mark [16]), earnings revisions (see Hawkins et al. [17]), and earnings breadth, the direction of earnings revisions (see Wheeler [18]). These variables are described in detail below:
FEP1 = one-year-ahead forecast earnings per share/price per share;
FEP2 = two-year-ahead forecast earnings per share/price per share;
RV1 = one-year-ahead forecast earnings per share monthly revision/price per share;
RV2 = two-year-ahead forecast earnings per share monthly revision/price per share;
BR1 = one-year-ahead forecast earnings per share monthly breadth;
BR2 = two-year-ahead forecast earnings per share monthly breadth;
As described by Guerard et al. [13], the GLER model is estimated using weighted latent root regression analysis on the equation for TRt+1 above in order to identify variables statistically significant at the 10% level. This model uses the normalized coefficients as weights, and averages the variable weights over the past 12 months. The relative importance of the above variables is given by the regression coefficients in a 1997–2011 study by Guerard [13]. The results support the high earnings yield value investing approach advocated by Graham and Dodd [5, 19], and marginally support the Fama and French [14] findings that high book to market ratios hold significant explanatory power of forward security returns.
Portfolio Construction
We construct 120 portfolios using various permutations based off of a core set of model inputs. Our portfolios follow the [3] optimization framework, which seeks to maximize a utility function while adhering to a set of portfolio constraints. Our core set of model inputs is formulated as follows:
Model Inputs
• Initial Holdings—$1B USD Cash
• Trade Universe & Benchmark—Russell 3000 (U.S.), MSCI AC World Growth ex. U.S. (INTL), MSCI Emerging Markets (EM)
• Risk Model—Axioma World-Wide Statistical Mid-Horizon
• Alpha Signals—GLER & CTEF
• Transaction Cost Estimates—ITG ACE Optimal.7 Trade Urgency Cost Curves
• Timeline—December 2001 through September 2016 Rebalanced Monthly
Objective
Our utility function is designed with one simple objective in mind, maximize expected return:
Constraints
• Holdings—Max Asset Weight 4%
• Factor Tilt—Min Portfolio Absolute Size Exposure (−0.25) Standard Deviation
• Threshold Position−35 bps
• Turnover−8% Buy Side Only
• Active Risk−2 to 12% w/ AAF Magnitudes 0, 10, 20, 30, and 40
We rely on factor exposure, covariance, and idiosyncratic risk estimates derived from Axioma's Global Equity Risk Models in order to measure and control ex-ante tracking error (also referred to as active risk). For a detailed guide to Axioma's risk model methodology, we refer the reader to the Axioma Risk Model Handbook [20]. Our U.S. and International portfolios are run with active risk ceilings set at 2, 4, 6, and 8%. Given the relatively higher levels of market volatility within Emerging Markets, our EM portfolios are run with active risk ceilings set at 6, 8, 10, and 12%.
Our portfolios also employ Alpha Alignment Factor (AAF) magnitudes ranging from 0 to 40. A portfolio with 0AAF can be thought of as a traditional mean variance optimization model, which is compared to optimization models that are augmented with varying levels of AAF. The application of AAF within our portfolio construction process helps to control unintended systematic bets [21] which are caused by alignment issues between our expected returns, constraints, and risk model factors. Through empirical case studies Saxena and Stubbs [4, 22] demonstrated that the risk under-estimation problem ties back to the fact that optimized portfolios share a common property, namely, these portfolios possess systematic exposures uncorrelated to the factors of the risk model used to create them. Ceria et al. [23] suggest that the proprietary definitions of certain style factors are a potential source of these alignment problems.
Our 120 portfolios start with a core set of basic inputs, and from there we test various permutations including investment universe, tracking error cap, alpha alignment magnitude, and expected return estimate. Portfolio names are denoted as follows: UNIVERSE_ALPHA_ACTIVERISK_AAF. As an example, portfolio INTL_CTEF_2TE_20AAF represents a portfolio built off the international universe, ranking securities using CTEF, capped at 2% ex-ante tracking error, with an AAF magnitude of 20.
Results
In this section we will explore the performance of 120 portfolios using several metrics to understand the drivers of returns. We start with a top down view analyzing every permutation broken out by universe for the period Dec 2001 through Sep 2016.
Within the U.S. universe in Figure 1, the earnings forecasting variable CTEF clearly outperforms GLER by almost every metric in nearly every portfolio. Excess return increases as tracking error goes up, information ratio is highest at lower tracking error levels, and Sharpe ratio remains consistent across most risk thresholds. The median IR is 0.359 and median Sharpe ratio is 0.433 across all U.S. portfolios.
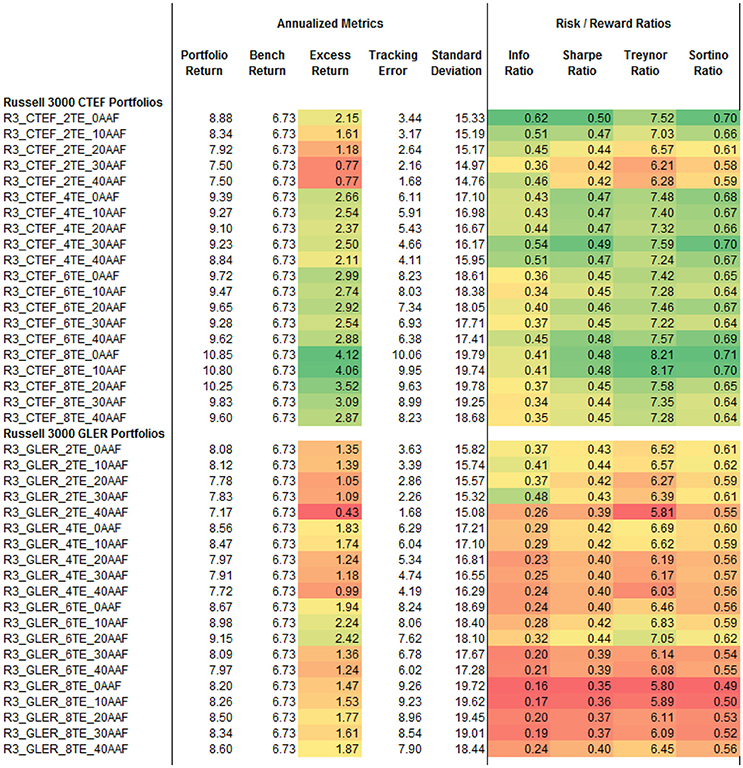
Figure 1. U.S. Portfolios. Heat map colors in Figures 1–4 represent degree to which a given value is positive or negative relative to its own column. Green is positive, red is negative, and yellow is in between.
We see a similar story within the international markets in Figure 2 where CTEF outperforms GLER by a significant margin. Once again excess return increases with higher tracking error, IR decreases with higher tracking error, and the Sharpe ratio is relatively consistent across all international portfolios. The median IR is 0.665 and median Sharpe ratio is 0.421 across all international portfolios.
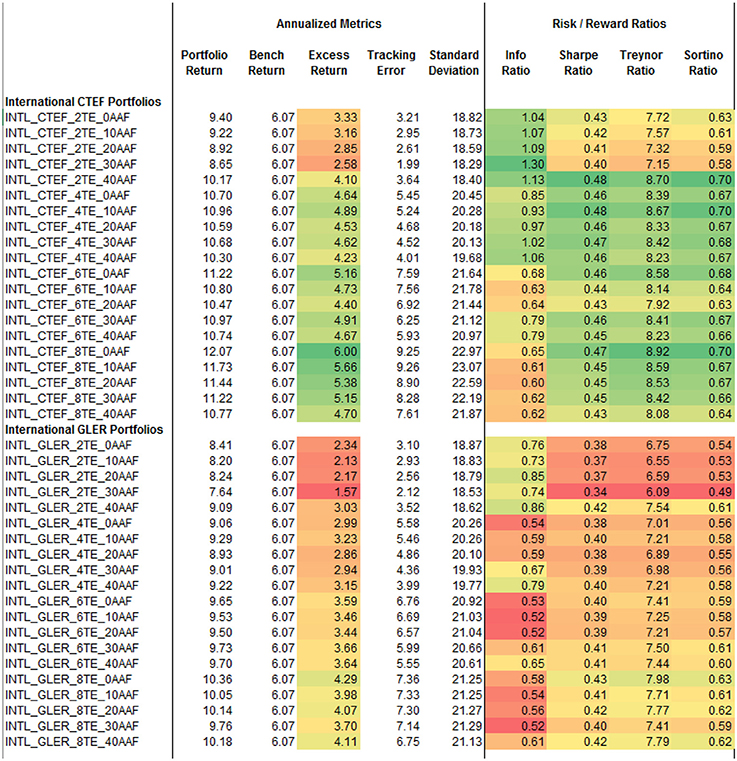
Figure 2. International portfolios.
Unlike the U.S. and international portfolios, GLER outperforms CTEF within the emerging markets universe (Figure 3). Within the CTEF portfolios, excess return is consistent across tracking error levels, IR decreases as tracking error goes up, and Sharpe ratio remains mostly consistent regardless of tracking error. GLER, however, exhibits an increase in excess return as tracking error rises, while IR and Sharpe ratios are stable. The median IR is 0.700 and median Sharpe ratio is 0.528 across all emerging market portfolios.
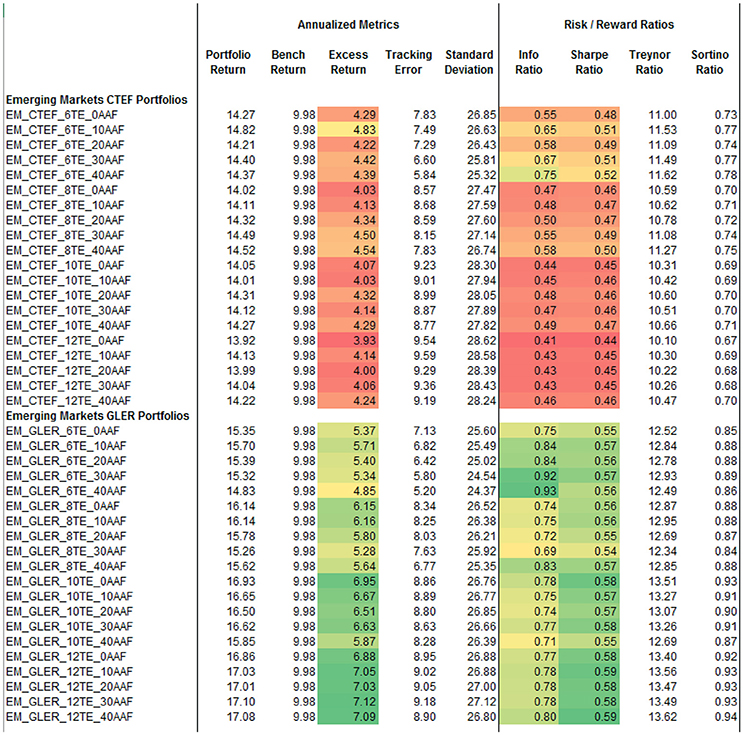
Figure 3. Emerging market portfolios.
The results in Figures 1–3 support our first claim that portfolios utilizing GLER and CTEF signals as the primary means of security selection improve risk adjusted returns relative to their local benchmarks, but what is driving these returns?
Figure 4 represents 8 years of performance attribution ending September 2016 for all the portfolios at the 6% tracking error level. Each column represents the statistical significance (T-Stat) of the various factor impacts to active return from Axioma's Fundamental Equity Risk Models. The results in Figure 4 clearly show that momentum is a huge driver of excess return within the CTEF portfolios, with T-Stats exceeding 10 in emerging markets. Value is another statistically significant factor across both CTEF and GLER in all three markets, while Volatility is a large statistically significant detractor of performance consistently across portfolios.
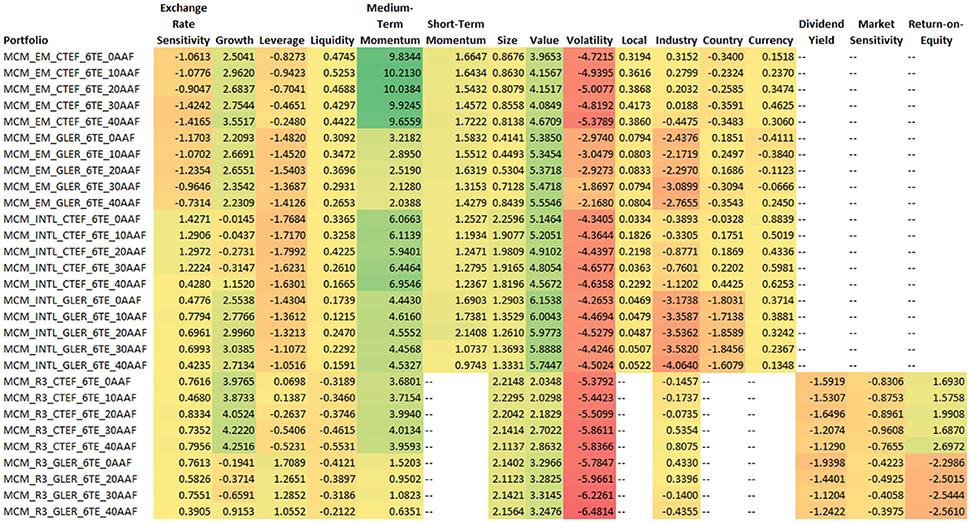
Figure 4. Ex-post factor T-stats.
Figures 5–7 rank every portfolio by information ratio, Sharpe ratio, and excess return.
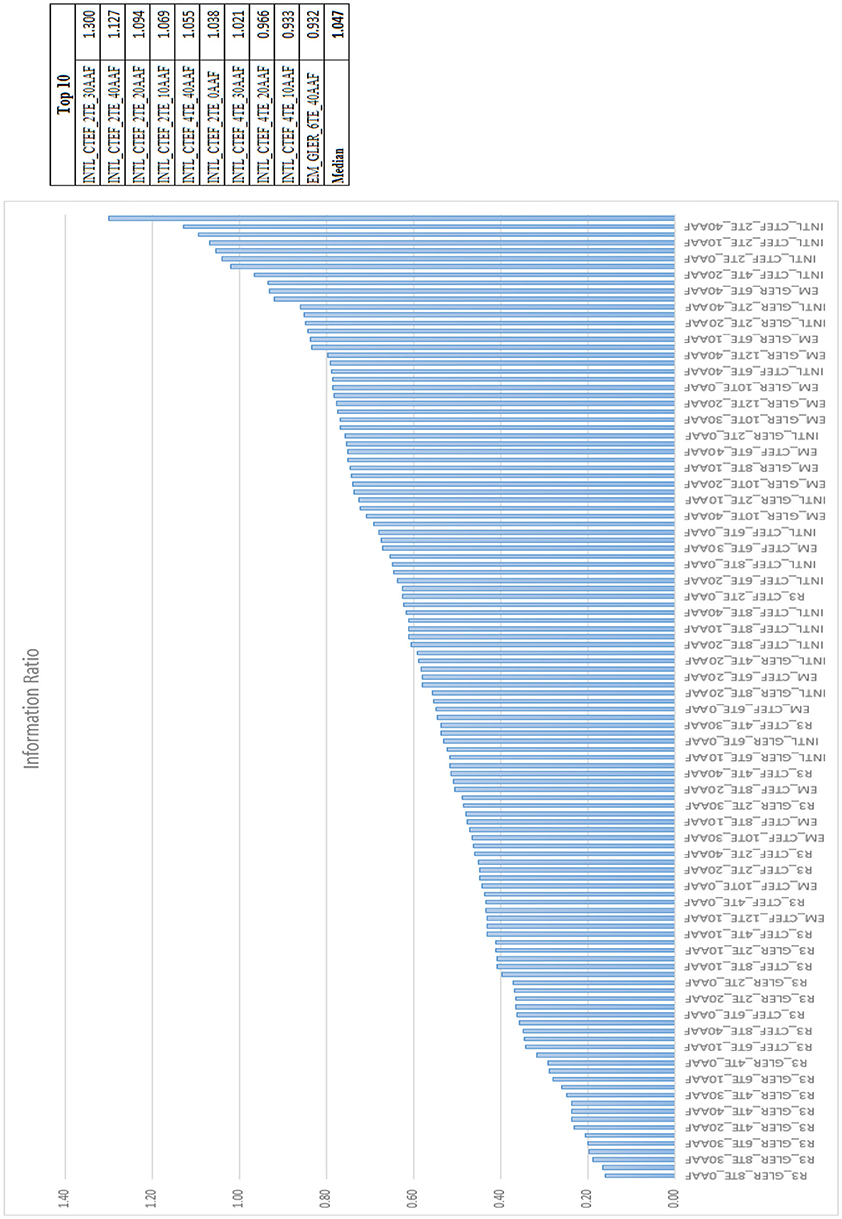
Figure 5. Information ratios.
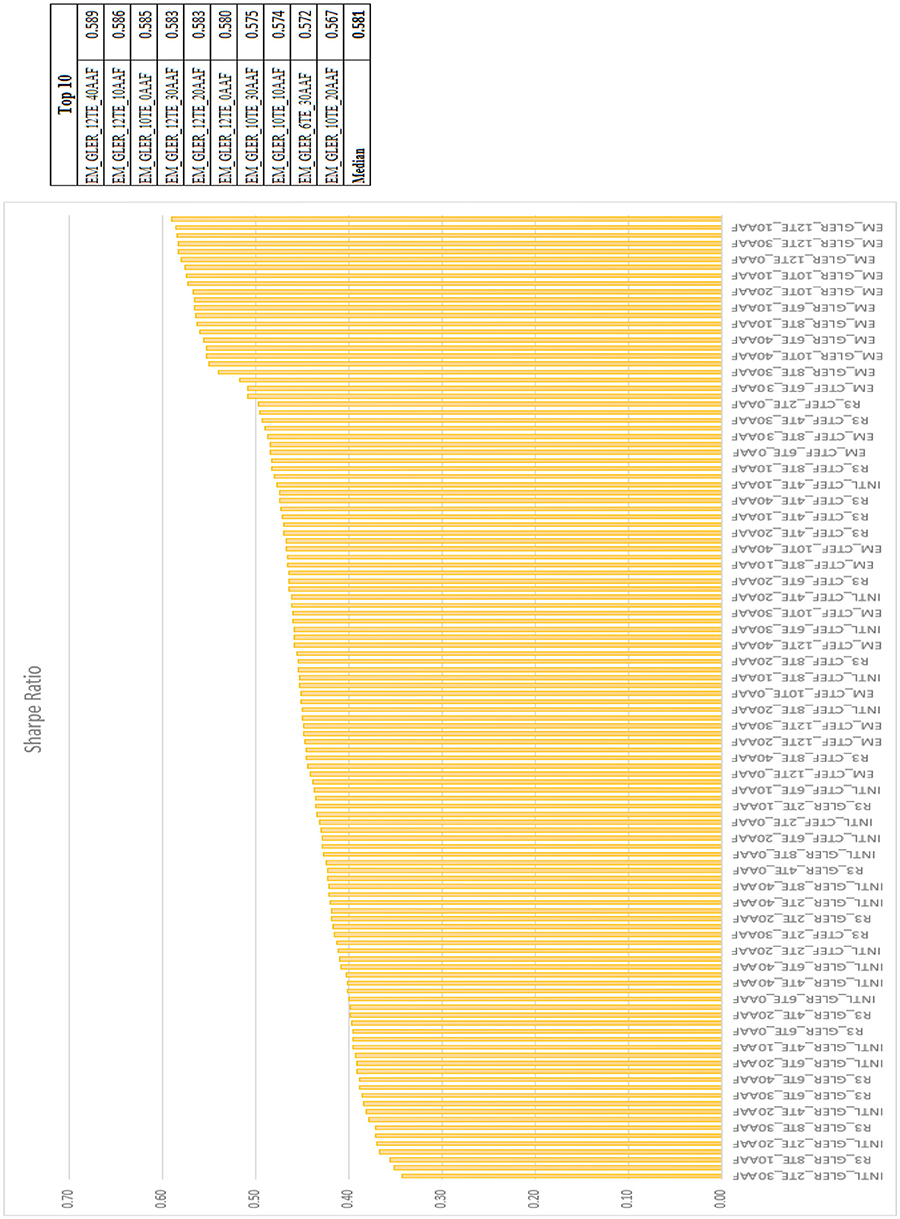
Figure 6. Sharpe ratio.
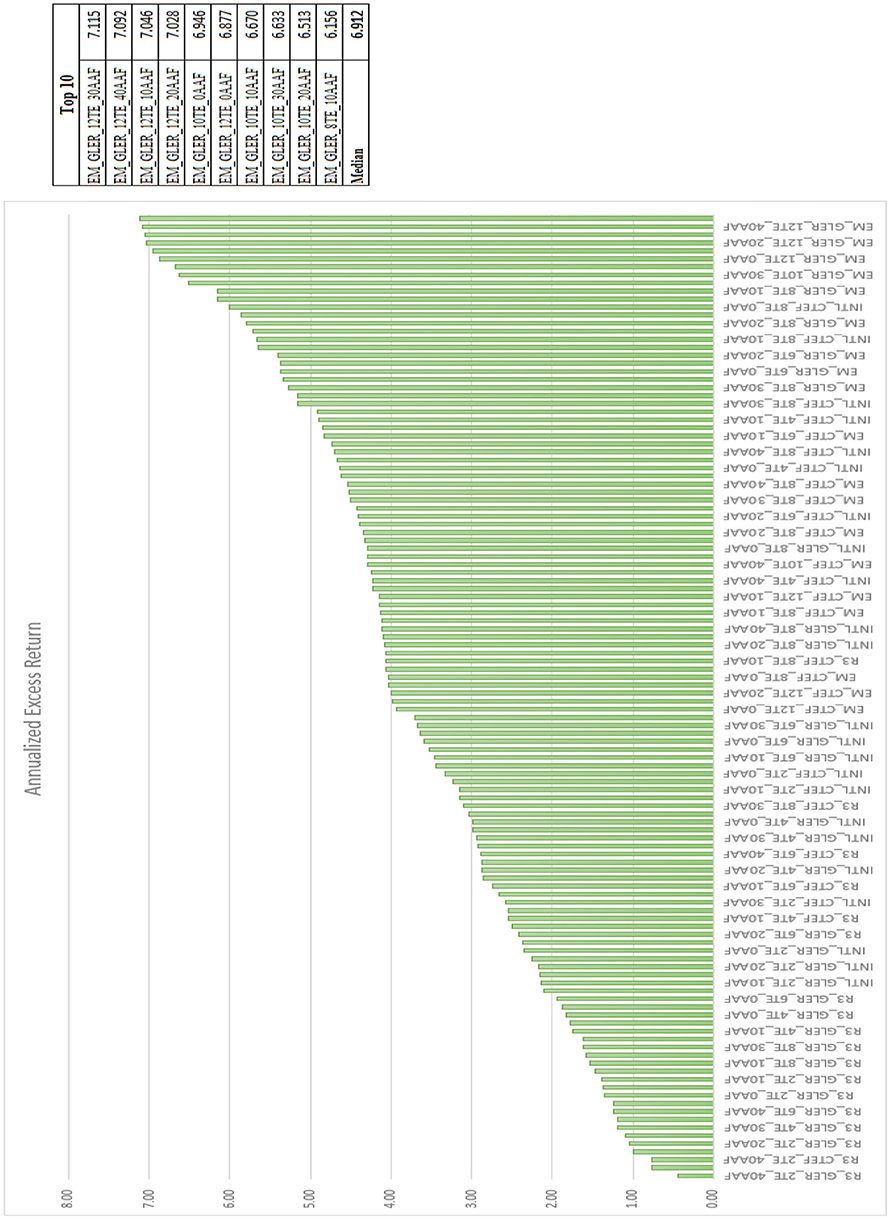
Figure 7. Excess return.
The top 9 portfolios by information ratio are international, and the 10th is emerging markets. The top 10 portfolios by Sharpe ratio are all emerging markets, and the top 10 portfolios by excess return are also all emerging markets. This trend overwhelmingly supports our second claim that expanding our investable universe to opportunity sets outside of the U.S. can dramatically increase risk adjusted performance relative to investing domestically only.
Thus far we've seen how well CTEF and GLER portfolios perform across various markets and what drives that performance. A key input to our portfolio construction process is the integration of the Alpha Alignment Factor, which is designed to minimize unintended systematic risk in optimized portfolios. Figures 8–13 compare ex-post tracking error against ex-ante tracking error for each portfolio. We define ex-post tracking error as the standard deviation of excess returns over the entire model period. Ex-ante tracking error is the level to which we've constrained active risk in the optimization model, this number represents the projected standard deviation of excess returns 1 year forward of each rebalance period.
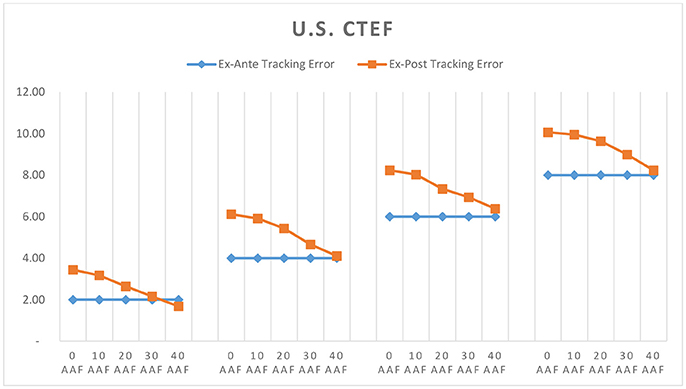
Figure 8. U.S. CTEF ex-ante vs. ex-post tracking error.
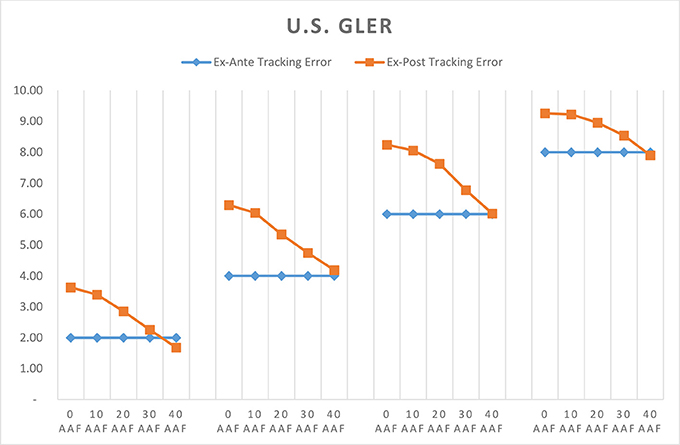
Figure 9. U.S. GLER ex-ante vs. ex-post tracking error.
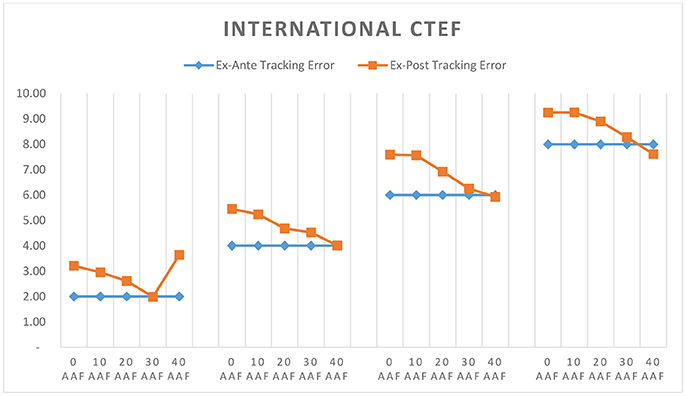
Figure 10. International CTEF ex-ante vs. ex-post tracking error.
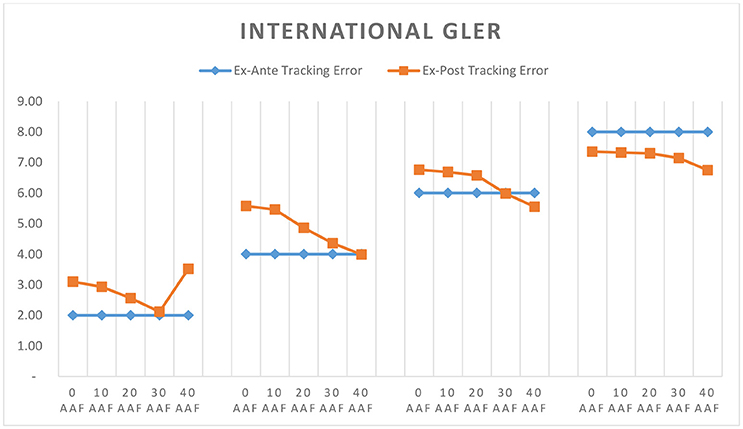
Figure 11. International GLER ex-ante vs. ex-post tracking error.
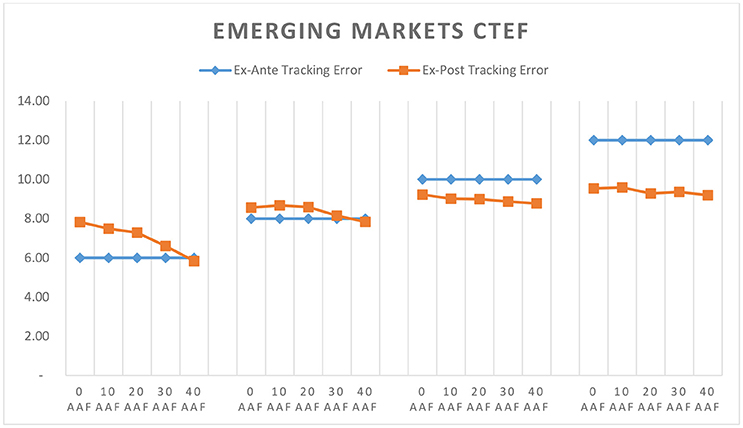
Figure 12. Emerging markets CTEF ex-ante vs. ex-post tracking error.
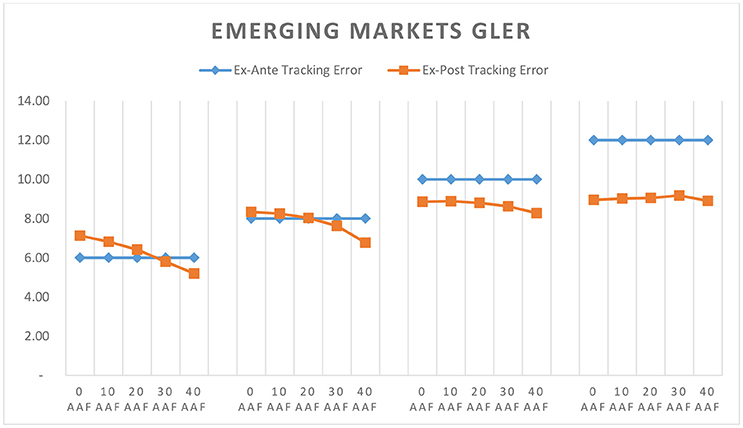
Figure 13. Emerging markets GLER ex-ante vs. ex-post tracking error.
As shown in Figures 8–13, in nearly every case, implementing AAF as part of the portfolio construction process improves the accuracy of our risk forecast. We targeted higher tracking errors in emerging markets, and as a result the 10 and 12 TE portfolios often did not need to take as much active risk as was allowed. In these cases, applying AAF made relatively little change to the risk forecast, which is in line with our expectations.
Conclusion
Through analyzing the full list of model portfolios covered in the prior sections we present three key findings: (1) GLER and CTEF signals can be used as powerful security selection models which deliver portfolios yielding improved risk adjusted performance over their local benchmarks. Evidence of this can be found within Figures 1–3. The excess returns are positive for all 120 portfolios employing GLER and CTEF signals, indicating outperformance relative to the local benchmark. The information ratios and Sharpe ratios are also strong throughout. (2) Expanding our investable universe beyond the U.S., especially emerging markets, produces higher information and Sharpe ratio portfolios. Figures 5–7 show that under our stock selection framework, international, and emerging market portfolios overwhelmingly outperform U.S. portfolios when measured by information ratio, Sharpe ratio, and excess return. (3) As clearly shown in Figures 9–13, the integration of an alpha alignment factor within the portfolio construction process significantly improves ex-ante risk forecasts by reducing the risk under-estimation bias in optimized portfolios where the tracking error cap is met.
Author Contributions
BB was responsible for building optimization/simulation models, generating performance analytics, and presenting findings related to the efficacy of GLER & CTEF datasets, international investing, and the employment of an alpha alignment factor within the portfolio optimization process.
Conflict of Interest Statement
BB is employed by company FactSet Research Systems, Inc.
Acknowledgments
The author acknowledges Dr. John Guerard and McKinley Capital Management for providing expected return estimates that were used to construct portfolios throughout this research project. The support and helpful feedback from Dr. John Guerard is greatly appreciated.
References
1. Guerard JB Jr, Markowitz H, Xu G. Earnings forecasting in a global stock selection model and efficient portfolio construction and management. Int J Forecast. (2015) 31:550–60. doi: 10.1016/j.ijforecast.2014.10.003
2. Guerard JB. Is there a cost to be socially responsible in investing? J Forecast. (1997) 16:475–90. doi: 10.1002/(SICI)1099-131X(199712)16:7<475::AID-FOR668>3.0.CO;2-X
3. Markowitz HM. Portfolio Selection: Efficient Diversification of Investment. Cowles Foundation Monograph No. 16. New York, NY: John Wiley & Sons (1959).
4. Saxena A, Stubbs RA. Pushing Frontiers (literally) using Alpha Alignment Factor. Technical report, Axioma, Inc. Research Report #022 (2010).
5. Graham B, Dodd D. Security Analysis: Principles and Technique, 1st Edn. New York, NY: McGraw-Hill Book Company (1934).
8. Basu S. Investment performance of common stocks in relation to their price-earnings ratios: a test of the efficient market hypothesis. J Finance (1977) 32:663–82. doi: 10.1111/j.1540-6261.1977.tb01979.x
9. Fama EF, French KR. Common risk factors in the returns of stocks and bonds. J Financial Econ. (1993) 33:3. doi: 10.1016/0304-405X(93)90023-5
10. Van Der Hart J, Slagter E, van Dijk D. Stock selection strategies in emerging markets. J Emp Finance(2003) 10:105–32. doi: 10.1016/S0927-5398(02)00022-1
11. Bloch M, Guerard JB Jr., Markowitz HM, Todd P, Xu G L. (1993). A comparison of some aspects of the U.S., and Japanese equity markets. Jap World Econ. 5:3–26. doi: 10.1016/0922-1425(93)90025-Y
12. Guerard JB Jr., Xu G, Gultekin MN. Investing with momentum: the past, present, and future. J Invest. (2012) 21:68–80. doi: 10.3905/joi.2012.21.1.068
13. Guerard JB Jr., Rachev ST, Shao BP. Efficient global portfolios: big data and investment universes. IBM J Res Dev (2013) 57:1–11. doi: 10.1147/JRD.2013.2272483
14. Fama EF, French KR. The cross-section of expected stock returns. J Finance (1992) 47:427–65. doi: 10.1111/j.1540-6261.1992.tb04398.x
15. Chopra VK, Ziemba WT. The effects of errors in means, variances and covariances on optimal portfolio choice. J Portfolio Manage (1993) 19:2. doi: 10.3905/jpm.1993.409440
16. Guerard JB Jr., Mark A. The Optimization of Efficient Portfolios: The Case for a Quadratic R&D Term. Res Finance (2003) 20:213–47. doi: 10.1016/S0196-3821(03)20011-3
17. Hawkins EH, Chamberlin SC, Daniel WE. Earnings expectations and security prices. Finan Anal J. (1984) 40:24–39.
18. Wheeler LB. Changes in consensus earnings estimates and their impact on stock returns. In: Bruce BR, Epstein CB, editors. The Handbook of Corporate Earnings Analysis. Chicago, IL: Probus Pub. Co. (1994).
19. Graham B, Dodd D. Security Analysis: Principles and Technique, 4th Edn. New York, NY: McGraw-Hill Book Company (1962).
21. Beheshti B. The Integration of the alpha alignment factor and earnings forecasting models in producing more efficient markowitz frontiers. J Invest. (2014) 23:133–43. doi: 10.3905/joi.2014.23.4.133
22. Saxena A, Stubbs RA. An empirical case study of factor alignment using the USER model. J Invest. (2012) 21:25–44. doi: 10.3905/joi.2012.21.1.025
Keywords: CTEF, GLER, alpha alignment factor, international investing, portfolio optimization
Citation: Beheshti B (2018) Effective Stock Selection and Portfolio Construction Within US, International, and Emerging Markets. Front. Appl. Math. Stat. 4:17. doi: 10.3389/fams.2018.00017
Received: 16 January 2018; Accepted: 04 May 2018;
Published: 24 May 2018.
Edited by:
Shijie Deng, Georgia Institute of Technology, United StatesReviewed by:
Marina Resta, Università di Genova, ItalyAurelio F. Bariviera, Universidad Rovira i Virgili, Spain
Copyright © 2018 Beheshti. This is an open-access article distributed under the terms of the Creative Commons Attribution License (CC BY). The use, distribution or reproduction in other forums is permitted, provided the original author(s) and the copyright owner are credited and that the original publication in this journal is cited, in accordance with accepted academic practice. No use, distribution or reproduction is permitted which does not comply with these terms.
*Correspondence: Bijan Beheshti, YmJlaGVzaHRpQGZhY3RzZXQuY29t