 Linda Farmus
 Chantal A. Arpin-Cribbie2
 Robert A. Cribbie
- 1Quantitative Methods Program, Department of Psychology, York University, Toronto, ON, Canada
- 2Department of Psychology, Laurentian University, Sudbury, ON, Canada
Researchers are often interested in exploring predictors of change, and commonly use a regression based model or a gain score analysis to compare degree of change across groups. Methodologists have cautioned against the use of the regression based model when there are non-random group differences at baseline because this model inappropriately corrects for baseline differences. Less research has addressed the issues that arise when exploring continuous predictors of change (e.g., a regression model with posttest as the outcome and pretest as a covariate). If continuous predictors of change correlate with pretest scores, the modeled relationship between predictors and change may be an artifact. This two-part study explored the statistical artifact, or overestimation of effect estimates, that may arise when continuous predictors of change are included in pretest-posttest regression based models. Study 1 revealed that the problematic regression based model that covaries out pretest scores is currently being applied in psychology literature more often than models that do not covary pretest scores, and that the conditions leading to the artifact (i.e., spurious effects) were met in a significant amount of studies reviewed. Study 2 demonstrated that the artifact arises in conditions common within psychological research, and directly impacts Type I error rates. Recommendations are provided regarding which regression based models are appropriate when pretest scores are correlated with continuous predictors.
Introduction
Measuring change, and predictors of change, is both a popular research strategy and, from a methodological standpoint, a very complicated task. One of the more popular research designs for measuring change in psychology is the pretest-posttest design, where a dependent or outcome variable is measured before and after some event (e.g., before and after an intervention). Most commonly, researchers apply either a regression based or a gain score analysis (also known as difference scores or change scores) [1–3]. With a regression based approach the pretest is a predictor in the model and the posttest is the dependent variable, while the gain score approach simply subtracts the pretest score from the posttest score. Both methods can also incorporate predictors of change [3].
This project specifically explores the relationship between continuous predictors and the amount of change in regression models. Although numerous papers over several decades have explored the issues surrounding the inclusion of categorical predictors of pretest-posttest change in regression based models (i.e., often labeled analysis of covariance, or ANCOVA), there has been little research on the problems surrounding the inclusion of continuous predictors in these regression based models [4–7]. This paper will utilize both a literature review and a simulation study to demonstrate the issues surrounding the interpretation of the relationship between continuous predictors and change in regression based models. First, a general introduction to the problem is provided and the concerns surrounding the inclusion of categorical predictor variables in regression based models are reviewed.
Addressing Pretest Effects
When measuring change on some variable, there are different methods for removing the effect of pretest levels of the variable. In other words, if an individual has a certain degree of depression at pretest, there are different ways of arriving at a measure of pretest to posttest change by varying how we control for initial levels of depression. When comparing the amount of change in different groups, it is important to distinguish between groups which occur naturally (e.g., gender, race) and groups created through random assignment (e.g., control vs. experimental). In the regression based approach, the pretest scores allow any initial between-group differences to be accounted for in establishing whether any observed pretreatment to posttreatment differences are due to the treatment itself, differences in the groups at baseline, or a combination of these factors [8]. The point of random assignment is to create groups which are equivalent, on average at baseline, so that any differences in outcomes at posttest can be attributed to the treatment itself and not differences at baseline. This then allows the researcher to test causal differences [9]. However, when nonrandom differences are present at pretest (e.g., the grouping variable is a naturally occurring variable such as biological sex or culture), there should not be an assumption that groups are equal at baseline (or thus an attempt to statistically coerce the groups to be equivalent at baseline), since these differences are real and not a function of measurement error.
In the gain score based approach, the difference between the groups on the amount of change from pretreatment to posttreatment is calculated by subtracting posttest scores from pretest scores (or vice versa), for each individual. With two groups, a gain score model is equal to a t-test on average difference scores (with the difference as the dependent variable) or a mixed model ANOVA. Moreover, there is no assumption of equivalence between groups at pretest [10]. The regression based approach, however, assumes that groups are equivalent at baseline (and thus adjusts for these differences), a practice which may lead to flawed conclusions if meaningful differences between the groups indeed exist at pretest. In other words, whether one chooses the gain score based approach or the regression based approach to analyze pretest to posttest change can have a significant impact on the results when examining predictors of change [5].
Categorical Predictors and Lord's Paradox
Many studies have explored the issues surrounding the use of the regression based and gain score based models when the researcher is interested in exploring a categorical predictor of change, such as in the presence of a grouping variable [3]. As highlighted above, different statistical outcomes can result from these two methods.
If the groups are created through random assignment, then both the regression based and gain score based methods are acceptable. However, preexisting differences between groups at pretest (e.g., between males and females) may lead these models to diverge in their conclusions, a phenomenon called Lord's paradox [11].
Lord originally described the paradox in 1967 using a hypothetical scenario in which the effect of a cafeteria diet on weight gain over the course of a year is examined. Sex (male vs. female) is included as a categorical predictor, and weights for each group are measured at pretest and posttest. The data are such that there is no change in the weights from pretest to posttest for males or females, and thus no difference between males and females in the amount of change. The use of the regression based model indicates an effect between groups (i.e., when assuming males and females start at the same weight, it appears that males gained significantly more weight from pretest to posttest than females). With the gain score based model, in contrast, no differences in weight gain are found between the groups. Both methods are valid accounts of the data, given their assumptions, and the research questions they examine are similar; hence, the paradox.
In reality, the two models address quite different research questions [12], and the conclusions drawn are based on different assumptions [13, 14]. The regression based model addresses whether the groups differ at posttest assuming they are equivalent at baseline, whereas the gain score based model addresses whether there is a different amount of change from pretest to posttest when the two groups are compared. The regression based model regresses posttest on group as well as pretest (or in some situations regresses change on group and pretest), whereas the gain score based model regresses the change on group [2]. There is no significant effect of group found in the gain score approach when the groups differ at baseline but change the same amount from pretest to posttest. However, if the groups differ at baseline, the regression based model may find a significant effect of the grouping variable since it addresses the question of whether there is a significant difference between the groups at posttest, assuming they start at the same point.
Since Lord's paradox was presented, the topic has been debated by numerous methodologists (e.g., [1–4, 8, 13, 15]). Together, the literature supports the use of the regression based model when group assignment is based on pretest scores or randomization but raises concern if the regression based model is used in the presence of pre-existing groups (i.e., groups that exist prior to the pretest measure), since it is not appropriate to assume that the groups start at the same level when real pre-existing differences exist.
Despite existing literature supporting the use of gain score methods, researchers generally avoid these models due to their reputation as unreliable measures of change, primarily traceable to seminal work by Lord [16] and Cronbach and Furby [17] arguing that if scores in general are imperfectly reliable, difference scores are especially unreliable and are systematically related to measurement errors, a bias not easy to avoid and that deleteriously impacts the accurate assessment of change. Later research has shown that these concerns with gain scores tend to apply to unusual situations and that gain scores can be reliable in many typical research settings; the interested reader may consult Gottman and Rushe [18], Ragosa et al. [19], and Rogosa and Willett [20]. For instance, Castro-Schilo and Grimm [21] demonstrated the reliability of gain scores whether a key predictor is categorical or continuous, and whether there are preexisting differences at baseline or no preexisting differences. A regression based model will overestimate the effect of a key predictor whenever there is a lack of independence between a grouping variable and a pretest covariate, and the extent of this overestimation is a function of the dependence between these variables. Gollwitzer et al. [22] further argue that gain scores are reliable when pretest scores are stable baseline measures (i.e., pretest scores remain stable across time if no treatment occurs). With the regression based approach, posttest scores are assumed to be linearly related to pretest scores and this function is not perfectly reliable.
A rule of thumb is to choose the model which fits best with the given research question. The regression based model “asks” how one variable predicts variation in some other variable (in Lord's example, weight at pretest predicted weight at posttest), and potentially if there are predictors of this variation. The gain score based model “asks” how pretest scores differ from posttest ones (did women or men's weight change from pretest to posttest) [23], and again potentially explores predictors of the difference.
Framing the models as regression equations, the differences become apparent:
where prei and posti are the pretest and posttest scores for a given individual i, i = 1, …, N, b0 is the model intercept, b1 is the difference in the group means from pre to post (gain scores) or difference in the post means when pre = 0 (regression), b2 is the regression coefficient for the pretest, and ei is the model residual. The addition of b2 in the regression model is what distinguishes these models; b2 will equal 1 only if pretest perfectly predicts posttest (but is virtually never the case) and will be lower with lower reliability. The addition of b2 results in b1 being a partial regression coefficient influenced by its relationship with the pretest. Thus, the models will only be equivalent if b2 = 1 and there is no relationship between the predictor and the pretest.
Lord's Paradox with Continuous Predictors of Change
Although methodologists have highlighted the issues of exploring categorical predictors in pretest-posttest models, little research has investigated the issues surrounding the use of continuous predictors in pretest-posttest models. Our interest now shifts to regression models that analyze the effect of a continuous predictor on change.
Transforming the equations above for gain score and regression for the inclusion of a continuous predictor results in the following models:
X represents a continuous predictor. More specifically, a researcher may wish to explore a continuous (e.g., perfectionism), as opposed to a categorical (e.g., biological sex), predictor of the effect of a treatment for depression from baseline to follow-up. However, if perfectionism and pretest depression scores are correlated, interpreting the covariate adjusted posttest scores may be complicated, much like how Lord's paradox affects the interpretation of the effect of categorical predictors.
Evidence for Lord's Paradox With Continuous Predictors
Recently, Eriksson and Häggström [5] discussed Lord's paradox within a continuous predictor situation. They outlined two conditions necessary for observing a regression artifact (i.e., a spurious effect): (1) the presence of a correlation between a continuous predictor and pretest scores; and (2) the presence of random error at pretest. It is hard to imagine a situation within the behavioral sciences where variables are measured without error and the predictors (in this case the pretest variable and the continuous predictor) are not at all related. Thus, it would be reasonable to expect that the two conditions for the regression artifact would be frequently met in studies applying a regression based model. If these two conditions are met, and the pretest score is added as a predictor/covariate within a regression analysis, the interpretation of the relationship between the predictor and the covariate-adjusted posttest scores becomes a challenge, as the results may be largely accounted for by the regression artifact.
Eriksson and Häggström [5] identified the presence of a regression artifact in a numerical cognition study which examined the effect of a training program on arithmetic ability [24]. In this study, arithmetic performance was measured at pretest and posttest, and a continuous predictor (estimations of numerical magnitudes) was included as a covariate at pretest. The training program appeared to improve arithmetic performance in students from pretest to posttest, particularly for those high in levels of the continuous predictor. When Eriksson and Häggström [5] reanalysed the original data, they found that the data were more aligned with the null hypothesis of no effect, and that the use of the regression model led to a regression artifact by way of the two critical conditions. First, the baseline measure of arithmetic performance was correlated with the continuous predictor of numerical estimation. Posttest results on arithmetic performance then appeared to be greater for those who were higher in the continuous predictor than those who were lower. In essence, regression detects a relationship amongst the continuous predictor and change in the outcome variable which may only be due to the regression artifact. Second, the presence of random errors within the pretest scores contributed to the regression artifact through regression to the mean, the idea that extreme scores on an initial measurement tend to be closer to a true average on subsequent measures [6]. This phenomenon is directly related to the presence of random error.
To conclude, the regression artifact is a function of the degree of relation between the continuous predictor and the pretest score on the outcome variable, as well as the ratio of overall variance in pretest scores which can be explained by chance within-individual variation. When these two properties are nonzero, the regression artifact will arise [5].
Quantifying the Regression Artifact
The regression artifact can be quantified as:
In the equation, the regression artifact is represented by the coefficient . The coefficient b represents the unstandardized regression coefficient, or the slope, between the continuous predictor and the pretest score. This coefficient impacts the strength of the relation between the pretest score and the continuous predictor. The parameter σ represents the standard deviation of the error included in the measurement of pretest and posttest scores on the outcome variable, while the parameter s represents the standard deviation (individual variation) of the underlying construct being measured at pretest and posttest. This equation will be revisited in a later section.
The use of this problematic regression based model that covaries pretest measures in continuous settings may not be entirely uncommon. For example, in a recent study by Crocker et al. [25], associations between interpersonal goals and change in distress among college roommates were explored. In one instance, anxiety (as a measure of distress) was assessed at pretest and posttest, while interpersonal goals (worded as avoidance self-image goals) were included as a continuous predictor. Anxiety and avoidance self-image goals were correlated at pretest and, as with almost all variables in psychology, anxiety was measured with error. Thus, in this example, the two conditions leading to the regression artifact are met.
Evidence has emerged that regression models which lead to a statistical artifact may exist within the psychology literature. However, the exact prevalence of this model is unclear, but warrants investigation, given the substantial effect of the artifact on interpreting coefficients and the Type I error rates associated with the tests. Furthermore, Eriksson and Häggström [5] have demonstrated the existence of the regression artifact in a continuous setting, but to date there has not been a more extensive evaluation of the conditions under which the artifact arises or the consequences of the artifact. The current research addressed both of these concerns.
Research Overview
The present research was designed to assess the statistical artifact that may arise when a researcher is exploring continuous predictors of change in a regression model, the pretest/posttest scores are measured with error, and the continuous predictor and a pretest scores are correlated. Since almost all variables in the behavioral sciences are measured with error, it is safe to say that statistical artifacts may arise if the pretest score is related to the continuous predictors. This research will investigate continuous predictors of change in order to address two main questions: (1) To what extent are the conditions that lead to the regression artifact present in recent psychology studies? and (2) To what extent does the regression artifact demonstrated by Eriksson and Häggström [5] apply in a broad range of conditions commonly encountered in psychology?
Study One reviewed high impact psychology journals for pretest-posttest regression models with a continuous predictor of change and identified the observed correlations between the pretest and the continuous predictor. The goal is to provide evidence that the model leading to the statistical artifact is common within psychology. More specifically, we expected to find that researchers commonly use regression based models to explore continuous predictors of change and that meaningful correlations exist between the pretest and continuous predictor variables.
In order to illustrate the magnitude of the artifact in regression models which use pretest scores and a continuous variable(s) as predictors and posttest scores as the outcome, Study Two extended on the findings of Eriksson and Häggström [5] to conditions commonly encountered in psychological research through the use of a Monte Carlo study. The results of Study One helped determine appropriate conditions for the simulation study.
Study One
Our first research aim was to quantify both the use of regression based models for exploring continuous predictors of change and the size of the correlation between the pretest scores and the continuous predictors of change. In order to address this issue, a literature review was conducted with a focus on studies published in top tier psychology journals in 2015.
Methods
Literature Search
We conducted a review of articles published in top tier psychology journals in 2015 using Google Scholar and the PsycINFO database. Journals were labeled as top-tier if they had an impact factor (IF) rating above 2. Although ranking of journals as high impact is largely arbitrary, the reason for reviewing only articles from journals with large impact factors was to reduce the impact of study quality on the results. In essence, we wanted to reduce the likelihood of a reader dismissing our findings under the premise that the same results would not hold in better journals.
Any study which used a pretest-posttest design with the inclusion of a continuous predictor of change was included. More specifically, our literature search explored the use of the search terms: “pre,” “pretest,” “post,” “posttest,” “baseline,” and “regression.” We excluded reviews, meta-analyses, and methodological reports. This allowed us to quantify what proportion of researchers used the regression model and which proportion used the gain score approach. Articles were coded for the model used (i.e., GSA based, or regression based) and the correlation between the continuous predictor and the pretest score. If multiple continuous predictors were included in the model, we only coded the correlation between the pretest score and the first continuous predictor in the model in order to minimize the effects of violations of independence. All data in the first study were analyzed with the open-source statistical software R [26].
Results
A summary highlighting the results of the literature review is presented in Table 1. There were 718 articles published in high impact psychology publications in 2015. More specifically, 7 to 258 articles were published per publication outlet (M = 65.3, SD = 67.6). Of the initial search results, 9% (N = 66) met the full criteria for review (i.e., pretest-posttest design with a continuous predictor of change). There were between 1 and 14 articles that met the inclusionary criteria per journal (M = 6.0, SD = 4.0). The impact factor ratings for the publications ranged from 2.3 to 5.5 (M = 3.6, SD = 1.1). The topic of the journals ranged in scope: one focused on computers and psychology (Computers in Human Behavior); four focused on clinical psychology (e.g., Journal of Abnormal Psychology); two focused on applied psychology (e.g., Journal of Applied Psychology); three focused on social and personality psychology (e.g., Personality and Social Psychology Bulletin); and one focused on developmental psychology (e.g., Journal of Applied Developmental Psychology). The sample sizes in the coded studies ranged from 44 to 7,600 (M = 734, Median = 239, SD = 1,438).
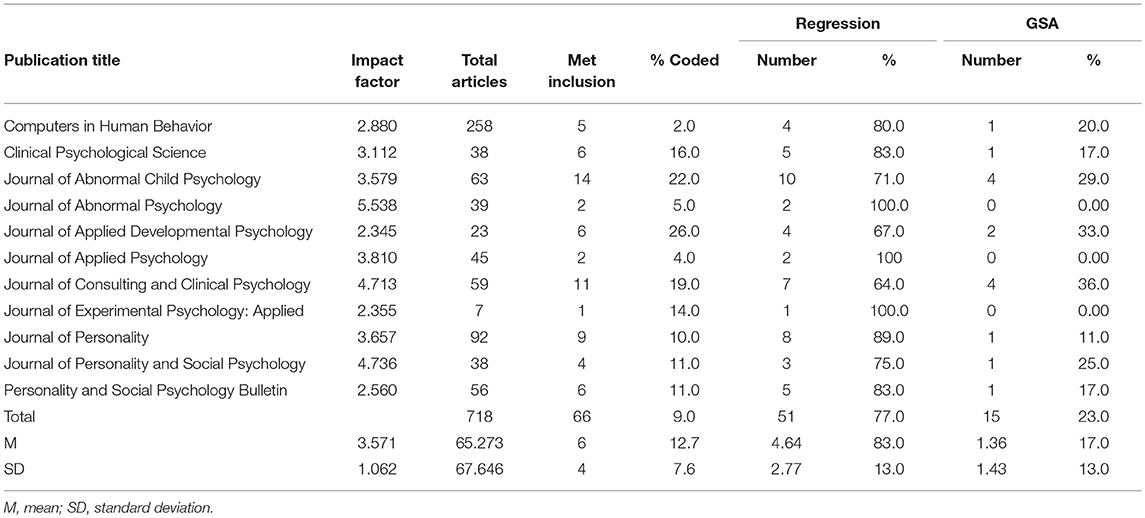
Table 1. Literature review summary.
Prevalence of the Regression Based vs. GSA-Based Models
Our primary hypothesis related to the prevalence of regression based models using continuous predictors of change, and the use of regression based models relative to the use of GSA-based models. With 66 out of 718 articles employing a pretest-posttest design with a continuous predictor of change, we can safely say that these models are not rare in psychology. There was a higher prevalence of the regression based models, relative to the use of GSA-based models, in the articles examined. Of the coded articles, 77% used a regression based model (n = 51), and 23% used a GSA-based model (n = 15). A chi-square goodness-of-fit test confirmed that the proportion of regression based models was significantly greater than the proportion of GSA-based models, χ2 (1, N = 66) = 19.64, p < 0.001, V = 0.55. A Cramer's V statistic of 0.55, which can be interpreted in the same manner as a correlation coefficient, can be considered large.
Strength of the Correlations
The second research question of this study was whether the correlation between the pretest score and the continuous predictor would be meaningful. Out of the 66 articles which met our inclusion criteria, approximately one-third (n = 27) reported a correlation between the pretest score and the continuous predictor. To analyze these correlations, we first converted them into absolute values. The correlations ranged from 0.01 to 0.71, with a median of 0.28. Forty-four percent (n = 12) of the correlations were >0.30, the cutoff for a moderate size correlation [27]. An independent samples t-test confirmed that the mean correlation (M = 0.28, SD = 0.20) was >0, t(26) = 7.42, p < 0.001, d = 1.4. Thus, the hypothesis that the correlation between pretest score and the continuous predictor would be greater than zero was supported.
Discussion
The literature review revealed that the use of regression based pretest-posttest models with continuous predictors of change was not rare and occurred more often than the use of gain score based models. In addition, it was found that the correlation between the continuous predictor and the pretest score was in many cases meaningful. Study One was designed to determine whether the artifact uncovered by Eriksson and Häggström [5] in a numerical cognition study [24] was an isolated incident in the psychology literature. Our findings indicate that the conditions necessary for observing the regression artifact are quite common in articles published in high-impact psychology journals; across varying disciplines within psychology, there was a clear preference toward the use of the problematic regression based model. Together, the evidence indicating that regression based models of change with continuous predictors are common, and that the correlations among the continuous predictors and the pretest scores are non-negligible, signifies that we should be extremely concerned about the impact of the regression artifact on the psychological literature.
Some limitations of the first study are noteworthy. First, the study was limited to top-tier academic publications in the field of psychology. It is possible that different findings may occur in lower-tiered journals; however, it is our belief that fewer problematic analytical situations would be encountered in top-tier journals. Second, over two-thirds of the studies examined did not include the correlation between the pretest score and the continuous predictor. Thus, although the correlations from the studies that did report values were consistently >0.3, the findings would have been more robust if more studies had reported the correlation between the pretest score and the continuous predictor variable.
Study Two
The second study was conducted to demonstrate the magnitude of the regression artifact in regression models which include a pretest score as a covariate and a continuous predictor across a wide range of conditions present in psychological research. More specifically, we wanted to quantify the magnitude of the artifact and the likelihood of Type I errors when continuous predictors of change were investigated in pre-post designs. A Monte Carlo simulation study was conducted which manipulated the sample size and the magnitude of the correlation between the pretest and continuous variable. It is important to note that the results of the simulation study are highly predictable given the quantification of the artifact above and the conditions investigated. Nevertheless, the quantification of the results in terms of Type I error rates helps to highlight the magnitude of the issue for researchers in psychology.
Methods
The open-source statistical software R [26] was used to run the simulation study. The regression model for exploring the effect of a continuous predictor on a posttest score, controlling for the pretest score, can be written as:
where posti and prei represent the posttest and pretest scores of participant i, respectively, Xi represents the continuous predictor of change for participant i, b0 represents the intercept, b1 represents the effect of the pretest on the posttest when X = 0, b2 represents the effect of the continuous predictor X on the posttest when pretest = 0, and ei represents the individual level residual. Both posti and prei contain a measure of true ability (U) and error:
In addition to error, the model for ability (U) includes: (1) the intercept (b0); (2) bX, the slope or strength of the relationship between the continuous predictor (X) and U; and (3) values of the continuous predictor (X). In other words:
Note that no change from pretest to posttest is modeled so the effect of X on posttest, controlling for pretest, is null.
Selection of Manipulated Variables
Recall that the artifact was expressed by Eriksson and Häggström [5] as: .
In our study, b is represented by bX, s2 is the variance of ε3i, and σ2 is the variance of ε1i and ε2i. Both s and σ were fixed to 1, b0 was set to 0, and the standard deviation of X was set to 1. bX was manipulated to range from −1 to 1 in 0.5 increments. In addition, sample size was also manipulated. Sample sizes were set at N = 20, 50, 100, or 1,000. Five thousand simulations were conducted for each condition, with the statistical significance level for all simulations set at α = 0.05
Results
The magnitude of the artifact, as a function of sample size and the strength of the relationship between the pretest and continuous predictor, is presented in Table 2. The simulation study confirmed that the regression artifact, which arises as a result of the correlation between the continuous predictor and pretest scores, is a factor in conditions common within psychological research. The bX coefficient ranged from −1 to +1 and directly influenced the correlation coefficient between the pretest score and the continuous predictor (X). As hypothesized, the size of the artifact increased as the strength of the bX coefficient increased. For example, when bX = 0 there was no artifact (i.e., = 0), however when bX = 1 there was a noticeable relationship between X and posttest, controlling for pretest (i.e., the statistical artifact was present). Type I error rates increased in relation to the increasing b coefficient and were most pronounced in larger sample sizes (where there was sufficient power to detect the artifact). For instance, with a sample size of 1,000 and bx set to 0, Type I error rates were 0.049—well within the liberal margins of acceptable Type I error rates of 0.025 to 0.075 [28]. However, when b ≠ 0, Type I error rates increased to 1 (i.e., 100%). In contrast, when we conducted the simulation using the gain score model, across all sample sizes and values for bX, the Type I error rates were approximately 0.05.
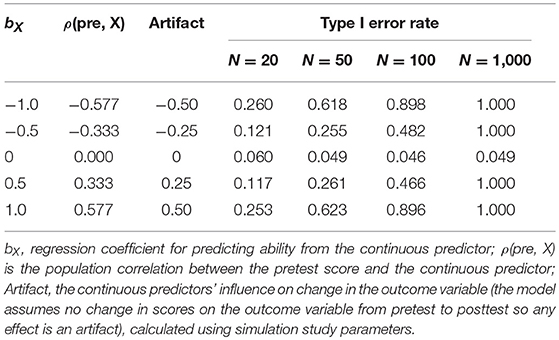
Table 2. Type I error rates for assessing the relationship between a continuous predictor and posttest, controlling for pretest.
To relate these findings to the literature review, the R script was modified to reflect the median sample size of 239. When the b coefficient was set to 0.40, the correlation between the pretest and continuous predictor was r = 0.27 over 5,000 simulations, similar to the correlations reported in the literature review (M = 0.28). The resulting regression artifact was 0.20 (half of b), and Type I error rates were 0.68. This implies that for the average conditions found in the literature review, researchers may falsely reject the null hypothesis in 68% of cases with similar sample sizes and correlation strengths, which is obviously well above allowable Type I error rates.
Discussion
The regression artifact is a product of the relation between the continuous predictor and the pretest score, as well as random error in pretest and posttest scores. The simulation demonstrated that the artifact arises with varying levels of the correlation between the continuous predictor and the pretest score, and substantially increases the likelihood of a Type I error. The simulation study indicates the artifact may arise in regression analyses under conditions commonly applied within psychology literature, and may result in researchers incorrectly concluding that there is a relationship between a continuous predictor and posttest scores, controlling for pretest scores.
Conclusions
Previous discussions of Lord's paradox have focused on the statistical issues that may arise in pretest-posttest designs which include categorical predictors. The present research explored how the same problem is present when the predictor variable is continuous. A regression model may conclude that a continuous predictor relates to the amount of change in a variable of interest, when in fact this may only be due to a relationship between the pretest scores and the continuous predictor.
To summarize, our study showed that the conditions necessary for observing the regression artifact outlined by Eriksson and Häggström [5] are common in psychological research and we quantified the magnitude of the artifact and the potential for Type I errors across conditions common in psychological research. When baseline scores are correlated with scores on the predictors of change, regardless of whether the predictor is continuous or categorical, it is important that researchers adopt a gain score model to eliminate the chance that the relationship between the predictor and the amount of change is affected by the correlation between pretest scores and the continuous predictor.
Author Contributions
LF: literature search, simulation study, manuscript writing; CA-C: supervision, manuscript writing and editing, coding; RC: conceptual development, coding, supervision, manuscript writing and editing.
Conflict of Interest Statement
The authors declare that the research was conducted in the absence of any commercial or financial relationships that could be construed as a potential conflict of interest.
References
1. van Breukelen GJ. ANCOVA versus change from baseline: more power in randomized studies, more bias in nonrandomized studies. J Clin Epidemiol. (2006) 59:920–5. doi: 10.1016/j.jclinepi.2006.02.007
2. van Breukelen GJ. ANCOVA versus CHANGE from baseline in nonrandomized studies: the difference. Multivariate Behav Res. (2013) 48:895–922. doi: 10.1080/00273171.2013.831743
3. Wright DB. Comparing groups in a before-after design: when t test and ANCOVA produce different results. Br J Educ Psychol. (2006) 76:663–75. doi: 10.1348/000709905X52210
4. Campbell DT, Kenny DA. A Primer on Regression Artifacts (1999). New York, NY: The Guildford Press.
5. Eriksson K, Häggström O. Lord's paradox in a continuous setting and a regression artifact in numerical cognition research. PLoS ONE (2014) 9:e95949. doi: 10.1371/journal.pone.0095949
6. Nielsen T, Karpatschof B, Kreiner S. Regression to the mean effect: when to be concerned and how to correct for it. Nordic Psychol. (2007) 59:231–50. doi: 10.1027/1901-2276.59.3.231
7. Wainer H. Adjusting for differential base rates: Lord's paradox again. Psychol Bull. (1991) 109:147–51.
9. Torgerson CJ. Randomised controlled trials in education research: a case study of an individually randomised pragmatic trial. Education 3–13 (2009) 37:313–21. doi: 10.1080/03004270903099918
10. Vickers AJ, Altman DG. Analysing controlled trials with baseline and follow up measurements. Br. Med. J. (2001) 323:1123–4. doi: 10.1136/bmj.323.7321.1123
11. Lord FM. A paradox in the interpretation of group comparisons. Psychol Bull. (1967) 68:304–5. doi: 10.1037/h0025105
12. Hand DJ. Deconstructing statistical questions. J R Stat Soc. (1994) 157:317–56. doi: 10.2307/2983526
13. Wainer H, Brown LM. Two statistical paradoxes in the interpretation of group differences: Illustrated with medical school admission and licensing data. Am Stat. (2004) 58:117–23. doi: 10.1198/0003130043268
14. Oakes MJ, Feldman HA. Statistical power for nonequivalent pretest-posttest designs: the impact of change-score versus ANCOVA models. Eval Rev. (2001) 25:3–28. doi: 10.1177/0193841X0102500101
15. Werts CE, Linn RL. Problems with inferring treatment effects from repeated measures. Educ Psychol Measure. (1971) 31:857–66.
16. Lord FM. The measurement of growth. Educ Psychol Measure. (1956) 16:421–37. doi: 10.1177/001316445601600401
17. Cronbach LJ, Furby L. How we should measure “change”: or should we? Psychol. Bull. (1970) 74:68–80.
18. Gottman JM, Rushe RH. The analysis of change: issues, fallacies, and new ideas. J Consult Clin Psychol. (1993) 61:907–10. doi: 10.1037/0022-006X.61.6.907
19. Rogosa D, Brandt D, Zimowski M. A growth curve approach to the measurement of change. Psychol Bull. (1982) 92:726–48. doi: 10.1037/0033-2909.92.3.726
20. Rogosa DW, Willett JB. Demonstrating the reliability of the difference score in the measurement of change. J Educ Measure. (1983) 20:335–43. doi: 10.1111/j.1745-3984.1983.tb00211.x
21. Castro-Schilo L, Grimm KJ. Using residualized change versus difference scores for longitudinal research. J Soc Pers Relations. (2018) 35:32–58. doi: 10.1177/0265407517718387
22. Gollwitzer M, Christ O, Lemmer G. Individual differences make a difference: On the use and the psychometric properties of difference scores in social psychology. Eur J Soc Psychol. (2014) 44:673–682. doi: 10.1002/ejsp.2042
23. Pike GR. Lord's paradox and the assessment of change during college. J College Stud Dev. (2004) 45:348–53. doi: 10.1353/csd.2004.0040
24. Booth JL, Sigler RS. Numerical magnitude representations influence arithmetic learning. Child Dev. (2008) 79:1016–31. doi: 10.1111/j.1467-8624.2008.01173.x
25. Crocker J, Canevello A, Breines JG, Flynn H. Interpersonal goals and change in anxiety and dysphoria in first-semester college students. J Personal Soc Psychol. (2010) 98:1009–24. doi: 10.1037/a0019400
26. R Core Team,. R: A Language Environment for Statistical Computing [Computer software]. Vienna. (2017). Available online at: http://www.R-project.org/
Keywords: regression artifacts, Lord's paradox, continuous predictors, change analysis, pre-post, pre-post analysis
Citation: Farmus L, Arpin-Cribbie CA and Cribbie RA (2019) Continuous Predictors of Pretest-Posttest Change: Highlighting the Impact of the Regression Artifact. Front. Appl. Math. Stat. 4:64. doi: 10.3389/fams.2018.00064
Received: 16 April 2018; Accepted: 10 December 2018;
Published: 04 January 2019.
Edited by:
Holmes Finch, Ball State University, United StatesReviewed by:
Donald Sharpe, University of Regina, CanadaJocelyn Holden Bolin, Ball State University, United States
Copyright © 2019 Farmus, Arpin-Cribbie and Cribbie. This is an open-access article distributed under the terms of the Creative Commons Attribution License (CC BY). The use, distribution or reproduction in other forums is permitted, provided the original author(s) and the copyright owner(s) are credited and that the original publication in this journal is cited, in accordance with accepted academic practice. No use, distribution or reproduction is permitted which does not comply with these terms.
*Correspondence: Robert A. Cribbie, Y3JpYmJpZUB5b3JrdS5jYQ==